Assessment of CMIP6 Model Performance for Wind Speed in China
 Lijun Zhao1,2*†
  Shuanglong Jin1,2*†
  Xiaolin Liu1,2 Bo Wang1,2 Zongpeng Song1,2 Ju Hu1,2
  Yuyang Guo1,2
- 1State Key Laboratory of Operation and Control of Renewable Energy and Storage Systems, China Electric Power Research Institute Co., Ltd., Beijing, China
- 2Electric Power Meteorology State Grid Corporation Joint Laboratory, Beijing, China
As the major renewable energy, wind can greatly reduce carbon emissions. Following the “carbon neutral” strategy, wind power could help to achieve the realization of energy transformation and green development. Based on ERA5 reanalysis data and the multi-ensemble historical and scenario simulations of the Coupled Model Intercomparison Project Phase 6 (CMIP6), a variety of statistical analyses are used to evaluate the performance of CMIP6 simulating the wind speed in China. The conclusions are as follows: spatial patterns of the nine CMIP6 models are similar with ERA5, but BCC-CSM2-MR and MRI-ESM2-0 highly overestimate the wind speed in northwest China. CESM2-WACCM, NorESM2-MM, and HadGEM3-GC31-MM behave better than the other six CMIP6 models in four specific regions are chosen for detailed study. CESM2-WACCM, NorESM2-MM, and HadGEM3-GC31-MM tend to simulate a larger wind speed than ERA5 except the yearly averaged wind speed in region II and region IV. CESM2-WACCM and NorESM2-MM simulate a large monthly mean wind speed, but the value is relatively close with ERA5 in the summer. HadGEM3-GC31-MM overestimates wind speed in region I and region II from April to October, but gets closer with ERA during winter. CESM2-WACCM, NorESM2-MM, and HadGEM3-GC31-MM simulate an increasing trend in Tibetan Plateau and Xinjiang in the next 100 years, while NorESM2-MM projects rising wind speed in the eastern part of Inner Mongolia, and HadGEM3-GC31-MM simulates increasing wind speed in the northeast and central China. The future wind speed in three models is projected to decline in region I, and the value of HadGEM3-GC31-MM is much larger. In region II, wind speed simulated by three models is projected to decrease, but the wind speed from HadGEM3-GC31-MM in region III and modeled wind speed in region IV from NorESM2-MM would climb with the slope equal to 0.0001 and 0.0012, respectively. This study indicates that the CMIP6 models have certain limitations to perform realistic wind changes, but CMIP6 could provide available reference for the projection of wind in specific areas.
Introduction
Renewable energy, energy efficiency, and electrification are three drivers of deep de-carbonization, and developing renewable energy is an important measure for global climate governance and achieving the goal of carbon neutrality. It is estimated that by 2050, the proportion of renewable energy supply will exceed 50% (IRENA, 2018). As one of the primary carbon-free resources, wind energy meets the electricity demand dramatically. However, a significant decreasing trend of wind speed is reported in numerous studies. Near-surface wind speed over the globe is dropping at 5–15% since 1960, which is called as global stilling (Pryor et al., 2009). The global average wind speed trend is −0.014 m/s/a, while the wind speed over the low- to middle-latitude areas is declining and the wind speed of high-latitude areas is rising (McVicar et al., 2012). There was a decreasing wind speed trend with −0.005 m/s/a in the USA (Hobbins, 2004). The declining wind speed trend across the Australia has reached 0.009 m/s/a since 2006 (McVicar et al., 2008). A significant declining wind speed of −0.017 m/s/a is showed in western Canada (Tuller, 2004; Wan et al., 2010). The downward change of wind speed in Italy is −0.013 m/s/a, while the falling trend is −0.026 m/s/a before 1975 and decreased to −0.002 m/s/s after 1975 (Pirazzoli and Tomasin, 2003).
As one of the countries with abundant wind resource, China has a large amount of wind power capacities and plays a dominant role in developing renewable energy. The annual mean wind speed in China is 4.09 m/s, while the wind power density is 164.1 W/m2. Northeast China is the most potential area with an annual mean wind speed 4.64 m/s while the wind power density is 204 W/m2, and coastal areas in east China have wind power density larger than 500 W/m2 (Liu et al., 2019). The annual mean wind speed and maximum wind speed in China were decreasing since 1956 (Jiang et al., 2013), and reanalysis datasets and station observational data showed the near-surface wind speed had been decreasing by −0.109 m/s per decade from 1958 to 2015 (Zhang et al., 2019). In the catchment of Yangtze River, the downward trend of wind speed was −0.008 m/s/a between 1960 and 2000 (Xu et al., 2006). The near-surface wind speed in the Loess Plateau of China had declined by −0.01 m/s/a (McVicar et al., 2005). Previous researches have been done to evaluate the possible factors related with the surface wind speed decrease in China. The land-use and cover change over the Eastern China Plain could lead a 0.17-m/s wind speed decrease every decade in China. The primary cause is the pressure-gradient force, and the surface drag force also has a significant effect on the declining wind speed (Wu et al., 2017). The weakening of the East Asian monsoons mainly causes the decreasing average and maximum wind speed, and the relatively less land-falling typhoons and cold waves lead to the reduced maximum wind speed in southeast coastal China (Jiang et al., 2013).
As for now, the climate models cannot well-quantify the effect from climate change (IPCC, 2007). The World Climate Research Program's (WCRP) Coupled Model Intercomparison Project (CMIP) has been operated since 1990s, aiming to understand the past, the present, and the future of climate. The new Coupled Model Intercomparison Project Phase 6 (CMIP6) is designed to better estimate the climate (Eyring et al., 2016). To better know the future of wind energy, the simulations of updated climate models could be helpful to predict the change of wind speed.
Data and Methodology
ERA5
ERA5 is a fifth-generation European Centre for Medium-Range Weather Forecasts (ECMWF) atmospheric reanalysis of the global climate and is doing well in depicting the atmospheric circulation. ERA5 is produced by 4D-Var data assimilation in CY41R2 of the Integrated Forecasting System (IFS), providing global atmospheric, land-surface, and sea-state parameters. The dataset is on regular latitude–longitude grids at 0.25° × 0.25° resolution with 37 pressure levels vertically and covers the period from 1950 to the present. In this study, the near-surface wind speed from 1986 to 2014 over China is used to evaluate the CMIP6 models. Since the north China is abundant with wind resources, four specific regions from I to IV shown in Figure 1 are chosen for further study: region I (80°~90°E, 37°~42°N), region II (92°~100°E, 35°~40°N), region III (101°~117.5°E, 37°~41.5°N), and region IV (120°~130°E, 43°~49°N).
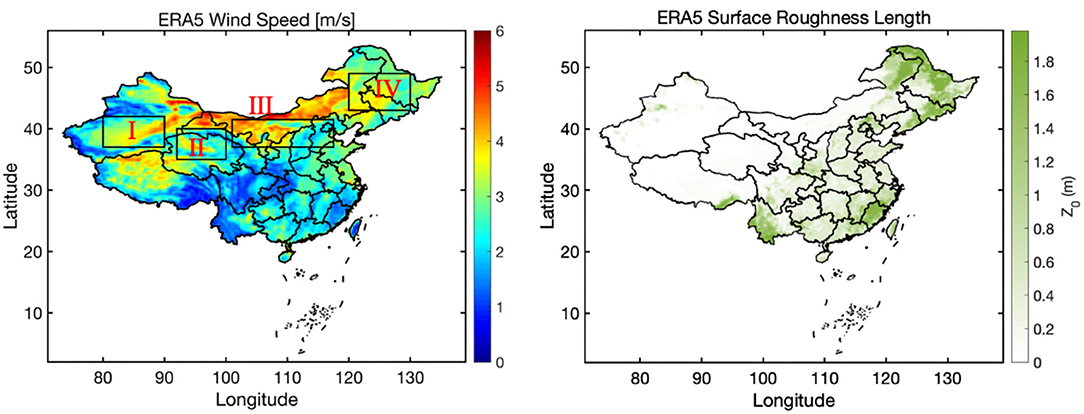
Figure 1. The spatial distribution of multi-year (1986–2014) mean 10-m wind speed (left) and surface roughness length (right) over China. The four specific regions are shown as black rectangles.
CMIP6
CMIP6 historical simulations take the natural causes and human factors into consideration and reproduce the historical variability of climate from 1850 to 2014. The historical simulations could be used for assessing model performance in climate and weather (Eyring et al., 2016). Moreover, the Scenario Model Intercomparison Project (ScenarioMIP) could provide a new set of emissions and land-use scenarios, which, along with the Shared Socioeconomic Pathways (SSPs), allows twenty-first century projections to be assessed from the new future forcing experiments. SSP585 used in our study is the updated scenario of RCP8.5 using the rapid fossil energy evolution with SSP5 following the high greenhouse emissions (O'Neill et al., 2014, 2017). Multi-ensembles are averaged to maintain the quality of evaluation, and the group of nine newest CMIP6 global climate models from China, USA, UK, Japan, Norway, and South Korea is used in this study. Model name, modeling centers, and resolution of models are described in Table 1.
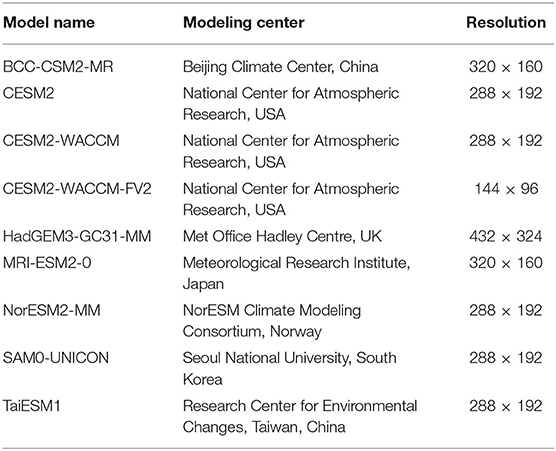
Table 1. CMIP6 models used in this study.
Methodology
Based on the different latitude-longitude grids between CMIP6 and ERA5, the ERA5 is interpolated to the grid of corresponding CMIP6 models before comparison. The metrics of bias, spatial correlation coefficient (R), and root mean square error (RMSE) are used to evaluate the models' performance, and the equations of calculating are shown in following. Wm is the wind speed of CMIP6, WE represents the ERA5 wind speed, and i is the pixel where CMIP6 and ERA5 coincide.
Results
Spatial Pattern of ERA5
Figure 1 shows the spatial distribution of multi-year mean 10-m wind speed and surface roughness length over China. Larger values of wind speed are shown in north China and Tibetan Plateau, and relatively smaller wind speed is shown in southwest China and southeast China. Comparing with the surface roughness length, the spatial distribution of wind speed is negatively related with the spatial pattern of surface roughness length. Wind speed tends to be smaller while the surface roughness length is larger, which is similar with the finding of a previous study (Vautard et al., 2010).
Spatial Pattern of CMIP6 Models
The multi-year mean 10-m wind speed (1986–2014) of the nine CMIP6 models is shown in Figure 2. Spatial patterns of the nine CMIP6 models are similar with ERA5 shown in Figure 1, but the wind speed in north China is larger and the wind speed in the Sichuan Basin is much smaller. However, the values of wind speed in north China and northeast China are highly overestimated by BCC-CSM2-MR and MRI-ESM2-0, and the maximum of simulated wind speed tends to be over 8.78 m/s, which is far higher than ERA5.
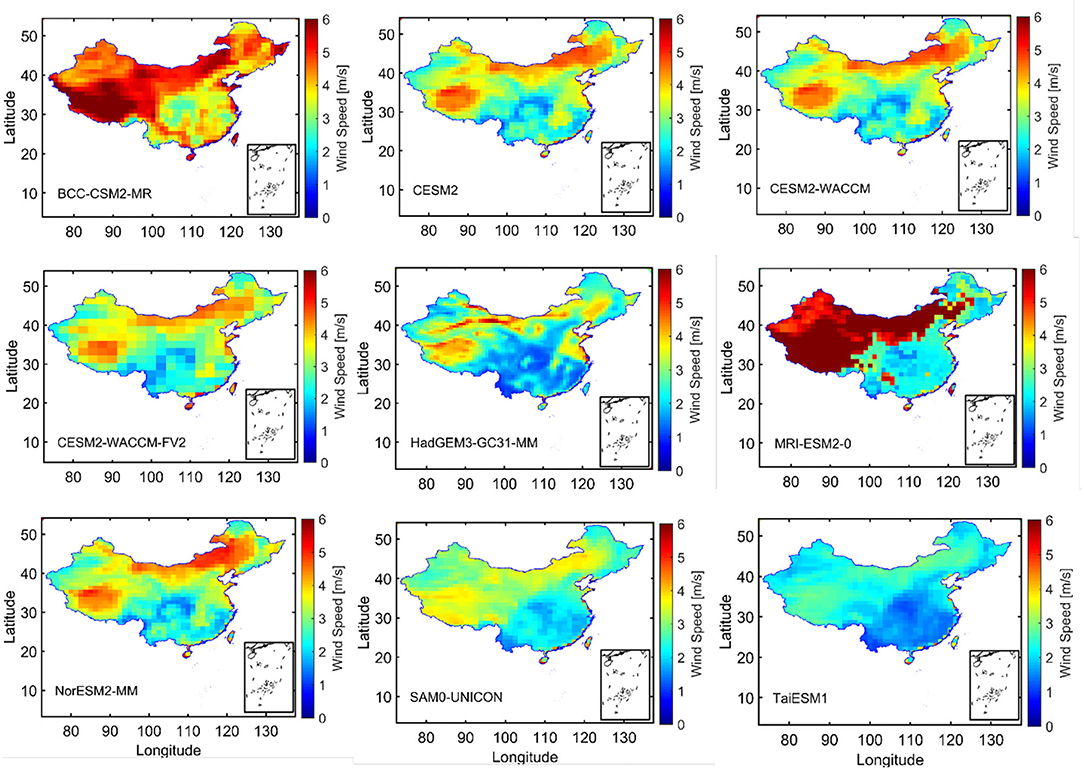
Figure 2. Spatial distribution of mean 10-m wind speed (1986–2014) in CMIP6 historical simulations.
Metrics of Spatial Distributions
The metrics of comparison are shown in Figure 3; higher R and lower RMSE represent that the corresponding model has better consistency with ERA5. CESM2-WACCM, HadGEM3-GC31-MM, and NorESM2-MM behave better than the other six CMIP6 models; the RMSE ranges from 0.48 to 2.41, and the R is between 0.52 and 0.90. From the results above, the spatial difference between BCC-CSM2-MR and MRI-ESM2-0 is much larger, and in Figure 3, the RMSE of these two models over the four regions is still large and the R tends to be negative, which means that in either the whole country or the specific regions, the simulation of wind speed of BCC-CSM2-MR and MRI-ESM2-0 tends to result in large bias and uncertainty. Based on the performance of these three CMIP6 models, the temporal variability of wind speed over the four specific regions is also analyzed for further study.
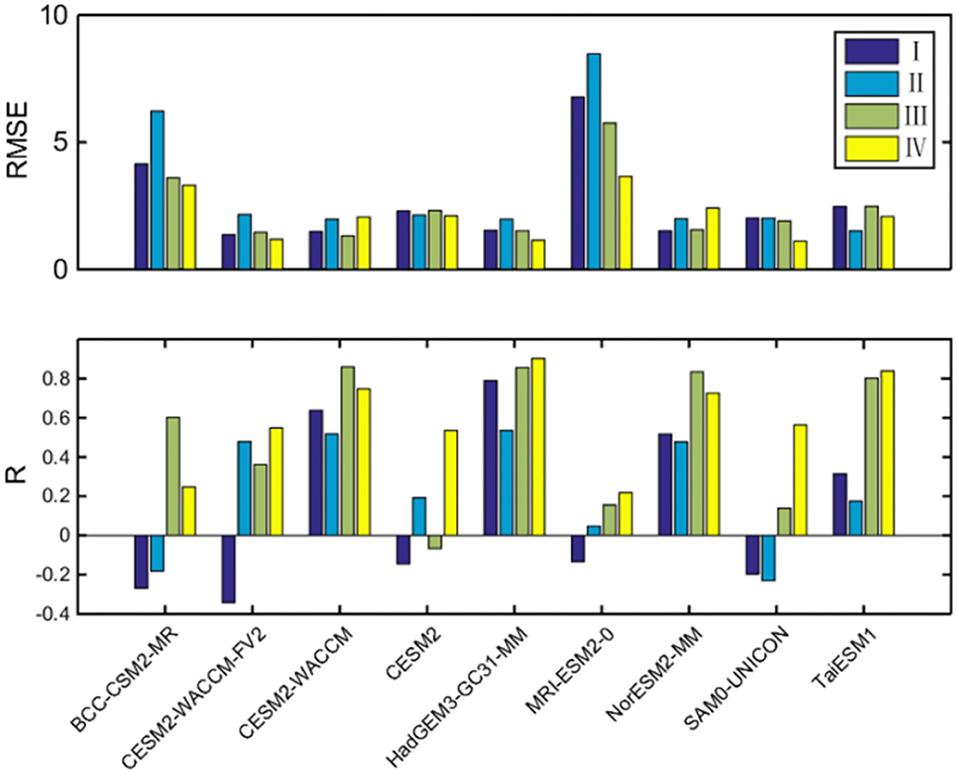
Figure 3. The bar plots of metrics root mean square error (RMSE) and spatial correlation coefficient (R). Four different colors represent the four specific regions.
Temporal Variability of the Four Regions
To quantitatively measure the performances of three CMIP6 models, the temporal correlation coefficients of near-surface wind speeds during 1979 to 2014 over the four regions between ERA5 and three CMIP6 models are shown in Table 2. The temporal correlation coefficients in region I are higher than the other regions, and the CESM2-WACCM and HadGEM3-GC31-MM are 0.84 and 0.86 with p < 0.05, respectively, which indicate the better correlation with the ERA5 in region I. In the other three regions, HadGEM3-GC31-MM simulates the wind speed in region II better and CESM2-WACCM does relatively better in region III and region IV.
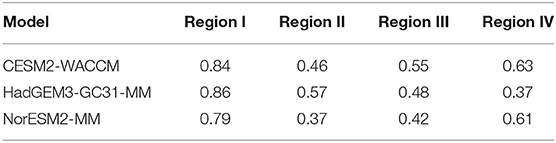
Table 2. The temporal correlation coefficients of near-surface wind speeds during 1979 to 2014 over the four regions between ERA5 and three CMIP6 historical simulations.
Figures 4A–D shows the yearly mean 10-m wind speed of CMIP6 and ERA5 over the four specific regions (black line represents ERA5, and the blue, red, and green lines represent the CESM2-WACCM, NorESM2-MM, and HadGEM3-GC31-MM, respectively). In region I and region II, three CMIP6 models overestimate the wind speed largely, and in region III and region IV, comparing with ERA5, the wind speed of HadGEM3-GC31-MM is underestimated, while the wind speed simulated by NorESM2-MM and HadGEM3-GC31-MM are much larger.

Figure 4. Yearly mean 10-m wind speed (1986–2014) of CMIP6 and ERA5 (black line represents ERA5, and the blue, red, and green lines represent CESM2-WACCM, NorESM2-MM, and HadGEM3-GC31-MM, respectively). (A–D) Region I, region II, region III, and region IV, respectively.
Figure 5 shows the monthly mean 10-m wind speed of CMIP6 and ERA5 over the four specific regions (the black line represents ERA5, and the blue, red, and green lines represent the CESM2-WACCM, NorESM2-MM, and HadGEM3-GC31-MM, respectively). In the four regions, the 10-m wind speed of ERA5 gets larger from January and reaches peak at April (region II, region III, and region IV) or May (region I). In region II and region IV, the wind speed tends to increase again after August. The seasonal cycles of near-surface wind speed in HadGEM3-GC31-MM, CESM2-WACCM, and NorESM2-MM are similar with ERA5, but different in the values of monthly mean 10-m wind speed. CESM2-WACCM and NorESM2-MM tend to overestimate the wind speed from January to May and October to December, and the value is closer with ERA5 between June and September. For HadGEM3-GC31-MM, the simulated wind speed could be closer or smaller than ERA5 from January to May and October to December, and the wind speed tends to be overestimated from June to September.
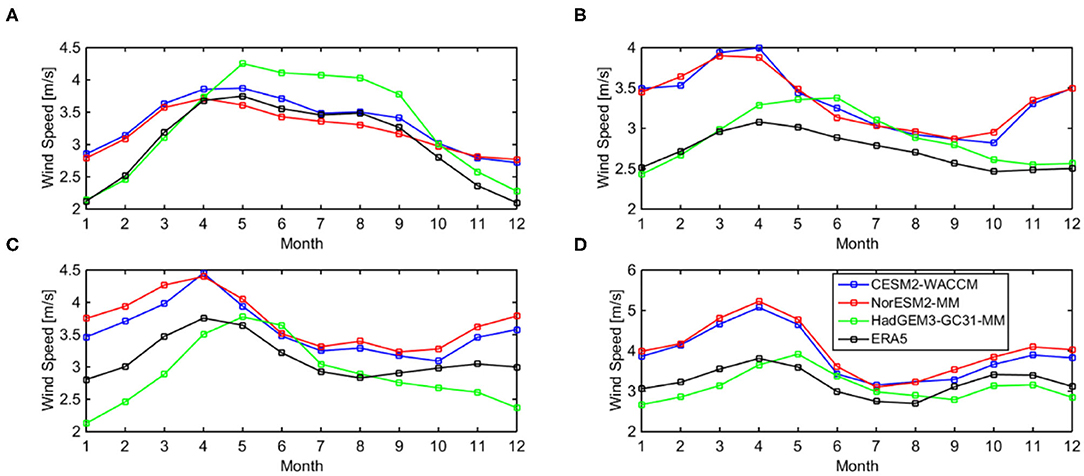
Figure 5. Monthly mean 10-m wind speed (1986–2014) in CMIP6 and ERA5 (black line represents ERA5, and the blue, red, and green lines are the CESM2-WACCM, NorESM2-MM, and HadGEM3-GC31-MM, respectively). (A–D) Region I, region II, region III, and region IV, respectively.
Future Spatial and Temporal Variability of the Four Specific Regions
The spatial bias between the historical and ssp585 simulations from CESM2-WACCM, NorESM2-MM, and HadGEM3-GC31-MM in China is shown in Figure 6. The wind speed projected by the three models shows an upward trend of wind speed in western China in the future, especially over the Tibetan Plateau and Xinjiang. From the simulation of NorESM2-MM, the wind speed in the eastern part of Inner Mongolia tends to increase in the next 100 years. Different with CESM2-WACCM and NorESM2-MM, the wind speed simulated by the HadGEM3-GC31-MM tends to slightly increase over a relatively wider range in China.
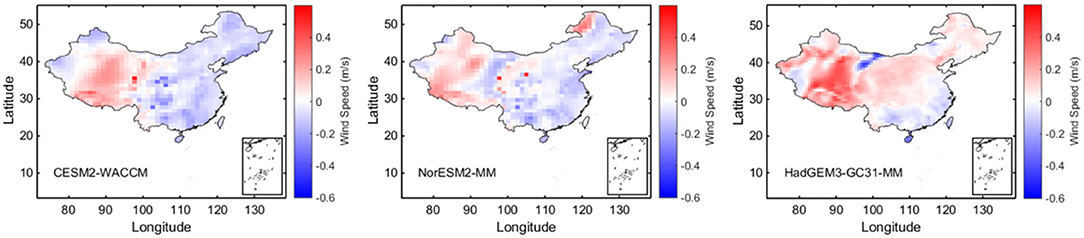
Figure 6. The spatial distribution of wind speed bias (ssp5-8.5 minus historical) from CESM2-WACCM, NorESM2-MM, and HadGEM3-GC31-MM.
The wind speed of ssp585 simulation in the four specific regions from CESM2-WACCM, NorESM2-MM, and HadGEM3-GC31-MM is shown in Figure 7. In region I, the linear regression shows that all three CMIP6 models show a downward trend in the future 100 years, especially during the 2050 to 2083, there is an obvious jump of wind speed. The wind speed of HadGEM3-GC31-MM in region I is much higher than the other two models, which is distinct comparing with the other three regions. Different with region I, the simulated wind speed of HadGEM3-GC31-MM falls behind CESM2-WACCM and NorESM2-MM in the other three regions. In region II, the linear regression shows that the wind speed simulated by the three models is projected to decrease with the slope of −0.004, −0.003, and −0.001, respectively. HadGEM3-GC31-MM simulates a slight climb of wind speed in region III, which is distinct from the other two models, CESM2-WACCM and NorESM2-MM represent a similar fluctuation from 2015 to 2050 while the HadGEM3-GC31-MM shows an adverse change. NorESM2-MM simulates a relatively strong increasing trend of wind speed with the slope of 0.0012 in region IV, which is totally different from HadGEM3-GC31-MM and CESM2-WACCM.
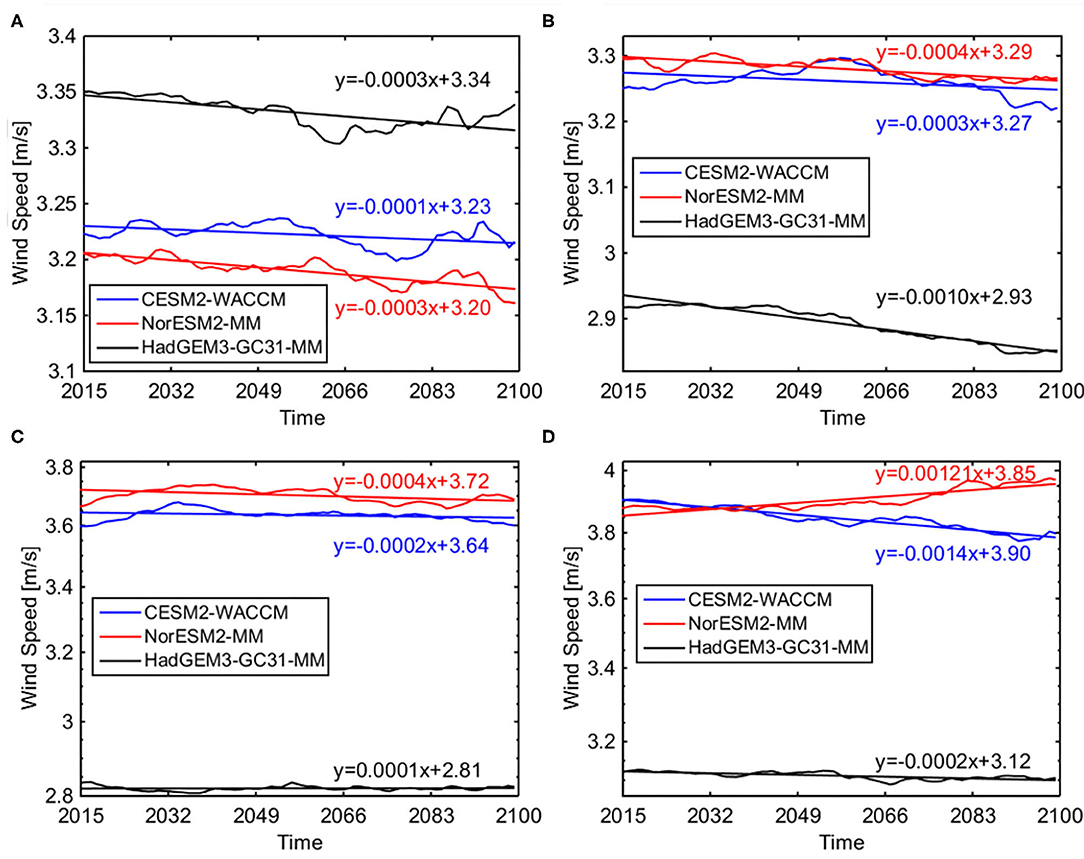
Figure 7. The wind speed of ssp585 simulation in the four specific regions from CESM2-WACCM, NorESM2-MM, and HadGEM3-GC31-MM. (A–D) Region I, region II, region III, and region IV, respectively.
Discussion
This study uses the ERA5 reanalysis data to evaluate the near-surface wind speed of nine global climate models in China. Spatial patterns of the nine CMIP6 models are similar with ERA5, but BCC-CSM2-MR and MRI-ESM2-0 highly overestimate the wind speed in northwest China. Focusing on four specific regions in China, nine CMIP6 models are assessed by using correlation coefficient R and RMSE, and CESM2-WACCM, NorESM2-MM, and HadGEM3-GC31-MM behave better than the other six CMIP6 models, which are chosen for further study. Except the yearly averaged wind speed in region II and region IV underestimated by HadGEM3-GC31-MM, three CMIP6 models tend to simulate a larger wind speed. As for the monthly change, CESM2-WACCM and NorESM2-MM simulate a large wind speed, and the value is relatively close with ERA5 in the summer. HadGEM3-GC31-MM overestimates wind speed in region I and region II from April to October, but gets closer with ERA5 during winter.
In the future, CESM2-WACCM, NorESM2-MM, and HadGEM3-GC31-MM simulate an increasing trend in the Tibetan Plateau and Xinjiang, while NorESM2-MM projects rising wind speed in the eastern part of Inner Mongolia and HadGEM3-GC31-MM simulates increasing wind speed in the northeast and central China. In region I, the future wind speed in the three models is projected to decline and the value of HadGEM3-GC31-MM is much larger. Except region I, the wind speed simulated by HadGEM3-GC31-MM is the lowest. In region II, wind speed modeled by the three models is projected to decrease, but the wind speed from HadGEM3-GC31-MM in region III and modeled wind speed in region IV from NorESM2-MM would climb with the slope equal to 0.0001 and 0.0012, respectively.
Data Availability Statement
The CMIP6 data used in this study are archived on the website https://esgf-node.llnl.gov/projects/cmip6/ and ERA5 data can be downloaded from the website https://www.ecmwf.int/en/forecasts/datasets/reanalysis-datasets/era5.
Author Contributions
LZ and SJ contributed in the visualization, methodology, writing original draft preparation. XL and BW contributed in the methodology and writing original draft preparation. ZS, JH, and YG downloaded the datasets. All authors contributed to the article and approved the submitted version.
Funding
The authors declare that this study received funding from Science and Technology Foundation of State Grid Corporation of China (Grant No. 5200-202016243A-0-0-00) and (Grant No. 5200-201955490A-0-0-00). The funder was not involved in the study design, collection, analysis, interpretation of data, the writing of this article, or the decision to submit it for publication.
Conflict of Interest
LZ, SJ, XL, BW, ZS, JH, and YG were employed by the China Electric Power Research Institute Co., Ltd.
Publisher's Note
All claims expressed in this article are solely those of the authors and do not necessarily represent those of their affiliated organizations, or those of the publisher, the editors and the reviewers. Any product that may be evaluated in this article, or claim that may be made by its manufacturer, is not guaranteed or endorsed by the publisher.
References
Eyring, V., Bony, S., Meehl, G., Senior, C., Stevens, B., Ronald, S., et al. (2016). Overview of the coupled model intercomparison project phase 6 (CMIP6) experimental design and organization. Geosci. Model Dev. 9, 1937–1958. doi: 10.5194/gmd-9-1937-2016
Hobbins, M. T.. (2004). Regional Evapotranspiration and Pan Evaporation: Complementary Interactions and Long-Term Trends Across the Conterminous United States. [Ph.D. thesis]. Colorado State University.
IPCC (2007). “Climate Change 2007: Synthesis Report,” in Contribution of Working Groups I, II and III to the Fourth Assessment Report of the Intergovernmental Panel on Climate Change [Core Writing Team, eds R. K, Pachauri and A. Reisinger (Geneva: IPCC). p. 104.
IRENA (2018). Global Energy Transformation: A Roadmap to 2050. International Renewable Energy Agency. Abu Dhabi.
Jiang, Y., Luo, Y., and Zhao, Z. (2013). Maximum wind speed changes over China. Acta Meteorol. Sinica 27, 63–74. doi: 10.1007/s13351-013-0107-x
Liu, F., Sun, F. B., Liu, W. B., Wang, T. T., Wang, H., Wang, X. M., et al. (2019). On wind speed pattern and energy potential in China. Appl. Energy. 236, 867–876. doi: 10.1016/j.apenergy.2018.12.056
McVicar, T. R., Li, L. T., Van Niel, T. G., Hutchinson, M. F., Mu, X. M., and Liu, Z. H. (2005). Spatially Distributing 21 Years of Monthly Hydrometeorological Data in China: Spatio-Temporal Analysis of FAO 56 Crop Reference Evapotranspiration and Pan Evaporation in the Context of Climate Change. CSIRO Land and Water Technical Report 8/05, Canberra 316.
McVicar, T. R., Roderick, M. L., Donohue, R. J., Li, L. T., Van, N. T. G., Thomas, A. G. J., et al. (2012). Global review and synthesis of trends in observed terrestrial near-surface wind speeds: implications for evaporation. J. Hydrol. 416–417, 182–205. doi: 10.1016/j.jhydrol.2011.10.024
McVicar, T. R., Van Niel, T. G., Li, L. T., Roderick, M. L., Rayner, D. P., Ricciardulli, L., et al. (2008). Wind speed climatology and trends for Australia, 1975-2006: capturing the stilling phenomenon and comparison with near-surface reanalysis output. Geophys. Res. Lett. 35:L20403. doi: 10.1029/2008GL035627
O'Neill, B. C., Kriegler, E., Ebi, K. L., Kemp-Benedict, E., Riahi, K., Rothman, D. S., et al. (2017). The roads ahead: narratives for shared socioeconomic pathways describing world futures in the 21st century. Global Environ. Change 42, 169–180. doi: 10.1016/j.gloenvcha.2015.01.004
O'Neill, B. C., Kriegler, E., Riahi, K., Ebi, K. L., Hallegatte, S., Carter, T. R., et al. (2014). A new scenario framework for climate change research: the concept of shared socioeconomic pathways. Climatic Change 122, 387–400. doi: 10.1007/s10584-013-0905-2
Pirazzoli, P. A., and Tomasin, A. (2003). Recent near-surface wind changes in the central Mediterranean and Adriatic areas. Int. J. Climatol. 23, 963–973. doi: 10.1002/joc.925
Pryor, S. C., Barthelmie, R. J., Young, D. T., Takle, E. S., Arritt, R. W., Flory, D., et al. (2009). Wind speed trends over the contiguous United States. J. Geophys. Res. 114:D14105. doi: 10.1029/2008JD011416
Tuller, S. E.. (2004). Measured wind speed trends on the west coast of Canada. Int. J. Climatol. 24, 1359–1374. doi: 10.1002/joc.1073
Vautard, R., Cattiaux, J., Yiou, P., Thépaut, J., and Ciais, P. (2010). Northern Hemisphere atmospheric stilling partly attributed to an increase in surface roughness. Nat. Geosci. 3, 756–761. doi: 10.1038/ngeo979
Wan, H., Wang, X. L., and Swail, V. R. (2010). Homogenization and trend analysis of canadian near-surface wind speeds. J. Climate 23, 1209–1225. doi: 10.1175/2009JCLI3200.1
Wu, J., Zha, J. L., and Zhao, D. M. (2017). Evaluating the effects of land use and cover change on the decrease of surface wind speed over China in recent 30 years using a statistical downscaling method. Climate Dynamics 48, 131–149. doi: 10.1007/s00382-016-3065-z
Xu, C. Y., Gong, L. B., Tong, J., Chen, D. L., and Singh, V. P. (2006). Analysis of spatial distribution and temporal trend of reference ET in Changjiang catchments. J. Hydrol. 327, 81–93. doi: 10.1016/j.jhydrol.2005.11.029
Keywords: model assessment, carbon neutral, renewable energy, wind, CMIP6
Citation: Zhao L, Jin S, Liu X, Wang B, Song Z, Hu J and Guo Y (2021) Assessment of CMIP6 Model Performance for Wind Speed in China. Front. Clim. 3:735988. doi: 10.3389/fclim.2021.735988
Received: 04 July 2021; Accepted: 02 November 2021;
Published: 08 December 2021.
Edited by:
Yipeng Guo, Nanjing University, ChinaReviewed by:
Zablon W. Shilenje, Charles University, CzechiaGuangwei Li, Northwest Institute of Eco-Environment and Resources, Chinese Academy of Sciences (CAS), China
Copyright © 2021 Zhao, Jin, Liu, Wang, Song, Hu and Guo. This is an open-access article distributed under the terms of the Creative Commons Attribution License (CC BY). The use, distribution or reproduction in other forums is permitted, provided the original author(s) and the copyright owner(s) are credited and that the original publication in this journal is cited, in accordance with accepted academic practice. No use, distribution or reproduction is permitted which does not comply with these terms.
*Correspondence: Lijun Zhao, lijunz_mail@163.com; Shuanglong Jin, ceprijinsl@163.com
†These authors have contributed equally to this work and share first authorship