On-chip mid-infrared silicon-on-insulator waveguide methane sensor using two measurement schemes at 3.291 μm
 Huan Zhao1
  Chuantao Zheng1*
  Mingquan Pi1 Lei Liang2*
  Fang Song1 Yu Zhang1 Yiding Wang1
  Frank K. Tittel3
- 1State Key Laboratory of Integrated Optoelectronics, College of Electronic Science and Engineering, Jilin University, Changchun, China
- 2State Key Laboratory of Luminescence and Applications, Changchun Institute of Optics Fine Mechanics and Physics, Chinese Academy of Sciences, Changchun, China
- 3Department of Electrical and Computer Engineering, Rice University, Houston, TX, United States
Portable or even on-chip detection of methane (CH4) is significant for environmental protection and production safety. However, optical sensing systems are usually based on discrete optical elements, which makes them unsuitable for the occasions with high portability requirement. In this work, we report on-chip silicon-on-insulator (SOI) waveguide CH4 sensors at 3.291 μm based on two measurement schemes including direct absorption spectroscopy (DAS) and wavelength modulation spectroscopy (WMS). In order to suppress noise, Kalman filter was adopted in signal processing. By optimizing the waveguide cross-section structure, an etch depth of 220 nm was selected with an experimentally high power confinement factor (PCF) of 23% and a low loss of only 0.71 dB/cm. A limit of detection (LoD) of 155 parts-per-million (ppm) by DAS and 78 ppm by WMS at an averaging time of 0.2 s were obtained for a 2 cm-long waveguide sensor. Compared to the chalcogenide (ChG) waveguide CH4 sensors at the same wavelength, the reported sensor reveals the minimum waveguide loss and the lowest LoD. Therefore the SOI waveguide sensor has the potential of on-chip gas sensing in the mid-infrared (MIR) waveband.
1 Introduction
Methane (CH4) is regarded as the second most important greenhouse gas after carbon dioxide (CO2), responsible for about 20% of the global warming induced by greenhouse gases emissions (Shindell et al., 2009; Howarth et al., 2011; Kirschke et al., 2013). Due to the exploitation of fossil fuels, such as coal, oil and natural gas, atmospheric CH4 concentration levels are rising in recent years (Zheng et al., 2017). In addition, CH4 is explosive when mixed with 5–15% volume of air, which may become an industrial safety hazard (Leis et al., 2014). Hence, it is necessary to monitor CH4 concentration level effectively for environmental protection and production safety (Berman et al., 2012; Sur et al., 2015; Ye et al., 2016). Compared with the sensing system based on discrete optical elements, on-chip optical waveguide sensors are small in device footprint, which have the potential to integrate light source and detector on a single chip (Dong et al., 2018; Ranacher et al., 2018; Zheng et al., 2018; Pi et al., 2019).
Several approaches based on optical waveguide have been proposed to detect analyte concentration, which can be broadly grouped into two categories: refractive index sensing (El Shamy et al., 2019; Soref et al., 2019) and optical absorption sensing (Ranacher et al., 2016; Qiao et al., 2019). Refractive index sensing is based on measuring the change in the refractive index of the analyte, which would result in the change in frequency or phase of the output light (Zhang et al., 2019). Compared to refractive index sensing, waveguide sensors based on optical absorption spectroscopy are selective since each analyte has unique absorption spectrum. By detecting the light attenuation when the light with specific wavelength passes through the analyte, the concentration of the analyte can be determined (Liu et al., 2016; Khonina et al., 2020). In order to reduce the limit of detection (LoD), according to Lambert-Beer Law, it is necessary to increase the optical path length, that is, the length of interaction between light and analyte. For optical waveguide sensors, analyte acts as cladding of the waveguide and interacts with the evanescent field of the waveguide (Butt et al., 2017; Tombez et al., 2017; Kita et al., 2018; Yoo et al., 2020). Power confinement factor (PCF) indicates the ratio of light power in the analyte cladding layer and a higher PCF means that the light can interact with the analyte sufficiently (Gutierrez-Arroyo et al., 2017). Considering the relatively large transmission loss, waveguide cannot be made very long, so the PCF should be enhanced to increase the equivalent optical path length.
CH4 has stronger absorption in the mid-infrared around 3.3 and 7.6 μm as when compared to the absorption in the near-infrared. Chalcogenide (ChG) glasses are usually used in the MIR due to their low absorption loss (Rao et al., 2015; Zhang et al., 2018). In addition to chalcogenide glasses, silicon-on-insulator (SOI) is also a potential material platform for mid-infrared CH4 sensing, since it is transparent in the absorption waveband of CH4 (3.2–3.45 μm) (Hu et al., 2017; Zou et al., 2018). By optimizing the cross-section structure of SOI waveguide, a higher PCF can be obtained. In this paper, we proposed a high-performance SOI waveguide CH4 sensor based on two measurement schemes, i.e. direct absorption spectroscopy (DAS) and wavelength modulation spectroscopy (WMS). Combined with wavelength modulation spectroscopy (WMS), system noise can be reduced, leading to a decrease of LoD (Liu et al., 2019). At the same time, in order to further suppress the system noise, Kalman filter was adopted. The PCF was experimentally obtained with an accurate calculation method and related formulations as well as equations were derived. CH4 sensing performances were presented and discussed in detail based on the two schemes.
2 Design and fabrication of mid-infrared silicon-on-insulator waveguide
2.1 Waveguide sensor structure and fabrication
The structure of the SOI ridge optical waveguide sensor is shown in Figure 1A. The optical waveguide consists of a central sensing region and a coupling region at both ends of the chip. Since the core diameter of the optical fiber is 7.5 μm, in order to realize the coupling with the optical fiber and reduce mode mismatch, the ridge width of the waveguide at both ends is 15 μm. The length of the tapered transition waveguide is 300 μm. To reduce the footprint of the sensing area, we designed a 1 cm-long straight waveguide and a 2 cm-long bend waveguide, which can be tested on the same chip. The radius of the bend waveguide is 50 μm to reduce bending loss. Figure 1B shows the cross-sectional scanning electron microscope (SEM) image of the fabricated SOI ridge optical waveguide in the sensing area. The SOI waveguide was photolithographed with AZ701 photoresist. After the development, the silicon device layer on the top of the SOI chip was etched by inductively coupled plasmonic (ICP) with CF4 gas. The etching rate is 220 nm/min. The thickness of the Si layer is 500 nm and the etching depth of the waveguide is 220 nm. Due to the limitation of etching process, the waveguide sidewall is not completely steep, so the etching area is trapezoid, in which the upper bottom width is 1.5 μm and the lower bottom width is 1.65 μm.
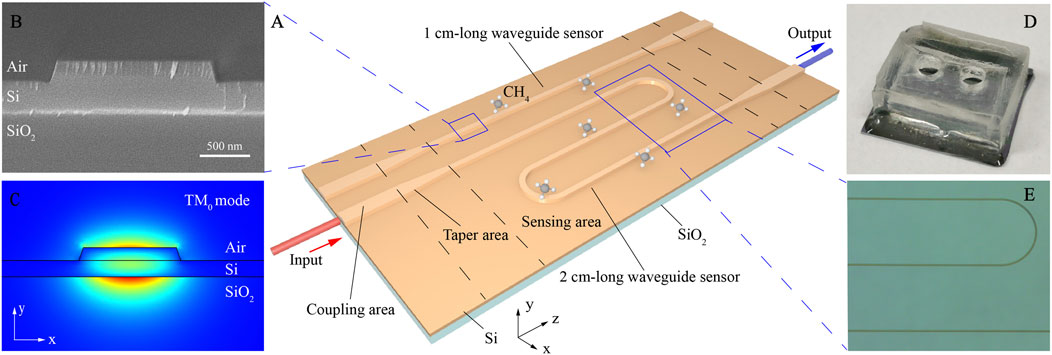
FIGURE 1. (A) Schematic of the SOI ridge optical waveguide sensor chip, which is composed of sensing area, taper area and ridge waveguide at both ends for coupling with optical fiber. There are two waveguide sensors on the chip: a straight waveguide sensor with a length of 1 cm and a bend waveguide sensor with a length of 2 cm. (B) SEM image of the cross section of a fabricated SOI waveguide. (C) The simulated fundamental TM mode of the SOI waveguide. (D) Photograph of the SOI waveguide with a gas cell. (E) Micrograph of the sensing area.
The cross-sectional mode field distribution of the SOI ridge waveguide is simulated by COMSOL Multiphysics. The refractive index of Si and SiO2 at the wavelength of 3,291 nm are 3.4302 and 1.4119, respectively. The output mode field of the mid infrared laser is TM polarized. In order to test the polarization of the light before coupling into the waveguides, we placed a polarizer behind the fiber and tested the output power under different polarization states. Test results show that the output power under TM and TE polarization is 54.3 and 12.9 μW, respectively, and the total power without polarizer is 79.3 μW. It can be seen that the light output from the optical fiber is mainly TM polarized, so we mainly focus on TM mode distribution of the waveguide. Figure 1C shows the TM0 mode distribution of SOI waveguide section with an effective refractive index of 1.889. Figure 1D shows the photograph of the SOI waveguide with a gas cell bonded on it. Micrograph of the sensing area is shown in Figure 1E in detail.
2.2 Experimental setup and details for on-chip CH4 sensing
The CH4 sensing system based on SOI optical waveguide is shown in Figure 2A. An ICL (Nanoplus) emitting at 3,291 nm was used as the light source, which can cover the absorption line of CH4 by changing its driving current. A polydimethylsiloxane (PDMS) gas cell was integrated on the SOI chip, and the gas inflow and outflow were carried out through the inlet and outlet above the cell. The width of the input and output coupling waveguides is 15 μm, and there is little evanescent field leaking above the waveguide, which can reduce the light absorption of the PDMS gas cell. The pressure in the gas cell was not controlled during experiment, and the measurement was conducted under ambient pressure of 760 Torr (Pi et al., 2021). Through a fluoride fiber, the light from the ICL was coupled into the SOI waveguide, and the light from the waveguide was directly incident into a mercury-cadmium-telluride (MCT) detector (VIGO System) through free-space, which can convert the optical signal to an electrical signal. Quasi-simultaneous DAS and WMS were used to detect CH4 concentration. Through the LabVIEW-controlled data acquisition (DAQ) card, the triangular wave signal for driving the laser was generated. The first half cycle of the signal is used for WMS, in which the rising ramp signal is superimposed with the high-frequency sine wave signal. The second half cycle of the signal is used for DAS and is a falling slope signal used for wavelength scanning. The LabVIEW based lock-in amplifier was used to extract the second harmonic (2f) signal from the first half cycle of the output signal from the detector. At the same time, a LabVIEW-based signal processing program was used to process the absorption signal of the second half cycle. In order to suppress the signal fluctuation caused by air flow on the surface of the waveguide, Kalman filter was added to the signal processing program. In the later gas detection experiments, the effect of the filter on improving the sensitivity of gas detection will be verified. Figures 2B–D show the flow chart of the signal processing using WMS and DAS. Figure 2B shows the driving signal of the ICL. The output sensing signal from the detector is shown in Figure 2C. Figure 2D shows the extracted 2f signal and absorbance signal under a CH4 concentration level of 40% (4 × 10⁵ ppm).
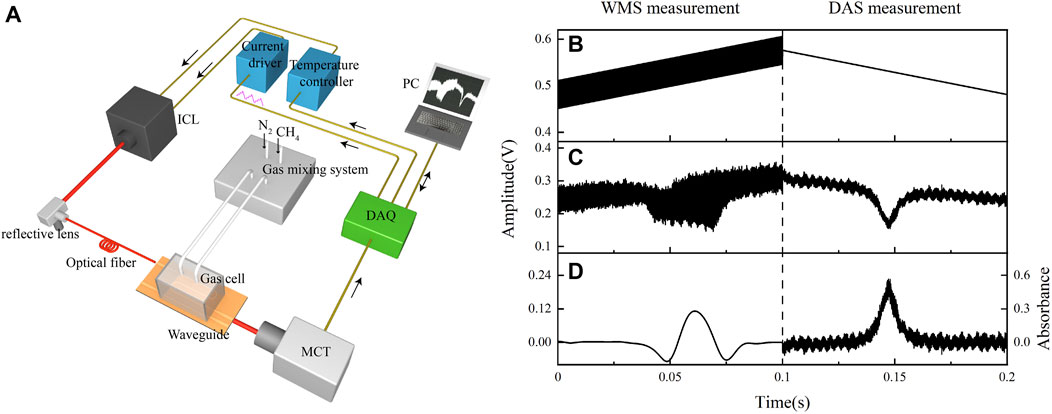
FIGURE 2. (A) Schematic of the SOI waveguide sensor system. (B) Driving signal of the ICL. For the rising edge, a ramp signal is superimposed with a high-frequency sine wave signal for WMS measurement. For the falling edge, only a ramp signal is used for DAS measurement. (C) The output sensing signal from the detector and (D) the extracted 2f signal and absorbance signal under a CH4 concentration level of 40% (4 × 10⁵ ppm).
2.3 Sensing theory
The light of the evanescent field above the waveguide is absorbed by the target gas. The gas concentration can be obtained by monitoring the change of the output light intensity. In addition, the intrinsic optical absorption of waveguide materials needs to be considered. The basic sensing theory of the waveguide gas sensor obeys the Lambert-Beer Law (Schilt et al., 2003; Siebert and Muller, 2005; Charrier et al., 2012)
where Iout and Iin are the output and input light intensity, αCH4 is the absorption coefficient of CH4, αint is the intrinsic loss of the waveguide, L is the waveguide length of the sensing area, and c is the concentration of the gas analyte. Since αCH4 is the absorption coefficient per unit CH4 concentration and length, it needs to be multiplied by the actual CH4 concentration c and waveguide length L. In addition, on the waveguide transmission section, only the light of the evanescent field in the upper cladding is absorbed by the gas, so it needs to be multiplied by the power ratio of the evanescent field. Γ is the power confinement factor (PCF) in the upper cladding of the waveguide, which can be expressed as (Robinson et al., 2008; Vlk et al., 2021)
Here, ncl is the refractive index of gas, ε is the permittivity, and E is the electric field, ng is the group refractive index which captures the waveguide dispersion. For the designed SOI waveguide, only TM0 and TM1 modes can be transmitted. In the calculation of PCF, the dominant TM0 mode is considered under the incident way of the laser mode. ng of the TM0 mode is 5.18, and the PCF was numerically calculated to be 34.3%.
2.4 Transmission loss of the silicon-on-insulator waveguide
The transmission loss of the SOI waveguide can be measured by ‘cut-back’ method, with the expression of
where L1 (i.e., 1 cm) and L2 (i.e., 2 cm) are the lengths of the two different waveguides, Iout1 and Iout2 are the output light intensity from the corresponding waveguides. By measuring the ratio between the output power of the two different waveguides, the transmission loss of the waveguide can be obtained. Here we measured the output signal amplitude of the two waveguides to calculate the signal amplitude ratio, which are equal to the ratio of intensity. N2 was continuously injected into the gas cell, the modulation signal amplitude is set to 0, and the lengths of two waveguides are 1 and 2 cm, respectively. The maximum amplitudes of the sampled signal are 3.3 and 2.8 V respectively. According to Eq. 3, the transmission loss of the waveguide is
2.5 PCF of the silicon-on-insulator waveguide
For the 1 cm-long waveguide with N2 injected, the output can be expressed as
Through Eqs. 1 and 4, the absorbance of CH4 can be expressed as
At a concentration of c = 10%, the direct absorption spectrum was measured and the absorbance of CH4 was obtained, which is 0.23314. Based on the high-resolution transmission (HITRAN) database, the absorption coefficient αCH4 = 10 cm−1. Then the actual PCF of the waveguide is determined to be 23.31%, which is lower than the simulation result of 34.3%. This can be attributed to the fabrication error of the SOI waveguide, leading to a changed mode filed distribution and effective refractive index.
3 Waveguide sensor performance using direct absorption spectroscopy
3.1 Calibration of CH4 sensor using direct absorption spectroscopy
In order to scan the absorption line of CH4 at 3,038.5 cm−1, the operating temperature of the ICL was set to 15°C. A triangular-wave scan signal with an initial voltage of 0.481 V and an amplitude of 0.095 V was applied to the ICL driver, so that the emission wavelength of the ICL can sweep from 3,037.637 to 3,039.151 cm−1. The sampling rate of the DAQ card was 5 kHz, resulting in 2 × 10⁴ data points in each scanning cycle, of which the 1 × 10⁴ data points corresponding to the falling slope signal in the second half of the cycle were used for DAS. Through a gas mixing system (Series 4,000, Environics), pure CH4 was diluted with nitrogen (N2) to form a gas mixture with CH4 concentration levels from 0 to 40%. At each concentration, the gas mixture was continuously injected into the gas cell for 2 min. At the sampling time of 0.2 s, the signal waveform and maximum absorbance were recorded, respectively. Figures 3A,B show the absorbance of the 1 cm-long waveguide and the 2 cm-long waveguide under different CH4 concentration levels (0, 10, 20, 30 and 40%), respectively.

FIGURE 3. (A) Absorbance of the 1 cm-long waveguide under different CH4 concentration levels of 0, 10, 20, 30 and 40%. (B) Absorbance of the 2 cm-long waveguide under different CH4 concentration levels of 0, 10, 20, 30 and 40%.
For the two waveguides with different lengths, under the conditions of using and without using Kalman filter, the average value of the absorbance at different concentration levels are shown in Figure 4A linear fitting was also carried out based on the experimental data, as shown in Figure 4. The R2 of the linear fit is >99%. The error bars are different for different waveguide lengths and different CH4 concentration levels, due to different waveguide loss, optical output power and signal to noise ratio. Through Kalman filter, the signal fluctuation is suppressed and the error bars become smaller.
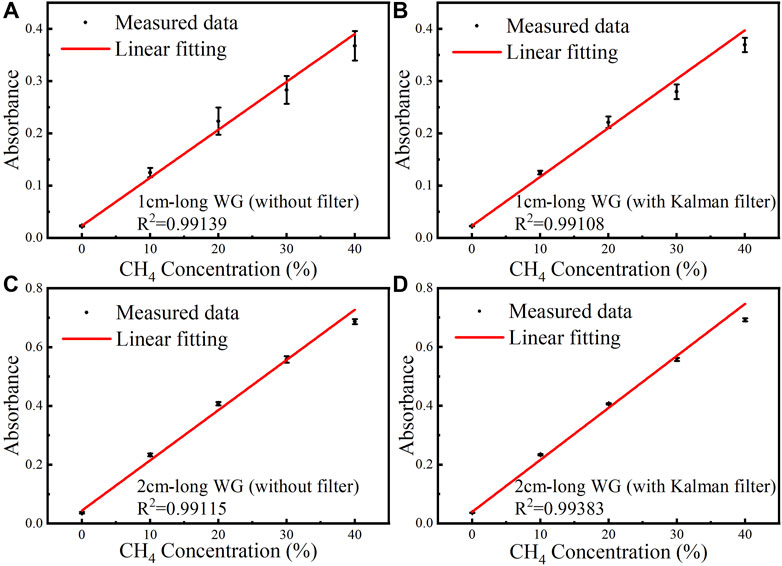
FIGURE 4. Under different CH4 concentration levels of 0, 10, 20, 30 and 40%, measured data and linear fitting curve of the absorbance versus CH4 concentration for the 1 cm-long waveguide (A) without Kalman filter and (B) with Kalman filter. Measured data and linear fitting curve of the absorbance versus CH4 concentration for the 2 cm-long waveguide (C) without Kalman filter and (D) with Kalman filter.
The linear fitting equations between the averaged absorbance and CH4 concentration of the 1 cm-long waveguide without and with Kalman filter are expressed by Eq. 6A and Eq. 6B. The linear fitting equations for the 2 cm-long waveguide sensor are expressed by Eq. 7A and Eq. 7B.
3.2 Stability
In order to evaluate the stability and noise level of the system, pure N2 was injected into the gas cell. The absorbance was sampled for 15 min with a sampling period of 0.2 s. The curve of the calculated CH4 concentration levels versus sampling time is shown in Figures 5A–D. The Allan deviation of the sampled data was calculated, and its relation with the averaging time is shown in Figure 5E. Generally, with the increase of averaging time, the Gaussian white noise will be reduced, resulting in the reduction of the Allan deviation. However, due to the use of filtering in data sampling and processing, the effect of increasing the average time to reduce the Gaussian white noise is weakened. However, filtering cannot remove relatively low-frequency noise, it leads to the increase of Allan deviation in the initial stage with a small average time. Then the Allan deviation decreases because of the increased averaging time, which decreases the effect of the relatively low-frequency noise. As the averaging time increases to a certain extent, system drift begins to play a leading role, resulting in the increase of Allan deviation. Based on Allan deviation, the LoD of the 1 cm-long waveguide without and with Kalman filter are 2,917 ppm and 347 ppm, respectively, and those of the 2 cm-long waveguide are 1,319 ppm and 155 ppm, respectively, at an averaging time of 0.2 s.
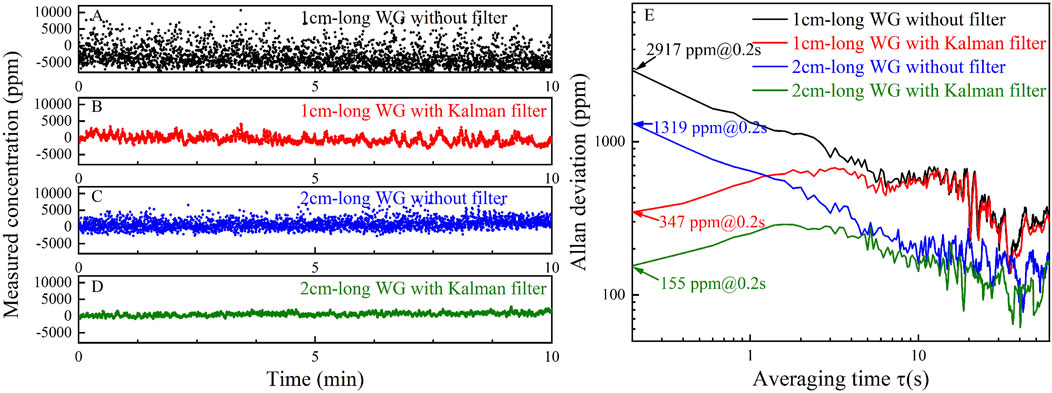
FIGURE 5. (A) Measured CH4 concentration levels of the 1 cm-long waveguide (A) without Kalman filter and (B) with Kalman filter by injecting pure N2 for 10 min. Measured CH4 concentration levels of the 2 cm-long waveguide (C) without Kalman filter and (D) with Kalman filter by injecting pure N2 for 10 min. (E) Allan deviation analysis based on the data shown in (A–D).
4 Waveguide sensor performance using wavelength modulation spectroscopy
4.1 Modulation amplitude optimization
In order to achieve a high signal-to-noise ratio (SNR), it is necessary to optimize the modulation amplitude. A mixture of CH4 and N2 was injected into the cell, where the CH4 concentration level is 10%. Under different modulation amplitudes, the amplitudes of 2f signal for the 1cm and 2 cm-long waveguides were recorded, as shown in Figure 6. For the two waveguides with different lengths, the maximum amplitude of the 2f signal was obtained when the modulation amplitude is 0.025 V. Because the amplitude of the 2f signal has a linear relationship with gas concentration, it is reasonable to optimize the modulation amplitude at one concentration level. Therefore, a modulation amplitude of 0.025 V was adopted in the WMS measurement.
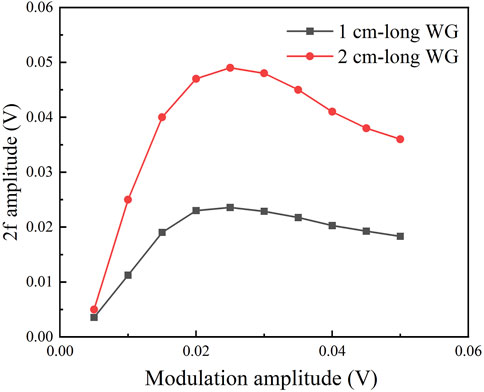
FIGURE 6. The measured 2f signal amplitude as a function of the modulation amplitude of the sinewave signal at a CH4 concentration level of 105 ppmv for the 1 cm- and 2 cm-long waveguide.
4.2 Calibration of CH4 sensor using wavelength modulation spectroscopy
In the first half cycle of the scan signal, there are 1 × 10⁴ data points for the rising ramp signal. A high-frequency sinusoidal modulation signal with a frequency of 5 kHz was superimposed on the triangular wave scan signal. At a sampling time interval of 0.2 s, the 2f signal waveform and its amplitude were recorded, respectively. Under different concentration levels (0, 10, 20, 30 and 40%), the 2f signal of the 1 cm and 2 cm-long waveguides without filter are shown in Figure 7.
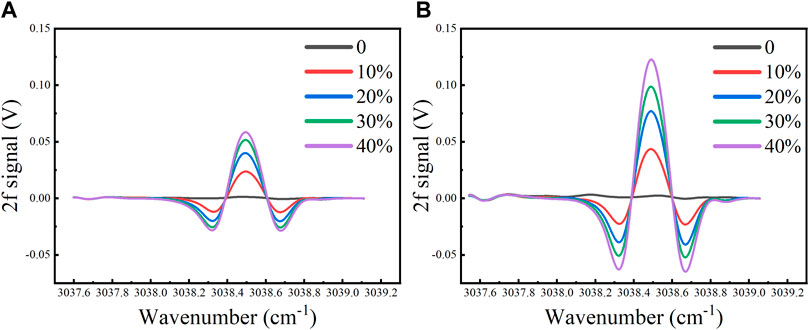
FIGURE 7. The measured 2f signal under CH4 concentration levels of 0, 10, 20, 30 and 40% for the (A) 1 cm-long and (B) 2 cm-long waveguide without Kalman filter.
At high CH4 concentration levels, the 2f signal amplitude shows a nonlinear trend. The 2f signal amplitude at different concentration levels were fitted non-linearly. The relationship between the 2f signal amplitude and CH4 concentration is shown in Figure 8, with R2 > 0.999.
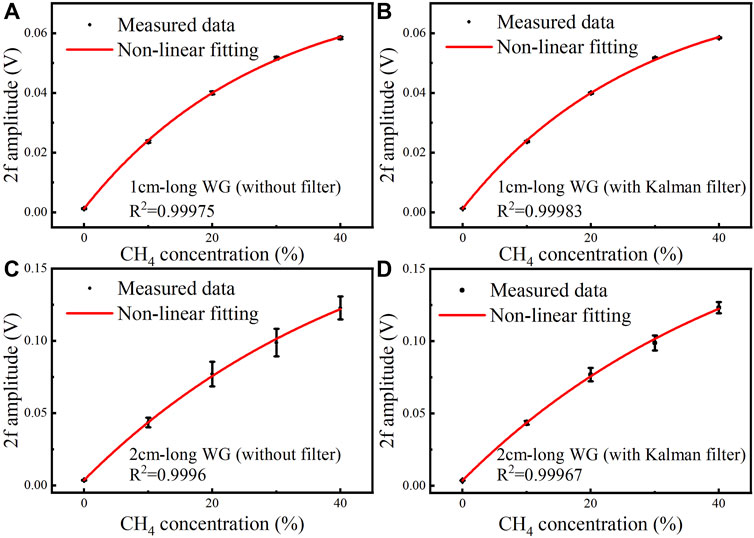
FIGURE 8. Measured data and non-linear fitting curve of the 2f signal amplitude versus CH4 concentration of the 1 cm-long waveguide under different CH4 concentration levels of 0, 10, 20, 30 and 40% (A) without Kalman filter and (B) with Kalman filter. Measured data and non-linear fitting curve of the 2f signal amplitude versus CH4 concentration of the 2 cm-long waveguide under different CH4 concentration levels of 0, 10, 20, 30 and 40% (C) without Kalman filter and (D) with Kalman filter.
The non-linear fitting equations between the averaged 2f signal amplitude and CH4 concentration for the 1 cm-long waveguide without and with Kalman filter are expressed by Eq. 8A and Eq. 8B, respectively. The non-linear fitting equations of the 2 cm-long waveguide without and with Kalman filter are shown in Eq. 9A and Eq. 9B, respectively.
4.3 System stability
The stability measurement using WMS was carried out synchronously with DAS. The curve of the measured CH4 concentration levels versus sampling time is shown in Figures 9A–D. The Allan deviation based on the measured data was analyzed, and its relation with the averaging time is shown in Figure 9E. The LoD of the 1 cm-long waveguide without and with Kalman filter are 744 and 85 ppm, respectively, and those of the 2 cm-long waveguide without and with Kalman filter are 604 and 78 ppm, respectively, at an averaging time of 0.2 s. Therefore, by using WMS technique and Kalman filter, the LoD can be reduced from 347 ppm (using DAS) to 85 ppm for the 1 cm-long sensor, and the LoD can be reduced from 155 ppm (using DAS) to 78 ppm for the 2 cm-long sensor. This proves the denoising ability of the WMS technique.
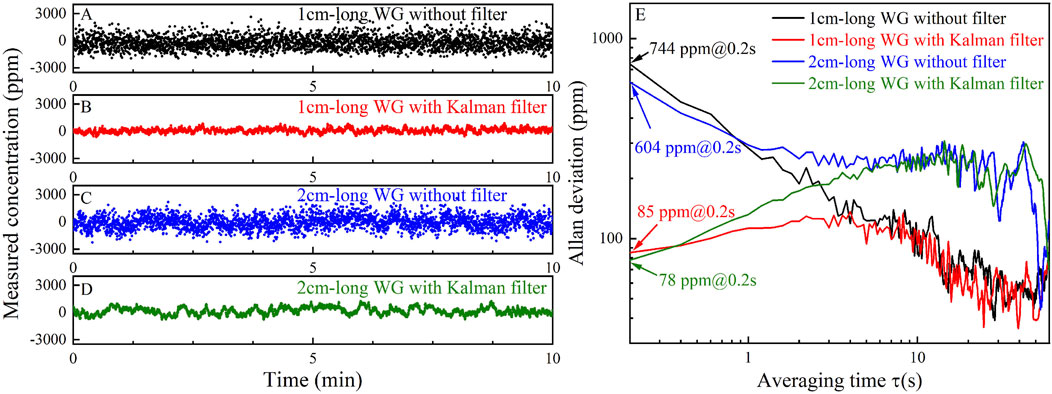
FIGURE 9. Measured CH4 concentration levels in N2 environment using the 1 cm-long waveguide (A) without Kalman filter and (B) with Kalman filter. Measured CH4 concentration levels in N2 environment using the 2 cm-long waveguide (C) without Kalman filter and (D) with Kalman filter. (E) Allan deviation analysis based on the data shown in (A–D).
4.4 Response time
Experiment was performed to determine the 10–90% response time of the waveguide sensor. Pure N2 and 20% CH4 were repetitively injected into the gas cell, respectively, for a period of time. The two gas samples were exchanged twice, and the concentration level change was measured using the 1 cm-long waveguide. The results are shown in Figure 10. Under a gas flow rate of 100 sccm, the rise time from 10 to 90% of the target concentration is found to be ∼1.4 s, and the fall time from 90 to 10% is found to be ∼2.9 s.
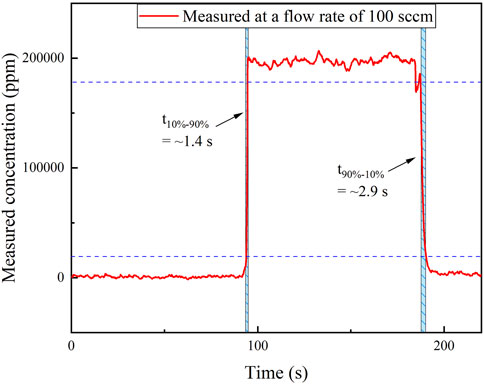
FIGURE 10. Response time measurement by switching the two gas samples with a concentration level of 0 ppm (N2) and 10%.
5 Comparison and discussion
A performance comparison between the previously reported mid-infrared CH4 ChG optical waveguide sensor and the SOI optical waveguide CH4 sensor proposed in this paper is shown in Table 1. Compared with the reported ChG waveguide sensors (Han et al., 2016; Su et al., 2019), the prepared SOI waveguide sensor has lower optical loss (i.e., < 1 dB/cm). At the same time, due to the use of Kalman filter, the LoD measured by DAS and WMS are significantly reduced (as small as 100 ppm). When gas is injected into the PDMS gas cell, it will bring certain disturbance to the waveguide, resulting in additional noise. By adding Kalman filter, this kind of noise can be filtered out to a certain extent, and the signal-to-noise ratio (SNR) and LoD can be improved. In addition, because WMS has a certain suppressing effect on low-frequency noise, the LoD is lower than the DAS under the same waveguide length.
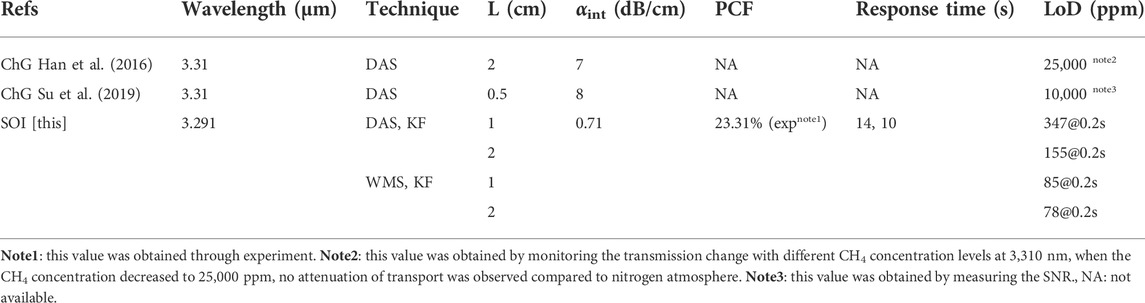
TABLE 1. Comparison among the reported CH4 waveguide sensors. KF: Kalman filter.
In DAS and WMS measurements, we used two SOI waveguides with different lengths. Among them, the LoD for the 2 cm-long waveguide sensor is lower, because the 2 cm-long waveguide has a longer equivalent optical path under the same PCF. Due to the low transmission loss of SOI waveguide, it can be considered to fabricate longer waveguide to obtain lower LoD when the transmission loss allows.
6 Conclusion
Mid-infrared CH4 sensor system based on SOI waveguide was developed at 3,038.5 cm−1 for CH4 detection. SOI bend and straight waveguides as well as DAS and WMS measurement schemes were employed, and Kalman filter was used for noise suppression. CH4 sensing experiments were carried out using CH4 samples with five different concentration levels. The waveguide transmission loss was measured to be 0.71 dB/cm, and the PCF of the waveguide was experimentally determined to be 23.31%. Based on Allan deviation analysis on the 2 cm-long waveguide, by using DAS and WMS, the LoD are 155 and 78 ppm at an averaging time of 0.2 s, respectively, under the case of using Kalman filter. By further optimizing the PCF of the waveguide and appropriately increasing the length of the sensing waveguide, a lower detection limit is expected. The on-chip sensor shows potential applications in CH4 detection in chemical, oil and coal industries. In the future, by integrating the laser, detector and sensing waveguide on the same chip for more stable optical coupling and light transmission. Since no external light source and detector are required, the size of the sensing system will be significantly reduced and the portability will be improved.
Data availability statement
The original contributions presented in the study are included in the article/Supplementary Material, further inquiries can be directed to the corresponding authors.
Author contributions
HZ performed the research and wrote the manuscript. CZ and YW supported the research and revised the manuscript. MP analyzed and verified the sensing results. LL, FS, YZ and FT provided technical guidance and helped to revise the paper. The manuscript was written through contributions of all authors. All authors have given approval to the final version of the manuscript.
Funding
The authors wish to express their gratitude to the National Natural Science Foundation of China (Nos. 62,175,087, 61,775,079, 61,627,823, 61,960,206,004), Key Science and Technology R&D program of Jilin Province, China (No. 20200401059GX), Science and Technology Research Project of Department of Education, Jilin Province, China (No. JJKH20211088KJ), Program for JLU Science and Technology Innovative Research Team (JLUSTIRT, 2021TD-39).
Conflict of interest
The authors declare that the research was conducted in the absence of any commercial or financial relationships that could be construed as a potential conflict of interest.
The handling editor MG declared a past co-authorship with the author FT.
Publisher’s note
All claims expressed in this article are solely those of the authors and do not necessarily represent those of their affiliated organizations, or those of the publisher, the editors and the reviewers. Any product that may be evaluated in this article, or claim that may be made by its manufacturer, is not guaranteed or endorsed by the publisher.
References
Berman, E. S. F., Fladeland, M., Liem, J., Kolyer, R., and Gupta, M. (2012). Greenhouse gas analyzer for measurements of carbon dioxide, methane, and water vapor aboard an unmanned aerial vehicle. Sensors Actuators B Chem. 169, 128–135. doi:10.1016/j.snb.2012.04.036
Butt, M. A., Degtyarev, S. A., Khonina, S. N., and Kazanskiy, N. L. (2017). An evanescent field absorption gas sensor at mid-IR 3.39 mu m wavelength. J. Mod. Opt. 64 (18), 1892–1897. doi:10.1080/09500340.2017.1325947
Charrier, J., Brandily, M. L., Lhermite, H., Michel, K., Bureau, B., Verger, F., et al. (2012). Evanescent wave optical micro-sensor based on chalcogenide glass. Sensors Actuators B Chem. 173, 468–476. doi:10.1016/j.snb.2012.07.056
Dong, M., Zheng, C. T., Yao, D., Zhong, G. Q., Miao, S. Z., Ye, W. L., et al. (2018). Double-range near-infrared acetylene detection using a dual spot-ring Herriott cell (DSR-HC). Opt. Express 26 (9), 12081–12091. doi:10.1364/Oe.26.012081
El Shamy, R. S., Swillam, M. A., and Khalil, D. A. (2019). Mid infrared integrated MZI gas sensor using suspended silicon waveguide. J. Light. Technol. 37 (17), 4394–4400. doi:10.1109/Jlt.2019.2924916
Gutierrez-Arroyo, A., Baudet, E., Bodiou, L., Nazabal, V., Rinnert, E., Michel, K., et al. (2017). Theoretical study of an evanescent optical integrated sensor for multipurpose detection of gases and liquids in the Mid-Infrared. Sensors Actuators B Chem. 242, 842–848. doi:10.1016/j.snb.2016.09.174
Han, Z., Lin, P., Singh, V., Kimerling, L., Hu, J., Richardson, K., et al. (2016). On-chip mid-infrared gas detection using chalcogenide glass waveguide. Appl. Phys. Lett. 108 (14), 141106. doi:10.1063/1.4945667
Howarth, R. W., Santoro, R., and Ingraffea, A. (2011). Methane and the greenhouse-gas footprint of natural gas from shale formations. Clim. Change 106 (4), 679–690. doi:10.1007/s10584-011-0061-5
Hu, T., Dong, B. W., Luo, X. S., Liow, T. Y., Song, J. F., Lee, C., et al. (2017). Silicon photonic platforms for mid-infrared applications [Invited]. Photonics Res. 5 (5), 417–430. doi:10.1364/Prj.5.000417
Khonina, S. N., Kazanskiy, N. L., and Butt, M. A. (2020). Evanescent field ratio enhancement of a modified ridge waveguide structure for methane gas sensing application. IEEE Sens. J. 20 (15), 8469–8476. doi:10.1109/Jsen.2020.2985840
Kirschke, S., Bousquet, P., Ciais, P., Saunois, M., Canadell, J. G., Dlugokencky, E. J., et al. (2013). Three decades of global methane sources and sinks. Nat. Geosci. 6 (10), 813–823. doi:10.1038/Ngeo1955
Kita, D. M., Michon, J., Johnson, S. G., and Hu, J. (2018). Are slot and sub-wavelength grating waveguides better than strip waveguides for sensing? Optica 5 (9), 1046. doi:10.1364/optica.5.001046
Leis, J., Buttsworth, D., Snook, C., and Holmes, G. (2014). Detection of potentially explosive methane levels using a solid-state infrared source. IEEE Trans. Instrum. Meas. 63 (12), 3088–3095. doi:10.1109/Tim.2014.2327457
Liu, L., Xiong, B., Yan, Y., Li, J. Y., and Du, Z. H. (2016). Hollow waveguide-enhanced mid-infrared sensor for real-time exhaled methane detection. IEEE Photonics Technol. Lett. 28 (15), 1613–1616. doi:10.1109/Lpt.2016.2559528
Liu, Z. W., Zheng, C. T., Chen, C., Li, Y. F., Xie, H. T., Ren, Q., et al. (2019). ICL-based mid-infrared carbon dioxide sensor system for deep-sea natural gas hydrate exploration. Opt. Express 27 (4), 5598–5609. doi:10.1364/Oe.27.005598
Pi, M. Q., Zheng, C. T., Bi, R., Zhao, H., Liang, L., Zhang, Y., et al. (2019). Design of a mid-infrared suspended chalcogenide/silica-on-silicon slot-waveguide spectroscopic gas sensor with enhanced light-gas interaction effect. Sensors Actuators B Chem. 297, 126732. doi:10.1016/j.snb.2019.126732
Pi, M., Zheng, C., Ji, J., Zhao, H., Peng, Z., Lang, J., et al. (2021). Surface-enhanced infrared absorption spectroscopic chalcogenide waveguide sensor using a silver island film. ACS Appl. Mat. Interfaces 13 (27), 32555–32563. doi:10.1021/acsami.1c08177
Qiao, Y. Y., Tao, J. F., Qiu, J. F., Hong, X. B., and Wu, J. (2019). Sensitive and ultrasmall sample volume gas sensor based on a sealed slot waveguide. Appl. Opt. 58 (17), 4708–4713. doi:10.1364/Ao.58.004708
Ranacher, C., Consani, C., Hedenig, U., Grille, T., Lavchiev, V., and Jakoby, B. (2016). A photonic silicon waveguide gas sensor using evanescent-wave absorption. 2016 ieee sensors.
Ranacher, C., Consani, C., Vollert, N., Tortschanoff, A., Bergmeister, M., Grille, T., et al. (2018). Characterization of evanescent field gas sensor structures based on silicon photonics. IEEE Photonics J. 10 (5), 1–14. doi:10.1109/Jphot.2018.2866628
Rao, A., Patil, A., Chiles, J., Malinowski, M., Novak, S., Richardson, K., et al. (2015). Heterogeneous microring and Mach-Zehnder modulators based on lithium niobate and chalcogenide glasses on silicon. Opt. Express 23 (17), 22746–22752. doi:10.1364/Oe.23.022746
Robinson, J. T., Preston, K., Painter, O., and Lipson, M. (2008). First-principle derivation of gain in high-index-contrast waveguides. Opt. Express 16 (21), 16659–16669. doi:10.1364/OE.16.016659
Schilt, S., Thevenaz, L., and Robert, P. (2003). Wavelength modulation spectroscopy: Combined frequency and intensity laser modulation. Appl. Opt. 42(33), 6728–6738. Doi doi:10.1364/Ao.42.006728
Shindell, D. T., Faluvegi, G., Koch, D. M., Schmidt, G. A., Unger, N., and Bauer, S. E. (2009). Improved attribution of climate forcing to emissions. Science 326 (5953), 716–718. doi:10.1126/science.1174760
Siebert, R., and Muller, J. (2005). Infrared integrated optical evanescent field sensor for gas analysis Part I: System design. Sensors Actuators A Phys. 119 (1), 138–149. doi:10.1016/j.sna.2004.11.001
Soref, R. A., De Leonardis, F., and Passaro, V. M. N. (2019). On-chip detection of trace gases using photonic matched filters. J. Light. Technol. 37 (4), 1388–1395. doi:10.1109/Jlt.2019.2894035
Su, P., Han, Z., Kita, D., Becla, P., Lin, H., Deckoff-Jones, S., et al. (2019). Monolithic on-chip mid-IR methane gas sensor with waveguide-integrated detector. Appl. Phys. Lett. 114 (5), 051103. doi:10.1063/1.5053599
Sur, R., Sun, K., Jeffries, J. B., Socha, J. G., and Hanson, R. K. (2015). Scanned-wavelength-modulation-spectroscopy sensor for CO, CO2, CH4 and H2O in a high-pressure engineering-scale transport-reactor coal gasifier. Fuel 150, 102–111. doi:10.1016/j.fuel.2015.02.003
Tombez, L., Zhang, E. J., Orcutt, J. S., Kamlapurkar, S., and Green, W. M. J. (2017). Methane absorption spectroscopy on a silicon photonic chip. Optica 4 (11), 1322–1325. doi:10.1364/Optica.4.001322
Vlk, M., Datta, A., Alberti, S., Yallew, H. D., Mittal, V., Murugan, G. S., et al. (2021). Extraordinary evanescent field confinement waveguide sensor for mid-infrared trace gas spectroscopy. Light. Sci. Appl. 10 (1), 26. doi:10.1038/s41377-021-00470-4
Ye, W. L., Li, C. G., Zheng, C. T., Sanchez, N. P., Gluszek, A. K., Hudzikowski, A. J., et al. (2016). Mid-infrared dual-gas sensor for simultaneous detection of methane and ethane using a single continuous-wave interband cascade laser. Opt. Express 24 (15), 16973–16985. doi:10.1364/Oe.24.016973
Yoo, K. M., Midkiff, J., Rostamian, A., Chung, C. J., Dalir, H., and Chen, R. T. (2020). InGaAs membrane waveguide: A promising platform for monolithic integrated mid-infrared optical gas sensor. ACS Sens. 5 (3), 861–869. doi:10.1021/acssensors.0c00180
Zhang, L., Ding, J., Zheng, H. Y., An, S. S., Lin, H. T., Zheng, B. W., et al. (2018). Ultra-thin high-efficiency mid-infrared transmissive Huygens meta-optics. Nat. Commun. 9, 1481. doi:10.1038/s41467-018-03831-7
Zhang, Z., He, J., Du, B., Guo, K. K., and Wang, Y. P. (2019). Highly sensitive gas refractive index sensor based on hollow-core photonic bandgap fiber. Opt. Express 27 (21), 29649–29658. doi:10.1364/Oe.27.029649
Zheng, C. T., Ye, W. L., Sanchez, N. P., Li, C. G., Dong, L., Wang, Y. D., et al. (2017). Development and field deployment of a mid-infrared methane sensor without pressure control using interband cascade laser absorption spectroscopy. Sensors Actuators B Chem. 244, 365–372. doi:10.1016/j.snb.2016.12.146
Zheng, K. Y., Zheng, C. T., He, Q. X., Yao, D., Hu, L., Zhang, Y., et al. (2018). Near-infrared acetylene sensor system using off-axis integrated-cavity output spectroscopy and two measurement schemes. Opt. Express 26 (20), 26205–26216. doi:10.1364/Oe.26.026205
Keywords: methane sensing, SOI waveguide sensor, direct absorption spectroscopy, wavelength modulation spectroscopy, kalman filter
Citation: Zhao H, Zheng C, Pi M, Liang L, Song F, Zhang Y, Wang Y and Tittel FK (2022) On-chip mid-infrared silicon-on-insulator waveguide methane sensor using two measurement schemes at 3.291 μm. Front. Chem. 10:953684. doi: 10.3389/fchem.2022.953684
Received: 26 May 2022; Accepted: 29 July 2022;
Published: 23 August 2022.
Edited by:
Marilena Giglio, Politecnico di Bari, ItalyCopyright © 2022 Zhao, Zheng, Pi, Liang, Song, Zhang, Wang and Tittel. This is an open-access article distributed under the terms of the Creative Commons Attribution License (CC BY). The use, distribution or reproduction in other forums is permitted, provided the original author(s) and the copyright owner(s) are credited and that the original publication in this journal is cited, in accordance with accepted academic practice. No use, distribution or reproduction is permitted which does not comply with these terms.
*Correspondence: Chuantao Zheng, zhengchuantao@jlu.edu.cn; Lei Liang, lianglei0427@163.com