A Novel Synthetic Method for N Doped TiO2 Nanoparticles Through Plasma-Assisted Electrolysis and Photocatalytic Activity in the Visible Region
 Tae Hyung Kim
 Gwang-Myeong Go
 Hong-Baek Cho
 Yoseb Song
 Chan-Gi Lee1*
  Yong-Ho Choa
- 1Advanced Materials and Processing Center, Institute for Advanced Engineering (IAE), Yongin, South Korea
- 2Department of Fusion Chemical Engineering, Hanyang University, Ansan, South Korea
Nitrogen doped TiO2 (N-TiO2) nanoparticles were synthesized via a novel plasma enhanced electrolysis method using bulk titanium (Ti) as a source material and nitric acid as the nitrogen dopant. This method possesses remarkable merits with regard to the direct-metal synthesis of nanoparticles with its one-step process, eco-friendliness, and its ability to be mass produced. The nanoparticles were synthesized from bulk Ti metal and dipped in 5–15 mmol of a nitric acid electrolyte under the application of AC 500 V, the minimum range of voltage to generate plasma. By controlling the electrolyte concentration, the nanoparticle size distribution could be tuned between 12.1 and 24.7 nm using repulsion forces via variations in pH. The prepared N-TiO2 nanoparticles were calcined at between 100 and 300°C to determine their photocatalytic efficiency within the visible-light region, which depended on their crystal structure and N doping content. Analysis showed that the temperature treatment yielded an anatase TiO2 crystalline structure when the N doping content was varied from 0.4 to 0.54 at.%. In particular, the 0.4 at.% N doped TiO2 catalyst exhibited the highest catalytic performance with quadruple efficiency compared to the P-25 standard TiO2 nanoparticles, which featured a 91% degradation of methyl orange organic dye within 300 min. This solid-liquid reaction based on plasma enhanced electrolysis could open new pathways with regard to high purity mass producible ceramic nanoparticles with advanced properties.
Introduction
Intensive research has been performed to produce highly photocatalytic titanium dioxide (TiO2) nanoparticles (Ba-abbad et al., 2012; Mattioli et al., 2014; Vukoje et al., 2016) for a large application space, including water splitting (Galinska and Walendziewski, 2005; Ni et al., 2007; Tang et al., 2008) and industrial pollutant degradation (Liu et al., 2010; Lin et al., 2012; Dong et al., 2015). However, crystalline TiO2 nanoparticles possess limited photocatalytic activity due to their wide band gap regardless of crystal structure from anatase to rutile (anatase ~ 3.2 eV, rutile ~ 3.0 eV); the nanoparticles only absorb within the UV region, comprising a small portion of sunlight of <5% of the solar flux. Thus, to efficiently enhance the photocatalytic activity, many researchers have focused on utilizing the visible region, which contains nearly half of the energy from sunlight (~45%) by doping metal cations (Ag, C, Zn, etc.) into the Ti lattice (Cao et al., 2008; Aware and Jadhav, 2015). However, cation dopants located at d-states within the band gap act as trap centers for excited electron and holes, which can additionally shift the conduction band below the redox potential (Wu et al., 2007). Thus, some drawbacks exist such as a low thermal stability and can act as recombination centers in the form of charge carriers. Alternatively, anion dopants such as N, S, and P have attracted considerable attention due to their intrinsic properties, which possess similar characteristics to oxygen. Among those anions, nitrogen appears to be the most plausible ingredient to be investigated for doping with the formation of a metastable center, low ionization energy state, and reduced atomic size (Dunnill et al., 2011). The light absorption range can thus be extended into the visible region (up to 380 nm) through existing p-states near the valance band (Scanlon et al., 2013).
The preparation of N-TiO2 nanoparticles has been extensively studied with aqueous-based chemical processes such as sol-gel (Yu et al., 2007; Dunnill et al., 2011; Caratto et al., 2012), hydrothermal (Zhou et al., 2011), solvothermal (Li and Liu, 2009; Yang et al., 2010), and polymeric precursor methods (Soares et al., 2011; Yu et al., 2017) being the most frequently employed. These are general methods for the preparation of nanoparticles that can be used to control morphology, structure, and particle size. However, synthetic conditions such as the solution temperature, pH, reaction time, and precursor ratio must be sensitively controlled. Moreover, long reaction times and drying processes are essential in order to obtain highly pure and crystalline nanoparticles, making mass production difficult. To overcome these drawbacks, a noble synthetic strategy using plasma enhanced electrolysis was adopted herein. The process utilizes a small amount of electrolyte, characterizes a quick production time, and entails the direct synthesis of nanoparticles from bulk metal in a manner suitable for mass production. Furthermore, this technology is environmental friendly due to employing a reusable electrolyte and not requiring an additional nitrogen source such as ammonia (Gao et al., 2014).
Here we report a novel method for the preparation of interstitial N-TiO2 nanoparticles by bulk-direct synthesis using an eco-friendly and mass producible method via plasma enhanced electrolysis, enhancing photocatalytic activity through the narrowing of band gap structures, which will widen the light absorption region into the visible spectrum. During the nanoparticle synthetic process, arc plasma was formed on the metal surface, creating gaseous anionic species that subsequently reacted with cationic Ti species to grow into N-TiO2 through nucleation. The relationship between N doping content and nanoparticle crystallinity, which primarily affected the photocatalytic efficiency was analyzed and elucidated by comparing samples prepared through the variation of electrolyte concentrations and calcination temperatures.
Materials and Methods
Synthesis of Amorphous N-TiO2 Nanoparticles
Figure 1 shows a brief schematic diagram for the synthesis of N-TiO2 nanoparticles by the generation of plasma. A Ti metal plate (99.99% purity) was first washed twice with acetone and deionized water in order to remove other possible impurities. The organic-free Ti plate was hanged in 1 L of a nitric acid electrolyte in the middle of a double-jacket reactor. The Ti metal was connected to an anode and stainless steel mesh (SUS 304, 60 mesh) with a cylindrical shape that was connected to the cathode; the shape of the cathode was designed to radially impart an equal supply of electric voltage to the metal surface. The solution temperature was controlled using a bath circulator and stirred with a magnetic bar to exchange heat efficiently under the high temperature plasma reaction. After the initial generation of plasma on the metal surface, the voltage and current density of the power supply was maintained at certain conditions such as AC 500 V at 100 Hz for 10 min to synthesize nanoparticles continuously; the nitric acid concentration was varied from 5 to 15 mmol to observe the effect of the electrolyte concentration on the morphology of TiO2. After the reaction, the nanoparticle suspension was centrifuged to remove the remaining electrolyte and dried in a vacuum oven at 80°C for 24 h. The as-synthesized powders were calcined at different temperatures: 100, 150, 200, 250, and 300°C to transform amorphous TiO2 into the crystalline anatase phase to investigate their respective photocatalytic activity.
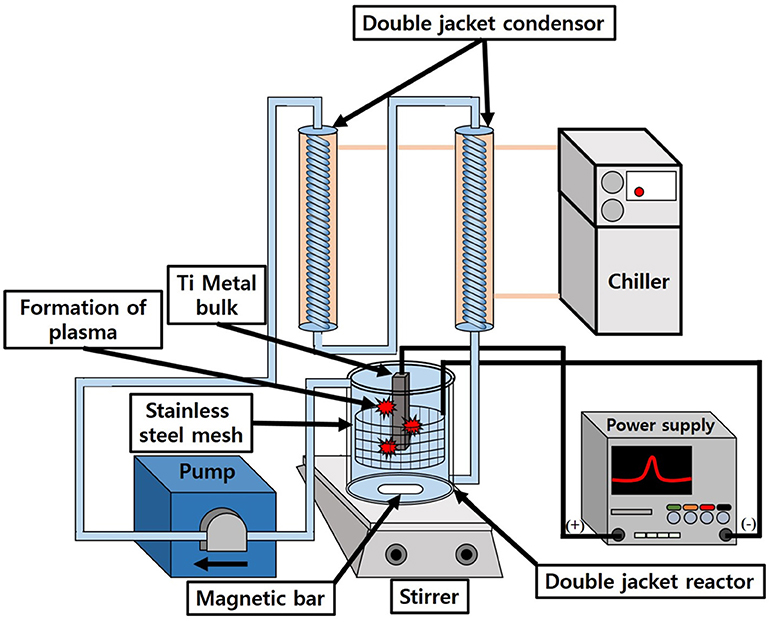
Figure 1. Schematic diagram for liquid-based plasma enhanced electrolysis.
Sample Characterization
Scanning electron microscopy (SEM) images were obtained with a Hitachi S-4800/Horiba EX-250 to analyze the morphology of the synthesized N-TiO2 nanoparticles. High-resolution transmission electron microscopy (HR-TEM) images were obtained with a JEOL, JEM-2100F to measure and calculate lattice parameters with selected area electron diffraction (SAED) patterns. The nanoparticle crystallinity and structures were analyzed with a RigaKu D/MAX-2500/PC X-ray diffractometer (XRD) using Cu Kα1 radiation (λ = 1.54 nm 2θ range between 20 and 80°). X-ray photoelectron spectroscopy (XPS) was performed with a Thermofisher Scientific K-Alpha+ MXP10. The photocatalytic activity of the N-TiO2 nanoparticles was assessed by analyzing the visible region efficiency of the decomposing methyl orange (MO, Sigma-Aldrich Co.) solution in a dark chamber equipped with a UV cut-off filter (Edmund Optics, 400–50 mm Diameter, OD 2 long pass filter) and a 300 W Zenon lamp. While being exposed to visible light, degraded methyl orange was collected with nanoparticles at 2 h intervals and separated via centrifugation. After separation, a Dong-il Shimadzu Co. UV-2600 UV-vis spectrophotometer was employed to calculate the photocatalytic activity. To compare the recombination rates of the samples, photoluminescence (PL) measurements were performed using a 290 nm laser (Horiba, Nanolog) as the excitation source at room temperature.
Photocatalytic Activity Analysis
The photocatalytic efficiency of the N-TiO2 samples was compared after various degrees of heat treatment: 100, 150, 200, 250, and 300°C for 4 h to transform the crystal structure and yield variations with regard to the degree of N doping with Degussa P-25 standard TiO2 nanoparticles. After calcination, 100 mg of nanoparticles were added and mixed with 100 ml of a 1 × 10⁻⁵ mol/L MO organic dye solution to measure the decomposition efficiency of each sample. The 100 mg/L powder mixed MO solution was sonicated for 10 min prior to the degradation step to enhance solution dispersity. The well-dispersed organic solution was placed in a dark chamber and stirred for an additional 30 min for stability. The degradation process was performed in a double-jacketed reactor to control the solution temperature and was irradiated with light using a 300 W Xe lamp with a UV cut-off filter. The reaction solution was collected every 2 h and analyzed via UV-vis spectroscopy to calculate the degradation efficiency for a 6 h long reaction.
Results and Discussion
Synthesis of N-TiO2 Nanoparticles
Figures 2a–c show the TiO2 nanoparticle morphologies produced at different concentrations of nitric acid. The particle size distribution analyzed via SEM decreased between the range of 12.1–24.7 nm as the nitric acid concentration was increased (size distribution in Figure 2d). The mean particle size decreased to 24.7, 19.4, and 12.1 nm at concentrations of 5, 10, and 15 mmol, respectively. It could be seen that at lower concentrations, some rod-like nanoparticle shapes could be found. Irregular shaped nanoparticles indicated unbalanced nanoparticle synthesis between the nucleation and growth steps. At higher concentrations with a lower pH electrolyte, more uniform and non-agglomerated nanoparticles could be produced. This could be attributed to two factors; repulsion forces and balance between the nucleation and growth steps (Alqadi et al., 2014). When the electrolyte solution pH decreased to lower values, ions such as OH−, which reacted with metal ions, scarcely existed and facilitated a slower nucleation and growth process. This also increased repulsion forces between nanoparticles, thus producing much more uniform nanoparticles with a smaller size distribution than at higher pH values (Wu et al., 2011). At higher electrolyte concentrations, the solution conductivity increased due to a larger quantity of ionized ions such as H+ and SO (when H2SO4 was used as an electrolyte), yielding a higher current density that was related to the plasma intensity; this would produce transparent solutions without forming colloid nanoparticles, thus necessitating the use of additional reducing agents (Kim et al., 2016). As a result, 15 mmol was the optimum nitric acid concentration for nanoparticle synthesis.
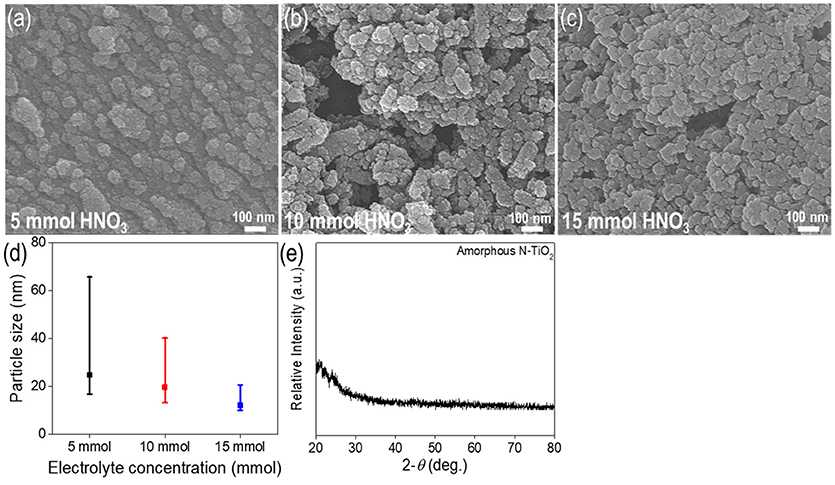
Figure 2. Characterization of N-TiO2 nanoparticles with various electrolyte concentrations,SEM images of (a) 5 mmol, (b) 10 mmol, (c) 15 mmol, (d) the size distribution and (e) XRD data.
Figures 2d,e show size distribution and XRD data for the synthesized amorphous N-TiO2 nanoparticles. The size distribution showed the nanoparticles ranging from 12.1 to 24.7 nm (Figure 2d); the size deviation increased noticeably from ±4.7 to ±22.2 nm as the electrolyte concentration increased. A broad peak at the lower degree with no other specific peaks in the XRD data (Figure 2e) indicated the pristine amorphous structure of N-TiO2. Moreover, no peaks for the Ti bulk metal starting material were detected, implying that Ti was completely transformed to TiO2 nanoparticles by adopting the plasma enhanced electrolysis process. If detached from the metal surface, the particle peaks would exhibit XRD peaks for bulk Ti and several irregularly shaped particles.
After the synthesis of nanoparticles using a 15 mmol electrolyte concentration, amorphous N-TiO2 nanoparticles were calcined at various temperatures to compare the XRD peaks between the treated nanoparticles in Figure 3. The as-prepared amorphous N-TiO2 nanoparticles revealed that the amorphous phase was transformed to a metastable anatase structure after being calcined at 100, 150, 200, 250, and 300°C for 4 h. In Figure 3A, analyzed peaks for the (101), (004), (200), and (105) lattice planes matched those for anatase TiO2 (JCPDS card no. 21-1272) and no nitrogen source peaks were detected, which indicated that nitrogen was perfectly doped into the TiO2 lattice (as confirmed in Figure 6). With an increase in calcination temperature, the XRD peak intensity also increased, indicating that the calcination temperature enhanced the crystallinity of the N-TiO2 nanoparticles with a deformation of amorphous bonding between atoms during calcination. Additional evidence for nitrogen doping was observed by a shift in the enlarged peak of the (101) lattice in Figure 3B. Due to the larger atomic radius of nitrogen compared to oxygen (N3− = 171 Ã > O2− = 140 Ã), a large degree of nitrogen doping would lead to XRD peak broadening effects. A reduction in doping with an increase in the calcination temperature could shift the peak to much higher diffraction angles compared to non-doped TiO2 (Sun et al., 2016). This result will be compared and identified via XPS and PL analysis in later sections.
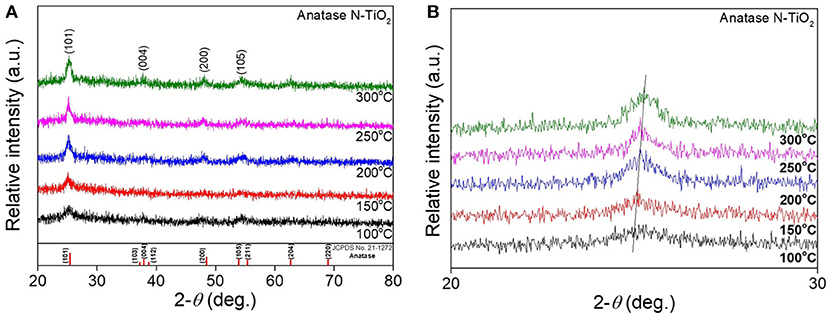
Figure 3. XRD analysis of (A) N-TiO2 nanoparticles at different calcination temperature and (B) an enlarged (101) peak.
To analyze a non-agglomerated single nanoparticle, a well-dispersed colloid solution was loaded onto a Cu grid to perform TEM analysis. According to the TEM images of amorphous N-TiO2 structures in Figures 4a,b, there were no signs of lattice fringes in the nanoparticles that matched the XRD analysis in Figure 2. The primary particle size distribution of amorphous N-TiO2 in Figure 4c revealed a primary mean particle size of 6.57 nm, which was smaller than that in the SEM images mentioned previously (in Figure 2). After calcination at 200°C, the polycrystalline structure with a ring SAED pattern identified the anatase phase of N-TiO2 with a lattice plane of (101), (004), (200), and (105) in Figures 4d–f. The mean primary particle size was 8.37 nm, indicating a minor growth in morphology after calcination (Figure 4g).
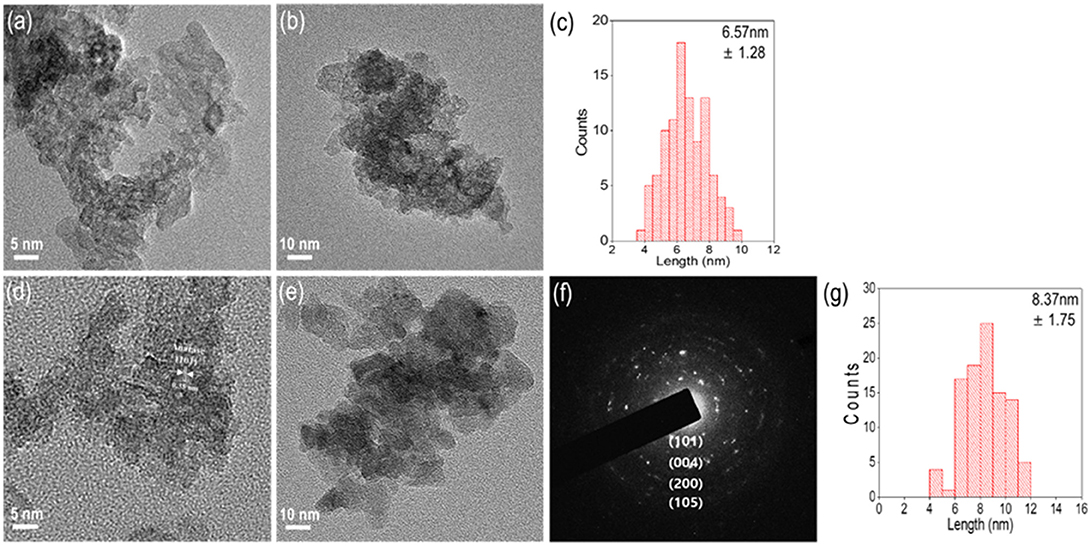
Figure 4. TEM images of an N-TiO2 nanoparticle synthesized at 15 mmol electrolyte under (a) amorphous high resolution, (b) low resolution, (c) size distribution, (d) 200°C calcined anatase high resolution, (e) low resolution, (f) anatase SAED pattern, and (g) the size distribution.
XPS Analysis of N-TiO2 Nanoparticles From Different Calcination Temperatures
The N doping concentration in the TiO2 lattice primarily influenced the electronic structure according to the doping position and state. Thus, synthesized N-TiO2 nanoparticles at different calcination temperatures were analyzed via XPS to compare the dopant tendency, as can be seen in Figure 5. The 1s peak located at 284.8 eV was used to calculate the peak shift. The peak at 398.7 eV in Figures 5A,B was evidence of the replacement of N dopants instead of O sites with N-Ti-O bonds (Mohamed et al., 2015). When the N 1s state at 399.6 eV, which was identical and compared to the interstitial doping state with N-Ti-O bonds (Figure 5C), it could be confirmed that the N concentration decreased dramatically from 0.54 to 0.4 at.% by increasing the calcination temperature and lowering the intensity of the N peak, as summarized in Figure 5D, which was consistent with that reported by Cheng et al. (2012). To discuss the interstitial and substitutional N doping states in TiO2 lattices, the energy conservation law equation was adapted:
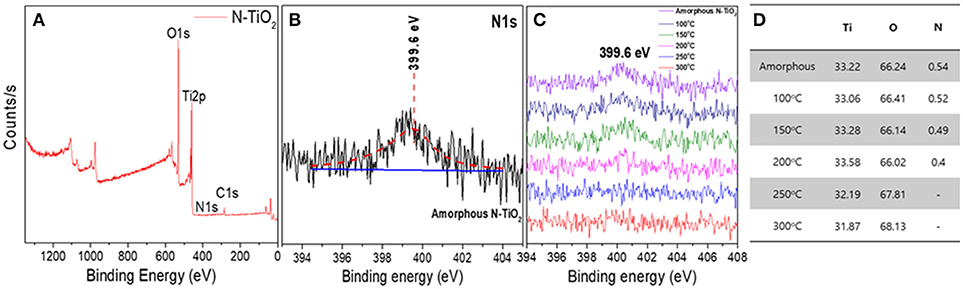
Figure 5. (A) XPS analysis of amorphous N-TiO2 showing (B) an enlarged N1s peak, (C) N1s peak at various calcination temperature, and (D) the elemental content.
where ETiO2:N and ETiO2 are the total energies for N-doped TiO2 and pure TiO2, EN2 and EO2 indicate the gas energies of N2 and O2 molecules, and m and n are integers of doped N atoms and substituted O atoms. According to this theory, energies tended to increase when the N doping level increased by acting as a formed impurity, making it more difficult to achieve a higher doping condition. Also, doping with N atoms in the lattice instead of O atoms required greater bonding energies; interstitial doping was more generally preferable (Zhao and Liu, 2008). In this scenario, the plasma enhanced electrolysis reaction using 5–15 mmol nitric acid could only yield interstitial N doped TiO2 nanoparticles.
Band Gap Analysis Depending on N Content
Figure 6 and Figure S1 shows the diffuse reflectance spectra of Degussa P-25, amorphous, and various N-TiO2 nanoparticle samples calcined at 100, 150, 200, 250, and 300°C, which possess various N doping molar ratios. The peaks of each sample showed absorptions between 300 and 400 nm in Figure 6A and the enlarged peaks in Figure 6B, which exhibited a calculated band gap of 3.4, 3.0, 2.96, 2.94, 2.94, 2.97, and 2.98 eV, respectively. The band gap values exhibited a tendency to red shift toward lower wavelengths with an increase in N doping content that strongly affected the absorption region. Thus, it could be anticipated that nitrogen sources from nitric acid reacted with Ti ions during plasma generation in a form of interstitial doping and modifying the energy state of the TiO2 nanoparticle band gap, which could be reduced toward the visible region.
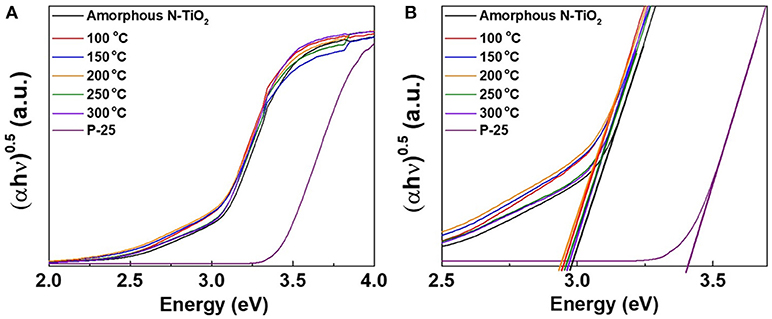
Figure 6. (A) Band gap analysis using UV-vis spectroscopy at different calcination temperature and (B) enlarged band gap peaks.
Photocatalytic Activity Depending on N Doping Content and Crystallinity
To observe and compare photocatalytic activity depending on the calcination temperature and N doping content ratio, samples were mixed with a 1 × 10⁻⁵ MO solution and the degradation efficiency was analyzed. In Figures 7A–H, the as-prepared solution was irradiated with visible light (>400 nm) and the photocatalytic decomposition process was initiated. Degussa P-25 in Figure 7A, a standard TiO2 nanopowder, exhibited a reduced degradation activity of the MO solution, which was only 21% under visible region irradiation. The calcined samples in Figures 7B–F at 100–300°C of the anatase phase with various degrees of N doping and crystallinity exhibited an enhanced maximum efficiency activity of 91% that was 4 times greater than the degradation performance of P-25 within a reaction period of 6 h. The 200°C calcined N-TiO2 nanoparticles in Figure 7D yielded the greatest photodegradation results and recyclability was measured by cycling test in Figure S2. These results indicated that the anatase structure with 0.4 at.% N doping performed much better than the P-25 standard nanoparticles; the other calcination temperature samples yielded somewhat unpredictable phenomena, which should be discussed with regard to crystallinity and N doping content. The band gap of TiO2 generally depended on the electron state of the doping species and content. Among those, the N doping effect was widely accepted; in the TiO2 crystalline lattice, N incorporated and modified the electronic band structure, forming an N 2p band above the original O 2p valance band leading to the formation of a narrower band gap of minimum 2.5 eV and shifting the absorption region toward that of visible light. Undoped anatase TiO2 structure has larger band gap of 3.2 eV, which cannot be excited with visible light. On the other hand, when the N-doped TiO2 was exposed in the visible region, valence band at N 2p state above original O 2p reduces band gap and generates electrons in the conduction band while remaining holes in the valence band. The generated electrons on conduction band captures oxygen molecules in solution which produces highly reactive superoxide anions and hydroxyl radicals on the surface while holes in the valence band produces highly oxidative hydroxyl radicals by reacting with OH− ions (Ansari et al., 2016). Not only N doping but also the Ti3+ donor contributed toward the absorption of light. Under visible light irradiation, nanoparticles excited and produced electron-hole pairs, which diffused into the particle surface. These electrons reduced Ti4+ into Ti3+ species that existed under the conduction band unless they were not trapped (Yang et al., 2010). However, prior studies proposed and certified that the N state above the valance band and Ti3+ that was produced by Ti4+ capturing electrons on the 1.2 eV conduction band that narrowed the band gap state could act as electron traps near the oxygen vacancy sites, reducing the electron-hole recombination duration time. Another parameter that affected the photodegradation efficiency was the crystallinity of the nanoparticles. It was already known that an amorphous-like layer of nanoparticles would occur due to its adsorption of water molecules on the particle surface. This would reduce the catalytic performance by masking interactions between particles and dye molecules. By removing the adsorbed species and increasing crystallinity, the photocatalytic properties could be enhanced (Yang et al., 2011). Thus, the conditions to obtain the highest photocatalytic properties within the visible light region should be optimized by adjusting the degree of crystallinity and N doping content (Jang et al., 2001; Zhoa et al., 2008; Wang et al., 2009). Following this approach, N-TiO2 calcined at 100°C with a doping content of 0.52 at.% could be applied as a trapping agent; the photodegradation efficiency was reduced compared to the 200°C condition. Additionally, at lower calcination temperatures, physically embedded or adsorbed water molecules and applied electrolytes on the surface were crucial factors that limited active sites, motivating the reduction in degradation efficiency. At conditions >250°C, negligible N doping content was observed due to an unstable state amid a highly crystalline structure; the poor degradation properties compared to P25 indicated that N doping was passivated by oxidation and returning the material to its original anatase structure while widening the band gap, which would limit its contribution toward enhancement of the visible light region catalyst.
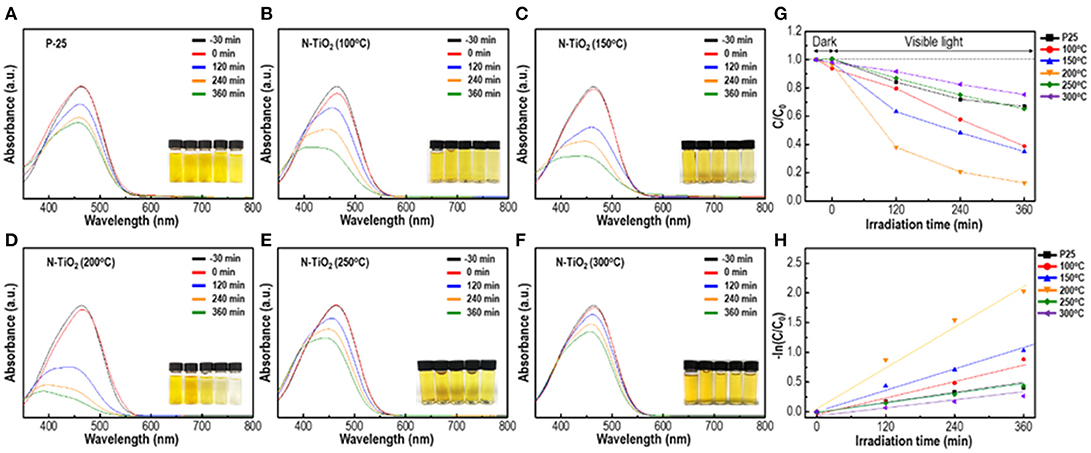
Figure 7. Photocatalytic activity of N-TiO2 within the visible region depending on different calcination temperature: (A) P-25, (B) 100°C, (C) 150°C, (D)200°C, (E) 250°C, (F) 300°C, (G) Photocatalytic efficiency, and (H) the plot of-In(C0/C).
Photoluminescence Analysis From Various Calcination Temperatures
To evaluate the radiative recombination of excited electrons and holes, synthesized N-TiO2 with 200°C calcined samples were analyzed via PL spectra under an excitation wavelength of 290 nm and compared to an undoped P-25 TiO2 powder reference in Figure 8. Excited peaks in the spectra were observed at 390, 424, 441, and 452 nm indicating different emission sources. The peak at 390 nm could be attributed to the conduction to valence band energy state transition, peaks at 424 and 452 nm were signals from free excitations at the band edge and the excitation peak at 441 nm was due to localized self-trapped excitons (Jagadale et al., 2008; Kho et al., 2010; Ablat et al., 2014). In addition to the PL analysis, the intensity virtually decreased for the 200°C calcined sample, showing that the lifetimes of excited electrons and holes with regard to the N doped TiO2 nanoparticles were greatly enhanced and contributed to decomposition reactions with organics until the electrons and holes recombined. These results coincided with the photocatalytic activity and XPS analysis showing that for temperatures >250°C, the N doping content was eliminated and the band gap recovered to its original value. Thus, photocatalytic activity would only occur within the UV region.
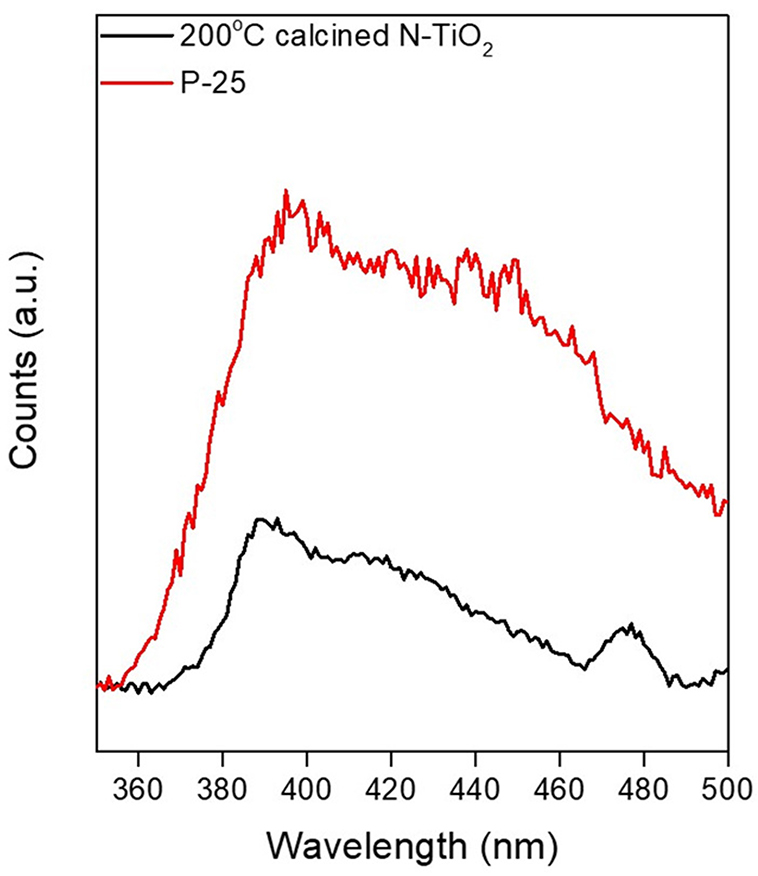
Figure 8. PL spectra of P-25 TiO2 and 200°C calcined 0.4 at.% N-TiO2.
Growth Mechanism of N-TiO2 Nanoparticles via Plasma Enhanced Electrolysis
To clarify the growth mechanism of the N-TiO2 nanoparticles using plasma assisted electrolysis, a schematic diagram can be seen in Figure 9 with the following description: (1) During the initial stage, low voltages produced a porous thin TiO2 oxide layer due to anodization during the pre-spark treatment period. (2) This increased the resistivity between the anode-electrolyte, forming an electric field strong enough to liberate and form as gas enveloped the anode surface and initially increased the applied voltage. (3) High voltages greater than the breakdown voltage at the electron avalanche birthplace excited the electrolyte near the anode via ionization and dissociation, transforming gases into ions such as NO2−, N2−, and O2−, which were subsequently localized onto the anode surface by applying considerable kinetic energy (Mikheev et al., 2015). (4) The ionized gaseous layer provided sufficient energy to initiate Joule heating, which entailed high temperatures and pressures, forming a plasma discharge within the gas envelope. Such arc plasma created Ti4+ metal cations from the outer surface of the anode into the electrolyte solution while the plasma gradually penetrated the inner part of the anode. (5) The metal cations then reacted with the as-prepared anionic gaseous species; the ionized cations initially reacted with N species from the ionization of nitric acid, a doping source of nitrogen, forming N-Ti-O bond structures within the Ti lattice through nucleation and growth mechanism; N-TiO2 nanoparticles were subsequently produced and assisted by controlled temperature induced cooling processes (Cheng et al., 2012). Moreover, the scarcity of existing anions in solution could be attributed to the repression of particle formation; acid-based nanoparticle synthesis conditions would prevent agglomeration between particles.
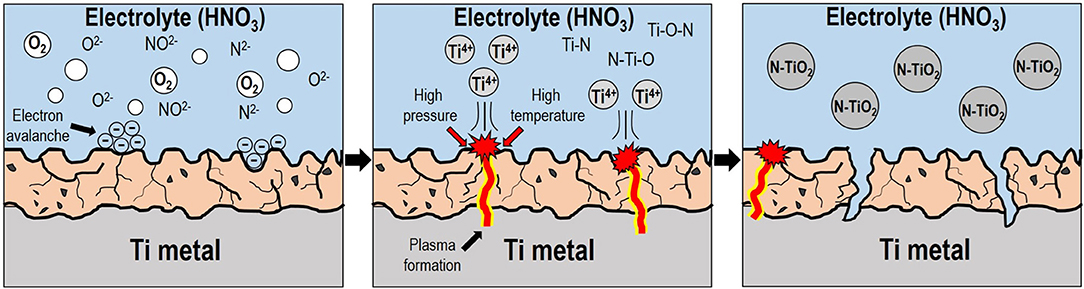
Figure 9. Schematic diagram of the N-TiO2 nanoparticle synthetic mechanism via plasma enhanced electrolysis.
Conclusions
Through the adoption of a novel synthetic method for amorphous N doped TiO2 nanoparticles using plasma enhanced electrolysis, massive N-doped TiO2 nanoparticles could be produced by merely supplying sufficient voltage to the anode, which was a metal source. This was because the synthetic phenomenon of the metal oxide nanoparticles occurred simultaneously via plasma generation with a rapid reaction.
Arc plasma formation was performed by applying a 500 V AC electric field to the nitric acid electrolyte. The particle morphology and size was verified from 12.1 to 24.7 nm relying on various nitric acid concentrations between the range of 5–15 mmol influenced by repulsive forces during nucleation. The N doping content and N-TiO2 nanoparticle crystallinity could be controlled by varying the calcination conditions and completely transforming the amorphous structure to anatase, enabling the control of N doping content from 0.54 to 0.4 at.%. N-TiO2 nanoparticles started to be synthesized just after applying voltage to the anode due to plasma generation, entailing a high temperature and pressure. The N-TiO2 nanoparticles synthesized after calcination at 200°C featured 0.4 at.% of N doping content and exhibited the greatest MO degradation performance of 91% in the visible region, which could be attributed to a narrow band gap structure due to N doping; PL analysis also revealed the most delayed recombination rate as well (see Figures 6, 7). Thus, this one-step metal-direct synthetic method via plasma generation demonstrated great potential for the novel and high-quality synthesis of N-doped metal oxide nanoparticles and could be scaled-up for industrial applications.
Author Contributions
TK prepared in writing this paper work through experiment and data analysis. G-MG helped measuring photocatalytic activities of nanoparticles. H-BC helped and advised result of this paper and modified it as logical, YS helped searching for the related information about this paper. C-GL and Y-HC equally contributed to this manuscript and accepted responsibility for conduct of research and final approval.
Conflict of Interest Statement
The authors declare that the research was conducted in the absence of any commercial or financial relationships that could be construed as a potential conflict of interest.
Acknowledgments
This study was supported by the Korea Institute of Energy Technology Evaluation and Planning (KETEP), which is funded by the Ministry of Trade, Industry and Energy of the Republic of Korea (No. 20152510101950), by the Nano•Material Technology Development Program through the National Research Foundation of Korea (NRF) funded by the Ministry of Science, ICT and Future Planning (No. 2016M3A7B4900044) and the Future Materials Discovery Program through the National Research Foundation of Korea (NRF) funded by the Ministry of Science, ICT & Future Planning (NRF-2016M3D1A1027836).
Supplementary Material
The Supplementary Material for this article can be found online at: https://www.frontiersin.org/articles/10.3389/fchem.2018.00458/full#supplementary-material
References
Ablat, A., Wu, R., Jian, J., Jiang, X., Mamat, M., and Li, J. (2014). Room temperature ferromagnetism of N-doped TiO2 nanowires. Mater. Lett. 132, 86–89. doi: 10.1016/j.matlet.2014.06.040
Alqadi, M. K., Abo Noqtah, O. A., Alzoubi, F. Y., Alzouby, J., and Aljarrah, K. (2014). PH effect on the aggregation of silver nanoparticles synthesized by chemical reduction. Mater. Sci. Poland 32, 107–111. doi: 10.2478/s13536-013-0166-9
Ansari, S. A., Khan, M. M., Ansari, M. O., and Cho, M. H. (2016). Nitrogen-doped titanium dioxide (N-doped TiO2) for visible light photocatalysis. New J. Chem. 40, 3000–3009. doi: 10.1039/c5nj03478g
Aware, D. V., and Jadhav, S. S. (2015). Synthesis, characterization and photocatalytic applications of Zn-doped TiO2 nanoparticles by sol–gel method. Appl. Nanosci. 6, 965–972. doi: 10.1007/s13204-015-0513-8
Ba-abbad, M. M., Kadhum, A. A. H., Mohamad, A. B., Takriff, M. S., and Sopian, K. (2012). Synthesis and catalytic activity of TiO2 nanoparticles for photochemical oxidation of concentrated chlorophenols under direct solar radiation. Int. J. Electrochem. Sci. 7, 4871–4888.
Cao, Y., Tan, H., Shi, T., Tang, T., and Li, J. (2008). Preparation of Ag-doped TiO2 nanoparticles for photocatalytic degradation of acetamiprid in water. J. Chem. Tech. Biotech. 83, 546–552. doi: 10.1002/jctb.1831
Caratto, V., Setti, L., Campodonico, S., Carnasciali, M. M., Botter, R., and Ferretti, M. (2012). Synthesis and characterization of nitrogen-doped TiO2 nanoparticles prepared by sol–gel method. J. Sol-Gel Sci. Technol. 63, 16–22. doi: 10.1007/s10971-012-2756-0
Cheng, X., Yu, X., Xing, Z., and Wan, J. (2012). Enhanced photocatalytic activity of nitrogen doped TiO2 anatase nano-particle under simulated sunlight irradiation. Energy Proc. 16, 598–605. doi: 10.1016/j.egypro.2012.01.096
Dong, H., Zeng, G., Tang, L., Fan, C., Zhang, C., He, X., et al. (2015). An overview on limitations of TiO2-based particles for photocatalytic degradation of organic pollutants and the corresponding countermeasures. Water Res. 79, 128–146. doi: 10.1016/j.watres.2015.04.038
Dunnill, C. W., Ansari, Z., Kafizas, A., Perni, S., Morgan, D. J., and Wilson, M. (2011). Visible light photocatalysts—N-doped TiO2 by sol–gel, enhanced with surface bound silver nanoparticle islands. J. Mater. Chem. 21, 11854–11861. doi: 10.1039/c1jm11557j
Galinska, A., and Walendziewski, J. (2005). Photocatalytic water splitting over Pt-TiO2 in the presence of sacrificial reagents. Energy Fuels 19, 1143–1147. doi: 10.1021/ef0400619
Gao, Y., Feng, Y., Zhang, B., Zhang, F., Peng, X., and Liu, L. (2014). Double-N doping: a new discovery about N-doped TiO2 applied in dye-sensitized solar cells. RSC Adv. 4, 16992–16998. doi: 10.1039/C4RA00053F
Jagadale, T. C., Takale, S. P., Sonawane, R. S., Joshi, H. M., Patil, S. I., and Kale, B. B. (2008). N-doped TiO2 nanoparticle based visible light photocatalyst by modified peroxide sol-gel method. J. Phys. Chem. C 112, 14595–14602. doi: 10.1021/jp803567f
Jang, H. D., Kim, S. K., and Kim, S. J. (2001). Effect of particle size and phase composition of titanium dioxide nanoparticles on the photocatalytic properties. J. Nanomat. Res. 3, 141–147. doi: 10.1023/A:1017948330363
Kho, Y. K., Iwase, A., Teoh, W. Y., Madler, L., Kudo, A., and Amal, R. (2010). Photocatalytic H2 evolution over TiO2 nanoparticles. The synergistic effect of anatase and rutile. J. Phys. Chem. C 114, 2821–2829. doi: 10.1021/jp910810r
Kim, T. H., Eom, N. S. A., Kang, S.-O., and Choa, Y.-H. (2016). Plasma-assisted electrolytic synthesis of In(OH)3 nanocubes for thermal transformation into In2O3 nanocubes with a controllable Sn content. RSC Adv. 6, 20337–20342. doi: 10.1039/c5ra25489b
Li, L., and Liu, C.-Y. (2009). Facile synthesis of anatase-brookite mixed-phase N-doped TiO2 nanoparticles with high visible-light photocatalytic activity. Euro. J. Inorg. Chem. 25, 3727–3733. doi: 10.1002/ejic.200900369
Lin, Y., Li, D., Hu, J., Xiao, G., Wang, J., Li, W., et al. (2012). Highly efficient photocatalytic degradation of organic pollutants by PANI-modified TiO2 composite. J. Phys. Chem. C 116, 5764–5772. doi: 10.1021/jp211222w
Liu, G., Sun, C., Yang, H. G., Smith, S. C., Wang, L., and Lu, G. Q. (2010). Nanosized anatase TiO2 single crystals for enhanced photocatalytic activity. Chem. Commun. 46, 755–757. doi: 10.1039/b919895d
Mattioli, G., Bonapasta, A. A., Bovi, D., and Giannozzi, P. (2014). Photocatalytic and photovoltaic properties of TiO2 nanoparticles investigated by Ab initio simulations. J. Phys. Chem. C 118, 29928–29942. doi: 10.1021/jp509830w
Mikheev, A. Y., Girn, A. V., Vakhteev, E. V., Alekseeva, E. G., and Ravodina, D. V. (2015). The formation of a surface layer during microarc oxidation of aluminum alloys. IOP Conf. Ser. Mater. Sci. Eng. 70:012002. doi: 10.1088/1757-899x/70/1/012002
Mohamed, M. A., Salleh, W. N. W., Jaafar, J., Ismail, A. F., and Nor, N. A. M. (2015). Photodegradation of phenol by n-doped TiO2 anatase/rutile nanorods assembled microsphere under UV and visible light irradiation. Mater. Chem. Phys. 162, 113–123. doi: 10.1016/j.matchemphys.2015.05.033
Ni, M., Leung, M. K. H., Leung, D. Y. C., and Sumathy, K. (2007). A review and recent developments in photocatalytic water-splitting using TiO2 for hydrogen production. Renew. Sustain. Energy Rev. 11, 401–425. doi: 10.1016/j.rser.2005.01.009
Scanlon, D. O., Dunnill, C. W., Buckeridge, J., Shevlin, S. A., Logsdail, A. J., and Woodley, S. M. (2013). Band alignment of rutile and anatase TiO2. Nat. Mater. 12, 798–801. doi: 10.1038/nmat3697
Soares, G. B., Bravin, B., Vaz, C. M. P., and Ribeiro, C. (2011). Facile synthesis of N-doped TiO2 nanoparticles by a modified polymeric precursor method and its photocatalytic properties. Appl. Catal. B: Environ. 106, 287–294. doi: 10.1016/j.apcatb.2011.05.018
Sun, S., Gao, P., Yang, Y., Yang, P., Chen, Y., and Wang, Y. (2016). N-doped TiO2 nanobelts with coexposed (001) and (101) facets and their highly efficient visible-light-driven photocatalytic hydrogen production. ACS Appl. Mater. Interfaces 8, 18126–18131. doi: 10.1021/acsami.6b05244
Tang, J., Durrant, J. R., and Klug, D. R. (2008). Mechanism of photocatalytic water splitting in TiO2. Reaction of water photoholes, importance of charge carrier dynamics, and evidence for four-hole chemistry. J. Am. Chem. Soc. 130, 13885–13891. doi: 10.1021/ja8034637
Vukoje, I., Kovac, T., Dzunuzovic, J., Dzunuzovic, E., Loncarevic, D., Ahrenkiel, S. P., et al. (2016). Photocatalytic ability of visible-light-responsive TiO2 nanoparticles. J. Phys. Chem. C 120, 18560–18569. doi: 10.1021/acs.jpcc.6b04293
Wang, J., Tafen, D. N., Lewis, J. P., Hong, Z., Manivannan, A., and Zhi, M. (2009). Origin Of Photocatalytic Activity of nitrogen-doped TiO2 nanobelts. J. Amer. Chem. Soc. 131, 12290–12297. doi: 10.1021/ja903781h
Wu, G., Nishikawa, T., Ohtani, B., and Chen, A. (2007). Synthesis and characterization of carbon-doped TiO2 nanostructures with enhanced visible light response. Chem. Mater. 19, 4530–4537. doi: 10.1021/cm071244m
Wu, W. Y., Kung, W. Y., and Ting, J. M. (2011). Effect of pH values on the morphology of zinc oxide nanostructures and their photoluminescence spectra. J. Amer. Ceram. Soc. 94, 699–703. doi: 10.1111/j.1551-2916.2010.04146.x
Yang, G., Jiang, Z., Shi, H., Xiao, T., and Yan, Z. (2010). Preparation of highly visible-light active N-doped TiO2 photocatalyst. J. Mater. Chem. 20, 5301. doi: 10.1039/c0jm00376j
Yang, L., Li, G., Hu, W., Zhao, M., Sun, L., and Zheng, J. (2011). Control over the crystallinity and defect chemistry of YVO4 nanocrystals for optimum photocatalytic property. Euro. J. Inorg. Chem. 2011, 2211–2220. doi: 10.1002/ejic.201001341
Yu, H., Ye, L., Zhang, T., Zhou, H., and Zhao, T. (2017). Synthesis, characterization and immobilization of N-doped TiO2 catalysts by a reformed polymeric precursor method. RSC Adv. 7, 15265–15271. doi: 10.1039/c6ra27187a
Yu, H., Zheng, X., Yin, Z., Tag, F., Fang, B., and Hou, K. (2007). Preparation of nitrogen-doped TiO2 nanoparticle catalyst and its catalytic activity under visible light. Chin. J. Chem. Eng. 15, 802–807. doi: 10.1016/s1004-9541(08)60006-3
Zhao, Z., and Liu, Q. (2008). Mechanism of higher photocatalytic activity of anatase TiO2 doped with nitrogen under visible-light irradiation from density functional theory calculation. J. Phys. D Appl. Phys. 41:025105. doi: 10.1088/0022-3727/41/2/025105
Zhoa, Y., Qiu, X., and Burda, C. (2008). The effects of sintering on the photocatalytic activity of n-doped TiO2 nanoparticles. Chem. Mater. 20, 2629–2636. doi: 10.1021/cm703043j
Keywords: plasma enhanced electrolysis, amorphous N-doped TiO2, visible region photocatalyst, metal-direct synthesis, nanoparticle synthesis
Citation: Kim TH, Go G-M, Cho H-B, Song Y, Lee C-G and Choa Y-H (2018) A Novel Synthetic Method for N Doped TiO2 Nanoparticles Through Plasma-Assisted Electrolysis and Photocatalytic Activity in the Visible Region. Front. Chem. 6:458. doi: 10.3389/fchem.2018.00458
Received: 06 July 2018; Accepted: 13 September 2018;
Published: 02 October 2018.
Edited by:
Fan Dong, Chongqing Technology and Business University, ChinaReviewed by:
Guohong Wang, Hubei Normal University, ChinaJingyu Wang, Huazhong University of Science and Technology, China
Copyright © 2018 Kim, Go, Cho, Song, Lee and Choa. This is an open-access article distributed under the terms of the Creative Commons Attribution License (CC BY). The use, distribution or reproduction in other forums is permitted, provided the original author(s) and the copyright owner(s) are credited and that the original publication in this journal is cited, in accordance with accepted academic practice. No use, distribution or reproduction is permitted which does not comply with these terms.
*Correspondence: Chan-Gi Lee, cglee@iae.re.kr
Yong-Ho Choa, choa15@hanyang.ac.kr