Hlf Expression Marks Early Emergence of Hematopoietic Stem Cell Precursors With Adult Repopulating Potential and Fate
 Wanbo Tang1
  Jian He1 Tao Huang1
  Zhijie Bai1 Chaojie Wang2 Haizhen Wang2 Ruichuang Yang3 Yanli Ni4 Jun Hou3 Junliang Wang5 Jie Zhou4 Yingpeng Yao2 Yandong Gong4 Siyuan Hou2
  Bing Liu1,2,4*
  Yu Lan2*
- 1State Key Laboratory of Proteomics, Academy of Military Medical Sciences, Academy of Military Sciences, Beijing, China
- 2Key Laboratory for Regenerative Medicine of Ministry of Education, School of Medicine, Institute of Hematology, Jinan University, Guangzhou, China
- 3National Clinical Research Center for Infectious Diseases, Fifth Medical Center of Chinese PLA General Hospital, Beijing, China
- 4State Key Laboratory of Experimental Hematology, Fifth Medical Center of Chinese PLA General Hospital, Beijing, China
- 5Department of Radiotherapy, Fifth Medical Center of Chinese PLA General Hospital, Beijing, China
In the aorta-gonad-mesonephros (AGM) region of mouse embryos, pre-hematopoietic stem cells (pre-HSCs) are generated from rare and specialized hemogenic endothelial cells (HECs) via endothelial-to-hematopoietic transition, followed by maturation into bona fide hematopoietic stem cells (HSCs). As HECs also generate a lot of hematopoietic progenitors not fated to HSCs, powerful tools that are pre-HSC/HSC-specific become urgently critical. Here, using the gene knockin strategy, we firstly developed an Hlf-tdTomato reporter mouse model and detected Hlf-tdTomato expression exclusively in the hematopoietic cells including part of the immunophenotypic CD45– and CD45+ pre-HSCs in the embryonic day (E) 10.5 AGM region. By in vitro co-culture together with long-term transplantation assay stringent for HSC precursor identification, we further revealed that unlike the CD45– counterpart in which both Hlf-tdTomato-positive and negative sub-populations harbored HSC competence, the CD45+ E10.5 pre-HSCs existed exclusively in Hlf-tdTomato-positive cells. The result indicates that the cells should gain the expression of Hlf prior to or together with CD45 to give rise to functional HSCs. Furthermore, we constructed a novel Hlf-CreER mouse model and performed time-restricted genetic lineage tracing by a single dose induction at E9.5. We observed the labeling in E11.5 AGM precursors and their contribution to the immunophenotypic HSCs in fetal liver (FL). Importantly, these Hlf-labeled early cells contributed to and retained the size of the HSC pool in the bone marrow (BM), which continuously differentiated to maintain a balanced and long-term multi-lineage hematopoiesis in the adult. Therefore, we provided another valuable mouse model to specifically trace the fate of emerging HSCs during development.
Introduction
Hematopoietic stem cells (HSCs) are a unique cell population which can differentiate into nearly all kinds of blood lineage and maintain its quantity by self-renewal throughout the lifetime (Dzierzak and Bigas, 2018). At embryonic day (E) 10.5, the first functional HSCs are detected in the aorta-gonad-mesonephros (AGM) region (Muller et al., 1994; Medvinsky and Dzierzak, 1996; de Bruijn et al., 2000, 2002; North et al., 2002). At around E11.5, AGM HSCs start to migrate and colonize the fetal liver (FL) where they rapidly expand (Sánchez et al., 1996). During the perinatal period, HSCs begin to migrate to the bone marrow (BM) where they permanently reside throughout adult life (Morrison et al., 1995; Christensen et al., 2004).
It is generally accepted that HSCs are derived from specialized endothelial cells termed hemogenic endothelial cells (HECs) through endothelial-to-hematopoietic transition in mid-gestational embryos (Zovein et al., 2008; Chen et al., 2009; Dzierzak and Bigas, 2018; Neo et al., 2021). During this process, HECs bud from the dorsal aorta and then aggregate to form intra-aortic hematopoietic clusters (IAHCs) (Boisset et al., 2010). The earliest IAHCs appear at E9.5, and their number peaks to about 600 at E10.5 (Yokomizo and Dzierzak, 2010). IAHCs comprise progenitors that simultaneously express endothelial surface markers, such as CD31 and VE-Cadherin and hematopoietic marker Runx1 (Taoudi et al., 2008; Yamamoto et al., 2013; Solaimani Kartalaei et al., 2015). Pre-hematopoietic stem cells (pre-HSCs) are an intermediate population between HECs and HSCs (Hou et al., 2020), which do not have the capacity to repopulate irradiated recipients directly but can obtain this capacity after being co-cultured with stromal cells. Pre-HSCs are considered to be localized mainly within the IAHCs and reach approximately 50 at around E11 (Taoudi et al., 2008; Rybtsov et al., 2011, 2016; Boisset et al., 2015; Baron et al., 2018). These cells experience two stages including type I pre-HSCs (CD45–, known as T1 pre-HSCs) and type II pre-HSCs (CD45+, known as T2 pre-HSCs), which can both be detected in the E11.0 AGM region (Taoudi et al., 2008; Rybtsov et al., 2011; Zhou et al., 2016).
To isolate and decipher the embryonic hematopoietic populations, several researches have made great efforts in developing novel enrichment strategies or mouse models over the past few decades. With the help of the genetic lineage tracing mouse model VE-Cadherin-Cre, HSCs are proven to be derived from endothelial cells (Zovein et al., 2008; Chen et al., 2009). The progenies of endothelial cells contribute to a fraction of hematopoietic cells in adult BM, thymus, and spleen when labeled at E9.5 (Zovein et al., 2008; Chen et al., 2009). Additionally, time-lapse confocal imaging of Ly6A-GFP embryo slices confirms that aortic endothelial cells expressing GFP can generate Ly6A-GFP+Kit+CD41+ hematopoietic stem progenitor cells (HSPCs) at E10.5 (Boisset et al., 2010). The iterations of index-sorting analyses on Gata2IRESVenus reporter mice suggest that the functional HSCs emerge in the E11 IAHCs with a quantity of one to two cells (Vink et al., 2020). Recently, HECs are proven to be highly enriched by a cocktail of surface markers named PK44 (CD41–CD43–CD45–CD31+CD201+Kit+CD44+) or the newly established reporter Neurl3-EGFP (Hou et al., 2020). Previous studies verified T1 and T2 pre-HSCs exhibit phenotypes as VE-Cadherin+CD45–CD41lo and VE-Cadherin+CD45+ in the E11.5 AGM region, respectively (Taoudi et al., 2008; Rybtsov et al., 2011). Notably, functional T1 and T2 pre-HSCs are identified to be highly enriched by CD201 and, thus, are further precisely characterized as CD31+CD45–CD41loKit+CD201hi and CD31+CD45+Kit+CD201hi at E11.0, respectively (Zhou et al., 2016).
Hlf is a transcription factor that belongs to the proline and acidic amino acid-rich (PAR) basic leucine zipper (bZip) family. Hlf is initially recognized in leukemia, and recent studies have identified its high expression in BM HSCs and essential role in maintaining hematopoiesis in a quiescent state (Gazit et al., 2013; Komorowska et al., 2017; Wahlestedt et al., 2017). In embryos, Hlf is specially expressed in IAHCs and FL HSCs without marking yolk sac erythro-myeloid progenitors, and its expression level is up-regulated along the maturation of HSCs during development (Yokomizo et al., 2019).
Recently, we identified Hlf as a signature gene for pre-HSCs in addition to HSCs (Zhou et al., 2016), suggesting that Hlf is a suitable molecule for studying the emergence of early pre-HSCs and their contribution to adult hematopoiesis. Therefore, we newly constructed Hlf-tdTomato and Hlf-CreER mouse models to investigate the dynamic marker changes of pre-HSCs and the adult fate of pre-HSCs labeled by Hlf-CreER.
Materials and Methods
Mice
Mice were fed at the Laboratory Animal Center of Academy of Military Medical Sciences in accordance with institutional guidelines. Mouse operations were approved by the Animal Care and Use Committee of the institute. The HlftdTomato/+ reporter mouse line and the HlfCreER/+ lineage tracing mouse line were generated with the CRISPR/Cas9-mediated gene knockin technique by Beijing Biocytogen and Shanghai Model Organisms Center, respectively. The ROSAZsGreen/ZsGreen reporter mice were described previously (Madisen et al., 2010). CD45.1/1 mice were purchased from Jackson Laboratory. CD45.2/2 mice were purchased from SPF (Beijing) Biotechnology Co., Ltd. All mice were maintained on C57BL/6 background. Embryos were staged by the number of somite pair (sp): E10.5, 36–40 sp; E11.0, 41–45 sp; and E11.5, 46–50 sp. The AGM region was dissected as previously described (Li et al., 2012).
Flow Cytometry
Cells were analyzed and sorted by flow cytometers FACSymphony and FACS Aria 2 (BD Biosciences), respectively. Data were analyzed by FlowJo software (Tree Star). The antibodies with their supplier, clone number, dilution ratio, and catalog number are listed as follows: BD Biosciences: Rat anti-mouse Ly6A/E-BV605 (D7, 1:100, Cat#563288), Rat anti-mouse CD45-BV421 (30-F11, 1:40, Cat#563890), Rat monoclonal anti-mouse CD41-APC (MWReg30, 1:40, Cat#740903), Rat anti-mouse CD43-PE-Cy7 (S7, 1:50, Cat#562866), Rat anti-mouse CD31-BV786 (MEC13.3, 1:200, Cat#740870), and Rat anti-mouse TER-119-BV421 (TER-119, 1:40, Cat#566248); Biolegend: Rat monoclonal anti-mouse CD117 (c-kit)-BV650 (ACK2, 1:100, Cat#135125), Rat monoclonal anti-mouse CD150-BV785 (TC15-12F12.2, 1:100, Cat#115937), Rat monoclonal anti-mouse CD48-BV711 (HM48-1, 1:50, Cat#103439), Rat monoclonal anti-mouse CD16/32-BV510 (93, 1:50, Cat#101333), Rat monoclonal anti-mouse/human CD44-BV510 (IM7, 1:20, Cat#103044), Rat monoclonal anti-mouse CD144-BV421 (BV13, 1:50, Cat#138013), Rat monoclonal anti-mouse Ly6G-PE-Cy7 (1A8, 1:100, Cat#127618), and Mouse monoclonal anti-mouse CD45.2-PerCP5.5 (104, 1:100, Cat#109828); eBioscience: Rat monoclonal anti-mouse CD117 (c-kit)-APC-Cy7 (2B8, 1:200, Cat#47-1171-82), Rat monoclonal anti-mouse CD48-APC-Cy7 (HM48-1, 1:100, Cat#47-0481-82), Rat monoclonal anti-mouse CD34-eFluor 660 (RAM34, 1:20, Cat#50-0314-82), Rat monoclonal anti-mouse CD34-eFluor 450 (RAM34, 1:20, Cat#48-0341-82), Rat monoclonal anti-mouse CD11b-PE-Cy7 (M1/70, 1:200, Cat#25-0112-82), Rat monoclonal anti-mouse CD11b-FITC (M1/70, 1:400, Cat#11-0112-85), Rat monoclonal anti-mouse CD201-PE (eBio1560, 1:200, Cat#12-2012-80), Rat monoclonal anti-mouse CD201-APC (eBio1560, 1:100, Cat#17-2012-82), Rat monoclonal anti-mouse CD45-PE-Cy7 (30-F11, 1:200, Cat#25-0451-82), Rat monoclonal anti-mouse CD41-APC (eBioMWReg30, 1:100, Cat#17-0411-80), Rat monoclonal anti-mouse CD135-APC (A2F10, 1:20, Cat#17-1351-82), Rat monoclonal anti-mouse TER-119-PE-Cy7 (TER-119, 1:200, Cat#25-5921-82), Rat monoclonal anti-mouse Ly6G/Ly-6C-FITC (RB6-8C5, 1:200, Cat#11-5931-86), Rat monoclonal anti-mouse B220-BV421 (RA3-6B2, 1:40, Cat#48-0452-80), Rat monoclonal anti-mouse CD4-APC-Cy7 (GK1.5, 1:200, Cat#47-0041-82), Rat monoclonal anti-mouse CD8-PE-Cy7 (53-6.7, 1:40, Cat#25-0081-82), Rat monoclonal anti-mouse CD42d-APC (1C2, 1:40, Cat#17-0421-80), Rat monoclonal anti-mouse CD3e-APC (145-2C11, 1:200, Cat#17-0031-83), Mouse monoclonal anti-mouse CD45.1-APC (A20, 1:100, Cat#17-0453-82), Rat monoclonal anti-mouse Ly6G/Ly-6C-Biotin (RB6-8C5, 1:100, Cat#13-5931-82), Rat monoclonal anti-mouse TER-119-Biotin (TER-119, 1:100, Cat#13-5921-82), Rat monoclonal anti-mouse B220-Biotin (RA3-6B2, 1:400, Cat#13-0452-82), Rat monoclonal anti-mouse CD4-Biotin (RM4-5, 1:400, Cat#13-0042-82), Rat monoclonal anti-mouse CD8a-Biotin (53-6.7, 1:100, Cat#13-0081-81), Rat monoclonal anti-mouse CD11b-Biotin (M1/70, 1:400, Cat#13-0112-82), Rat monoclonal anti-mouse CD127-Biotin (A7R34, 1:100, Cat#13-1271-81), Streptavidin APC-eFluor 780 (1:50, Cat#47-4317-82), and Streptavidin eFluor 450 (1:50, Cat#48-4317-82).
OP9-DL1 Co-culture and Transplantation Assay
The OP9-DL1 stromal cells were thawed 4 days before co-culture, and 3 × 10⁴ OP9-DL1 stromal cells (passage 3–7) were seeded into a 24-well plate the day before co-culture without irradiation. A total of 15 AGM regions were dissected and digested into single-cell suspension. The cells from AGM regions were stained with antibodies and sorted by flow cytometry with the gating strategies for indicated populations. Then, the sorted cells were seeded into a 24-well plate containing OP9-DL1 feeder cells with 3 ee (embryo equivalents) per well and incubated in α-MEM (Gibco) with 10% fetal bovine serum (Hyclone) and cytokines (100 ng/ml SCF, 100 ng/ml IL-3, and 100 ng/ml Flt3 ligand, PeproTech) for 6 days. On the fourth day, a half amount of cell culture medium mentioned above was added to the wells. Six days later, the co-cultured cells in each well were detached by 0.25% trypsin (Beyotime Biotechnology, C0203) and harvested independently for flow cytometry analysis or transplantation assay. For transplantation, male CD45.1/1 were mated with female HlftdTomato/+ (CD45.2/2) to obtain CD45.1/2 embryos. Cell suspension harvested after 6 days of co-culture were mixed with 2 × 10⁴ nucleated BM helper cells (CD45.2/2). The mixture was injected via the tail vein into 8–12-week-old female recipients (CD45.2/2) which had been exposed to a split dose of 9 Gy γ-irradiation (60Co). The recipients demonstrating ≥5% donor-derived chimerism in peripheral blood were considered as successfully reconstituted. Donor contribution to each blood lineage is calculated as: (percentage of donor cells of a given lineage in CD45+ cells/total percentage of a given lineage in CD45+ cells) × 100%; Donor contribution to LSK (Lin–Sca1+Kit+) cells is calculated as: percentage of donor cells in LSK cells × 100% (Benz et al., 2012; Li et al., 2012; Ye et al., 2017).
Immunofluorescence
Embryos were isolated and fixed with 4% paraformaldehyde for 2–4 h at 4°C, embedded in paraffin and sectioned into 5-μm slices using Leica RM2235. Sections were placed in an oven at 60°C for 15 min, deparaffinized with ethanol of gradient concentration, and subsequently placed in a microwave for 20 min at 95°C within citrate buffer (pH 6.0). The sections were cooled to room temperature and then placed in 3% H2O2 for 20 min to remove endogenous peroxidase. Sections were blocked in blocking solution (1:1, Cat#ZLI-9056, Zhongshan golden bridge) for 30 min at room temperature, and then incubated with primary antibodies overnight at 4°C. After being washed with PBS three times, sections were incubated with corresponding secondary antibodies (Zhongshan golden bridge) for 30 min at room temperature. After being washed with PBS, sections were stained with DendronFluor TSA (Histova, NEON 4-color IHC Kit for FFPE, NEFP450, 1:100, 20–60 s). After the staining of the first antigen was completed, we thoroughly eluted the primary and secondary antibodies by re-heating the slides in a microwave with citrate buffer (pH 6.0) for 20 min at 95°C, and repeated the above steps from the microwave repair step to the DendronFluor TSA staining step, so that each antigen was labeled by distinct fluorophores finally. After all the antibodies were stained, the slices were stained with DAPI (4’,6-diamidino-2-phenylindole). Images were collected by confocal microscope (Nikon Ti-E A1/ZEISS LSM 880). The primary antibodies and their clone number, dilution ratio, catalog number, and company are listed as follows: Rabbit polyclonal anti-RFP (1:1,500, Cat#600-401-379, Rockland); Rabbit monoclonal anti-Estrogen Receptor alpha (SP1, 1:200, Cat#ab16660, Abcam), Rabbit monoclonal anti-RUNX1/AML1 + RUNX3 + RUNX2 (EPR3099, 1:150, Cat#ab92336, Abcam), and Rabbit monoclonal anti-CD31 (EPR17259, 1:1,000, Cat#ab182981, Abcam). The second antibody was HRP-labeled Goat anti-Rabbit IgG polymer (1:1, Cat#PV6001, Zhongshan golden bridge).
Inducible Genetic Lineage Tracing
Tamoxifen free base (T5648-5G, Sigma) 200 mg was dissolved in 10 ml sunflower-seed oil (S5007; Sigma) and shaken overnight at the room temperature. For lineage tracing, HlfCreER/+ mice were firstly bred with ROSAZsGreen/ZsGreen mice to generate HlfCreER/+; ROSAZsGreen/+ (referred as Hlf-CreER;ZsGreen), then male Hlf-CreER;ZsGreen mice were crossed with female C57BL/6 mice. The pregnant C57BL/6 mice were administered with a single dose of tamoxifen by gavage (3 mg per 30 g body weight) at E9.5. At indicated embryonic stages, the pregnant C57BL/6 mice were sacrificed, the embryos were isolated with subsequent genotyping, and the Hlf-CreER;ZsGreen embryos were used for further flow cytometry analysis, with the ROSAZsGreen/+ embryos from the same litter serving as controls. For adult mice analysis, Hlf-CreER;ZsGreen offspring with a single dose of tamoxifen induction at E9.5 as described above were used for flow cytometry analysis.
Single Cell RNA-Seq Dataset Source
The scRNA-seq data are from our previous study (Zhou et al., 2016) and downloaded from the GEO database (GSE67120).
Results
Establishment of an Hlf-tdTomato Reporter Mouse Model
By analyzing the transcriptomic dataset we previously constructed (Zhou et al., 2016), we found that Hlf was expressed in almost all of the HSC-competent cells from embryo to adult but not in endothelial cells of the mid-gestational AGM region, with a gradual up-regulation from pre-HSCs to adult HSCs (Figure 1A). Therefore, for a better understanding about the stepwise specification of nascent HSCs, we generated an Hlf-tdTomato reporter mouse model using the gene knockin strategy to insert a P2A-tdTomato cassette between exon 4 and stop codon of Hlf gene locus without disrupting its expression (Figure 1B).
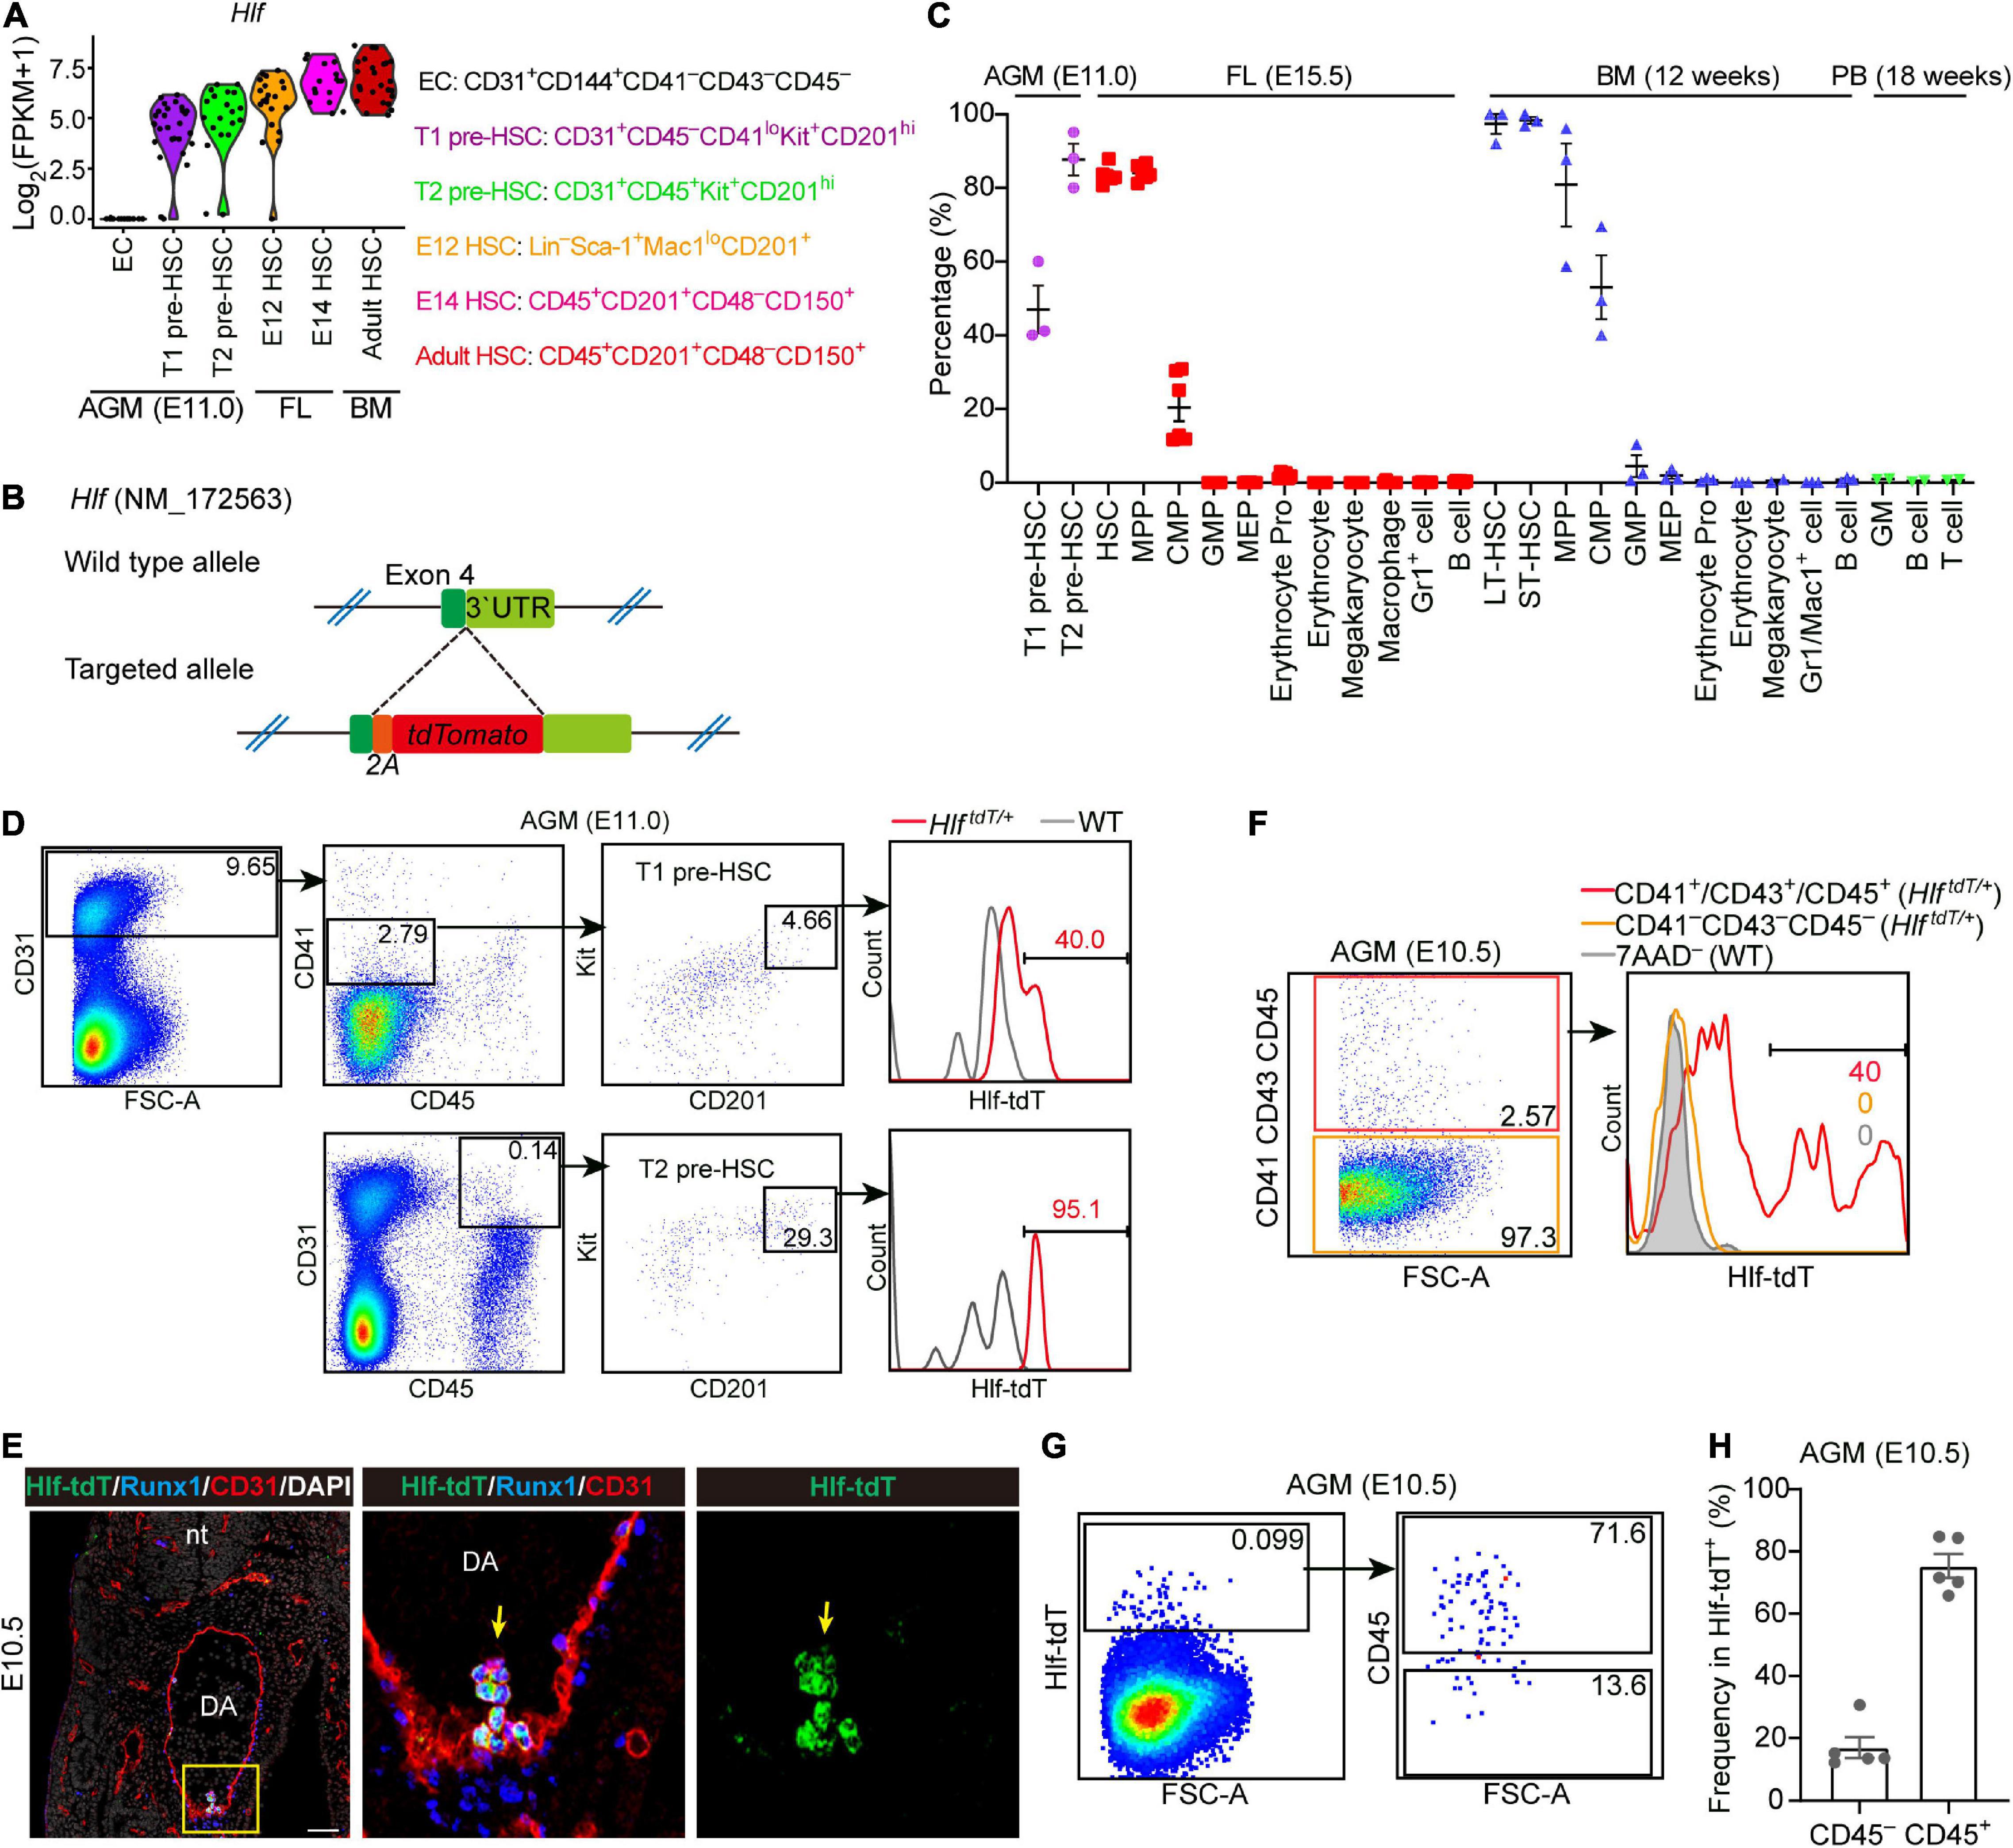
Figure 1. Establishment of an Hlf-tdTomato reporter mouse model. (A) Violin plots showing the transcription level of Hlf in six populations as indicated. Data are from GSE67120. (B) Schematic model of the gene-targeting strategy for constructing Hlf-tdTomato reporter mouse line via CRISPR/Cas9 system. (C) Graph showing the percentage of Hlf-tdTomato expression in each hematopoietic population of the E11.0 AGM region, E15.5 fetal liver (FL), adult bone marrow (BM), and peripheral blood (PB). Data are shown as means ± SEM from at least two independent experiments. MPP, multipotent progenitor; CMP, common myeloid progenitor; GMP, granulocyte-monocyte progenitor; MEP, megakaryocyte-erythroid progenitor; erythrocyte pro, erythrocyte progenitor; LT-HSC, long-term hematopoietic stem cell; ST-HSC, short-term hematopoietic stem cell. (D) Representative FACS plots showing the Hlf-tdTomato expression in T1 and T2 pre-HSCs in the AGM region of E11.0 Hlf-tdTomato embryos. Data are representative of three independent experiments. HlftdT/+, HlftdTomato/+; WT, wild type. (E) Representative immunostaining on sections from the AGM region of E10.5 Hlf-tdTomato embryos. Arrows indicate Hlf-tdTomato+ IAHCs. The two images to the right present the high magnification view of yellow box. nt, neural tube; DA, dorsal aorta. Scale bar, 50 μm. (F) Representative FACS plots showing the proportion of Hlf-tdTomato positive cells in CD41–CD43–CD45– and CD41+/CD43+/CD45+ populations in the AGM region of E10.5 Hlf-tdTomato embryos. Data are representative of two independent experiments. Genotypes are indicated in the brackets. HlftdT/+, HlftdTomato/+; WT, wild type. (G) Representative FACS plots showing the CD45 expression in Hlf-tdTomato+ cells in the AGM region of E10.5 Hlf-tdTomato embryos. (H) Graph showing the frequencies of CD45– or CD45+ cells in Hlf-tdTomato+ cells of the E10.5 AGM region. Data are shown as means ± SEM from five independent experiments.
We firstly evaluated the expression pattern of Hlf-tdTomato in hematopoietic populations of the E11.0 AGM region, E15.5 FL, and adult BM and peripheral blood by fluorescence activated cell sorting (FACS) analyses. With the use of the highly functionally enriched markers of pre-HSCs (Zhou et al., 2016), we showed that about half of the immunophenotypic T1 pre-HSCs and most if not all of T2 pre-HSCs at E11.0 were positive for Hlf-tdTomato (Figures 1C,D). Furthermore, Hlf-tdTomato was expressed in more than 80% of immunophenotypic HSCs and multi-potent progenitors, much higher than in common myeloid progenitors, but was seldom expressed in other committed progenitors and mature blood cells in E15.5 FL (Figure 1C and Supplementary Figure 1A). In adult BM, Hlf-tdTomato was expressed in almost all the immunophenotypic long-term HSCs and short-term HSCs, irrespective of the marker combinations used, and also in a predominant portion of multi-potent progenitors and in about half of common myeloid progenitors, but hardly in other progenitors and mature blood cells (Figure 1C and Supplementary Figures 1B,C). Analysis of peripheral blood showed that mature blood lineages, including granulocytes/monocytes, B cells, and T cells, lacked Hlf-tdTomato expression (Figure 1C and Supplementary Figure 1D). The expression pattern of Hlf-tdTomato in various hematopoietic populations at different developmental stages was not only basically in accordance with our transcriptomic data (Figure 1A) but also principally in line with a previous report (Yokomizo et al., 2019) validating the successful construction of the Hlf-tdTomato reporter mouse model.
We next investigated the expression of Hlf-tdTomato at E10.5 by immunostaining and flow cytometry. Immunostaining on sections of the E10.5 AGM region showed that Hlf-tdTomato was expressed in the IAHC cells, co-expressing hematopoietic transcription factor Runx1 and endothelial marker CD31, in line with a previous report (Yokomizo et al., 2019). On the other hand, Hlf-tdTomato expression was not detected in the endothelial layer of the dorsal aorta (Figure 1E). Consistently, FACS analyses indicated that Hlf-tdTomato expression was not detected in the immunophenotypic non-hematopoietic cells (CD41–CD43–CD45–) from multiple intra-embryonic sites, including the AGM region, head, trunk, and limb. In contrast, its expression was confined to the immunophenotypic hematopoietic cells (CD41+/CD43+/CD45+) (Figure 1F and Supplementary Figures 2A,B). We also noticed that only 0.069 ± 0.013% cells in the E10.5 AGM region expressed Hlf-tdTomato, in which 17.0 ± 3.4% cells were CD45-negative (Figures 1G,H). This expression pattern suggested that Hlf-tdTomato expression may initiate from CD45– pre-HSCs along HSC specification.
Hlf-tdTomato Expression in Functional CD45– Pre-HSCs in the E10.5 AGM Region
Previous studies showed that precursors of HSCs in E10.5 AGM are enriched in VE-cad+CD45– population and CD201hi population (Rybtsov et al., 2011; Hadland et al., 2017). We examined the E10.5 AGM region by FACS and found that Hlf-tdTomato expression was observed in 68.9 ± 3.6% of the CD31+CD45–Kit+CD201hi population that has been proven to enrich functional T1 pre-HSCs (Figure 2A). Subsequently, we sorted Hlf-tdTomato+ and Hlf-tdTomato– cells within the CD31+CD45–Kit+CD201hi population from the E10.5 AGM region, respectively, and co-cultured them with OP9-DL1 in vitro. After 6 days of co-culture, both Hlf-tdTomato+ and Hlf-tdTomato– groups generated typical hematopoietic clusters (Figure 2B). Progenies of both groups contained HSC-like cells with a Lin–CD45+Sca-1+CD201+ immunophenotype by FACS analysis (Hadland et al., 2017; Figure 2C). Moreover, most of these HSC-like cells expressed Hlf-tdTomato as well as Kit, further suggesting their HSC-like identity (Figure 2D).
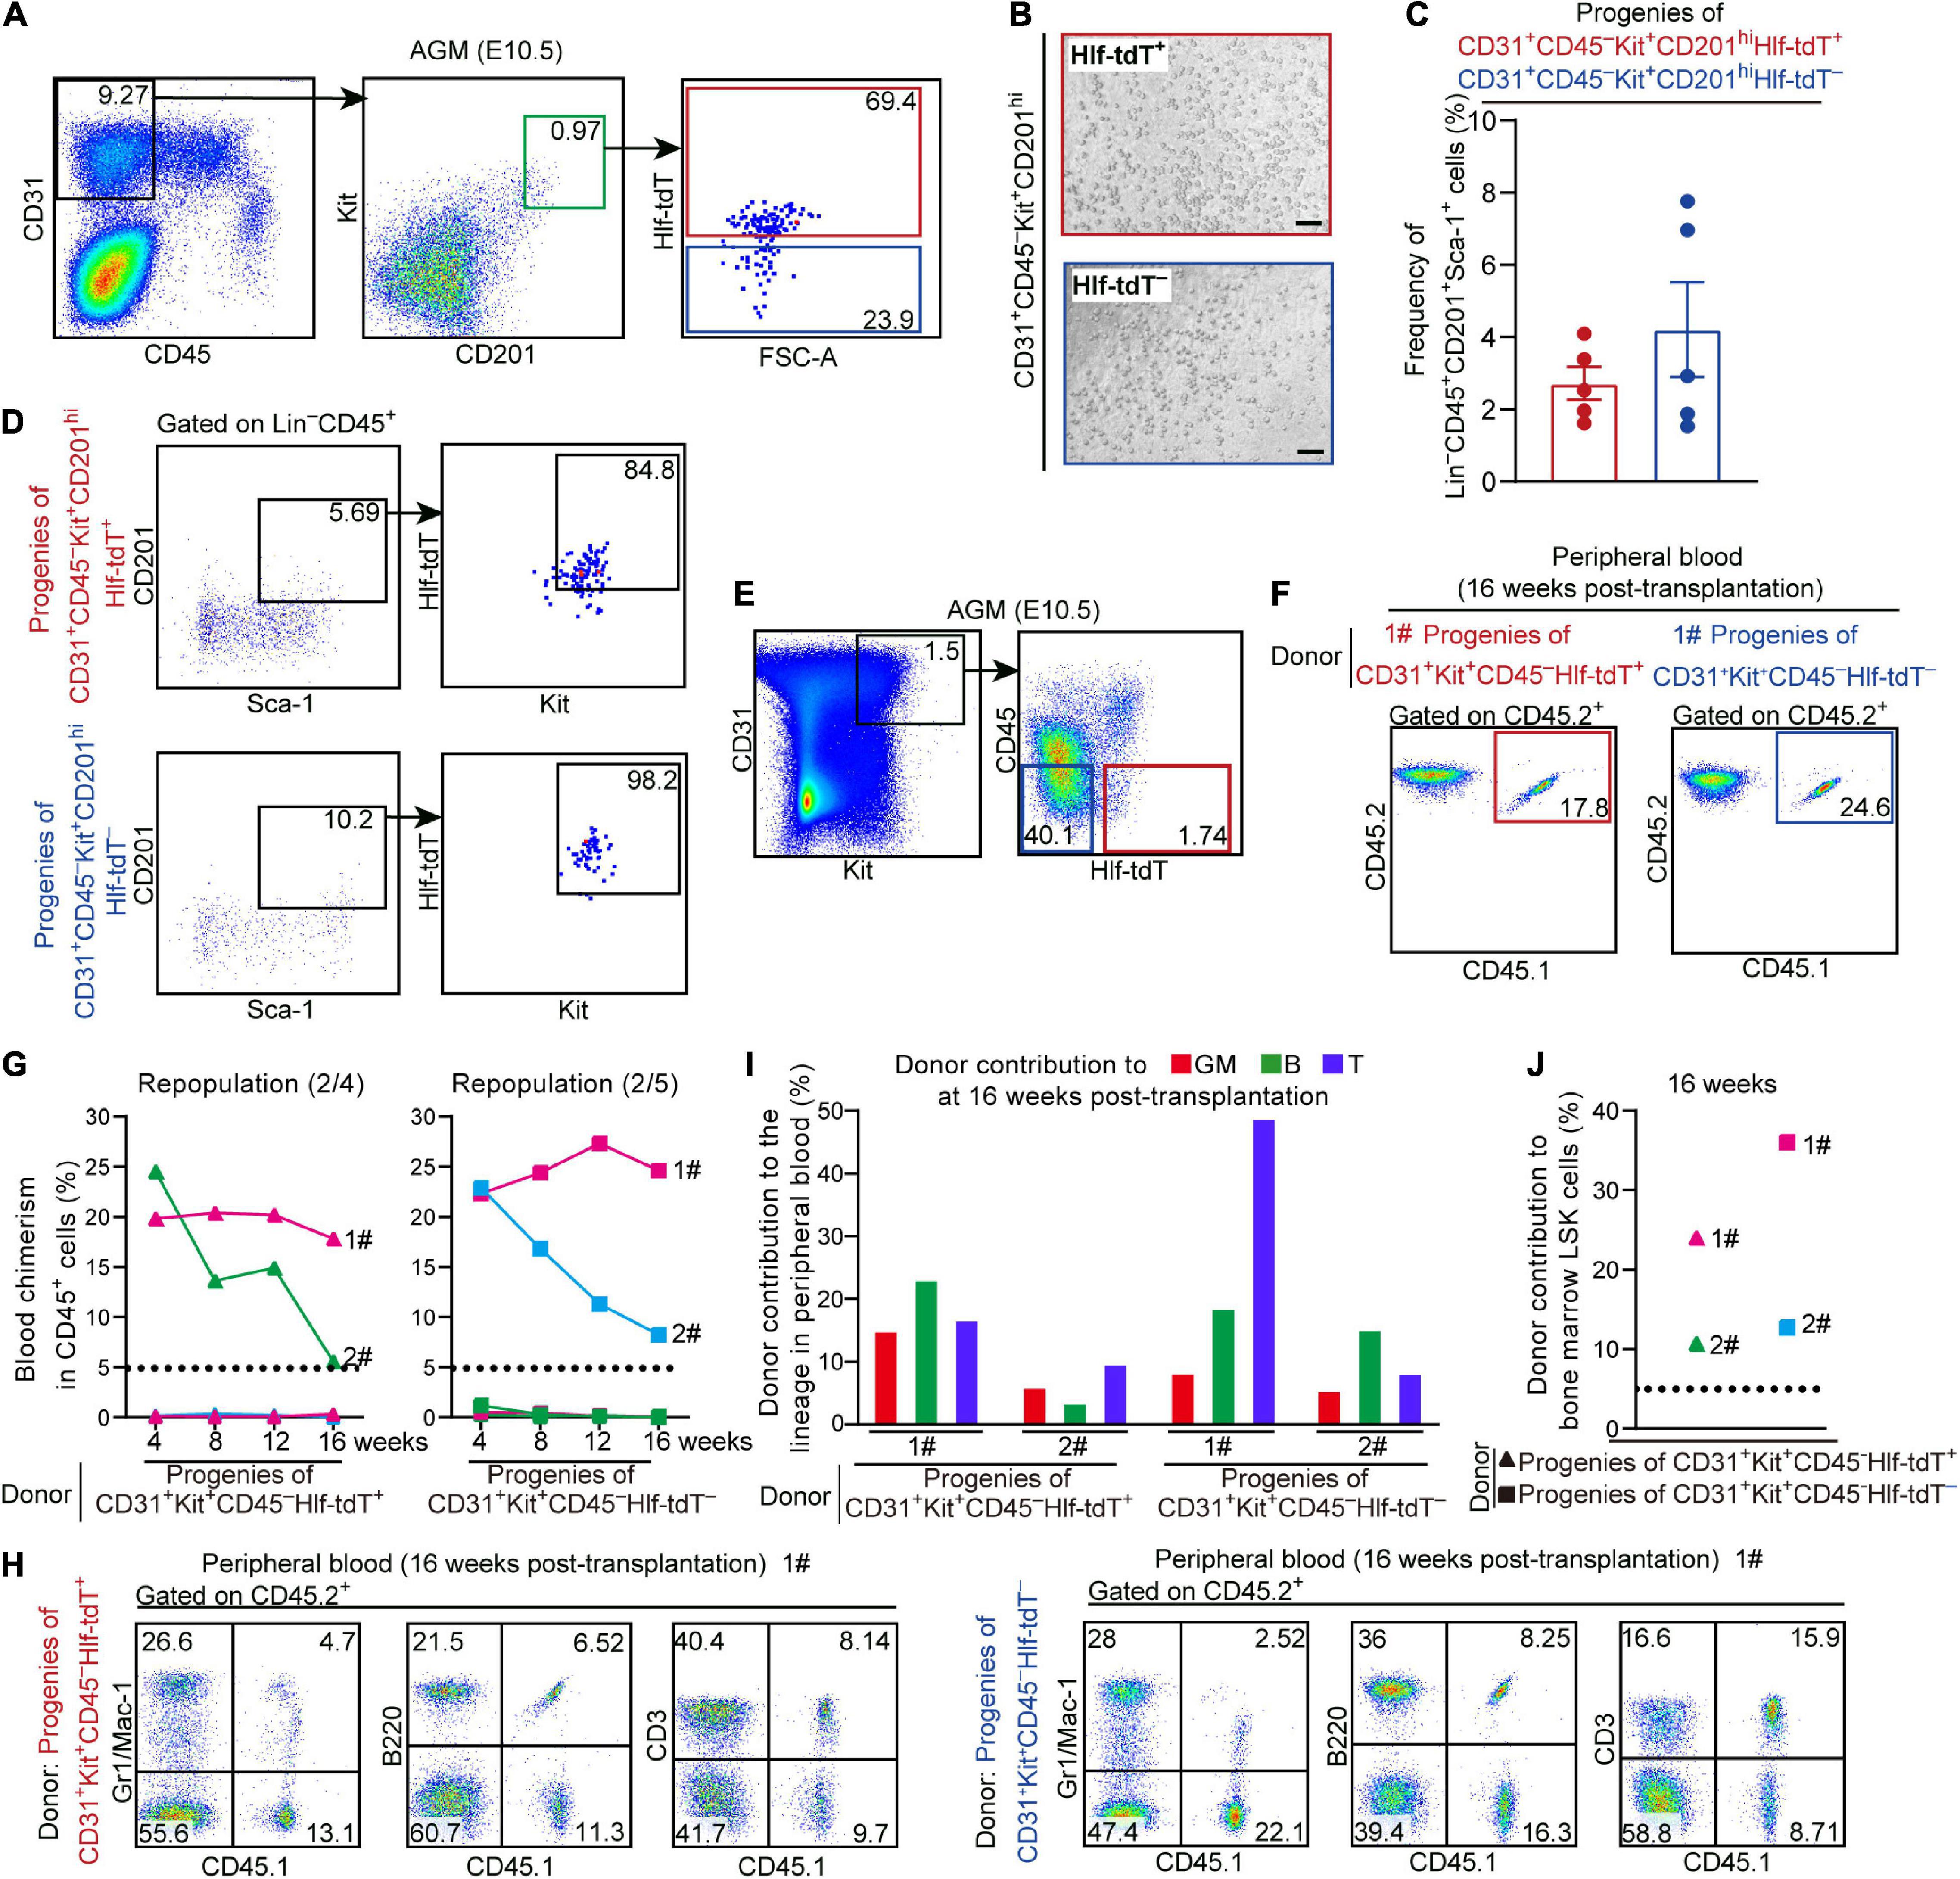
Figure 2. Hlf-tdTomato expression in functional CD45– pre-HSCs in the E10.5 AGM region. (A) Representative FACS plots showing the proportions of Hlf-tdTomato+ and Hlf-tdTomato– cells in CD31+CD45–Kit+CD201hi population in the AGM region of E10.5 Hlf-tdTomato embryos. Data are representative of five independent experiments. (B) Representative morphology of hematopoietic cells generated from Hlf-tdTomato+ cells (red) and Hlf-tdTomato– cells (blue) within CD31+CD45–Kit+CD201hi population. Scale bar, 100 μm. (C) Graph showing the frequency of Lin–CD45+CD201+Sca-1+ cells generated from the indicated populations from the E10.5 AGM region after co-culture analyzed by FACS. Data are shown as means ± SEM from five independent experiments. (D) Representative FACS plots showing the expression of Hlf-tdTomato and Kit in Lin–CD45+CD201+Sca-1+ cells that are generated from the indicated populations of the E10.5 AGM region after co-culture. Data are representative of five independent experiments. (E) Sorting strategy for the populations from the AGM region of E10.5 Hlf-tdTomato embryos for co-culture/transplantation assay. The cell populations sorted for functional assay are denoted as colored boxes. (F) Representative FACS plots of blood chimerism of donor-derived (CD45.1+CD45.2+) cells in CD45+ cells at 16 weeks post-transplantation. (G) Graphs showing the blood chimerism in CD45+ cells of each of all the recipients from 4 to 16 weeks post-transplantation. The recipients were transplanted with the culture products of CD31+Kit+CD45–Hlf-tdTomato+ (triangle, left) or CD31+Kit+CD45–Hlf-tdTomato– (square, right) cells from the AGM region of E10.5 Hlf-tdTomato embryos. Numbers of repopulated/total recipients are shown in the brackets. For each transplantation assay, cells from a total of 15 Hlf-tdTomato positive embryos belonging to three independent litters (biological repeats) were sampled and cultured as donor cells, and five recipients were used. Each line represents a recipient and each color represents an independent litter (biological repeat). (H) Representative FACS plots showing proportions of donor cells and each hematopoietic lineage at 16 weeks post-transplantation. Myeloid cells (Gr1/Mac-1+), B cells (B220+), and T cells (CD3+) in peripheral blood are shown. (I) Bar plot representing the percentages of donor contribution to granulocytes/monocytes (GM, red), B cells (green), and T cells (blue) in the peripheral blood at 16 weeks post-transplantation. (J) Graph showing donor contribution to the bone marrow hematopoietic stem progenitor cells (Lin–Sca-1+Kit+, LSK) of the successfully repopulated recipients at 16 weeks post-transplantation.
For in vivo functional validation, Hlf-tdTomato+ and Hlf-tdTomato– cells within CD31+Kit+CD45– population from the E10.5 AGM region were, respectively, co-cultured with OP9-DL1 for 6 days, then the culture products were transplanted into lethally irradiated adult mice. At 16 weeks post-transplantation, multi-lineage repopulation was observed in peripheral blood and multiple organs (BM, spleen, and thymus) of the recipients of both Hlf-tdTomato+ (2/4) and Hlf-tdTomato– (2/5) groups. Moreover, the contribution of the donor cells to the immunophenotypic HSCs and hematopoietic progenitors in BM was also observed, validating the bona fide HSC competence (Figures 2E–J and Supplementary Figures 3A,B). These data indicated that precursors of HSCs were distributed in both Hlf-tdTomato+ and Hlf-tdTomato– subpopulations of CD45– cells in the E10.5 AGM region. Considering the restricted expression of Hlf-tdTomato in the hematopoietic cells (Figure 1F), the CD45–Hlf-tdTomato+ population with the HSC-competence should belong to T1 pre-HSCs. On the other hand, as HSC-competent HECs in the AGM region represented by PK44 did not express Hlf-tdTomato (Supplementary Figure 2B), the repopulating capacity of the progenies of CD31+Kit+CD45–Hlf-tdTomato– population should be partially due to the existence of HSC-primed HECs therein, although the existence of Hlf-tdTomato– pre-HSCs could not be completely excluded.
Hlf-tdTomato Enriches Functional CD45+ Pre-HSCs in the E10.5 AGM Region
We noticed that the proportion of Hlf-tdTomato-expressing cells in the immunophenotypic T2 pre-HSCs (CD31+CD45+Kit+CD201hi) in the E10.5 AGM region was lower than that in the E11.0 AGM region (Figures 1D, 3A). Furthermore, the mean fluorescence intensity (MFI) of tdTomato in Hlf-tdTomato+ cells was higher in the CD45+ sub-population than in the CD45– counterpart within CD31+Kit+CD201hi cells (Figure 3B). As a previous report revealed that the expression intensity of Hlf gradually increases along with the maturation of embryonic HSCs (Yokomizo et al., 2019), we wondered whether Hlf expression marks the HSC-competence in the CD45+ cells as early as E10.5. Therefore, we sorted Hlf-tdTomato+ and Hlf-tdTomato– within the CD31+CD45+Kit+CD201hi population from the E10.5 AGM region (Figure 3A), and co-cultured them with OP9-DL1 in vitro, respectively. Six days later, both Hlf-tdTomato+ and Hlf-tdTomato– groups generated hematopoietic clusters (Figure 3C), but the former yielded much more HSC-like cells (Lin–CD45+Sca-1+CD201+) than the latter by FACS analyses (Figures 3D,E).
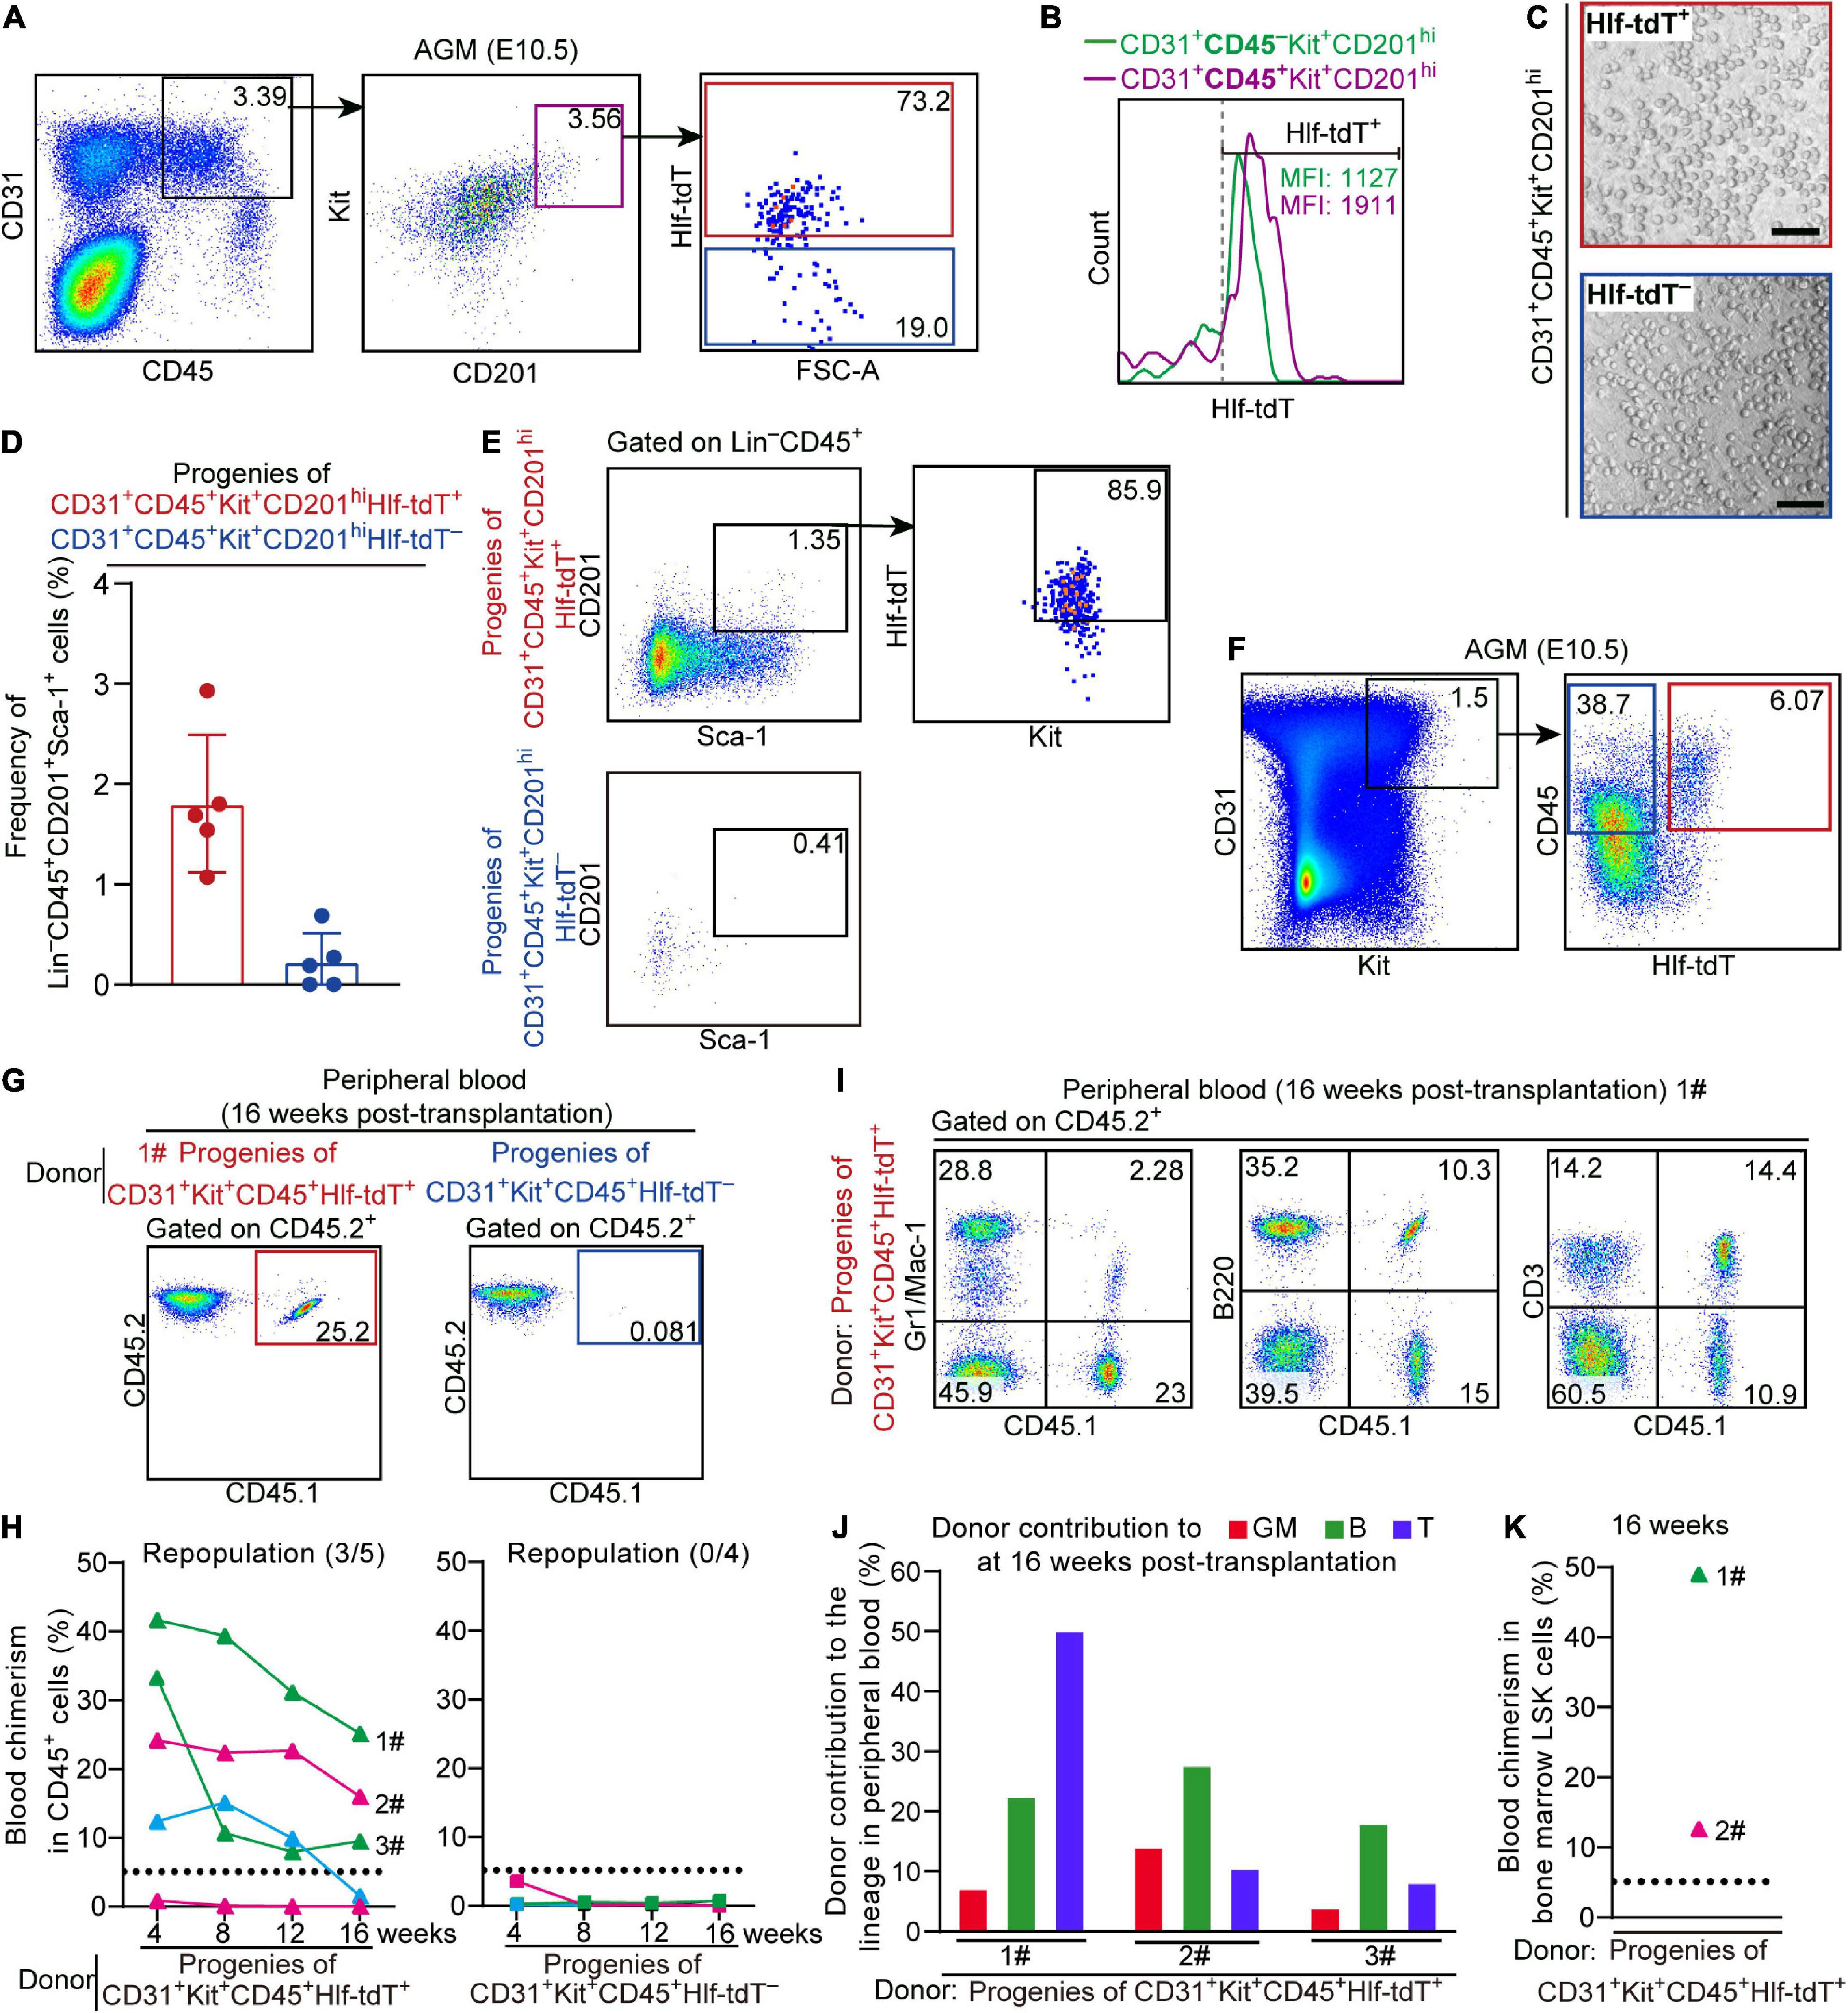
Figure 3. Hlf-tdTomato enriches functional CD45+ pre-HSCs in the E10.5 AGM region. (A) Representative FACS plots showing the proportion of Hlf-tdTomato+ and Hlf-tdTomato– cells in the CD31+CD45+Kit+CD201hi population in the AGM region of E10.5 Hlf-tdTomato embryos. Data are representative of five independent experiments. (B) Representative FACS histogram showing the fluorescence intensity of tdTomato in the CD31+CD45–Kit+CD201hi and CD31+CD45+Kit+CD201hi populations in the AGM region of E10.5 Hlf-tdTomato embryos. Values of mean fluorescence intensity of tdTomato in the Hlf-tdTomato+ cells are indicated. Data are representative of five independent experiments. (C) Representative morphology of hematopoietic cells generated from Hlf-tdTomato+ cells and Hlf-tdTomato– cells within the CD31+CD45+Kit+CD201hi population. Scale bar, 100 μm. (D) Graph showing the frequency of Lin–CD45+CD201+Sca-1+ cells generated from the indicated populations from the E10.5 AGM region after co-culture measured by FACS analysis. Data are shown as means ± SEM from five independent experiments. (E) Representative FACS plots showing the expression of Hlf-tdTomato and Kit in Lin–CD45+CD201+Sca-1+ cells that are generated from the indicated populations of the E10.5 AGM region after co-culture. Data are representative of five independent experiments. (F) Cell sorting strategy for the populations from the AGM region of E10.5 Hlf-tdTomato embryos for co-culture/transplantation assay. The cell populations sorted for functional assay are denoted by colored boxes. (G) Representative FACS plots of blood chimerism of donor-derived (CD45.1+CD45.2+) cells in CD45+ cells at 16 weeks post-transplantation. (H) Graphs showing the blood chimerism in CD45+ cells of each of all the recipients from 4 to 16 weeks post-transplantation. The recipients were transplanted with the culture products of CD31+Kit+CD45+Hlf-tdTomato+ (triangle, left) or CD31+Kit+CD45+Hlf-tdTomato– (square, right) cells from the AGM region of E10.5 Hlf-tdTomato embryos. Numbers of repopulated/total recipients are shown in the brackets. For each transplantation assay, cells from a total of 15 Hlf-tdTomato positive embryos belonging to three independent litters (biological repeats) were sampled and cultured as donor cells, and five recipients were used. Each line represents a recipient and each color represents an independent litter (biological repeat). (I) Representative FACS plots showing proportions of donor cells and each hematopoietic lineage at 16 weeks post-transplantation. Myeloid cells (Gr1/Mac-1+), B cells (B220+), and T cells (CD3+) in peripheral blood are shown. (J) Bar plot showing the percentages of donor contribution to granulocytes/monocytes (GM, red), B cells (green), and T cells (blue) in the peripheral blood at 16 weeks post-transplantation. (K) Graph showing donor contribution to the bone marrow hematopoietic stem progenitor cells (Lin–Sca-1+Kit+, LSK) of two successfully repopulated recipients at 16 weeks post-transplantation.
Next, Hlf-tdTomato+ and Hlf-tdTomato– cells within the CD31+Kit+CD45+ population from the E10.5 AGM region were, respectively, isolated and co-cultured with OP9-DL1 for 6 days, then transplantation assay was performed with the culture products. Of note, multi-lineage repopulation in peripheral blood and multiple organs (BM, spleen, and thymus) at 16 weeks post-transplantation was only detected in the recipients of Hlf-tdTomato+ group, consistent with the detection of the chimerism in the immunophenotypic HSCs and hematopoietic progenitors in BM (Figures 3F–K and Supplementary Figures 3C,D). Therefore, Hlf-tdTomato expression further enriched the HSC-competence in E10.5 CD45+ population. The finding also indicated that if a cell expresses CD45 prior to Hlf at this early stage, it has lost the possibility of specification toward HSCs.
Generation of an Inducible Hlf-CreER Mouse Model
To determine the physiological contribution of the Hlf-expressing early cells, including pre-HSCs and nascent HSCs, to FL and adult hematopoiesis, we newly generated an Hlf-CreER mouse model by CRISPR/Cas9-mediated gene knockin strategy, with an inducible CreERT2 cassette inserted between exon 4 and 3′UTR of the Hlf gene locus (Figure 4A). Immunostaining of ER in the AGM region showed the expression of the inducible Cre recombinase specifically in the IAHC cells from E9.5 to E10.5 (Figure 4B), consistent with the expression pattern of Hlf-tdTomato (Figure 1E).
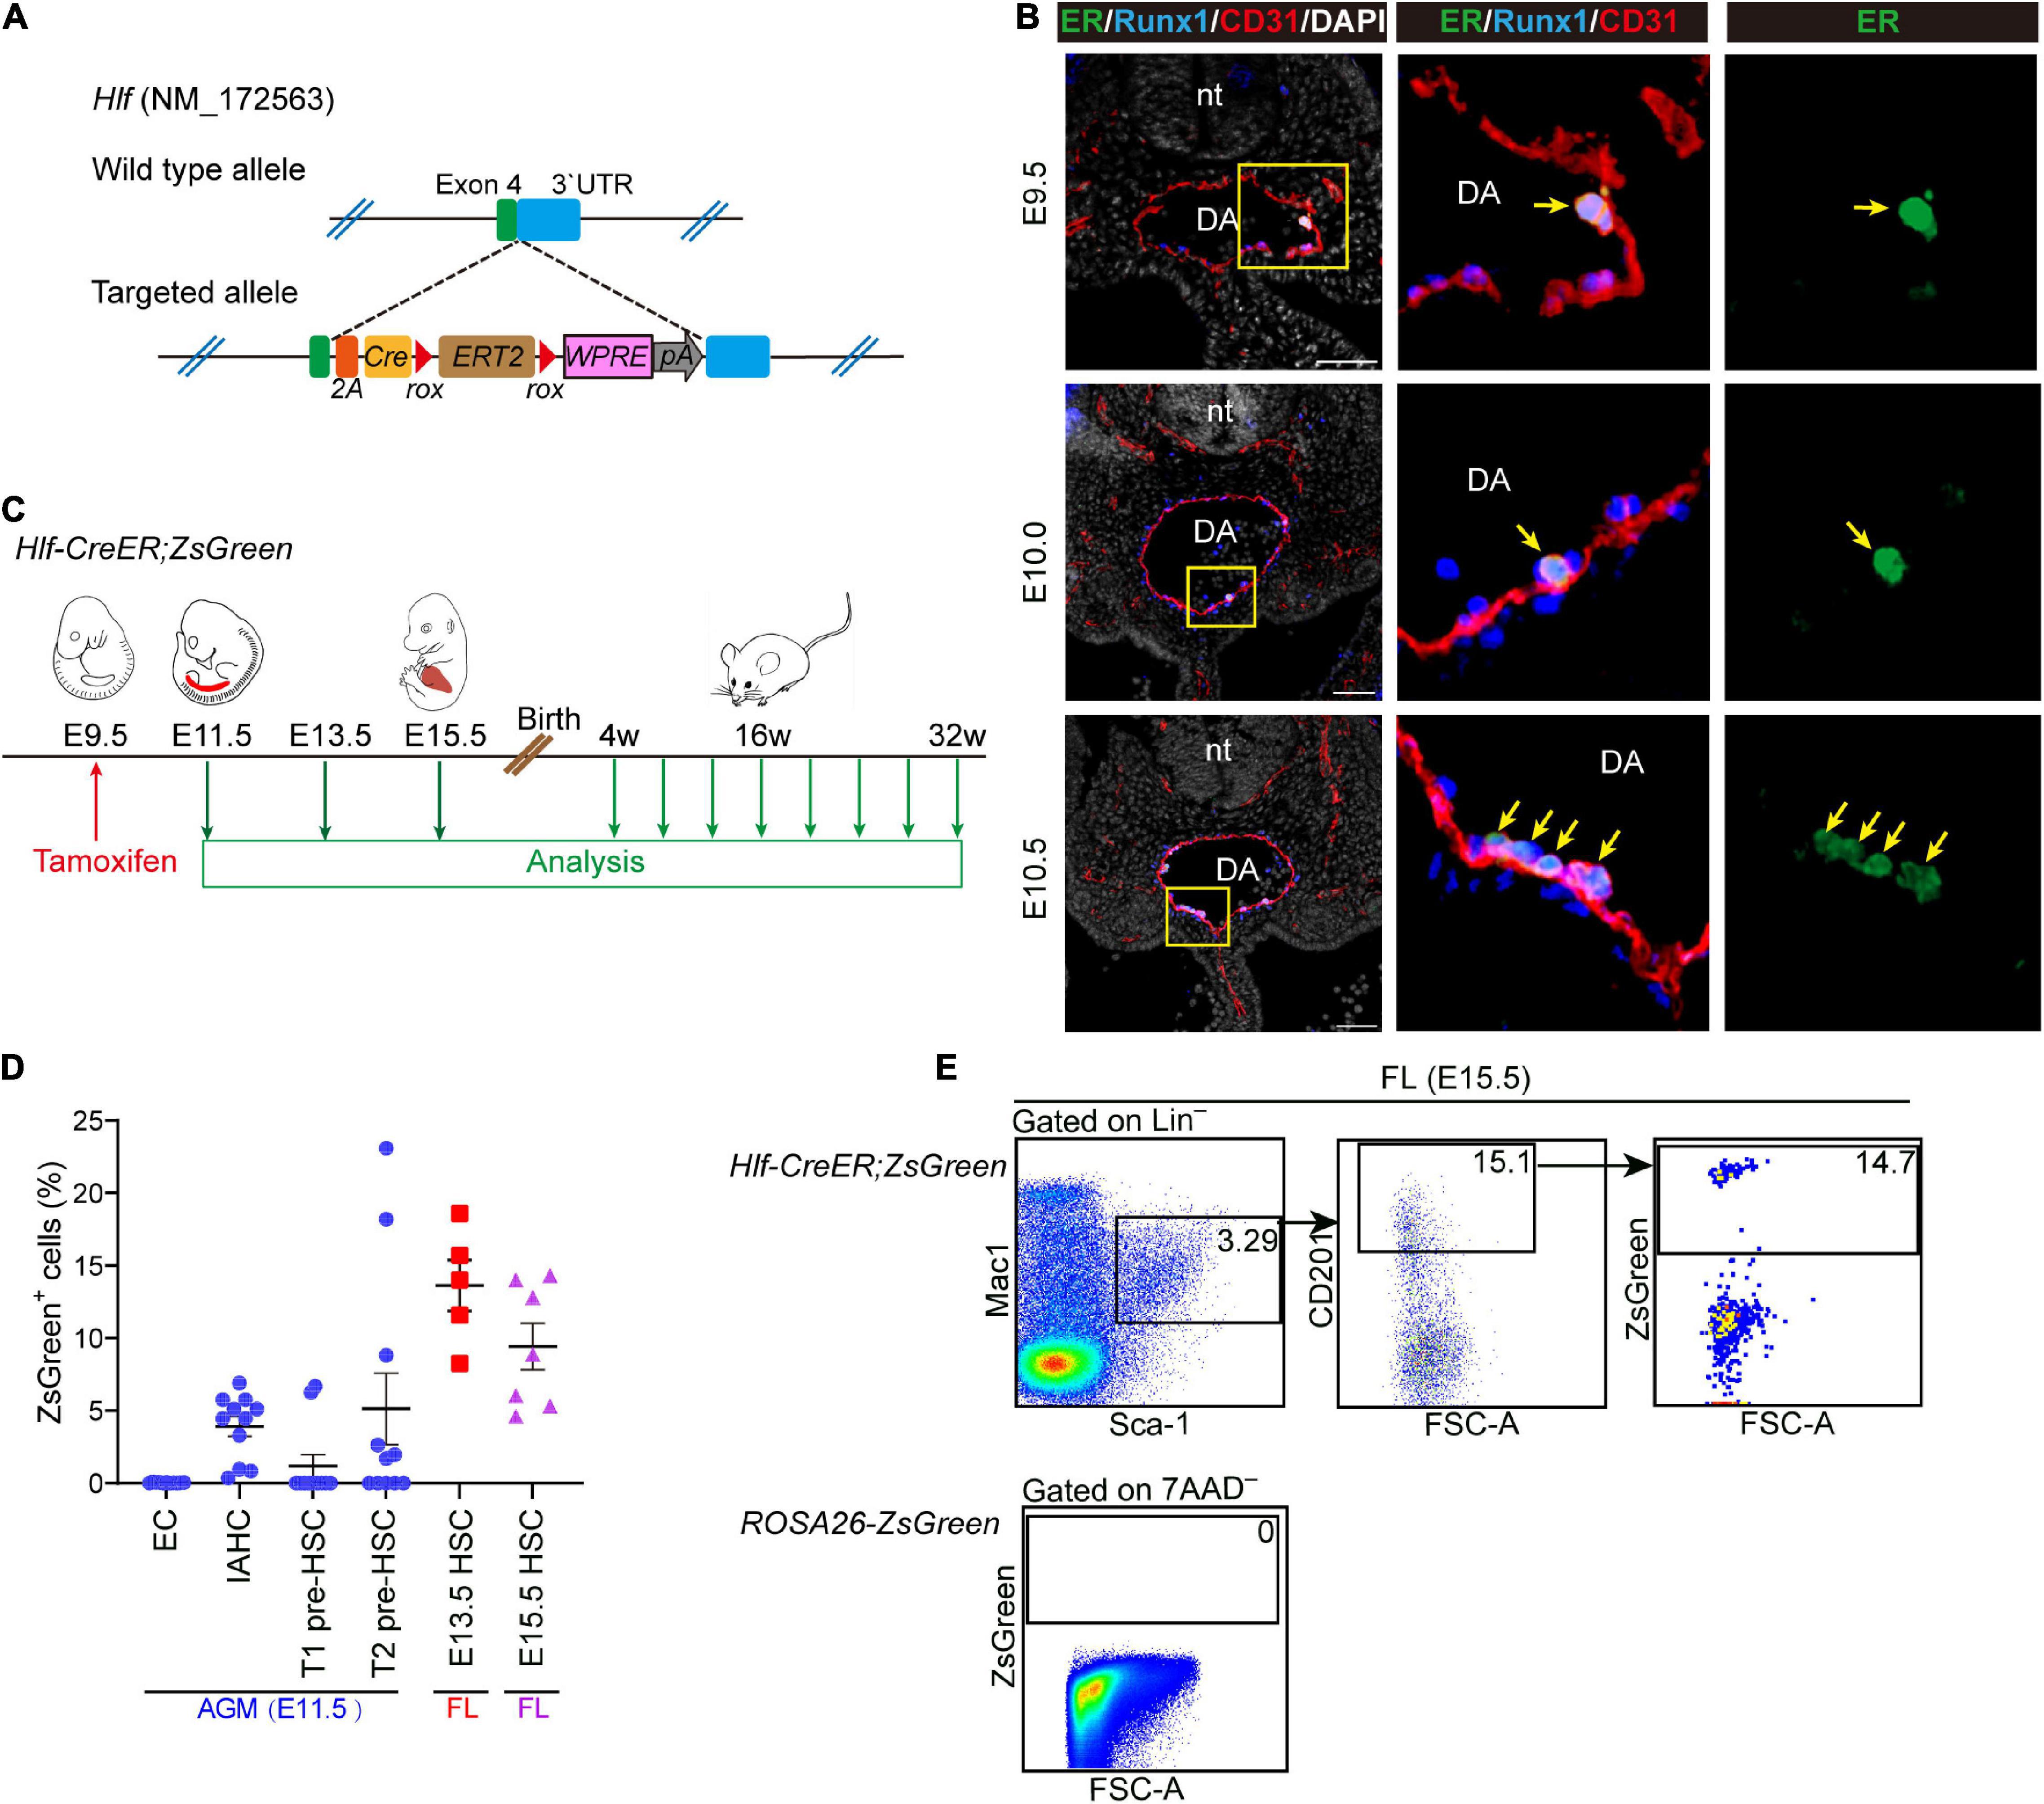
Figure 4. Generation of an inducible Hlf-CreER mouse model. (A) Schematic model of the gene-targeting strategy for constructing Hlf-CreER lineage tracing mouse line via CRISPR/Cas9 system. (B) Representative immunostaining on sections at the E9.5, E10.0, and E10.5 AGM region of Hlf-CreER embryos. Arrows indicate ER+ IAHCs. The images to the right present the magnification view of yellow boxes. Scale bar, 50 μm. (C) Schematic of the experimental design for the genetic lineage tracing with Hlf-CreER;ZsGreen mice. Single dose of induction by tamoxifen injection was performed at E9.5 (red arrow). Green arrows indicate the time points for analyses. The contribution of labeled cells in peripheral blood was chased every 4 weeks for up to 32 weeks after birth. (D) Graph showing the labeled proportions in the indicated populations. EC, endothelial cell. Data are shown as means ± SEM from three independent experiments. (E) Representative FACS plots showing the proportion of labeled cells in the immunophenotypic HSCs (Lin–Sca-1+Mac-1loCD201+) in E15.5 fetal liver (FL). Data are representative of four independent experiments.
Next, Hlf-CreER;ROSA-LSL-ZsGreen (referred to as Hlf-CreER;ZsGreen) mice were generated for lineage tracing. We performed the single-dose tamoxifen induction at E9.5, 24 h before the first HSCs appear at E10.5 (Figure 4C), and the labeling would involve the pre-HSCs and emerging HSCs marked by Hlf expression mainly within the next 48 h from injection (Zovein et al., 2008). We first assessed the labeling proportions of several populations related to HSC ontogeny by FACS analyses, including endothelial cells, IAHC cells, as well as T1 and T2 pre-HSCs in the E11.5 AGM region. Endothelial cells were not labeled as expected (Figure 4D and Supplementary Figure 4A). In contrast, the labeling was found in 3.9 ± 0.7% of the immunophenotypic IAHC cells (CD31+Kithi) (Figure 4D and Supplementary Figure 4A). Compared with that in T1 pre-HSCs (CD31+CD45–CD41loKit+CD201hi, 1.2 ± 0.8%), the average constitution of labeled cells in T2 pre-HSCs (CD31+CD45+Kit+CD201hi) was higher (5.1 ± 2.5%) (Figure 4D and Supplementary Figure 4A), in line with the higher expression of Hlf-tdTomato in T2 pre-HSCs than in T1 pre-HSCs (Figure 1D). Interestingly, the labeling of pre-HSCs in individual AGM regions was concentrated in either T1 or T2 pre-HSCs (Supplementary Figure 4B), suggesting the transient dynamics of pre-HSC maturation.
We then evaluated the contribution of these Hlf-labeled early cells to the immunophenotypic HSCs in FL. Of note, the average constitution of lineage-labeled cells in FL HSCs (Lin–Sca-1+Mac-1loCD201+) (Zhou et al., 2016) was 13.6 ± 1.8% at E13.5 and 9.4 ± 1.6% at E15.5, higher than that in pre-HSCs in the E11.5 AGM region (Figures 4D,E). When using another surface marker combination ESLAM (CD45+CD201+CD150+CD48–) (Benz et al., 2012) to check E15.5 FL HSCs, we came to a similar conclusion (Supplementary Figure 4C). These results indicated that Hlf-CreER;ZsGreen was able to trace part of AGM pre-HSCs and/or nascent HSCs without labeling endothelial cells when induced at E9.5, and the progenies of the labeled cells could migrate and colonize FL, possibly with an expansion to some extent.
Hlf-Labeled Early Cells Contribute to Long-Term and Multi-Lineage Adult Hematopoiesis
To evaluate the contribution of Hlf-labeled early cells to adult hematopoiesis, we administrated a single dose of tamoxifen at E9.5, and the contribution to multiple hematopoietic lineages in peripheral blood was chased up to 32 weeks after birth (Figure 4C). The labeling in total CD45+ leukocytes was ranged from 5.2 to 7.7%, with little fluctuation from 4 to 32 weeks (Figures 5A,B). The constitutions of traced cells in different lineages were similar, including granulocytes/monocytes (CD45+Gr1/Mac-1+), B lymphocytes (CD45+B220+), T lymphocytes (CD45+CD3+), erythrocytes (CD45–Ter119+), and megakaryocytes (CD45–CD41+), with on average of 5.2–8.1% for all the lineages and all the time points detected (Figures 5A,B).
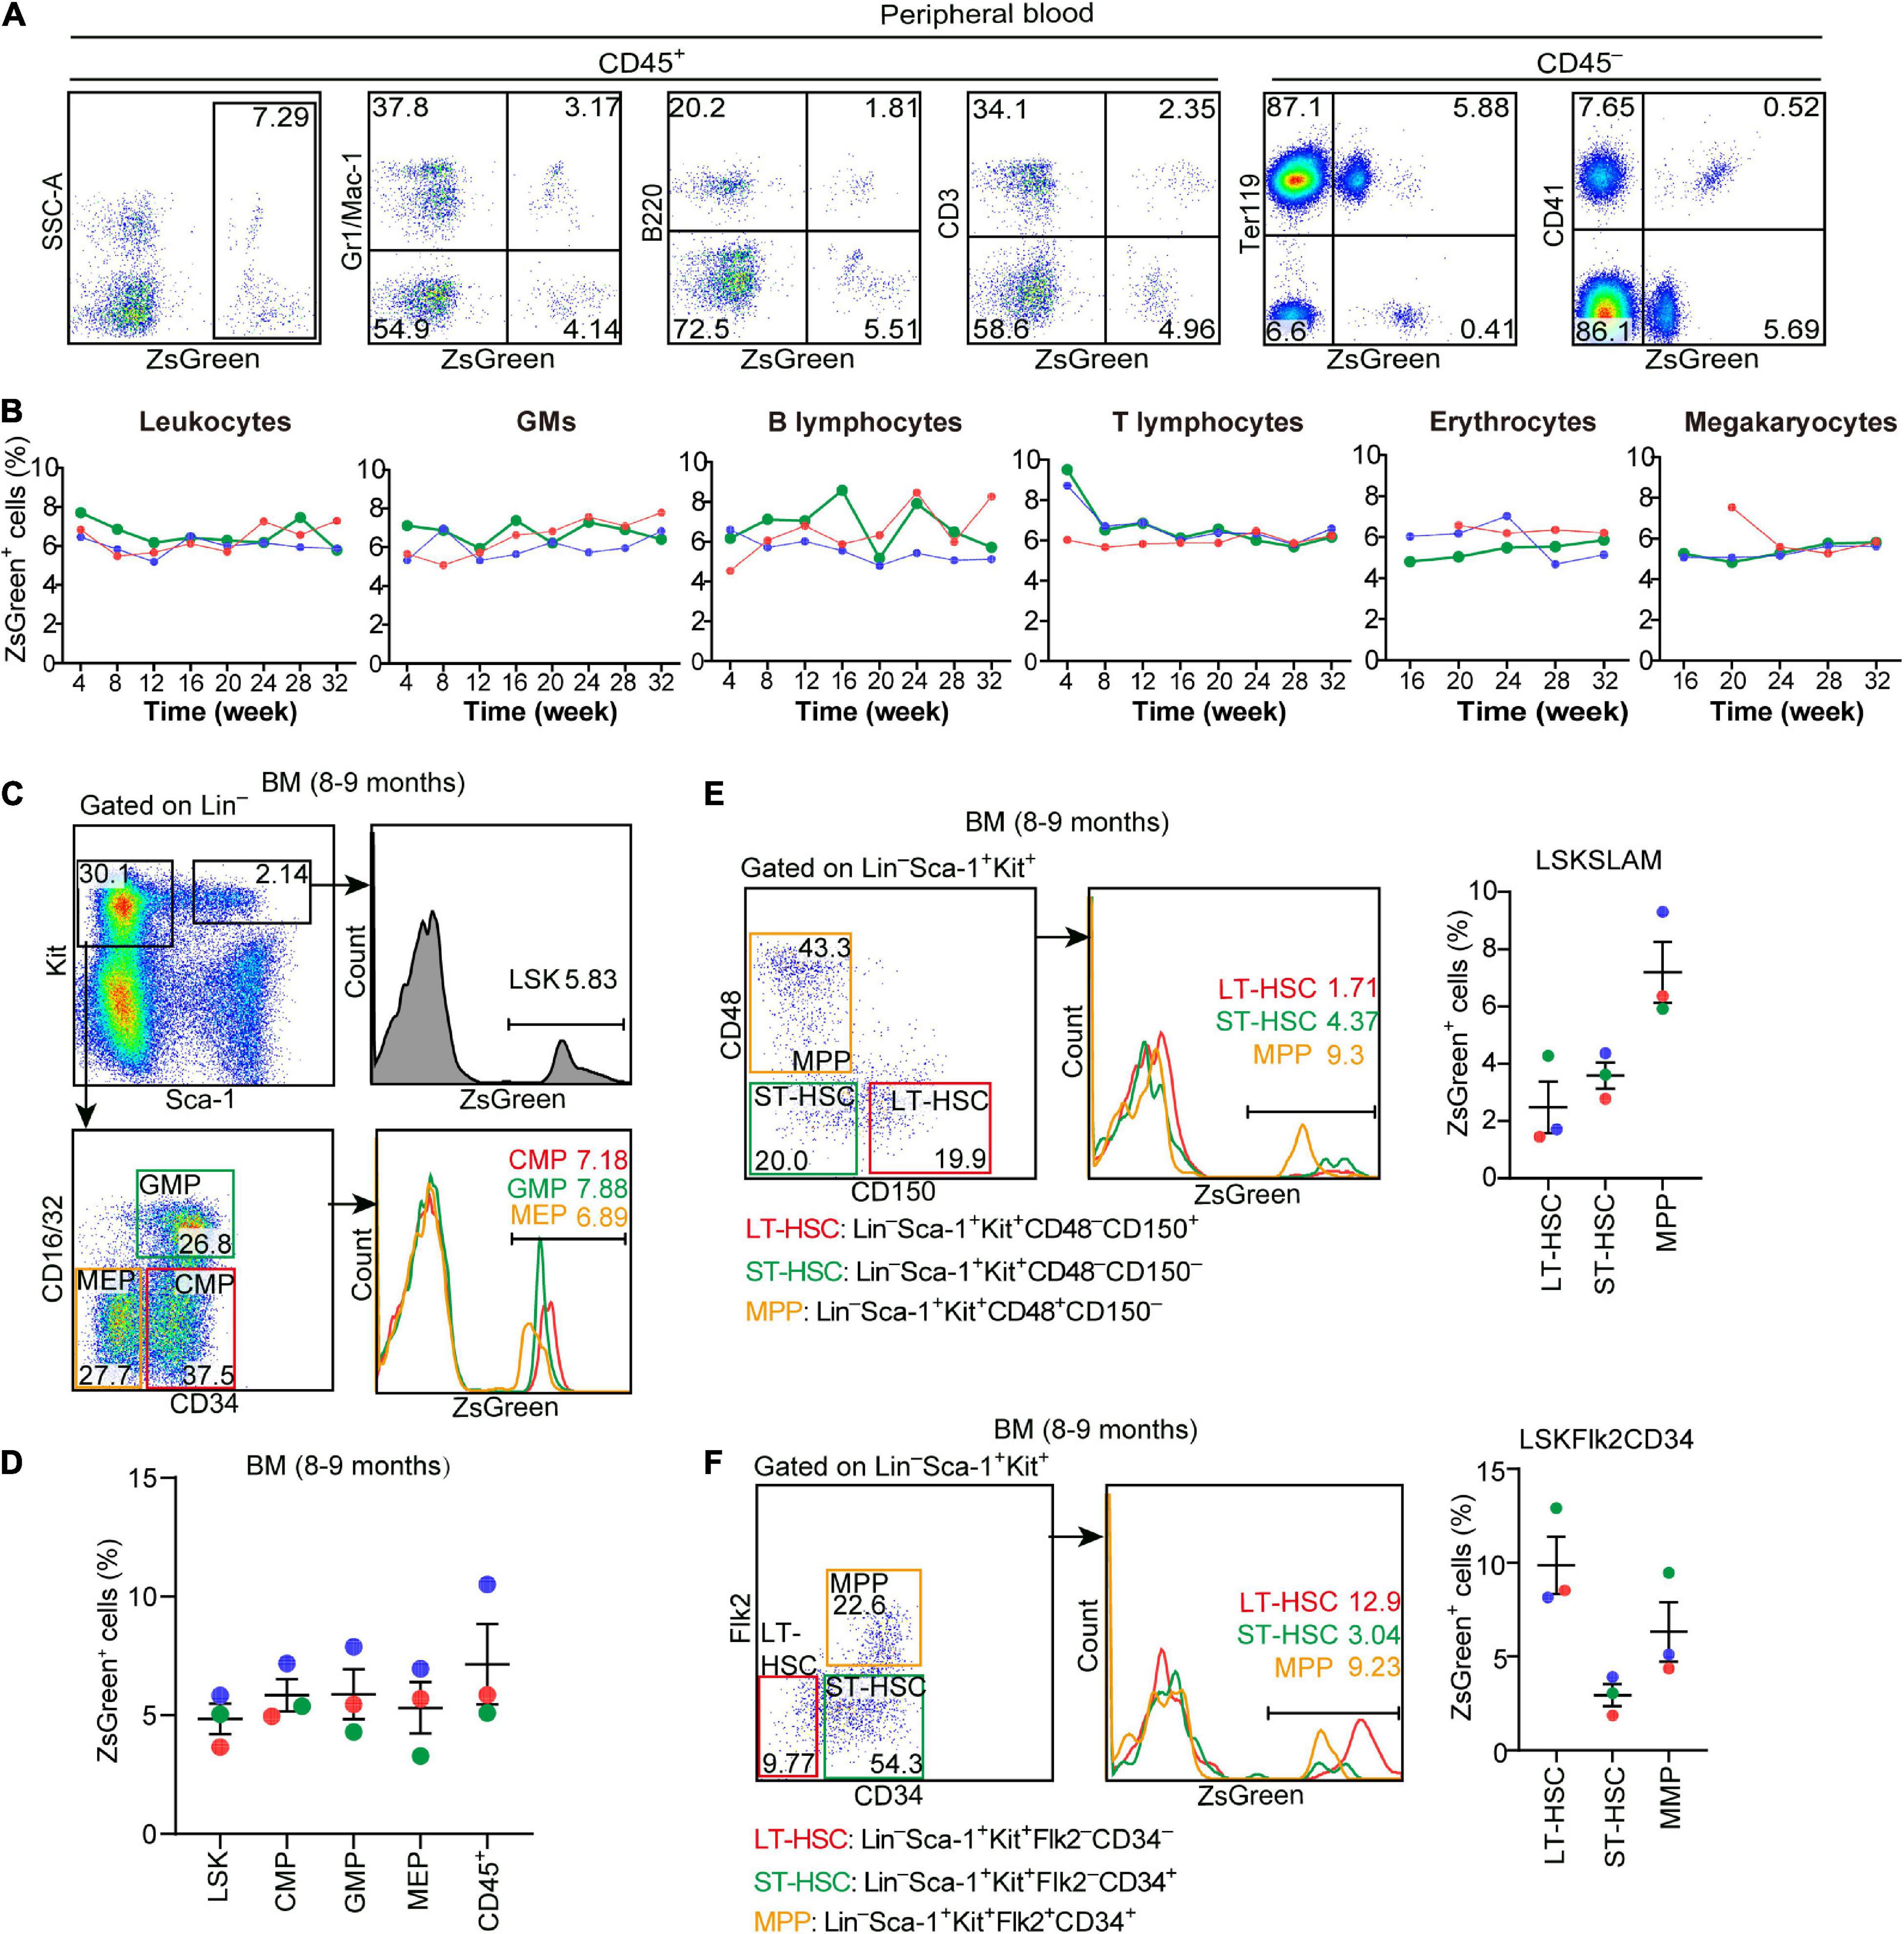
Figure 5. Hlf-labeled early cells contribute to long-term and multi-lineage adult hematopoiesis. (A) Representative FACS plots showing the proportions of Hlf-labeled cells in CD45+ cells and in each hematopoietic lineage in the peripheral blood from a 32-week old Hlf-CreER;ZsGreen mouse with tamoxifen administration at E9.5. (B) Graphs showing the dynamics of the labeling proportions in CD45+ leukocytes, granulocytes/monocytes (GMs), B lymphocytes, T lymphocytes, erythrocytes, and megakaryocytes, respectively, in the peripheral blood of Hlf-CreER;ZsGreen mice at 4–32 weeks old with tamoxifen administration at E9.5. Data are from three individuals represented by different colors. (C) Representative FACS plots showing the proportions of Hlf-labeled cells in LSK (Lin–Sca-1+Kit+) cells, CMPs, GMPs, and MEPs in the bone marrow (BM) of 8–9 month-old Hlf-CreER;ZsGreen mice with tamoxifen administration at E9.5. (D) Graph showing the proportions of Hlf-labeled cells in LSK cells, CMPs, GMPs, MEPs, and CD45+ cells in the bone marrow (BM) of 8–9 month-old Hlf-CreER;ZsGreen mice with tamoxifen administration at E9.5. Data are shown as means ± SEM from three independent experiments represented by different colors. CMP, common myeloid progenitor; GMP, granulocyte-monocyte progenitor; MEP, megakaryocyte-erythroid progenitor. (E) Representative FACS plots (left) and graph (right) showing the proportions of Hlf-labeled cells in LT-HSCs, ST-HSCs, and MPPs in the bone marrow (BM) of adult Hlf-CreER;ZsGreen mice with tamoxifen administration at E9.5. LSKSLAM marker combination was used. Data are from three independent experiments represented by different colors. (F) Representative FACS plots (left) and graph (right) showing the proportions of Hlf-labeled cells in LT-HSCs, ST-HSCs, and MPPs in the bone marrow (BM) of adult Hlf-CreER;ZsGreen mice with tamoxifen administration at E9.5. LSKFlk2CD34 marker combination was used. Data are from three independent experiments represented by different colors. LT-HSC, long-term hematopoietic stem cell; ST-HSC, short-term hematopoietic stem cell; MPP, multipotent progenitor.
To further determine whether and to what extent the Hlf-labeled early cells contributed to BM hematopoiesis in adult, we analyzed BM samples from three 8–9-month-old mice by flow cytometry. The constitutions of lineage-labeled cells in the immunophenotypically defined committed hematopoietic progenitors, including common myeloid progenitors, granulocyte-monocyte progenitors, and megakaryocyte-erythroid progenitors, were similar to each other, and also to that in the upstream HSC-enriched LSK (Lin–Sca1+Kit+) cells as well as to those in the mature blood lineages in the peripheral blood (Figures 5C,D). Interestingly, when using different marker combinations to define the enriched long-term HSCs, short-term HSCs, and multi-potent progenitors, the results varied regarding the contribution of lineage-traced cells to each of these HSPC populations (Figures 5E,F), suggestive of the heterogeneity within these immunophenotypically defined HSPC populations.
Taken together, these data unambiguously indicated that the early Hlf-expressing cells in the embryo contribute to and retain the size of the HSC pool in the BM, which continuously differentiate to maintain a balanced and long-term multi-lineage hematopoiesis in the adult. Therefore, here we provided a valuable mouse model to specifically trace the fate of emerging HSCs in the embryo.
Discussion
Considering that Hlf is an HSC-related gene that is specifically expressed in both embryonic and adult HSCs but neither in primitive blood cells nor erythro-myeloid progenitors, which is conserved in both mouse and human (Shojaei et al., 2005; Magnusson et al., 2007; Yokomizo et al., 2019; Zeng et al., 2019), here we specifically chose it and successfully constructed two mouse models, Hlf-tdTomato reporter mice and Hlf-CreER lineage tracing mice, which would without doubt serve as valuable mouse models for studying HSC biology.
In addition to validating the expression pattern of Hlf-tdTomato in FL and BM, which was principally consistent with the findings in a recent study (Yokomizo et al., 2019), we made an effort in the present study to explore the expression pattern of Hlf-tdTomato in early pre-HSCs with functional evaluation. Previous study has reported the presence of CD45– pre-HSCs in the E10.5 AGM region (Rybtsov et al., 2011); however, whether there exist CD45+ pre-HSCs at E10.5 has been controversial (Boisset et al., 2015). Based on the in vitro co-culture system we used, the progenies of CD45+Hlf-tdTomato+ but not CD45+Hlf-tdTomato– cells in the E10.5 AGM region were capable of repopulating irradiated adult recipients. Thus, we demonstrated the existence of CD45+ pre-HSCs in E10.5 AGM, which express Hlf. Moreover, our finding suggested that Hlf expression prior to CD45 expression is a prerequisite for the cells to keep the HSC competence. Unlike the CD45+ cells, CD45– cells showed repopulating activity in both Hlf-tdTomato+ and Hlf-tdTomato– counterparts. However, presently, we could not figure out to what extent the HSC-primed HEC population contributed to the repopulating capacity of the Hlf-tdTomato– sub-population in the E10.5 AGM region. Further precise study designs are needed to address this question. It is conceivable that Hlf-tdTomato reporter can be used as an indicator of HSC emergence when carrying out reprogramming experiment or inducing ES cell differentiation in vitro.
Although a variety of mouse models have been used to trace the fate of HSCs, there is still room for improvement. Some mouse models have been used to mark adult HSCs, such as Pdzk1ip1-CreERT2, Fgd5-CreERT2, Vwf-CreERT2, Krt18-CreERT2, and Tie2-MerCreMer, with varied efficiencies to label adult HSCs when induced at adult stage (Busch et al., 2015; Sawai et al., 2016; Carrelha et al., 2018; Chapple et al., 2018; Sawen et al., 2018). However, the expression of most of these molecules is not specific to HSCs during development. Some mouse models, including Cdh5-CreERT2, Tie2-MerCreMer, and Runx1-MerCreMer, have been used to label embryonic HSCs when induced at mid-gestation (Zovein et al., 2008; Gomez Perdiguero et al., 2015; Hoeffel et al., 2015). Since these molecules are also expressed in the cells of other waves of hematopoiesis in addition to HSC generation during embryogenesis, and the occurring period for different waves of hematopoiesis overlaps to a certain extent, lineage tracing models using HSC-specific markers are urgently needed to more specifically and clearly delineate the fate of embryonic HSCs exclusively. Together with a previous study showing that Hlf is not expressed in erythro-myeloid progenitors, a population belonging to HSC-independent hematopoiesis (Yokomizo et al., 2019), our present findings suggested Hlf-CreER mice as an unprecedented model for studying embryonic HSC-derived hematopoiesis.
Our previous studies have reported the expression of CD201 (known as EPCR, encoded by Procr) in HSC-primed HECs and pre-HSCs, which is a stemness molecule and also expressed in aortic endothelial cells, as well as the contribution of CD201-labeled embryonic cells to fetal and adult blood lineages revealed by Procr-CreER-mediated lineage tracing when induced at E9.5 (Zhou et al., 2016; Lan, 2017; Zheng et al., 2019; Hou et al., 2020). Moreover, we have identified Neurl3 as a signature gene of HSC-primed HECs and pre-HSCs and achieved the enrichment of HSC-competent HECs by the Neurl3-EGFP reporter (Hou et al., 2020). In the future, by combining these mouse models, we will more precisely delineate the comprehensive roadmap for the diversified fate choice of different hematopoietic lineages from embryonic HSCs.
Data Availability Statement
The original contributions presented in the study are included in the article/Supplementary Material, further inquiries can be directed to the corresponding author/s.
Ethics Statement
The animal study was reviewed and approved by the Academy of Military Medical Sciences (Fifth Medical Center of Chinese PLA General Hospital).
Author Contributions
YL and BL designed the study. WT performed the cell sorting, culture, immunostaining, and transplantation assays with help from JHe, TH, ZB, CW, HW, RY, YN, YY, YG, SH, JHo, JW, and JZ. WT, YL, and BL wrote the manuscript and revision. All authors reviewed the manuscript.
Funding
This work was supported by the National Key R&D Program of China (2020YFA0112402 and 2017YFA0103401), the National Natural Science Foundation of China (81890991, 31871173, 31930054, and 81900115), the Program for Guangdong Introducing Innovative and Entrepreneurial Teams (2017ZT07S347), and the Key Research and Development Program of Guangdong Province (2019B020234002).
Conflict of Interest
The authors declare that the research was conducted in the absence of any commercial or financial relationships that could be construed as a potential conflict of interest.
Publisher’s Note
All claims expressed in this article are solely those of the authors and do not necessarily represent those of their affiliated organizations, or those of the publisher, the editors and the reviewers. Any product that may be evaluated in this article, or claim that may be made by its manufacturer, is not guaranteed or endorsed by the publisher.
Acknowledgments
We thank Bo Zhou for providing ROSA-LSL-ZsGreen reporter mice.
Supplementary Material
The Supplementary Material for this article can be found online at: https://www.frontiersin.org/articles/10.3389/fcell.2021.728057/full#supplementary-material
Supplementary Figure 1 | Gating strategies for FACS analyses of Hlf-tdTomato expression in different hematopoietic populations from Hlf-tdTomato mice. (A) Representative FACS plots showing the expression of Hlf-tdTomato in Gr1+ cells and F4/80+ macrophages in E15.5 fetal liver (FL). Data are representative of two independent experiments. (B) Representative FACS plots showing Hlf-tdTomato expression in the indicated hematopoietic populations in the adult bone marrow (BM). LT-HSC, long-term hematopoietic stem cell; ST-HSC, short-term hematopoietic stem cell; MPP, multipotent progenitor; CMP, common myeloid progenitor; GMP, granulocyte-monocyte progenitor; MEP, megakaryocyte-erythroid progenitor. Data are representative of three independent experiments. (C) Representative FACS plots (left) and graph (right) showing the Hlf-tdTomato expression in LT-HSCs, ST-HSCs and MPPs in the bone marrow (BM) of adult Hlf-tdTomato mice. LSKFlk2CD34 marker combination was used. Data are from three independent experiments. (D) Representative FACS plots showing the Hlf-tdTomato expression in granulocytes/monocytes (GMs), B cells, and T cells in the peripheral blood of adult Hlf-tdTomato mice. Data are representative of two independent experiments.
Supplementary Figure 2 | Representative FACS analyses of Hlf-tdTomato expression in embryos. (A) Representative FACS plots showing the proportions of Hlf-tdTomato+ cells in hematopoietic cells (CD41+/CD43+/CD45+) and non-hematopoietic cells (CD41–CD43–CD45–) of the limb, head, and trunk from E10.5 Hlf-tdTomato embryos. Data are representative of two independent experiments. (B) Representative FACS plots showing no Hlf-tdTomato expression in PK44 (CD41–CD43–CD45–CD31+CD44+Kit+CD201+) population of the E10.5 Hlf-tdTomato AGM region.
Supplementary Figure 3 | Representative FACS analyses of multi-lineage repopulation in multiple organs. (A) Representative FACS plots showing multi-organ and multi-lineage repopulation in the recipients 16 weeks post-transplantation transplanted with the culture products of the indicated cell populations from the E10.5 AGM region. The myeloid cells (Gr1/Mac-1+), B cells (B220+), and T cells (CD3+ or CD4/CD8+) in multiple hematopoietic organs are shown. (B) Representative FACS plots showing the proportions of donor-derived cells (represented by CD45.1+) in hematopoietic stem progenitor populations in the bone marrow of the reconstituted recipients 16 weeks post-transplantation transplanted with the progenies of the indicated cell populations from the E10.5 AGM region. LSKSLAM marker combination was used. (C) Representative FACS plots showing multi-organ and multi-lineage repopulation in the recipient 16 weeks post-transplantation transplanted with the progenies of the indicated cell populations from the E10.5 AGM region. The myeloid cells (Gr1/Mac-1+), B cells (B220+), and T cells (CD3+ or CD4/CD8+) in multiple hematopoietic organs are shown. (D) Representative FACS plots showing the proportions of donor-derived cells (represented by CD45.1+) in hematopoietic stem progenitor populations in the bone marrow of the reconstituted recipient 16 weeks post-transplantation transplanted with the progenies of the indicated cell populations from the E10.5 AGM region. LSKSLAM marker combination was used. LT-HSC, long-term hematopoietic stem cell; ST-HSC, short-term hematopoietic stem cell; MPP, multipotent progenitor; CMP, common myeloid progenitor; GMP, granulocyte-monocyte progenitor; MEP, megakaryocyte-erythroid progenitor.
Supplementary Figure 4 | Representative FACS analyses of lineage-traced cells in Hlf-CreER;ZsGreen mice. (A) Representative FACS plots showing the Hlf-labeled cells in endothelial cells (ECs), IAHCs, and T1 and T2 pre-HSCs in the AGM region of E11.5 Hlf-CreER;ZsGreen embryos with tamoxifen administrated at E9.5. Data are representative of six independent experiments. (B) Graph showing the dynamics of labeling in endothelial cells (ECs), IAHCs, and T1 and T2 pre-HSCs in the AGM region of E11.5 Hlf-CreER;ZsGreen embryos with tamoxifen administration at E9.5. Each line represents an individual embryo. (C) Representative FACS plots (left) and graph (right) showing the proportions of Hlf-labeled cells in the immunophenotypic HSCs (ESLAM) in the fetal liver (FL) of E15.5 Hlf-CreER;ZsGreen embryos with tamoxifen administration at E9.5. Data are representative of four independent experiments.
References
Baron, C. S., Kester, L., Klaus, A., Boisset, J. C., Thambyrajah, R., Yvernogeau, L., et al. (2018). Single-cell transcriptomics reveal the dynamic of haematopoietic stem cell production in the aorta. Nat. Commun. 9:2517. doi: 10.1038/s41467-018-04893-3
Benz, C., Copley, M. R., Kent, D. G., Wohrer, S., Cortes, A., Aghaeepour, N., et al. (2012). Hematopoietic stem cell subtypes expand differentially during development and display distinct lymphopoietic programs. Cell Stem Cell 10, 273–283. doi: 10.1016/j.stem.2012.02.007
Boisset, J. C., Clapes, T., Klaus, A., Papazian, N., Onderwater, J., Mommaas-Kienhuis, M., et al. (2015). Progressive maturation toward hematopoietic stem cells in the mouse embryo aorta. Blood 125, 465–469. doi: 10.1182/blood-2014-07-588954
Boisset, J. C., van Cappellen, W., Andrieu-Soler, C., Galjart, N., Dzierzak, E., and Robin, C. (2010). In vivo imaging of haematopoietic cells emerging from the mouse aortic endothelium. Nature 464, 116–120. doi: 10.1038/nature08764
Busch, K., Klapproth, K., Barile, M., Flossdorf, M., Holland-Letz, T., Schlenner, S. M., et al. (2015). Fundamental properties of unperturbed haematopoiesis from stem cells in vivo. Nature 518, 542–546. doi: 10.1038/nature14242
Carrelha, J., Meng, Y., Kettyle, L. M., Luis, T. C., Norfo, R., Alcolea, V., et al. (2018). Hierarchically related lineage-restricted fates of multipotent haematopoietic stem cells. Nature 554, 106–111. doi: 10.1038/nature25455
Chapple, R. H., Tseng, Y. J., Hu, T., Kitano, A., Takeichi, M., Hoegenauer, K. A., et al. (2018). Lineage tracing of murine adult hematopoietic stem cells reveals active contribution to steady-state hematopoiesis. Blood Adv. 2, 1220–1228. doi: 10.1182/bloodadvances.2018016295
Chen, M. J., Yokomizo, T., Zeigler, B. M., Dzierzak, E., and Speck, N. A. (2009). Runx1 is required for the endothelial to haematopoietic cell transition but not thereafter. Nature 457, 887–891. doi: 10.1038/nature07619
Christensen, J. L., Wright, D. E., Wagers, A. J., and Weissman, I. L. (2004). Circulation and chemotaxis of fetal hematopoietic stem cells. PLoS Biol. 2:E75. doi: 10.1371/journal.pbio.0020075
de Bruijn, M. F., Ma, X., Robin, C., Ottersbach, K., Sanchez, M. J., and Dzierzak, E. (2002). Hematopoietic stem cells localize to the endothelial cell layer in the midgestation mouse aorta. Immunity 16, 673–683. doi: 10.1016/s1074-7613(02)00313-8
de Bruijn, M. F., Speck, N. A., Peeters, M. C., and Dzierzak, E. (2000). Definitive hematopoietic stem cells first develop within the major arterial regions of the mouse embryo. EMBO J. 19, 2465–2474. doi: 10.1093/emboj/19.11.2465
Dzierzak, E., and Bigas, A. (2018). Blood development: hematopoietic stem cell dependence and independence. Cell Stem Cell 22, 639–651. doi: 10.1016/j.stem.2018.04.015
Gazit, R., Garrison, B. S., Rao, T. N., Shay, T., Costello, J., Ericson, J., et al. (2013). Transcriptome analysis identifies regulators of hematopoietic stem and progenitor cells. Stem Cell Rep. 1, 266–280. doi: 10.1016/j.stemcr.2013.07.004
Gomez Perdiguero, E., Klapproth, K., Schulz, C., Busch, K., Azzoni, E., Crozet, L., et al. (2015). Tissue-resident macrophages originate from yolk-sac-derived erythro-myeloid progenitors. Nature 518, 547–551. doi: 10.1038/nature13989
Hadland, B. K., Varnum-Finney, B., Mandal, P. K., Rossi, D. J., Poulos, M. G., Butler, J. M., et al. (2017). A common origin for B-1a and B-2 lymphocytes in Clonal Pre- hematopoietic stem cells. Stem Cell Rep. 8, 1563–1572. doi: 10.1016/j.stemcr.2017.04.007
Hoeffel, G., Chen, J., Lavin, Y., Low, D., Almeida, F. F., See, P., et al. (2015). C-Myb(+) erythro-myeloid progenitor-derived fetal monocytes give rise to adult tissue-resident macrophages. Immunity 42, 665–678. doi: 10.1016/j.immuni.2015.03.011
Hou, S., Li, Z., Zheng, X., Gao, Y., Dong, J., Ni, Y., et al. (2020). Embryonic endothelial evolution towards first hematopoietic stem cells revealed by single-cell transcriptomic and functional analyses. Cell Res. 30, 376–392. doi: 10.1038/s41422-020-0300-2
Komorowska, K., Doyle, A., Wahlestedt, M., Subramaniam, A., Debnath, S., Chen, J., et al. (2017). Hepatic leukemia factor maintains quiescence of hematopoietic stem cells and protects the stem cell pool during regeneration. Cell Rep. 21, 3514–3523. doi: 10.1016/j.celrep.2017.11.084
Lan, Y. (2017). Procr+ stem cells: from vessel to blood. Nat. Sci. Rev. 4, 523–524. doi: 10.1093/nsr/nwx104
Li, Z., Lan, Y., He, W., Chen, D., Wang, J., Zhou, F., et al. (2012). Mouse embryonic head as a site for hematopoietic stem cell development. Cell Stem Cell 11, 663–675. doi: 10.1016/j.stem.2012.07.004
Madisen, L., Zwingman, T. A., Sunkin, S. M., Oh, S. W., Zariwala, H. A., Gu, H., et al. (2010). A robust and high-throughput Cre reporting and characterization system for the whole mouse brain. Nat. Neurosci. 13, 133–140. doi: 10.1038/nn.2467
Magnusson, M., Brun, A. C., Miyake, N., Larsson, J., Ehinger, M., Bjornsson, J. M., et al. (2007). HOXA10 is a critical regulator for hematopoietic stem cells and erythroid/megakaryocyte development. Blood 109, 3687–3696. doi: 10.1182/blood-2006-10-054676
Medvinsky, A., and Dzierzak, E. (1996). Definitive hematopoiesis is autonomously initiated by the AGM region. Cell 86, 897–906. doi: 10.1016/s0092-8674(00)80165-8
Morrison, S. J., Hemmati, H. D., Wandycz, A. M., and Weissman, I. L. (1995). The purification and characterization of fetal liver hematopoietic stem cells. Proc. Natl. Acad. Sci. U.S.A. 92, 10302–10306. doi: 10.1073/pnas.92.22.10302
Muller, A. M., Medvinsky, A., Strouboulis, J., Grosveld, F., and Dzierzak, E. (1994). Development of hematopoietic stem cell activity in the mouse embryo. Immunity 1, 291–301. doi: 10.1016/1074-7613(94)90081-7
Neo, W. H., Lie, A. L. M., Fadlullah, M. Z. H., and Lacaud, G. (2021). Contributions of embryonic HSC-Independent hematopoiesis to organogenesis and the adult hematopoietic system. Front. Cell Dev. Biol. 9:631699. doi: 10.3389/fcell.2021.631699
North, T. E., de Bruijn, M. F., Stacy, T., Talebian, L., Lind, E., Robin, C., et al. (2002). Runx1 expression marks long-term repopulating hematopoietic stem cells in the midgestation mouse embryo. Immunity 16, 661–672. doi: 10.1016/s1074-7613(02)00296-0
Rybtsov, S., Ivanovs, A., Zhao, S., and Medvinsky, A. (2016). Concealed expansion of immature precursors underpins acute burst of adult HSC activity in foetal liver. Development 143, 1284–1289. doi: 10.1242/dev.131193
Rybtsov, S., Sobiesiak, M., Taoudi, S., Souilhol, C., Senserrich, J., Liakhovitskaia, A., et al. (2011). Hierarchical organization and early hematopoietic specification of the developing HSC lineage in the AGM region. J. Exp. Med. 208, 1305–1315. doi: 10.1084/jem.20102419
Sánchez, M. J., Holmes, A., Miles, C., and Dzierzak, E. (1996). Characterization of the first definitive hematopoietic stem cells in the AGM and liver of the mouse embryo. Immunity 5, 513–525. doi: 10.1016/s1074-7613(00)80267-8
Sawai, C. M., Babovic, S., Upadhaya, S., Knapp, D., Lavin, Y., Lau, C. M., et al. (2016). Hematopoietic stem cells are the major source of Multilineage Hematopoiesis in adult animals. Immunity 45, 597–609. doi: 10.1016/j.immuni.2016.08.007
Sawen, P., Eldeeb, M., Erlandsson, E., Kristiansen, T. A., Laterza, C., Kokaia, Z., et al. (2018). Murine HSCs contribute actively to native hematopoiesis but with reduced differentiation capacity upon aging. eLife 7:e41258. doi: 10.7554/eLife.41258
Shojaei, F., Trowbridge, J., Gallacher, L., Yuefei, L., Goodale, D., Karanu, F., et al. (2005). Hierarchical and ontogenic positions serve to define the molecular basis of human hematopoietic stem cell behavior. Dev. Cell 8, 651–663. doi: 10.1016/j.devcel.2005.03.004
Solaimani Kartalaei, P., Yamada-Inagawa, T., Vink, C. S., de Pater, E., van der Linden, R., Marks-Bluth, J., et al. (2015). Whole-transcriptome analysis of endothelial to hematopoietic stem cell transition reveals a requirement for Gpr56 in HSC generation. J. Exp. Med. 212, 93–106. doi: 10.1084/jem.20140767
Taoudi, S., Gonneau, C., Moore, K., Sheridan, J. M., Blackburn, C. C., Taylor, E., et al. (2008). Extensive hematopoietic stem cell generation in the AGM region via maturation of VE-cadherin+CD45+ pre-definitive HSCs. Cell Stem Cell 3, 99–108. doi: 10.1016/j.stem.2008.06.004
Vink, C. S., Calero-Nieto, F. J., Wang, X., Maglitto, A., Mariani, S. A., Jawaid, W., et al. (2020). Iterative single-cell analyses define the transcriptome of the first functional hematopoietic stem cells. Cell Rep. 31:107627. doi: 10.1016/j.celrep.2020.107627
Wahlestedt, M., Ladopoulos, V., Hidalgo, I., Sanchez Castillo, M., Hannah, R., Sawen, P., et al. (2017). Critical modulation of hematopoietic lineage fate by hepatic leukemia factor. Cell Rep. 21, 2251–2263. doi: 10.1016/j.celrep.2017.10.112
Yamamoto, R., Morita, Y., Ooehara, J., Hamanaka, S., Onodera, M., Rudolph, K. L., et al. (2013). Clonal analysis unveils self-renewing lineage-restricted progenitors generated directly from hematopoietic stem cells. Cell 154, 1112–1126. doi: 10.1016/j.cell.2013.08.007
Ye, H., Wang, X., Li, Z., Zhou, F., Li, X., Ni, Y., et al. (2017). Clonal analysis reveals remarkable functional heterogeneity during hematopoietic stem cell emergence. Cell Res. 27, 1065–1068. doi: 10.1038/cr.2017.64
Yokomizo, T., and Dzierzak, E. (2010). Three-dimensional cartography of hematopoietic clusters in the vasculature of whole mouse embryos. Development 137, 3651–3661. doi: 10.1242/dev.051094
Yokomizo, T., Watanabe, N., Umemoto, T., Matsuo, J., Harai, R., Kihara, Y., et al. (2019). Hlf marks the developmental pathway for hematopoietic stem cells but not for erythro-myeloid progenitors. J. Exp. Med. 216, 1599–1614. doi: 10.1084/jem.20181399
Zeng, Y., He, J., Bai, Z., Li, Z., Gong, Y., Liu, C., et al. (2019). Tracing the first hematopoietic stem cell generation in human embryo by single-cell RNA sequencing. Cell Res. 29, 881–894. doi: 10.1038/s41422-019-0228-6
Zheng, X., Zhang, G., Gong, Y., Ning, X., Bai, Z., He, J., et al. (2019). Embryonic lineage tracing with Procr-CreER marks balanced hematopoietic stem cell fate during entire mouse lifespan. J. Genet. Genom. 46, 489–498. doi: 10.1016/j.jgg.2019.10.005
Zhou, F., Li, X., Wang, W., Zhu, P., Zhou, J., He, W., et al. (2016). Tracing haematopoietic stem cell formation at single-cell resolution. Nature 533, 487–492. doi: 10.1038/nature17997
Keywords: pre-hematopoietic stem cells, hematopoietic stem cells, Hlf, aorta-gonad-mesonephros, genetic lineage tracing, hematopoietic development
Citation: Tang W, He J, Huang T, Bai Z, Wang C, Wang H, Yang R, Ni Y, Hou J, Wang J, Zhou J, Yao Y, Gong Y, Hou S, Liu B and Lan Y (2021) Hlf Expression Marks Early Emergence of Hematopoietic Stem Cell Precursors With Adult Repopulating Potential and Fate. Front. Cell Dev. Biol. 9:728057. doi: 10.3389/fcell.2021.728057
Received: 20 June 2021; Accepted: 17 August 2021;
Published: 13 September 2021.
Edited by:
Yiyue Zhang, South China University of Technology, ChinaReviewed by:
Zilong Wen, Hong Kong University of Science and Technology, SAR ChinaYan Li, Zhejiang University, China
Mihaela Crisan, University of Edinburgh, United Kingdom
Copyright © 2021 Tang, He, Huang, Bai, Wang, Wang, Yang, Ni, Hou, Wang, Zhou, Yao, Gong, Hou, Liu and Lan. This is an open-access article distributed under the terms of the Creative Commons Attribution License (CC BY). The use, distribution or reproduction in other forums is permitted, provided the original author(s) and the copyright owner(s) are credited and that the original publication in this journal is cited, in accordance with accepted academic practice. No use, distribution or reproduction is permitted which does not comply with these terms.
*Correspondence: Bing Liu, bingliu17@126.com; Yu Lan, rainyblue_1999@126.com