Noggin Overexpression Impairs the Development of Muscles, Tendons, and Aponeurosis in Soft Palates by Disrupting BMP-Smad and Shh-Gli1 Signaling
 Jiamin Deng1,2†
  Shangqi Wang1,2†
  Nan Li1,2,3† Xiaoyan Chen1,2 Biying Wang1,2 Han Liu1,2 Lei Zhu1,2 Wei Cong1,2,3 Jing Xiao1,2,3*
  Chao Liu1,2,3*
- 1Department of Oral Pathology, School of Stomatology, Dalian Medical University, Dalian, China
- 2Dalian Key Laboratory of Basic Research in Oral Medicine, School of Stomatology, Dalian Medical University, Dalian, China
- 3Academician Laboratory of Immune and Oral Development and Regeneration, Dalian Medical University, Dalian, China
The roles of bone morphogenetic protein (BMP) signaling in palatogenesis were well documented in the developing hard palate; however, little is known about how BMP signaling regulates the development of soft palate. In this study, we overexpressed Noggin transgene via Osr2-creKI allele to suppress BMP signaling in the developing soft palate. We found that BMP-Smad signaling was detected in the palatal muscles and surrounding mesenchyme. When BMP-Smad signaling was suppressed by the overexpressed Noggin, the soft palatal shelves were reduced in size with the hypoplastic muscles and the extroversive hypophosphatasia (HPP). The downregulated cell proliferation and survival in the Osr2-creKI;pMes-Noggin soft palates were suggested to result from the repressed Shh transcription and Gli1 activity, implicating that the BMP-Shh-Gli1 network played a similar role in soft palate development as in the hard palate. The downregulated Sox9, Tenascin-C (TnC), and Col1 expression in Osr2-creKI;pMes-Noggin soft palate indicated the impaired differentiation of the aponeurosis and tendons, which was suggested to result in the hypoplasia of palatal muscles. Intriguingly, in the Myf5-creKI;pMes-Noggin and the Myf5-creKI;Rosa26R-DTA soft palates, the hypoplastic or abrogated muscles affected little the fusion of soft palate. Although the Scx, Tnc, and Co1 transcription was significantly repressed in the tenogenic mesenchyme of the Myf5-creKI;pMes-Noggin soft palate, the Sox9 expression, and the Tnc and Col1 transcription in aponeurosis mesenchyme were almost unaffected. It implicated that the fusion of soft palate was controlled by the mesenchymal clues at the tensor veli palatini (TVP) and levator veli palatini (LVP) levels, but by the myogenic components at the palatopharyngeus (PLP) level.
Introduction
The secondary palate of mammals is composed of the hard palate occupying the anterior two-thirds of the entire palate and the soft palates in the posterior one-third of palate (Bush and Jiang, 2012). The developing hard palate is constituted by the covering epithelium that originated from surface ectoderm and the mesenchyme derived from cranial neural crest (Bush and Jiang, 2012; Li et al., 2017). In contrast, the soft palate contains not only the covering epithelium and neural crest-derived mesenchyme differentiating into tendons and other irregular connective tissues (Nassari et al., 2017), but also the myoblasts that originated from the mesoderm-derived branchiomeric mesenchyme (Li et al., 2019). There are five muscles in the human soft palate: tensor veli palatini (TVP), levator veli palatini (LVP), palatoglossus (PLG), palatopharyngeus (PLP), and musculus uvulae. Except musculus uvulae, the other four pairs of muscles attach to the palatine aponeurosis, a fan-like fibrous structure connecting the posterior board of the hard palate (Grimaldi et al., 2015; Li et al., 2019). Despite the absence of musculus uvulae, the anatomy of soft palate in mouse is similar to that in humans (Grimaldi et al., 2015; Li et al., 2019).
The molecular regulatory networks in the anterior and posterior palatal shelves were distinguishable from each other and have been well studied (Li et al., 2017). However, the molecular mechanisms involved in soft palate development were still poorly understood, which could be attributed to the limited animal models recapitulating the cleft soft palate in humans (Li et al., 2019). Additionally, in most previous studies, the posterior palate referred to the most posterior margin of the hard palate, which overlapped the presumptive TVP level, but ignored the LVP and PLP levels of soft palate (Li et al., 2017). Thus, not only the molecular mechanisms controlling the connective tissue formation and myogenesis in soft palate, but also the association of palatal myogenesis and tenogenesis with the morphogenesis of soft palate remains unknown.
Recently, Wnt, FGF, and Hh signaling pathways were reported to be activated in the mesenchyme surrounding the myofibers in the developing soft palate, implicating that these signaling pathways were also critical in the tenogenesis in soft palate (Sugii et al., 2017; Janečková et al., 2019). A previous study found that in the developing mouse soft palate, the epithelial TGFβ signaling repressed Dkk1 and Dkk4 transcription in palatal epithelium to maintain the canonical Wnt signaling in the mesenchyme of soft palate (Iwata et al., 2014). Inactivation of Tgfbr2 in epithelium disrupted the muscle patterning in soft palate by suppressing mesenchymal canonical Wnt signaling (Iwata et al., 2014). Since the tendons in soft palate predominantly originated from mesenchyme (Nassari et al., 2017), this report implied that the epithelial TGFβ signaling controlled muscle patterning by regulating tendon development (Huang et al., 2013).
Previous studies demonstrated that bone morphogenetic proteins (BMPs) play critical roles during palatogenesis. In the developing mouse palates, Bmp2 and Bmp4 were expressed in the anterior palate at E13.5 (Zhang et al., 2002) and activated Bmpr1a in the anterior palatal mesenchyme (Lu et al., 2011). Bmp4 and its downstream target, Msx1, maintained Shh transcription in the anterior palatal epithelium, which was required for the cell proliferation in the underlying mesenchyme (Zhang et al., 2002). Inactivation of Bmpr1a with Wnt1-cre or Osr2-cre suppressed cell proliferation in the anterior palate (Baek et al., 2011; Lu et al., 2011). From E14.5 to E16.5, Bmpr1a was activated in the medial mesenchyme of the posterior palates (Lu et al., 2011), which coincided with the phosphorylated Smad1/5/8 domain (He et al., 2010). Combined with the compromised osteogenesis in the Osr2-cre;Smad4f/f mouse palatine (Parada et al., 2013), these results strongly suggested the indispensable role of BMP-Smad signaling in the osteogenesis of the presumptive palatine. Furthermore, our latest study showed that the suppression on BMP-Smad signaling by overexpressing Noggin impaired the osteogenesis of the hard palate in mice by inhibiting osteogenic differentiation in the palatal mesenchyme (Li et al., 2021).
The latest study reported that Bmp3 and Bmp7 were activated in the most posterior part of palate at E13.5 (Fu et al., 2017), which suggested an involvement of BMP-Smad signaling in the development of soft palate. To examine whether the mesenchymal BMP signaling contributes to the development of soft palate, we investigate the development of the soft palate in Osr2-creKI;pMes-Noggin mouse embryos. Since the Osr2-creKI;pMes-Noggin mouse embryos suffer from a complete cleft palate, to exclude the possibility that the cleft in the soft palate was secondary to the cleft in the hard palate, we focused on the primary defects in the cell survival, connective tissue formation, and myogenesis in the soft palate of Osr2-creKI;pMes-Noggin mouse embryos.
Materials and Methods
Mouse Lines
All the Osr2-creKI (Chen et al., 2009), pMes-Noggin (Xiong et al., 2009), Myf5-cre (Stock No. 007893), Rosa26R-mT/mG (Stock No. 007676), and Rosa26R-DTA (Stock No. 009669) mice used in this study were bred in the Specific Pathogenic Free System of the Institute of Genome Engineered Animal Models for Human Diseases at Dalian Medical University by strictly following the Guide for the Care and Use of Laboratory Animals of Dalian Medical University. Genotyping were performed as the previous description (Chen et al., 2009; Xiong et al., 2009) or following Jackson Lab’s instructions. To get the timed pregnant mice, mating of the female mice to male mice were started from 8:00 p.m. until 8:00 a.m. The morning detection vaginal plug was recorded as E0.5. The timed pregnant female mice were sacrificed by cervical dislocation after CO2 anesthesia to collect the embryos.
Cryostat Section
The E16.5 Osr2-creKI;Rosa26R-mT/mG mouse heads were fixed with a mixture containing 4% paraformaldehyde (PFA) and 15% sucrose overnight at 4°C. Then, the heads were dehydrated in 30% sucrose and embedded in optimum cutting temperature (O.C.T.) compound (Tissue-Tek, Sakura® Finetek, VWR, Torrance, CA, United States) for 10-μm section. Immediately after sectioning, the sections were observed, and images were taken by the Olympus DP72 microscope (Olympus, Tokyo, Japan) as previously described (Tian et al., 2021).
Paraffin Section and Staining
The embryonic mouse heads at the desired stages were collected in ice-cold phosphate-buffered saline (PBS) and fixed in ice-cold 4% PFA overnight. The fixed samples were dehydrated with gradient alcohols for paraffin embedding. The embedded samples were sectioned crossly at a thickness of 10 μm for Masson staining as previously described (Li et al., 2021).
Immunohistochemistry and Immunohistofluorescence
Immunohistochemistry staining was performed on the paraffin sections of 10-μm thickness. The primary antibodies used for immunohistochemistry were anti-myosin (ZM0196; Zhongshan Golden Bridge, Beijing, China), anti-phospho-Smad1/5/8 (13820S; 1:200, Cell Signaling Technology, Danvers, MA, United States), and anti-Sox9 (ab185966; Abcam, Cambridge, MA, United States). The horseradish peroxidase (HRP)-conjugated anti-rabbit/mouse IgG and the DAB substrate kit purchased from MXB Biotechnologies Inc. (Fujian, China) were used as the secondary antibody and color development reagent, respectively, as the manufacturer instructed. Methyl green or hematoxylin was used for counter-staining.
For Gli1 immunohistofluorescence, the paraffin sections were incubated with the rabbit IgG (514675; ZEn Bio Inc., Chengdu, China) after re-hydration in the gradient ethanol solutions and washing in PBS. The CY3-conjugated goat anti-rabbit IgG (S0011; Affinity, Cincinnati, OH, United States) was applied as the secondary antibody. The Olympus DP72 microscope was used for fluorescence observation and image collection.
Cell Proliferation and Apoptosis Assay
To assess the cell proliferation, the immunohistostaining with antibody against Ki67 (511390; ZEN Bio Inc., China) was performed on the 10-μm-thick paraffin sections. The HRP-conjugated anti-rabbit/mouse IgG (MXB Biotechnologies Inc., Fujian, China) was used as the secondary antibody. The color was developed with the DAB substrate kit (MXB Biotechnologies Inc., Fujian, China), following the manufacturer’s instruction. Hematoxylin was used for counter-staining. The TUNEL assay was also performed on 10-μm-thick paraffin sections with the In Situ Cell Death Detection Kit, POD (11684817910, Roche Diagnostics Corporation, Indianapolis). The procedure for apoptosis detection followed the manufacturer’s instructions. The sections were counter-stained with DAPI and observed by the Olympus DP72 microscope. The percentages of cell proliferation were determined by the numbers of Ki67-positive nuclear to the numbers of the total nuclei. The densities of cell apoptosis were calculated by TUNEL fluorescence signal in a fixed area. To evaluate whether the differences in cell proliferation and death were significant, Student’s t-tests were used to evaluate the pairs of the WT and Osr2-creKI;pMes-Noggin soft palates. The results were presented as mean ± SD of at least three pairs of samples. When the p-value was less than 0.05, the difference was considered to be statistically significant.
In situ Hybridization
Mouse embryonic heads of desired stages were dissected in diethyl pyrocarbonate (DEPC)-treated Dulbecco’s PBS and fixed with 4% PFA in 0.1% DEPC-treated PBS at 4°C overnight. For section in situ hybridization (ISH), the fixed heads were dehydrated in a serial gradient of ethanol solutions followed by paraffin embedding and then prepared as the consecutive sections with 10-μm thickness. For whole-mount ISH, the fixed heads were dehydrated in the gradient methanol. The preparation of the sense and anti-sense RNA probes was transcribed from the plasmids containing the mouse Shh, Scx, Tenascin-C (Tnc), and Col1a1 cDNAs as previously described (Wu et al., 2015; Zhu et al., 2017) by using an RNA Labeling Kit (Roche, Indianapolis, IN, United States). The anti-DIG antibody conjugated with AP and the BM Purple (Roche, Indianapolis, IN, United States) were utilized for probe detection and color development. All the sections were counter-stained by nuclear fast red.
Results
The Hypoplastic Muscles and Extraversive Hypophosphatasia in Osr2-creKI;pMes-Noggin Soft Palates
The E16.5 Osr2-creKI;Rosa26R-mT/mG mouse showed green fluorescence in the aponeurosis, the tendon of TVP, and the inferior part of the hamulus of the medial pterygoid palate (Supplementary Figure 1A), but was excluded from the epithelium and the myofibers of TVP, LVP, and PLP (Supplementary Figures 1A–C). Thus, the Osr2-creKI allele could activate pMes-Noggin transgene in the mesenchyme of soft palate. In the WT soft palate, the horizontally growing shelves began to contact the TVP level at E14.5 (Figure 1A, and were integrated into a floor containing an aponeurosis at E16.5, Figure 1C). While the shelves in the E14.5 and E16.5 Osr2-creKI;pMes-Noggin soft palates were obviously smaller and separated from each other, they grew horizontally (Figures 1B,D). It is worth noticing that the orientation of hypophosphatasias was intraversive in the WT soft palates (Figures 1A,C), but extraversive in the Osr2-creKI;pMes-Noggin soft palates (Figures 1B,D). In addition, both the Masson and Myosin staining indicated that the TVPs in the Osr2-creKI;pMes-Noggin soft palate were mildly smaller than the WT TVPs at E14.5 (Figures 1A,B,E,F), but reduced dramatically in size at E16.5 (Figures 1C,D,G,H). Myosin staining also showed that when the E14.5 WT LVP myofibers became evident (Figure 1I), only a few LVP myofibers sparsely distributed in the Osr2-creKI;pMes-Noggin soft palate (Figure 1J). More severely, in contrast to the elongated and denser LVP myofibers at the E16.5 WT soft palate (Figure 1K), the E16.5 Osr2-creKI;pMes-Noggin LVP myofibers became even looser and shorter than the E14.5 counterparts (Figure 1L). Similarly, although both the E14.5 WT and Osr2-creKI;pMes-Noggin soft palates showed no difference in superior pharyngeal constrictors (SPCs) and devoid of PLPs (Figures 1M,N), the SPCs and PLPs in the E16.5 Osr2-creKI;pMes-Noggin soft palate exhibited smaller sizes and the less myofibers than the WT controls (Figures 1O,P). These results suggested that the Osr2-creKI;pMes-Noggin palatal muscles underwent hypoplasia.
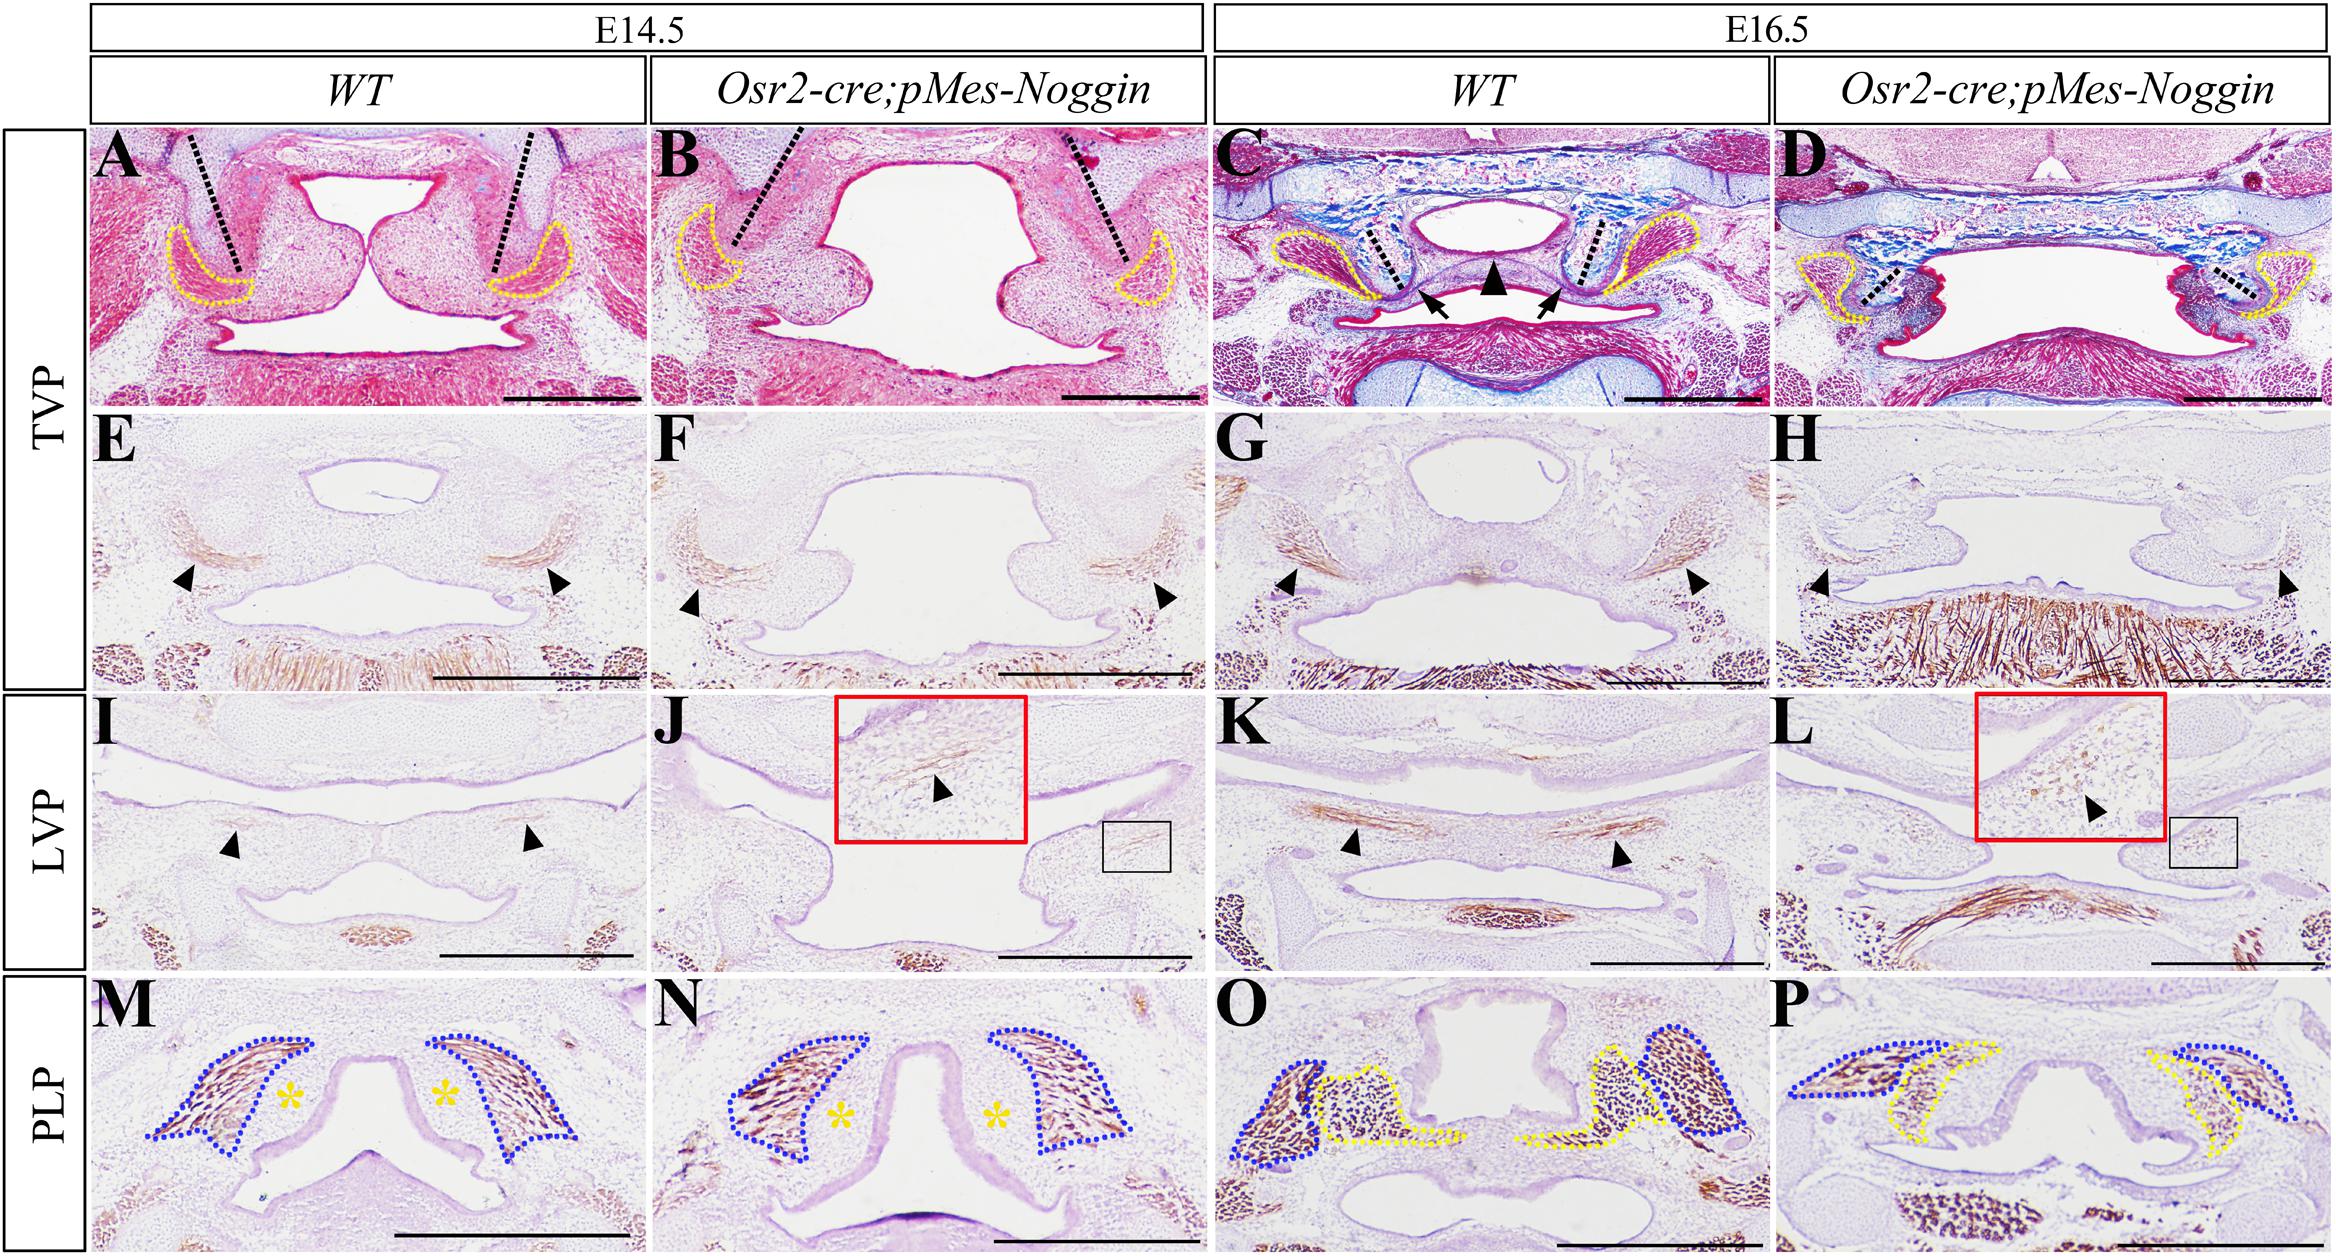
Figure 1. The morphology of HPP and muscles in the Osr2-creKI;pMes-Noggin soft palates. (A–D) Masson staining showed the E14.5 WT soft palate (A), the E14.5 Osr2-creKI;pMes-Noggin soft palate (B), the E16.5 WT soft palate (C), and the E16.5 Osr2-creKI;pMes-Noggin soft palate (D). The dashed yellow lines outline the TVPs; the black arrowheads indicate aponeurosis; the black arrows delineate TVP tendons; and the dashed black lines stand for HPP orientation. (E–H) The myosin staining showed the TVP myofibers of the E14.5 WT soft palate (E), the E14.5 Osr2-creKI;pMes-Noggin soft palate (F), the E16.5 WT soft palate (G), and the E16.5 Osr2-creKI;pMes-Noggin soft palate (H). Black arrows indicate the TVP myofibers. (I–L) The immunostaining of myosin showed the LVP myofibers of the E14.5 WT soft palate (I), the E14.5 Osr2-creKI;pMes-Noggin soft palate (J), the E16.5 WT soft palate (K), and the E16.5 Osr2-creKI;pMes-Noggin soft palate (L). Black arrows point to the LVP myofibers; red boxes in (J,L) are the magnified images in the black boxes. (M–P) The myosin staining showed the SPC and PLP myofibers of the E14.5 WT soft palate (M), the E14.5 Osr2-creKI;pMes-Noggin soft palate (N), the E16.5 WT soft palate (O), and the E16.5 Osr2-creKI;pMes-Noggin soft palate (P). Blue dotted lines outline the SPC; yellow dotted lines circle the PLP; the yellow asterisks delineate the presumptive PLP areas. TVP, tensor veli palatini; LVP, levator veli palatini; PLP, palatopharyngeus; SPC, superior pharyngeal constrictor; HPP, hypophosphatasia. Scale bars are 200 μm.
Suppressed BMP-Smad Signaling and Disrupted Shh-Gli1 Signaling in the Osr2-creKI;pMes-Noggin Soft Palates
The immunostaining of p-Smad1/5/8 was performed to verify the suppressed BMP-Smad signaling in the developing Osr2-creKI;pMes-Noggin soft palate. At both the E13.5 WT and Osr2-creKI;pMes-Noggin TVP levels, the p-Smad1/5/8 staining was only detected in the HPP, but excluded from the myogenic and mesenchymal compartments (Figures 2A,A′). At the E14.5 TVP levels, the p-Smad1/5/8 staining became robust in the HPP and still absent from both the WT and Osr2-creKI;pMes-Noggin TVP and palatal mesenchyme (Figures 2B,B′). At the E15.5 TVP levels, though still robust in both the WT and Osr2-creKI;pMes-Noggin HPPs, the p-Smad1/5/8 staining was also detected in the WT TVP tendon, but absent from the Osr2-creKI;pMes-Noggin TVP tendon (Figures 2C,C′). In contrast, the p-Smad1/5/8 staining was noticeable in the E13.5, E14.5, and E15.5 WT LVP levels (Figures 2D–F), but significantly faded in the Osr2-creKI;pMes-Noggin LVP areas (Figures 2D′–F′). At the E13.5 and E14.5 PLP levels, the p-Samd1/5/8 staining was mainly detected in the WT SPC myofibers (Figures 2G,H), while it was almost diminished in Osr2-creKI;pMes-Noggin SPC (Figures 2G′,H′). At the E15.5 LVP levels, although the p-Smad1/5/8 staining was dramatically decreased in both the WT and Osr2-creKI;pMes-Noggin SPCs and PLPs, the p-Smad1/5/8 staining in the WT mesenchyme was significantly stronger than in the Osr2-creKI;pMes-Noggin mesenchyme (Figures 2I,I′).
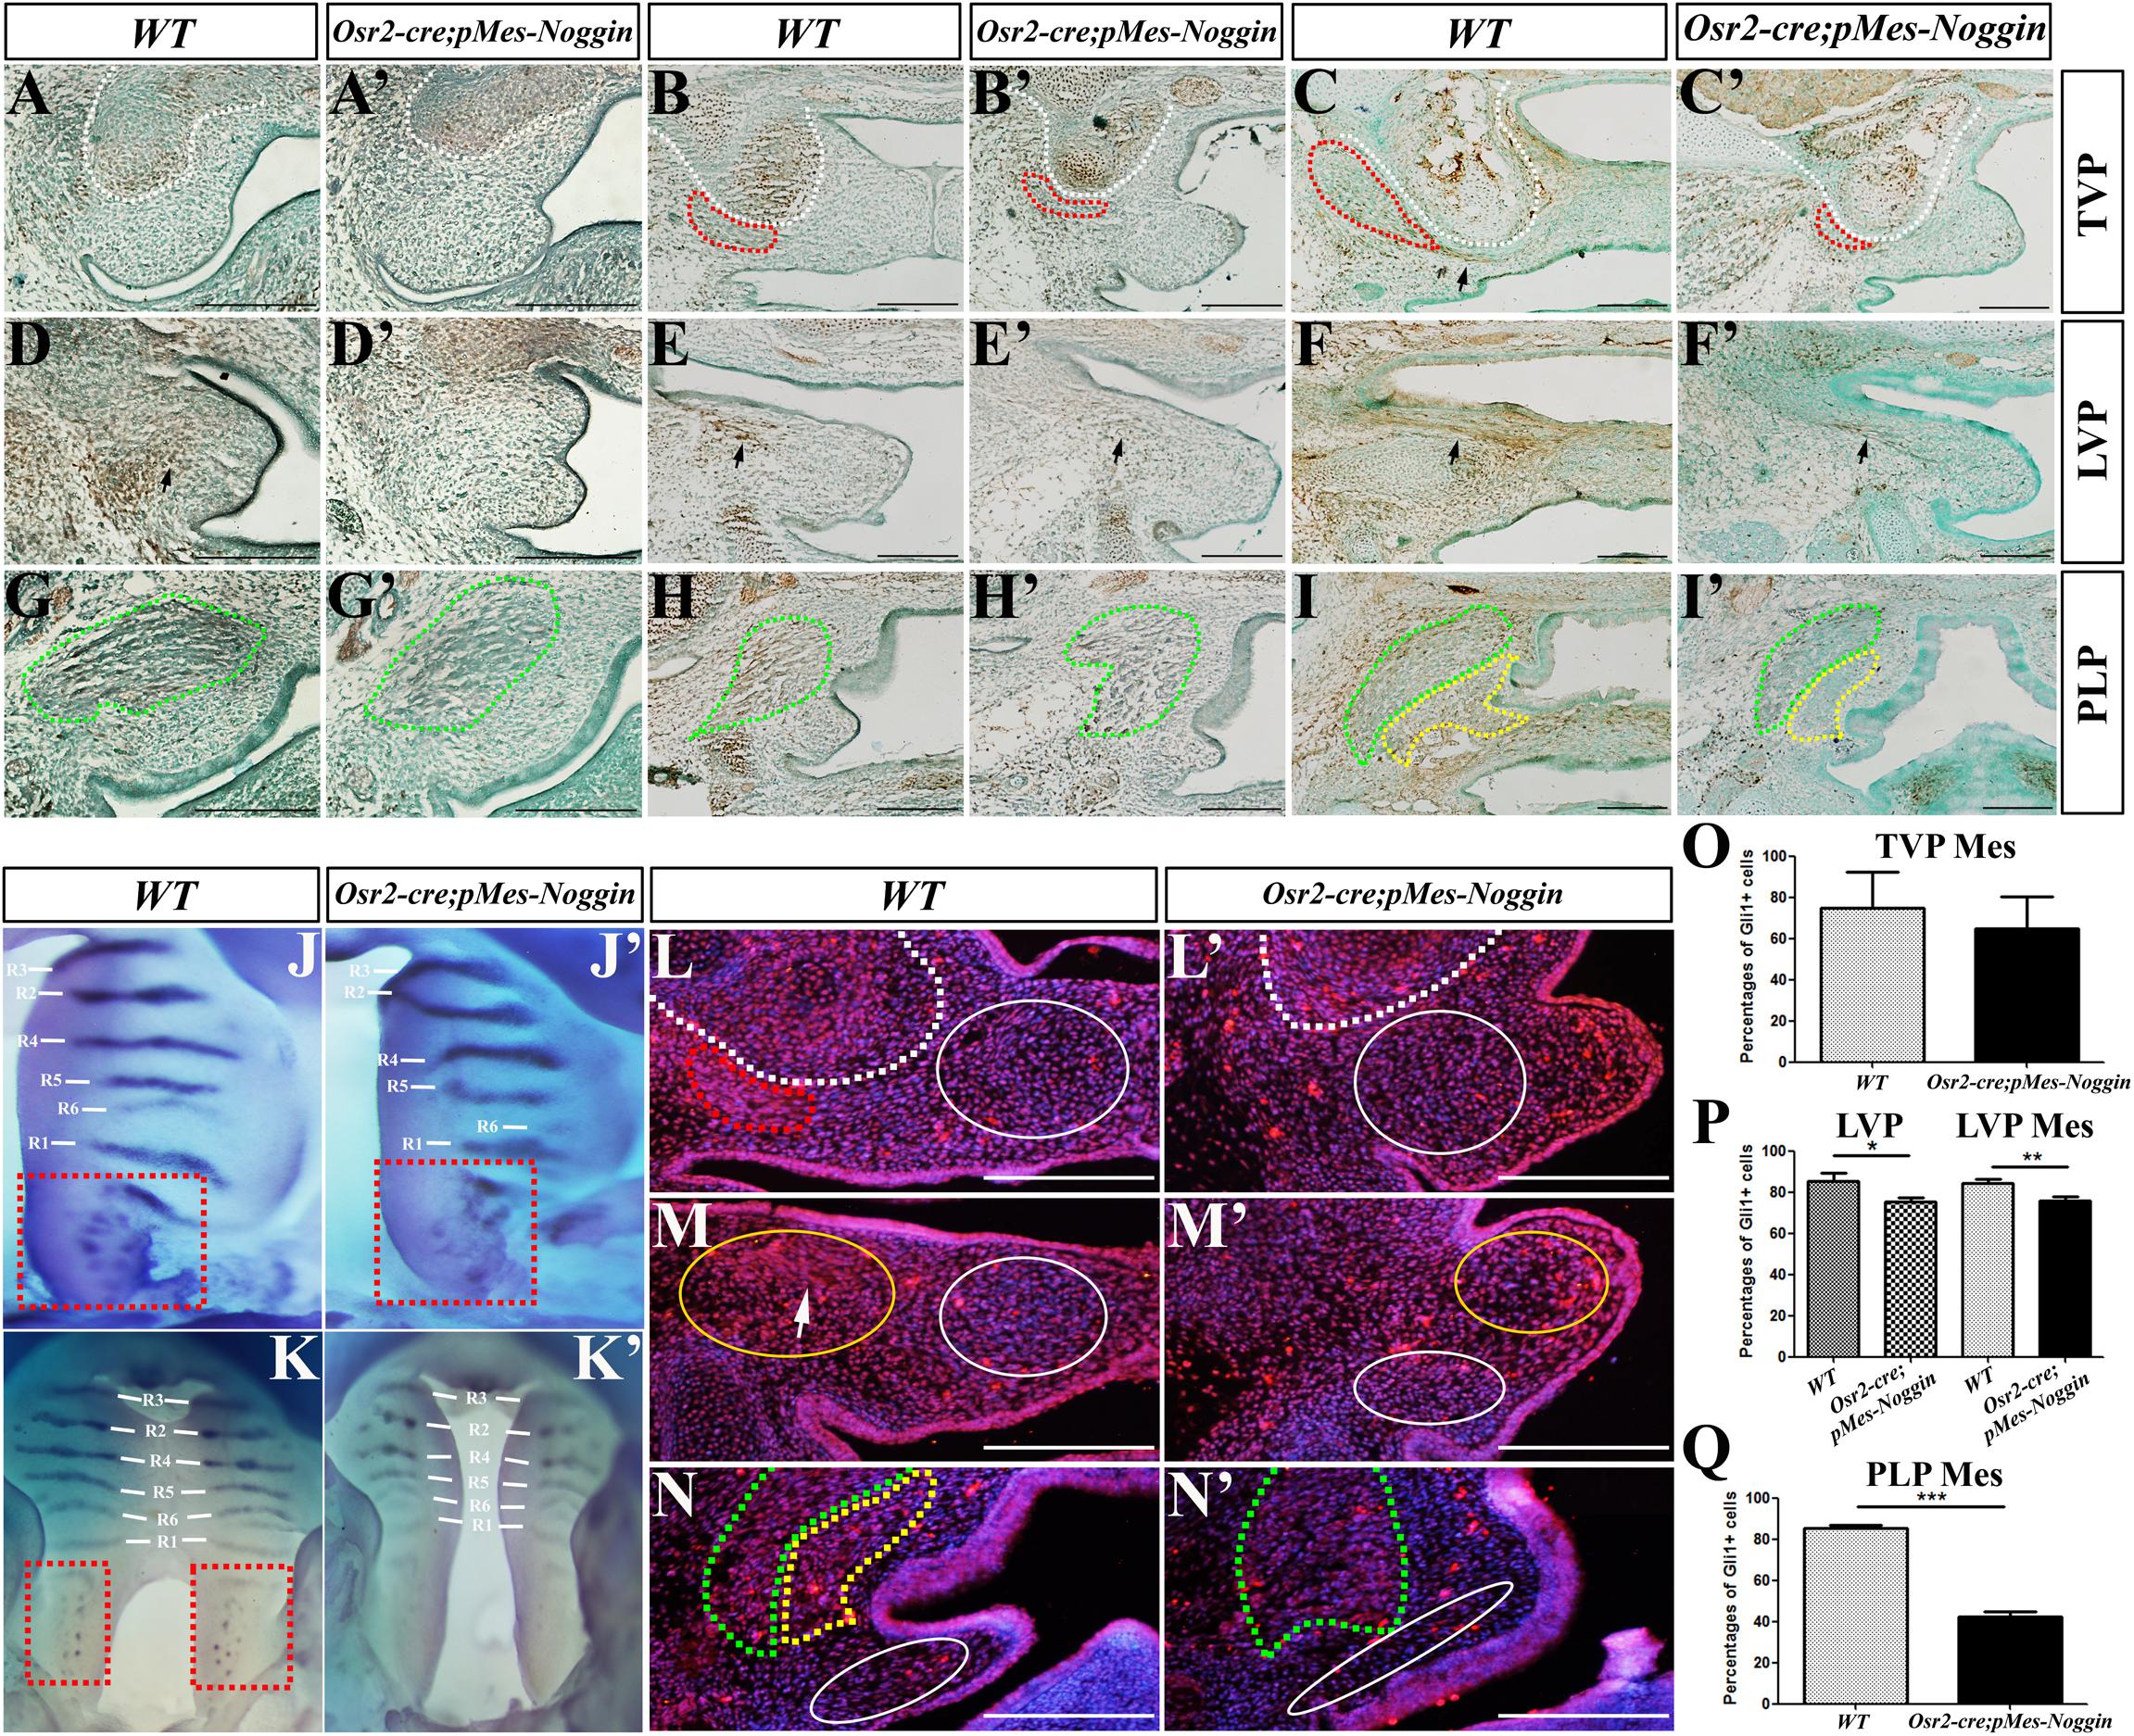
Figure 2. BMP-Smad and Shh-Gli1 signaling in the Osr2-creKI;pMes-Noggin soft palates. (A,A′–C,C′) The immunostaining of p-Smad1/5/8 at the TVP levels of the E13.5 (A), E14.5 (B), and E16.5 (C) WT soft palates, and the E13.5 (A′), E14.5 (B′), and E16.5 (C′) Osr2-creKI;pMes-Noggin soft palates. The arrow in (C) points to the p-Smad1/5/8 staining in TVP tendon. (D,D′–F,F′) The immunostaining of p-Smad1/5/8 at the LVP levels of the E13.5 (D), E14.5 (E), and E16.5 (F) WT soft palates, and the E13.5 (D′), E14.5 (E′), and E16.5 (F′) Osr2-creKI;pMes-Noggin soft palates. The arrows point to the LVP regions. (G,G′–I,I′) The immunostaining of p-Smad1/5/8 at the PLP levels of the E13.5 (G), E14.5 (H), and E16.5 (I) WT soft palates, and the E13.5 (G′), E14.5 (H′), and E16.5 (I′) Osr2-creKI;pMes-Noggin soft palates. (J,J′,K,K′) Whole-mount in situ hybridization of Shh in the E13.5 (J) and E14.5 WT palates (K), as well as the E13.5 (J′) and E14.5 Osr2-creKI;pMes-Noggin palates (K′). The R1–R6 delineate the Shh-expressing rugae, and the dashed red boxes circle soft palates with Shh-positive spots. (L,L′–N,N′) The Gli1 immunostaining in the E14.5 WT soft palate at the TVP (L), LVP (M), and PLP (N) levels, and the E14.5 Osr2-creKI;pMes-Noggin soft palate at the TVP (L′), LVP (M′), and PLP (N′) levels. The white arrowheads in (M) delineate the LVP region. The white dotted lines delineate the boundary of HPP; the red dotted lines circle the TVP; the green dotted lines delineate the SPCs; the yellow dotted lines circle the PLPs; the white solid circles mean the mesenchymal areas for the statistical assay of the Gli1-positive percentages, while the yellow solid circles in (M,M′) mean the LVP areas for the counting of the Gli1-positive cells. Scale bars are 200 μm. (O–Q) The statistical assays of the percentages of the Gli1-positive cells in total cells at the E14.5 TVP levels (O), LVP levels (P), and PLP levels (Q). The percentage of Gli1-positive cells in the soft palate mesenchyme was 75.05% ± 17.05% and 65.03% ± 15.21% at the WT and Osr2-creKI;pMes-Noggin TVP levels, respectively (p = 0.496; O). In the WT LVP myofibers, the percentage of Gli1-positive cells was 85.52% ± 3.83%; this percentage was reduced to 75.49% ± 1.77% in the Osr2-creKI;pMes-Noggin TVP myofibers (p = 0.015; P). Similarly, in the mesenchyme at the LVP levels, the percentage of Gli1-positive cells in WT control was 84.50% ± 1.80%, which was significantly higher than the 75.69% ± 2.33% in the Osr2-creKI;pMes-Noggin counterpart (p = 0.007; P). At PLP levels, the percentage of Gli1-positive cells was 85.22% ± 1.85% in WT mesenchyme, while it was 42.36% ± 2.31% in the Osr2-creKI;pMes-Noggin mesenchyme (p = 0.0003; Q). *p < 0.05; **p < 0.01; ***p < 0.001. Three E14.5 Osr2-creKI;pMes-Noggin embryos and their WT littermates were collected for statistical assay. BMP, bone morphogenetic protein; TVP, tensor veli palatini; LVP, levator veli palatini; PLP, palatopharyngeus; HPP, hypophosphatasia; SPC, superior pharyngeal constrictor.
Shh transcription was also suppressed in the epithelium of the Osr2-creKI;pMes-Noggin hard and soft palates. In contrast to the six Shh-expressing rugae in the E13.5 WT hard palate (Figure 2J), although there were the six rugae detected, the Shh transcription in rugae 5 and 6 of the Osr2-creKI;pMes-Noggin hard palate became significantly fainter (Figure 2J′). Consistently, the Shh-positive spots in the E13.5 Osr2-creKI;pMes-Noggin soft palate became less and fainter than those in the WT counterpart (Figures 2J,J′). Such suppression became more evident it the E14.5 Osr2-creKI;pMes-Noggin palates, in which not only the Shh expression in rugae obviously faded but also Shh spots in the soft palate were almost diminished (Figures 2K,K′). As a consequence of the reduced Shh transcription, the immunostaining of Gli1 in the E14.5 Osr2-creKI;pMes-Noggin soft palate was remarkably decreased. At the TVP level, although the Gli1 staining was dramatically decreased in the Osr2-creKI;pMes-Noggin TVP, the percentage of the Gli1-positive cells in the medial mesenchyme was comparable with that of the WT control (Figures 2L,L′,O). At the WT LVP level, the distribution of Gli1 staining was concentrated in the LVP and sparse in the medial mesenchyme (Figure 2M). In contrast, the distribution of Gli1 staining was much looser in both the Osr2-creKI;pMes-Noggin LVP and the medial mesenchyme (Figure 2M′). Statistical assay indicated that the percentages of the Gli1-positive cells were significantly decreased in both the Osr2-creKI;pMes-Noggin LVP and the mesenchyme (Figure 2P). Similarly, the Gli1 staining in the Osr2-creKI;pMes-Noggin SPC, PLP, and mesenchyme, as well as the percentage of Gli1-positive cells in the Osr2-creKI;pMes-Noggin PLP mesenchyme, was remarkably downregulated (Figures 2N,N′,Q). Taken together, the overexpressed Noggin inhibited the BMP-Smad signaling in the palatal muscles and mesenchyme of soft palate and disrupted Shh transcription in the epithelium of the Osr2-creKI;pMes-Noggin soft palate.
Decreased Cell Proliferation and Survival in Osr2-creKI;pMes-Noggin Soft Palates
To explore how the Osr2-creKI;pMes-Noggin soft palatal shelves were reduced in size, the cell proliferation and apoptosis were examined by Ki76 immunostaining and TUNEL assay. The percentages of the Ki67-positive nucleus in the E13.5 Osr2-creKI;pMes-Noggin TVP and SPC were significantly lower than those in the WT controls (Figures 3A,A′,C,C′,D). Although comparable with those at the WT PLP level (Figures 3C,C′,D), the percentages of the Ki67-positive nucleus in the mesenchyme of E13.5 Osr2-creKI;pMes-Noggin soft palate were significantly decreased at the TVP and LVP levels (Figures 3A,A′,B,B′,D). Such tendency became more evident at E14.5, in that the percentages of Ki67-positive nucleus were decreased in both the muscles and mesenchyme at the Osr2-creKI;pMes-Noggin TVP and LVP levels (Figures 3E,E′,F,F′,H), while both the muscles and mesenchyme at the E14.5 Osr2-creKI;pMes-Noggin PLP levels displayed comparable percentages with the WT controls (Figures 3G,G′,H).
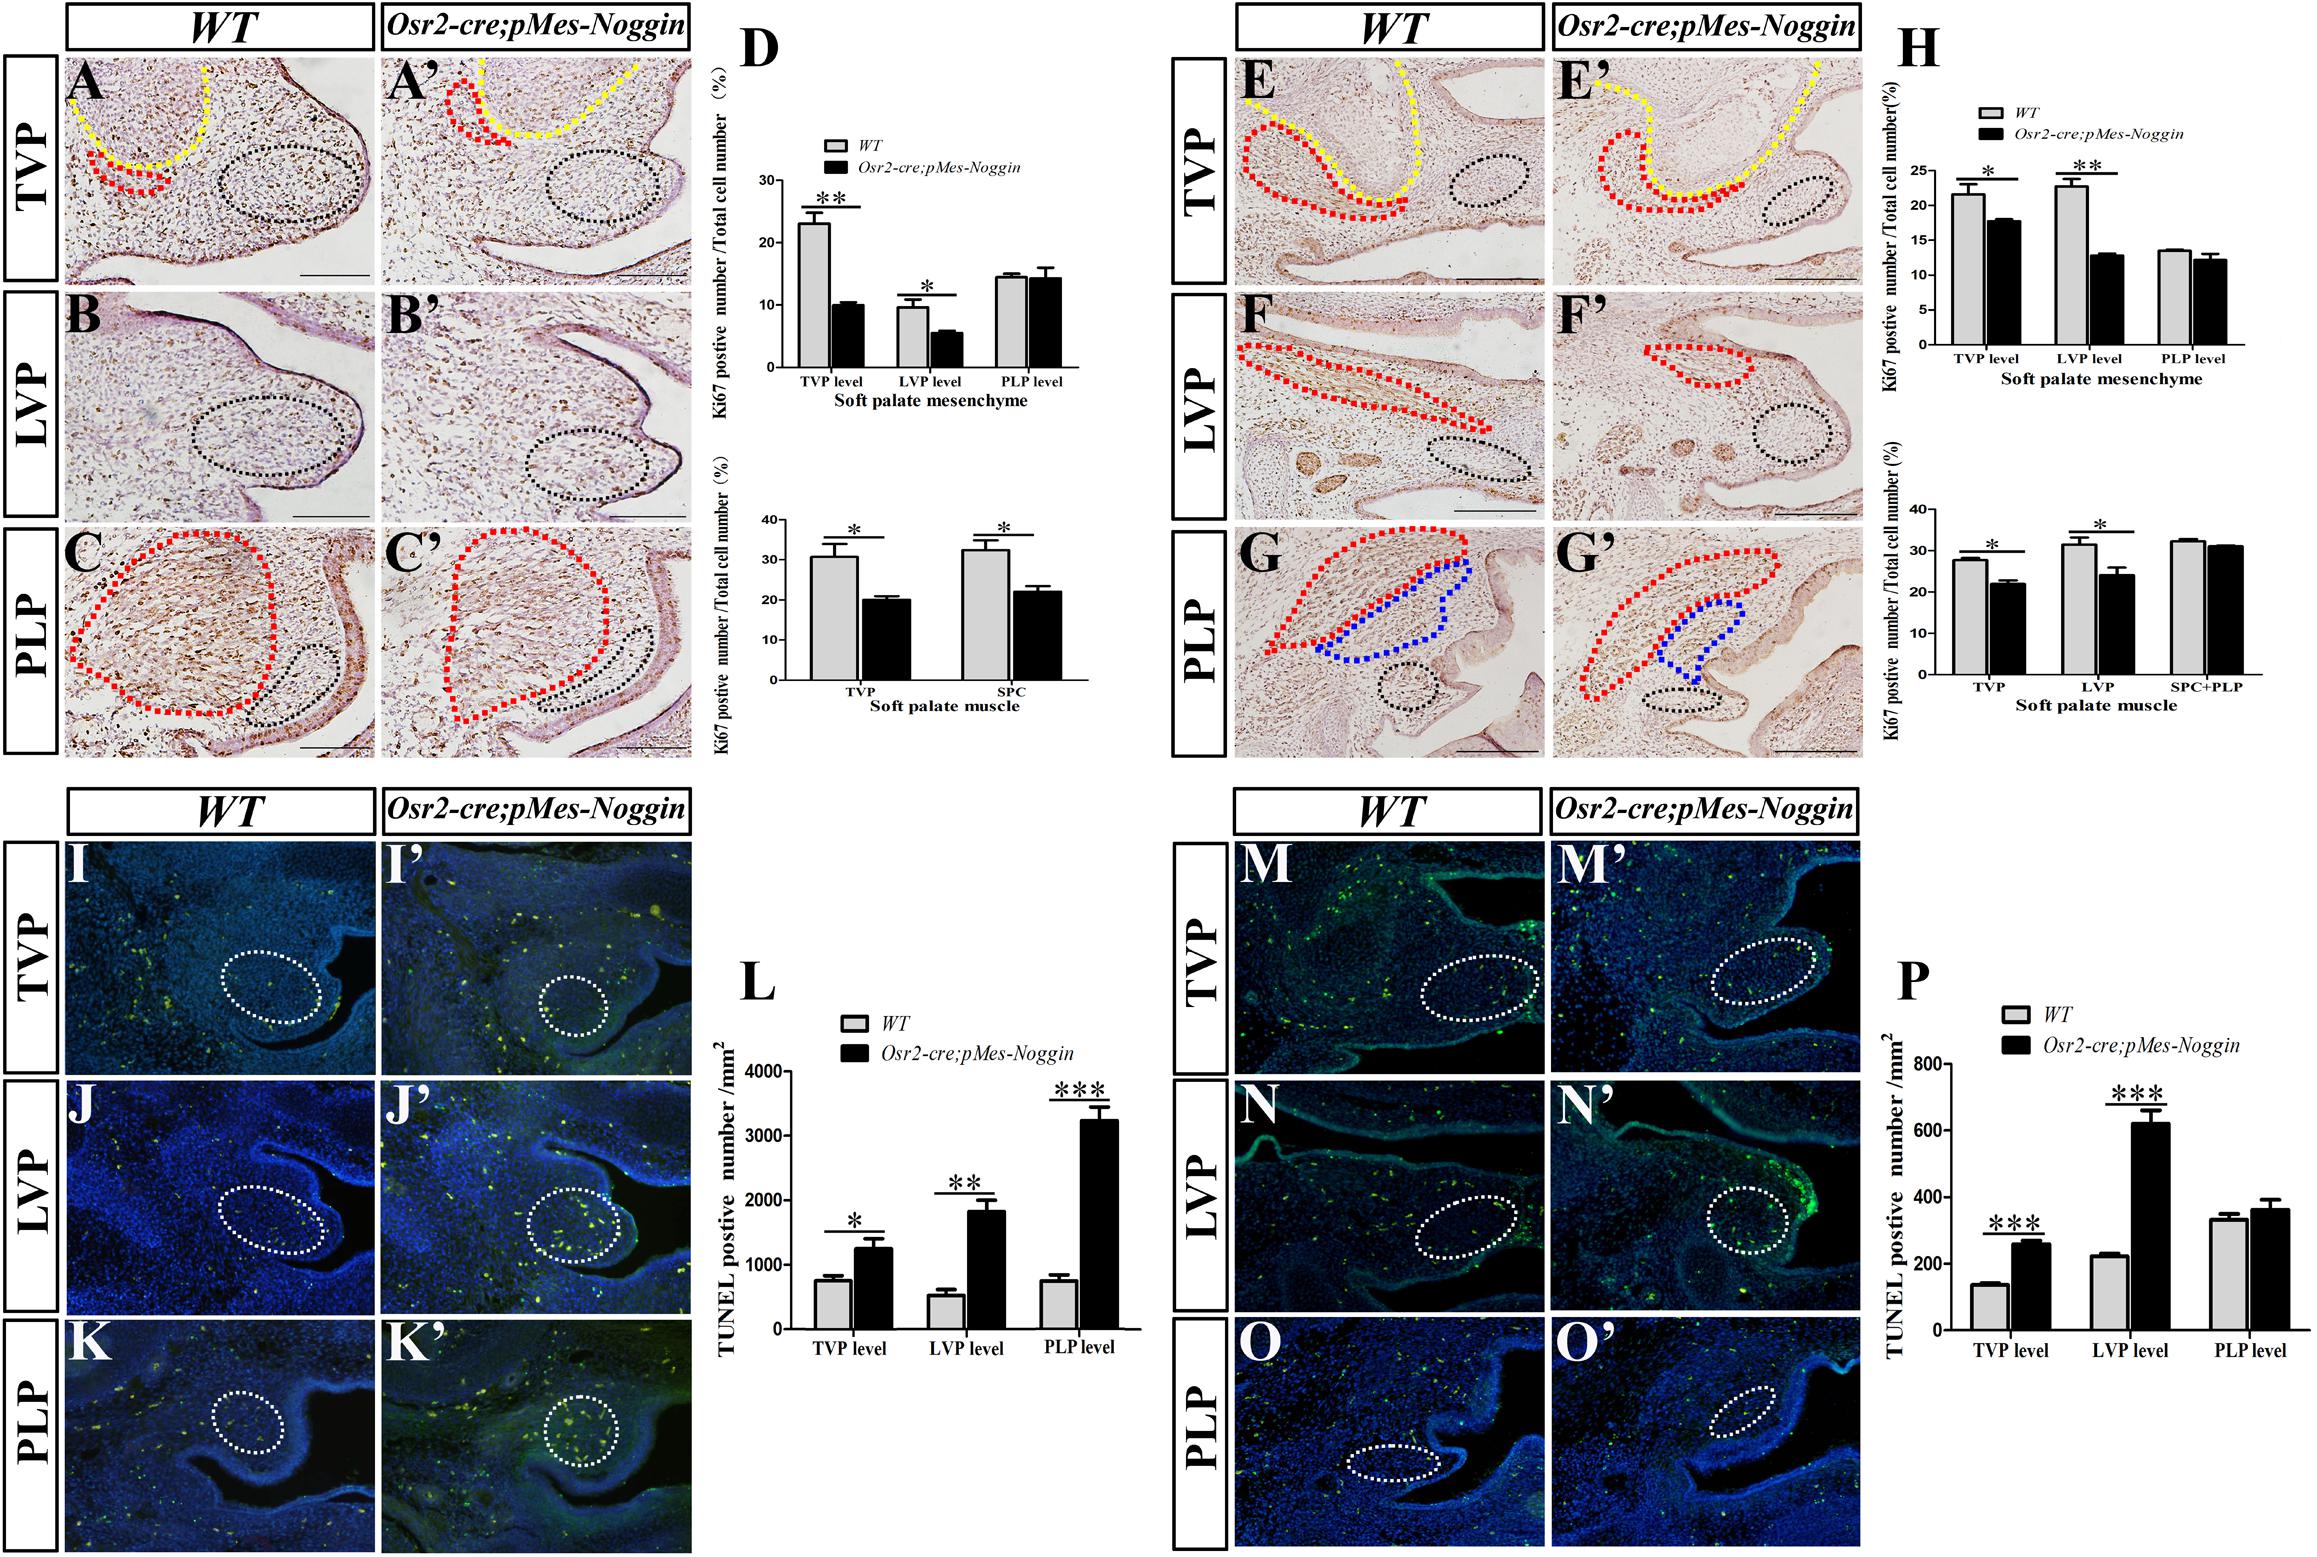
Figure 3. Ki67 immunostaining and TUNEL assay in Osr2-creKI;pMes-Noggin soft palates. (A,A′–C,C′) The immunostaining of Ki67 in the E13.5 WT soft palate at the TVP (A), LVP (B), and PLP (C) levels, and the E13.5 Osr2-creKI;pMes-Noggin soft palates at the TVP (A′), LVP (B′), and PLP (C′) levels. The yellow and red dotted lines in (A,A′) delineate the boundary of HPPs and TVPs, respectively. The red dotted lines in (C,C′) delineate the SPCs. The black dotted circles in (A,A′–C,C′) delineate the mesenchymal areas for Ki67-positive cell counting. (D) Statistical assay for the Ki67 percentages in the TVP and SPC myofibers, and mesenchyme in the E13.5 WT and Osr2-creKI;pMes-Noggin soft palates. Student’s t-test showed that the Ki67 percentages in the E13.5 WT TVP (30.71% ± 5.59%) were higher than those in the Osr2-creKI;pMes-Noggin TVP (20.04% ± 1.56%, p = 0.0335); the Ki67 percentages in the E13.5 WT SPC (32.46% ± 4.18%) were higher than those in the Osr2-creKI;pMes-Noggin SPC (22.07% ± 2.39%, p = 0.0202); the Ki67 percentages in the E13.5 WT TVP mesenchyme (23.08% ± 3.09%) were higher than those in the Osr2-creKI;pMes-Noggin TVP mesenchyme (9.95% ± 0.85%, p = 0.0019); the Ki67 percentages in the E13.5 WT LVP mesenchyme (9.615% ± 2.192%) were higher than those in the Osr2-creKI;pMes-Noggin LVP mesenchyme (5.52% ± 0.604%, p = 0.0355); the Ki67 percentages in the E13.5 WT PLP mesenchyme (14.47% ± 0.936%) were comparable with those in the Osr2-creKI;pMes-Noggin PLP mesenchyme (14.28% ± 3.104%, p = 0.92108) (four E13.5 Osr2-creKI;pMes-Noggin embryos and their WT littermates were collected for statistical assay). (E,E′–G,G′) The immunostaining of Ki67 in the E14.5 WT soft palate at the TVP (E), LVP (F), and PLP (G′) levels, and the E14.5 Osr2-creKI;pMes-Noggin soft palates at the TVP (E′), LVP (F′), and PLP (G′) levels. The yellow and red dotted lines in (E,E′) delineate the boundary of HPPs and TVPs, respectively. The red dotted lines in (F,F′) delineate the LVPs. The red dotted lines in (G,G′) delineate the SPCs. The blue dotted lines in (G,G′) circle PLPs. The black dotted circles in (E,E′–G,G′) delineate the mesenchymal areas for Ki67-positive cell counting. (H) Statistical assay for the Ki67 percentages in the TVP, LVP, SPC, and PLP myofibers and mesenchyme in the E14.5 WT and Osr2-creKI;pMes-Noggin soft palates. Student’s t-test showed that the Ki67 percentages in the E14.5 WT TVP (27.90% ± 0.563%) were higher than those in the Osr2-creKI;pMes-Noggin TVP (23.74% ± 3.765%, p = 0.0025); the Ki67 percentages in the E14.5 WT LVP (35.95% ± 9.36%) were higher than those in the Osr2-creKI;pMes-Noggin SPC (25.69% ± 4.21%, p = 0.04357); the Ki67 percentages in the E14.5 WT SPC and PLP (31.67% ± 1.362%) were indistinguishable from those in the Osr2-creKI;pMes-Noggin SPC and PLP (30.71% ± 0.78%, p = 0.2561); the Ki67 percentages in the E14.5 WT TVP mesenchyme (23.55% ± 4.16%) were higher than those in the Osr2-creKI;pMes-Noggin TVP mesenchyme (18.49% ± 1.466%, p = 0.0121); the Ki67 percentages in the E14.5 WT LVP mesenchyme (21.03% ± 3.725%) were higher than those in the Osr2-creKI;pMes-Noggin LVP mesenchyme (13.19% ± 0.844%, p = 0.00638); the Ki67 percentages in E14.5 WT PLP mesenchyme (14.52% ± 2.06%) were similar to those in the Osr2-creKI;pMes-Noggin PLP mesenchyme (12.72% ± 1.654%, p = 0.22456). Five E14.5 Osr2-creKI;pMes-Noggin embryos and their WT littermates were collected for statistical assay. (I,I′–K,K′) The TUNEL assay in the E13.5 WT soft palate at the TVP (I), LVP (J), and PLP (K) levels, and the E13.5 Osr2-creKI;pMes-Noggin soft palates at the TVP (I′), LVP (J′), and PLP (K′) levels. The white dotted circles in (I,I′–K,K′) mean the areas for TUNEL-positive cell counting. (L) Statistical assay for the TUNEL densities in the E13.5 WT and Osr2-creKI;pMes-Noggin soft palates at the TVP, LVP, and PLP levels. Student’s t-test showed that the TUNEL densities in the E13.5 WT TVP level (754.29 ± 139.14 cells/mm2) were much lower than those in the Osr2-creKI;pMes-Noggin TVP level (1,251.18 ± 269.98 cells/mm2, p = 0.0472); the TUNEL densities in the E13.5 WT LVP level (526.23 ± 155.39 cells/mm2) were lower than those in the Osr2-creKI;pMes-Noggin LVP level (1,823.57 ± 309.96 cells/mm2, p = 0.00292); the TUNEL densities in the E13.5 WT PLP level (746.05 ± 8.01 cells/mm2) were lower than those in the Osr2-creKI;pMes-Noggin PLP level (3,332.16 ± 366.88 cells/mm2, p = 0.000435). Three E13.5 Osr2-creKI;pMes-Noggin embryos and their WT littermates were collected for statistical assay. (M,M′–O,O′) The TUNEL assay in the E14.5 WT soft palate at the TVP (M), LVP (N), and PLP (O) levels, and the E13.5 Osr2-creKI;pMes-Noggin soft palates at the TVP (M′), LVP, (N′) and PLP (O′) levels. The white dotted circles in (M,M′–O,O′) mean the areas for TUNEL-positive cell counting. (P) Statistical assay for the TUNEL densities in the E14.5 WT and Osr2-creKI;pMes-Noggin soft palates at the TVP, LVP, and PLP levels. Student’s t-test showed that the TUNEL densities in the E14.5 WT TVP level (136.65 ± 8.41 cells/mm2) were much lower than those in the Osr2-creKI;pMes-Noggin TVP level (259.01 ± 17.89 cells/mm2, p = 0.0004275); the TUNEL densities in the E14.5 WT LVP level (222.01 ± 14.21 cells/mm2) were significantly lower than those in the Osr2-creKI;pMes-Noggin LVP level (620.29 ± 70.66 cells/mm2, p = 0.000666); the TUNEL densities in the E14.5 WT PLP level (323.08 ± 13.34 cells/mm2) were comparable with those in the Osr2-creKI;pMes-Noggin PLP level (362.25 ± 51.88 cells/mm2, p = 0.2740). ∗p < 0.05; ∗∗p < 0.01; ∗∗∗p < 0.001. Four E14.5 Osr2-creKI;pMes-Noggin embryos and their WT littermates were collected for statistical assay. TVP, tensor veli palatini; LVP, levator veli palatini; PLP, palatopharyngeus; HPP, hypophosphatasia; SPC, superior pharyngeal constrictor.
On the other hand, TUNEL assay indicated that the densities of the cell apoptosis at the TVP, LVP, and PLP levels in the E13.5 Osr2-creKI;pMes-Noggin soft palate were all statistically higher than those in the E13.5 WT soft palates (Figures 3I–K′,L). Even in the E14.5, the Osr2-creKI;pMes-Noggin soft palate exhibited significantly higher densities of cell apoptosis at the TVP and LVP levels (Figures 3M,M′,N,N′,P), though comparable with the WT counterparts at the PLP level (Figures 3O,O′,P). These findings suggested that there were reduced cell proliferation and survival in the Osr2-creKI;pMes-Noggin soft palatal shelves, which could primarily lead to the cleft in soft palate.
Impaired Aponeurosis and Tendon Development in the Osr2-creKI;pMes-Noggin Soft Palate
During craniofacial development, Sox9 acts as the marker of the osteo-chondrogenic mesenchyme (Almalki and Agrawal, 2016; Dash and Trainor, 2020). At the E14.5 WT TVP level, the robust Sox9 expression was detected not only in the HPP but also in the mesenchyme of the presumptive aponeurosis, which connected the bilateral palatal shelves (Figure 4A). In contrast, the Sox9-expressing domain in the Osr2-creKI;pMes-Noggin soft palate was dramatically reduced in the mesenchyme for the presumptive aponeurosis, though differed little from the WT control in the HPP (Figure 4B). Similar to the TVP level, the Sox9 staining at the LVP showed no discrepancy between the WT and Osr2-creKI;pMes-Noggin posterior HPP (Figures 4C,D), but in the presumptive Osr2-creKI;pMes-Noggin aponeurosis, the Sox9-expressing area was also greatly decreased than in the WT control (Figures 4C,D). At the PLP level, the Sox9 expression was only sporadically distributed in the WT mesenchyme (Figures 4E,F), which was also evidently decreased in the Osr2-creKI;pMes-Noggin mesenchyme (Figures 4E,F). These data implicated an attenuated osteo-chondrogenic fate of the aponeurosis in the Osr2-creKI;pMes-Noggin soft palate. ISH showed that the transcription of Scx, the key transcription factor for tenogenic specification and maintenance, was suppressed moderately in the E14.5 Osr2-creKI;pMes-Noggin TVP and mildly in the LVP compared with the WT counterparts (Figures 4G–J). There was no Scx transcription detected in neither the WT nor Osr2-creKI;pMes-Noggin PLP levels (Figures 4K,L). At the E14.5 TVP and LVP levels, the extracellular matrix, Tnc was also transcribed more weakly in both the Osr2-creKI;pMes-Noggin myogenic and mesenchymal areas than those in the WT controls (Figures 4M–P). Similar to the Scx expression, there was no Tnc expression detected in the WT and Osr2-creKI;pMes-Noggin PLP levels (Figures 4Q,R). Compared with the WT soft palate (Figures 4S,U,W), the Col1α1-expressing domains in the myogenic and aponeurosis areas of the E14.5 Osr2-creKI;pMes-Noggin soft palate were remarkably decreased at the TVP and LVP levels (Figures 4T,V), but almost indistinguishable at the PLP level (Figure 4X). These results suggested that both the specification and differentiation of the tendons and aponeurosis in Osr2-creKI;pMes-Noggin soft palate were impacted by the overexpressed Noggin.
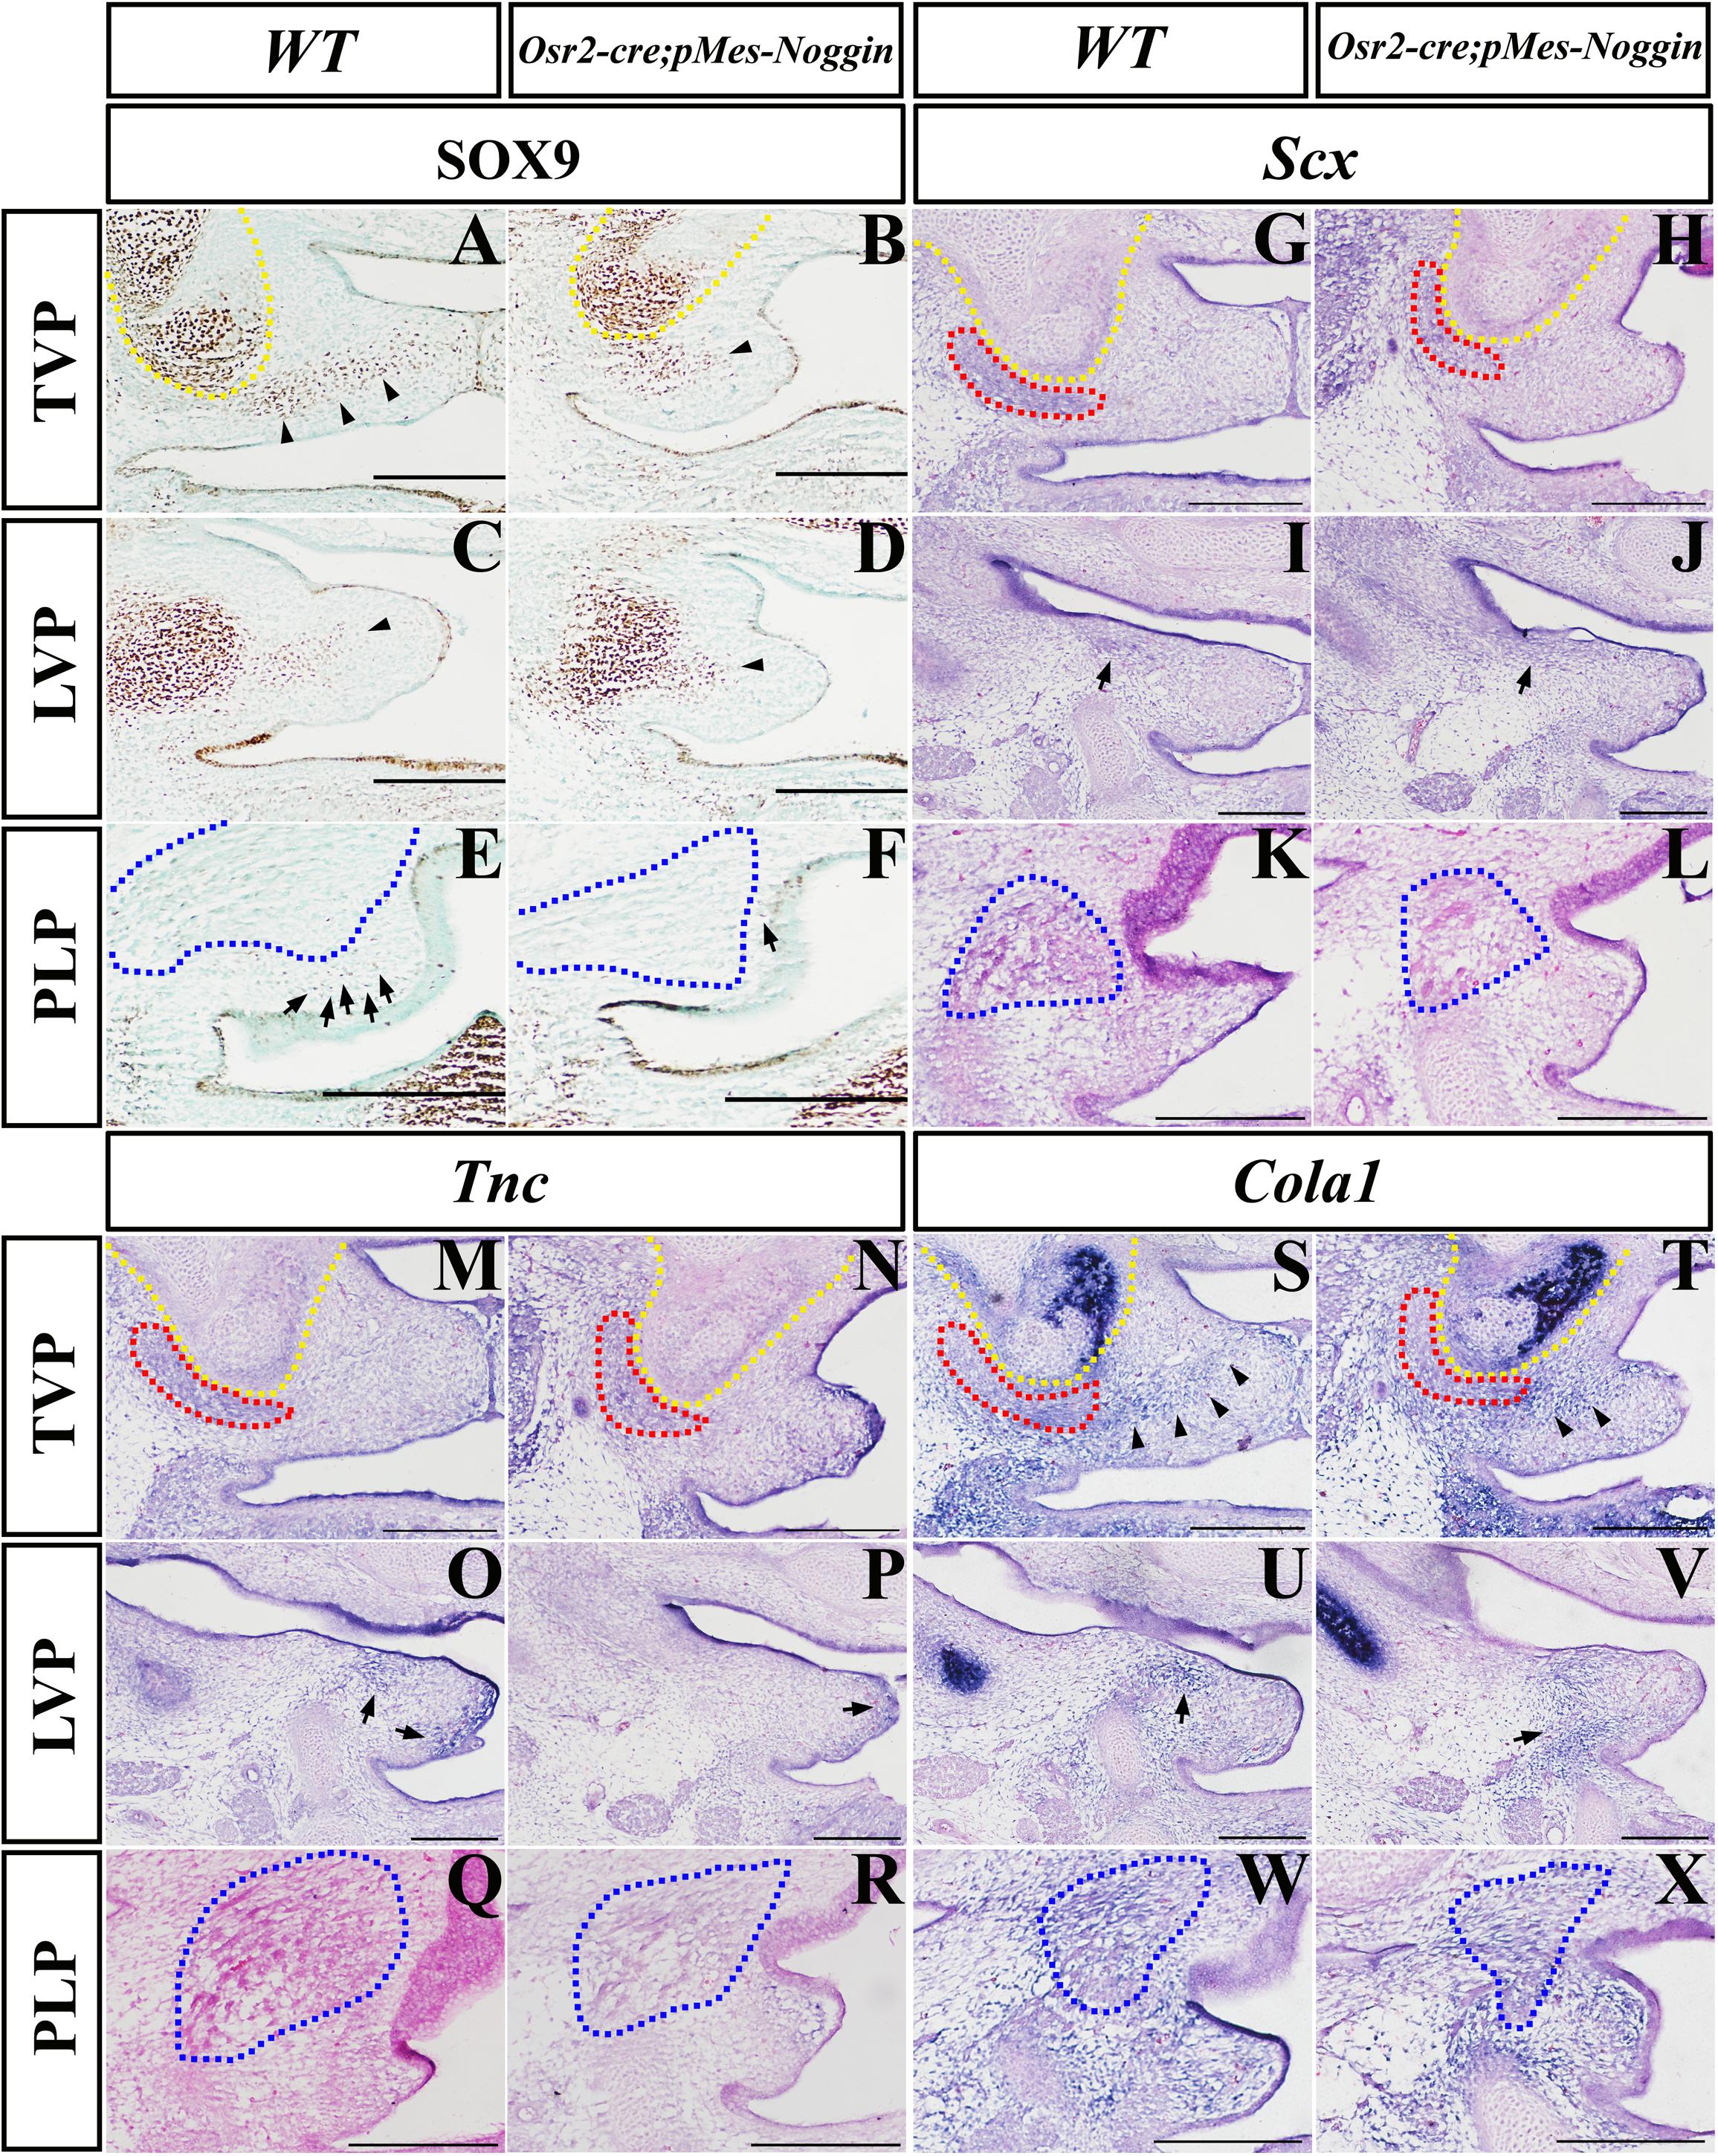
Figure 4. The Sox9, Scx, TnC, and Col1a1 expression in Osr2-creKI;pMes-Noggin soft palates. (A–F) The immunostaining of Sox9 in the E14.5 WT soft palate at the TVP (A), LVP (C), and PLP (E) levels, and the E14.5 Osr2-creKI;pMes-Noggin soft palate at the TVP (B), LVP (D), and PLP (F) levels. The arrowheads in (A–D) point to the Sox9 domain in the mesenchyme. The arrows in (E,F) point to the Sox9-positive cells in the mesenchyme. (G–L) In situ hybridization of Scx in the E14.5 WT soft palate at the TVP (G), LVP (I), and PLP (K) levels, and the E14.5 Osr2-creKI;pMes-Noggin soft palate at the TVP (H), LVP (J), and PLP (L) levels. The arrows in (I,J) point to the LVP areas. (M–R) In situ hybridization of TnC in the E14.5 WT soft palate at the TVP (M), LVP (O), and PLP (Q) levels, and the E14.5 Osr2-creKI;pMes-Noggin soft palate at the TVP (N), LVP (P), and PLP (R) levels. The arrows in (O,P) point to the TnC-positive areas. (S–X) In situ hybridization of Col1a1 in the E14.5 WT soft palate at the TVP (S), LVP (U), and PLP (W) levels, and the E14.5 Osr2-creKI;pMes-Noggin soft palate at the TVP (T), LVP (V), and PLP (X) levels. The arrowheads in (S,T) delineate the Col1a1-positive areas along the presumptive aponeurosis. The arrows in (U,V) point to the Col1a1-positive areas. The yellow dotted lines delineate the HPPs; the red dotted lines circle TVPs; the blue dotted lines delineate SPCs and PLPs. Scale bars are 200 μm. TVP, tensor veli palatini; LVP, levator veli palatini; PLP, palatopharyngeus; HPP, hypophosphatasia; SPC, superior pharyngeal constrictor.
Overexpressed Noggin in Myoblasts Mildly Affected the Fusion of Soft Palate
To further explore the impacts of Noggin on palatal myogenesis and palatogenesis, the Noggin transgene was activated in myoblasts by Myf5-cre. Histological sections indicated that compared with the WT controls (Figures 5A,C,E), the E17.5 Myf5-cre;pMes-Noggin soft palatal shelves had fused into an integral plate at the TVP and LVP levels (Figures 5B,D), but still separated from each other at the PLP level (Figure 5F). Intriguingly, the Myf5-cre;pMes-Noggin HPP was orientated introversive as the WT control did (Figures 5A,B), instead of extraversive in the Osr2-creKI;pMes-Noggin soft palate (Figures 1B,D). The myosin immunostaining in the E16.5 soft palates disclosed that the Myf5-cre;pMes-Noggin TVP, LVP, and SPC myofibers (Figures 5H,J) were reduced and sparser greatly than those in the WT controls (Figures 5G,I), and the Myf5-cre;pMes-Noggin PLP was even diminished (Figures 5K,L), suggesting a more severe hypoplasia than the Osr2-creKI;pMes-Noggin PLP (Figure 1P). Taken together, these results indicated that the dramatically compromised myogenesis in the Myf5-cre;pMes-Noggin soft palate had no effect on the fusion at the TVP and LVP levels, but disrupted the fusion at the PLP level.
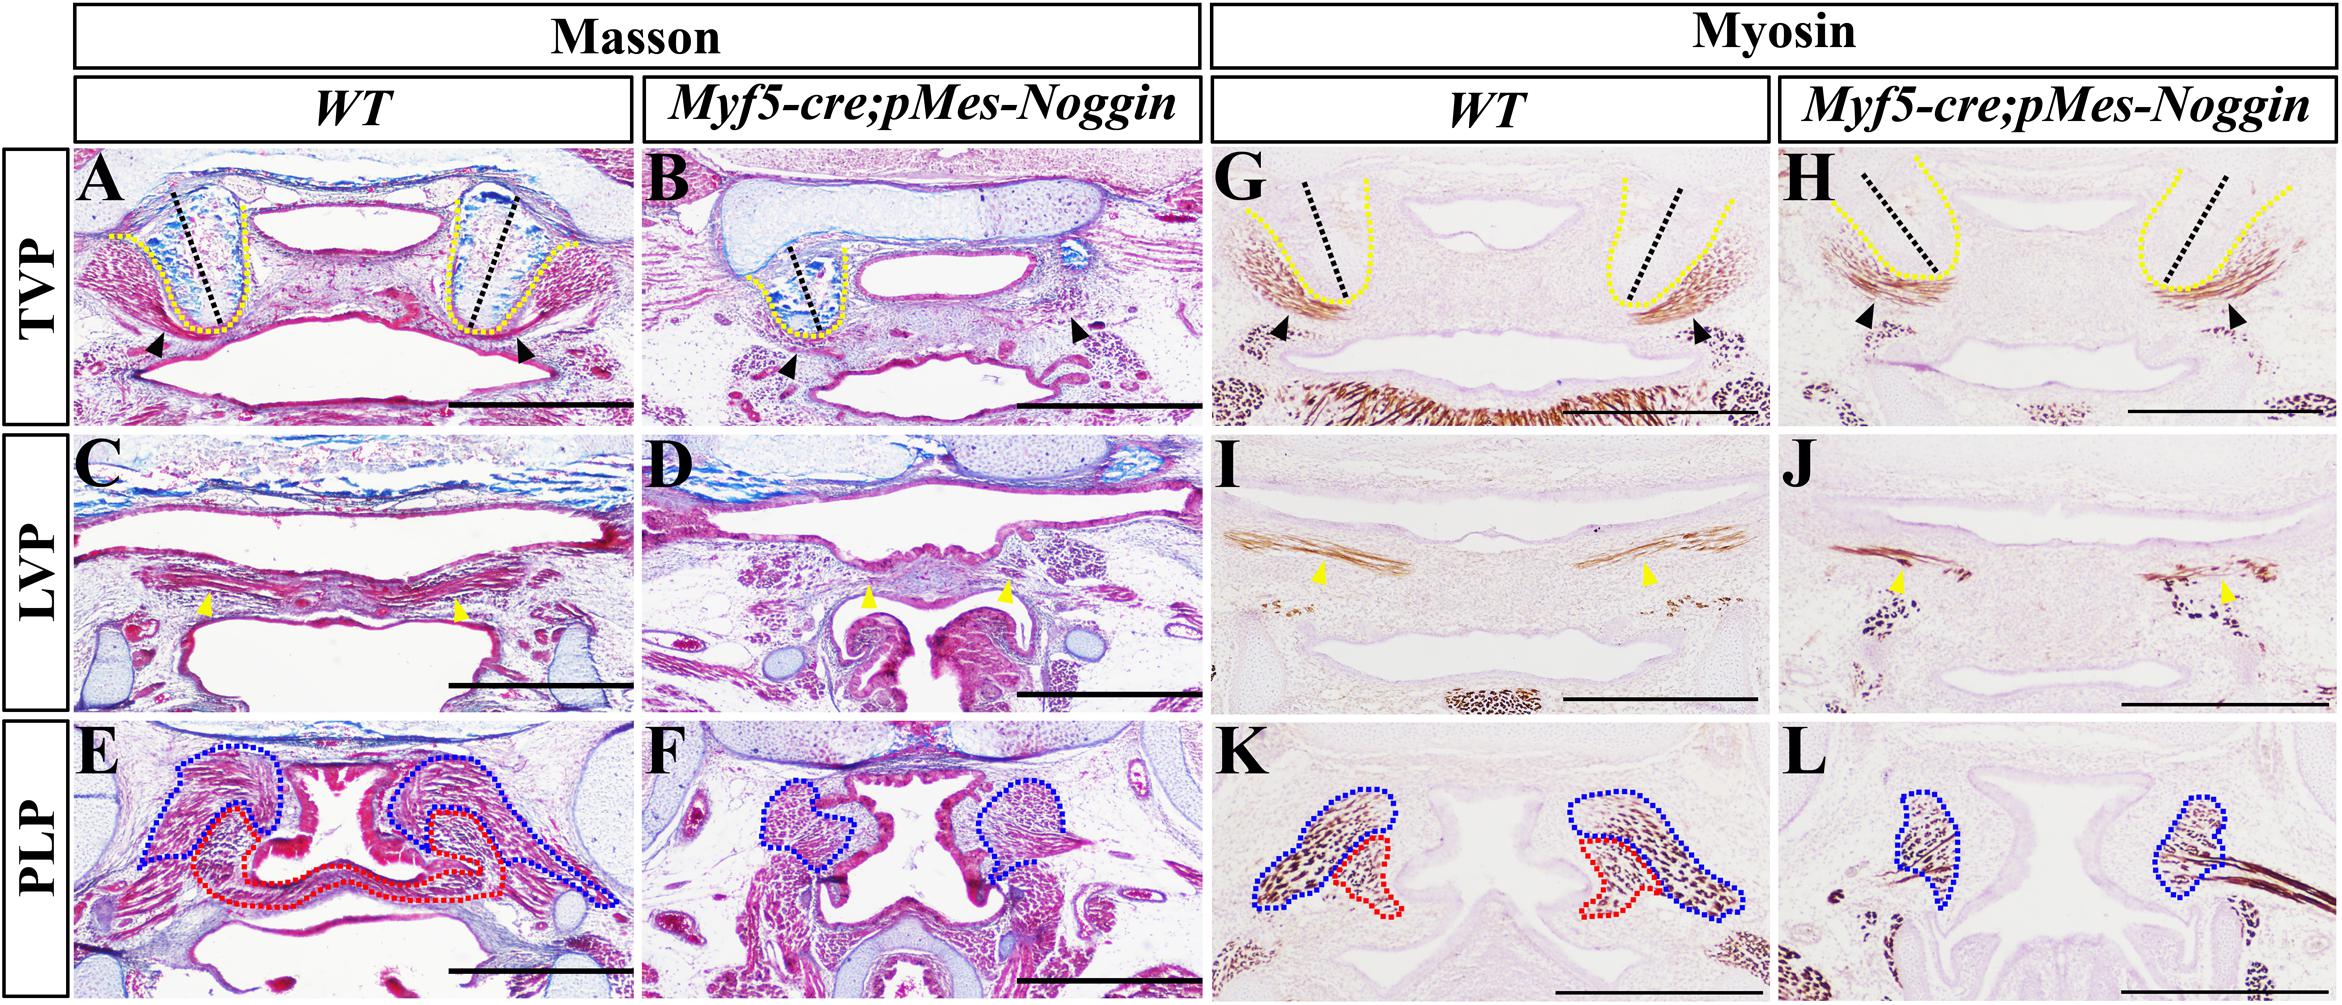
Figure 5. The fusion and muscle morphology in Myf5-cre;pMes-Noggin soft palate. (A–F) Masson staining of the E17.5 WT and Myf5-cre;pMes-Noggin soft palates. The TVP (A), LVP (C), and PLP (E) levels of WT soft palate were compared with the Myf5-cre;pMes-Noggin TVP (B), LVP (D), and PLP (F) levels. (G–L) The immunostaining of myosin of the E16.5 WT and Myf5-cre;pMes-Noggin soft palates. The TVP (G), LVP (I), and PLP (K) of WT soft palate were compared with the TVP (H), LVP (J), and PLP (L) of the Myf5-cre;pMes-Noggin soft palate. The black dashed lines indicate the orientation of HPPs; the black arrowheads delineate TVPs; the yellow arrowheads point to LVPs; the blue dotted lines circle SPCs; the red dotted lines mark PLPs. Scale bars are 200 μm. TVP, tensor veli palatini; LVP, levator veli palatini; PLP, palatopharyngeus; HPP, hypophosphatasia; SPC, superior pharyngeal constrictor.
Suppressed Tenogenic Gene Expression in Myf5-cre;pMes-Noggin Soft Palate
Immunohistochemistry displayed that at the TVP levels, the Sox9 expression in both the HPP and the aponeurosis of the E14.5 Myf5-cre;pMes-Noggin soft palate was comparable with that in the WT control (Figures 6A,B). At the LVP level, the Sox9-expressing area in the Myf5-cre;pMes-Noggin aponeurosis was mildly reduced than in the WT control (Figures 6C,D), while in the PLP level, the number of the Sox9-positive mesenchymal cells was obviously less than that in the WT PLP mesenchyme (Figures 6E,F). ISH was performed to check the expression of Scx, Tnc, and Col1a1. At the E14.5 TVP level, the Scx expression in the Myf5-cre;pMes-Noggin TVP region was comparable with that in the corresponding area in the WT control (Figures 6G,H). However, the Scx transcription in the E14.5 Myf5-cre;pMes-Noggin LVP level was almost diminished (Figures 6I,J). And there was no Scx transcription detected in the E14.5 WT and Myf5-cre;pMes-Noggin PLP levels (Figures 6K,L). Similar to Scx expression, the Tnc transcription in the E14.5 Myf5-cre;pMes-Noggin TVP and LVP areas was also diminished and also decreased significantly in the medial mesenchyme (Figures 6M–P). The Tnc expression was detected in the mesenchyme of the E14.5 WT PLP level, which disappeared in the Myf5-cre;pMes-Noggin PLP level (Figures 6Q,R). Additionally, although the Col1a1-expressing domains at the E14.5 Myf5-cre;pMes-Noggin TVP and LVP areas were reduced (Figures 6S,U), the domains along the aponeurosis were similar to those in the WT controls (Figures 6T,V). The Col1a1 transcription in the mesenchyme at the WT PLP level was obviously more robust than that in the mesenchyme of the Myf5-cre;pMes-Noggin PLP level (Figures 6W,X). These results suggested that in the Myf5-cre;pMes-Noggin soft palate, the tenogenesis was impaired severely as that in the Osr2-cre;pMes-Noggin soft palate, but the aponeurosis development was affected moderately.
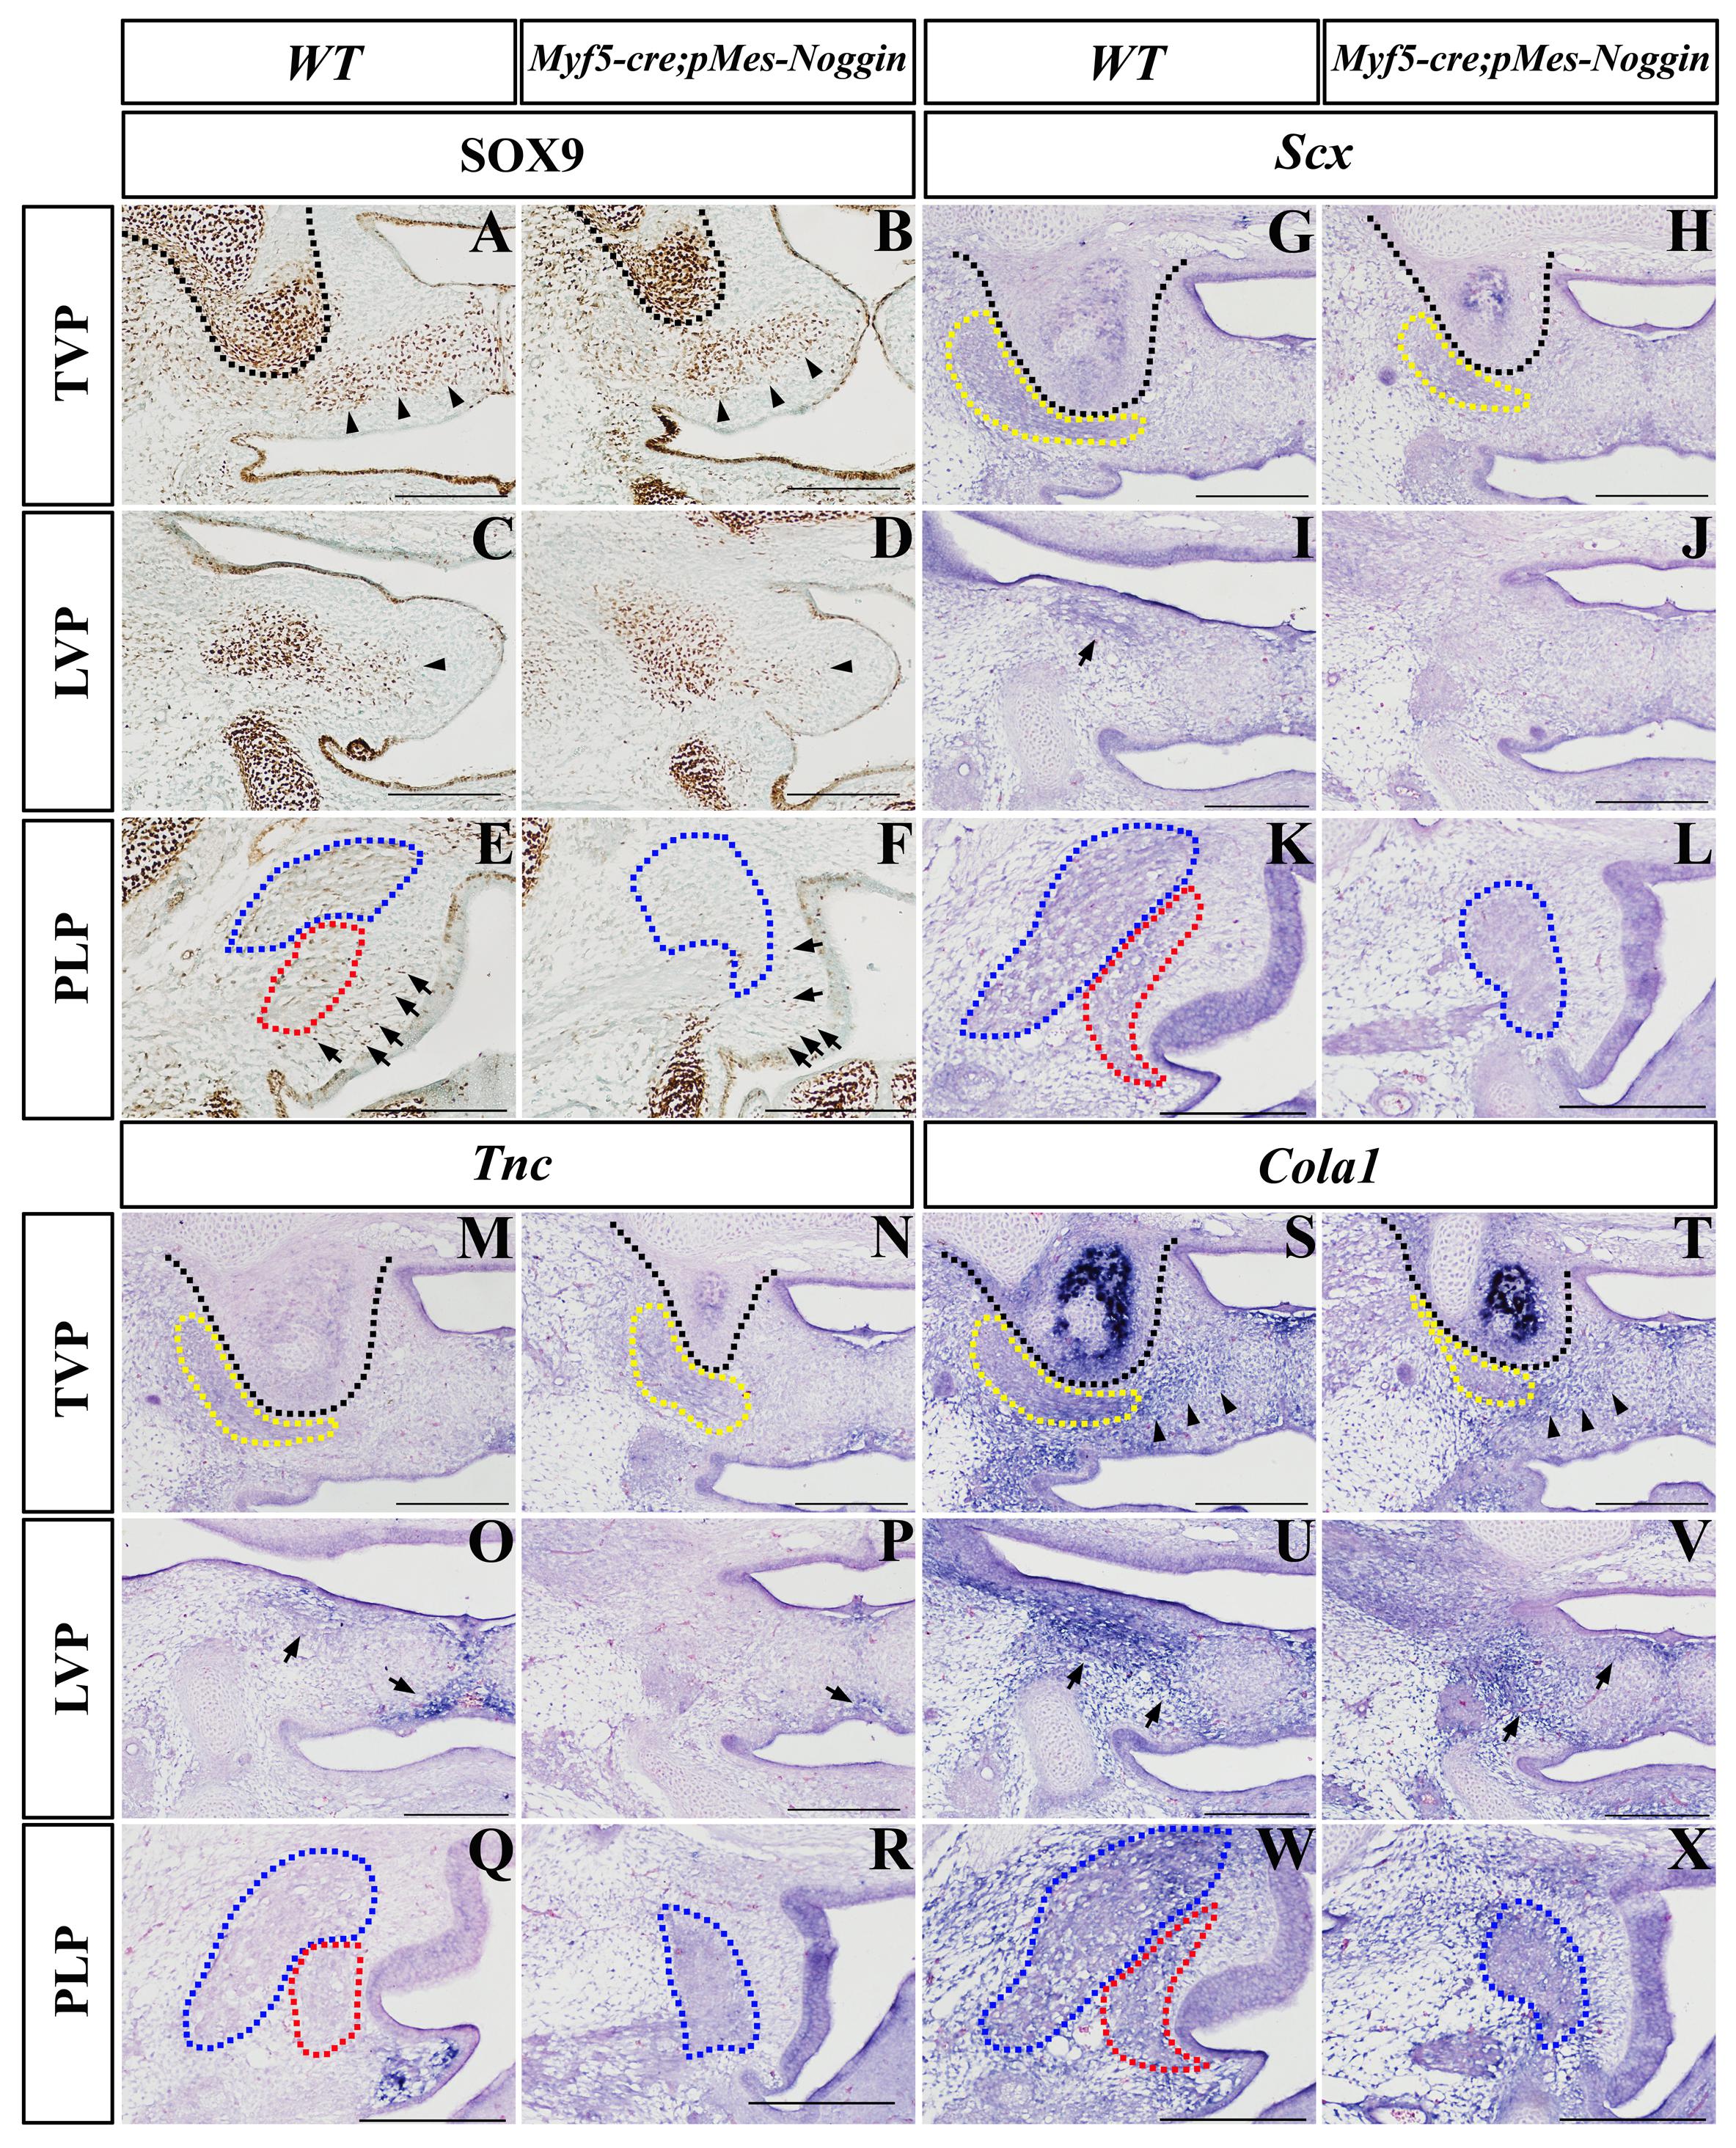
Figure 6. The Sox9, Scx, TnC, and Col1a1 expression in Myf5-cre;pMes-Noggin soft palates. (A–F) The Sox9 immunostaining in the E14.5 WT soft palate at the TVP (A), LVP (C), and PLP (E) levels, and the E14.5 Myf5-cre;pMes-Noggin soft palate at the TVP (B), LVP (D), and PLP (F) levels. The arrowheads in (A–D) point to the Sox9 domain in the mesenchyme. The arrows in (E,F) point to the Sox9-positive cells in the mesenchyme. (G–L) In situ hybridization of Scx in the E14.5 WT soft palate at the TVP (G), LVP (I), and PLP (K) levels, and the E14.5 Osr2-creKI;pMes-Noggin soft palate at the TVP (H), LVP (J), and PLP (L) levels. The arrows in (I) point to the LVP areas. (M–R) In situ hybridization of TnC in the E14.5 WT soft palate at the TVP (M), LVP (O), and PLP (Q) levels, and the E14.5 Osr2-creKI;pMes-Noggin soft palate at the TVP (N), LVP (P), and PLP (R) levels. The arrows in (O,P) point to the TnC-positive area. (S–X) In situ hybridization of Col1a1 in the E14.5 WT soft palate at the TVP (S), LVP (U), and PLP (W) levels, and the E14.5 Osr2-creKI;pMes-Noggin soft palate at the TVP (T), LVP (V), and PLP (X) levels. The arrowheads in (S,T) delineate the Col1a1-positive areas along the presumptive aponeurosis. The arrows in (U,V) point to the Col1a1-positive areas. The black dotted lines delineate the HPPs; the yellow dotted lines circle TVPs; the blue dotted lines delineate SPCs; the red dotted lines delineate PLPs. Scale bars are 200 μm. TVP, tensor veli palatini; LVP, levator veli palatini; PLP, palatopharyngeus; HPP, hypophosphatasia; SPC, superior pharyngeal constrictor.
Abrogation of Myoblasts Affected Little the Fusion of Soft Palate
To confirm that the myogenesis is dispensable for the palatal fusion, a conditional transgene encoding diphtheria toxin A subunit (DTA) in myoblasts was activated by Myf5-cre to abrogate the palatal muscles. The Myf5-cre;Rosa26R-DTA mouse embryos died approximately at E15.5, when the WT soft palates had been completely integrated at both the TVP and LVP levels, but were still separated at the PLP level (Figures 7A,C). In contrast, almost all the Myf5-cre; Rosa26R-DTA soft palates were fusing with the degenerating epithelial beam at the TVP level (13 cases in 14 mutants; Figure 7B). Interestingly, the fused Myf5-cre;Rosa26R-DTA soft palate exhibited an intraversive HPP, similar to the WT control (Figures 7A,B). At the LVP level, 50% of the Myf5-cre; Rosa26R-DTA soft palates were fusing, and the other 50% just had the epithelial contact (Figure 7D). At the PLP level, both the WT and Myf5-cre;Rosa26R-DTA mice displayed separated soft palates, while the Myf5-cre;Rosa26R-DTA palatal shelves were much smaller than those of the WT controls (Figures 7E,F). Myosin immunostaining confirmed that compared with the E15.5 WT soft palate (Figures 7G,I,K), the Myf5-cre;Rosa26R-DTA soft palates were devoid of TVP, LVP, PLP, and SPC (Figures 7H,J,L), though the unilateral TVP was preserved in some instances (Figure 7H). This finding confirmed that the TVP and LVP were dispensable for the fusion of soft palate.

Figure 7. The fusion of Myf5-cre; Rosa26R-DTA soft palate. (A–F) Masson staining of the E15.5 WT and Myf5-cre; Rosa26R-DTA soft palates. The WT TVP (A), LVP (C), and PLP (E) levels were compared with the Myf5-cre;pMes-Noggin TVP (B), LVP (D), and PLP (F) levels. (G–L) The immunostaining of myosin of the E15.5 WT and Myf5-cre; Rosa26R-DTA soft palates. The WT TVP (G), LVP (I), and PLP (K) were compared with the Myf5-cre;pMes-Noggin TVP (H), LVP (J), and PLP (L) levels. The black dashed lines indicate the orientation of HPPs; the black arrowheads delineate to TVPs; the yellow arrowheads point to LVPs; the blue dotted lines circle SPCs; the yellow dotted lines mark PLPs. Scale bars are 200 μm. TVP, tensor veli palatini; LVP, levator veli palatini; PLP, palatopharyngeus; HPP, hypophosphatasia; SPC, superior pharyngeal constrictor.
Discussion
The Overexpressed Noggin in Palatal Mesenchyme Impaired Myogenesis and Tenogenesis by Suppressing BMP-Smad Signaling
During the soft palatogenesis in mouse, Bmp3 was activated in the medial mesenchyme of the middle and posterior palates (Fu et al., 2017). Our study suggested that BMP-Smad signaling was activated in the HPP and the mesenchyme surrounding TVP, LVP, SPC, and PLP. The overexpressed Noggin by Osr2-creKI suppressed the BMP-Smad signaling severely in the mesenchyme surrounding palatal muscles, but mildly in the HPP. These results suggested that similar to Wnt/β-catenin, FGF, and Hh signaling, the BMP-Smad signaling in the palatal mesenchyme also played a role in the myogenesis of soft palates (Janečková et al., 2019). Previous studies demonstrated that although initiated independently, the developing muscles and tendons require reciprocal interactions for their differentiation and maturation (Grenier et al., 2009). The decreased Scx, Tnc, and Col1a1 transcription in the Osr2-creKI;pMes-Noggin palatal muscle regions suggested that the differentiation of the mesenchyme-derived tendons and connective tissues was impaired by the overexpressed Noggin. Since BMP-Smad signaling was activated at the interface between muscles and tendons, and BMPs promoted the specification of tendon stem cells and tendon–bone integration (Wang et al., 2010; Schwarting et al., 2016; Orfei et al., 2019), the BMP-Smad signaling suppressed by Noggin overexpression could interrupt the tendon differentiation and maturation in the Osr2-creKI;pMes-Noggin soft palate, which was consistent with the decreased Scx, Tnc, and Col1 transcription. Theoretically, the Noggin secreted by mesenchymal cells can inhibit BMP signaling in both the mesenchymal cells and myoblasts of soft palate. A previous study demonstrated that although suppression on BMP signaling was essential for the myogenic induction of both the somite- and cranial mesoderm-derived muscles at early embryonic stages (Tzahor et al., 2003; Borok et al., 2020), BMP signaling maintained the satellite cells in the proliferating status at the late embryonic and postnatal stages, and thus, suppression on BMP signaling led to muscle atrophy (Wang et al., 2010; Friedrichs et al., 2011; Stantzou et al., 2017). These reports coincided with our findings that the muscle hypoplasia in the Myf5-cre;pMes-Noggin soft palate was much more severe than that in the Osr2-creKI;pMes-Noggin soft palate. Therefore, the muscle hypoplasia in the Osr2-creKI;pMes-Noggin soft palate was preferentially attributed to the impaired tenogenic differentiation and maturation. Intriguingly, Noggin was reported to induce Scx transcription during the early specification of limb tendons (Schweitzer et al., 2001), while in this study, the overexpressed Noggin inhibited the tenogenesis. The contradictory phenomena may result from the signaling other than BMP-Smad signaling, which was altered by the overexpressed Noggin (Ohki et al., 2020). Actually, the decreased Scx transcription in both the Osr2-creKI;pMes-Noggin and Myf5-cre;pMes-Noggin soft palates was supposed to be regarded as a sign of the impaired tenogenic differentiation and maturation, because Scx was also essential for the maintenance of tendons.
The Overexpressed Noggin Impaired Cell Proliferation and Survival by Suppressing Epithelial Shh Expression
In the developing hard palate, the BMPs secreted from mesenchyme activates Shh expression in the epithelium, which maintains cell proliferation and survival by activating the expression of Bmp4 and Fgf10 in the underlying palatal mesenchyme through Smoothen-Gli1 pathway (Zhang et al., 2002; Lan and Jiang, 2009; Zhou et al., 2013). Thus, we explored whether the Shh signaling was also involved in the cell proliferation and survival during soft palatogenesis. In the Osr2-creKI;pMes-Noggin mouse, the diminished Shh expression in the epithelium of both the hard and soft palates, as well as the attenuated Gli1 activity in the soft palatal mesenchyme, indicated an interrupted interaction between the soft palatal epithelium and mesenchyme. Combined with the decreased cell proliferation and increased cell death in the mesenchyme of the Osr2-creKI;pMes-Noggin soft palate, it also suggested that the Bmp-Shh-Gli1 regulatory network was essential for the cell proliferation and survival of soft palatal mesenchyme, which is similar to that in the developing hard palate. Moreover, since the sufficient amount of cells is the prerequisite for the connection and fusion of palatal shelves in both the hard and soft palates (Dixon et al., 2011; Bush and Jiang, 2012), the cleft of the Osr2-creKI;pMes-Noggin soft palates resulted primarily from the reduced palatal shelves at least partially.
Myogenesis and Tenogenesis Are Dispensable for the Fusion of Soft Palate
The patterning, morphogenesis, and differentiation of palatal muscles were essential for the normal function of soft palates (Li et al., 2017). It is believed that the mesenchymal clues instruct the migration, patterning, and differentiation of myoblasts in the developing soft palates (Iwata et al., 2014; Janečková et al., 2019). However, whether the mesenchymal or myogenic defects in soft palate lead to cleft soft palate is still under debate. Compared with the reduced palatal shelves and hypoplastic muscles in the Osr2-creKI;pMes-Noggin soft palate, the Myf5-cre;pMes-Noggin palatal muscles exhibited a much more severe hypoplasia, especially in the SPC and PLP, even though the Myf5-cre;pMes-Noggin palatal shelves fused at the TVP and LVP levels, and only a fissure was detected in the PLP level. This finding was confirmed by the fused soft palate in the E15.5 Myf5-cre;Rosa26R-DTA mice in which the TVP, LVP, SPC, and PLP were all eliminated. Thus, it is suggested that the myogenesis is dispensable for the fusion of soft palate at the TVP and LVP levels, but required at the PLP level.
The Myf5-cre;pMes-Noggin palatal muscles were evidently compromised directly by the Noggin secreted from myoblasts. Similar to the Osr2-creKI;pMes-Noggin soft palate, the noticeable downregulated transcription of Scx, Tnc, and Col1a1 was also detected in the Myf5-cre;pMes-Noggin TVP, LVP, and SPC regions, verifying the requirements on the interactions between the developing craniofacial tendons and muscles (Grenier et al., 2009). In contrast, the Sox9, Tnc, and Col1a1 expression in the medial mesenchyme of Myf5-cre;pMes-Noggin soft palate was only slightly affected, suggesting that the medial mesenchyme of soft palate, which developed into the aponeurosis, was critical for the soft palate fusion. These findings also implicated that even in an intact palate, the dysfunction of soft palate could also take place because of the compromised myogenesis or tenogenesis.
The Mis-Oriented Hypophosphatasia Resulted From the Cleft in Soft Palate
Since the palatal fusion is initiated in the anterior secondary palate and, then, extend forwardly to the primary palate and backwardly to the soft palate (Bush and Jiang, 2012), it raised a speculation that the cleft in soft palate might result secondarily from the cleft in the hard palate. This notion is enforced by the few cases of the cleft hard palate (cleft in the hard palate with the intact soft palate) in both humans and mice (Dixon et al., 2011). Our and other researchers’ studies demonstrated that the interruption on TGFβ/BMP signaling through Wnt1-cre or Osr2-cre noticeably impaired the morphogenesis and differentiation of palatal bones (Baek et al., 2011; Parada et al., 2013; Li et al., 2021), which implied that the deformed palatine (especially the HPP) could cause cleft soft palate by disrupting the pattern of palatal muscles. The extroversive HPP in Osr2-creKI;pMes-Noggin soft palate also implicated the correlation between HPP deformity and cleft soft palate. However, the Osr2-creKI;pMes-Noggin palatal muscles showed no patterning defect, and the HPPs in Myf5-cre;pMes-Noggin and Myf5-cre;Rosa26R-DTA soft palates were intraversive, suggesting that the orientation of HPP was determined not by the muscles but by the fusion of soft palate. We speculated that in the fused soft palate, the HPP would be pulled intraversive by the contraction of the contralateral palatal shelves. Thus, the mis-oriented HPP in Osr2-creKI;pMes-Noggin soft palate was not the cause but the consequence of cleft soft palate.
The Aponeurosis Development Is Critical for the Fusion of Soft Palates
The integrity of the hard palate is achieved by the fused maxilla and palatine, while the integrity of soft palate is accomplished by forming an intact aponeurosis. In this study, Sox9 expression was found in the presumptive aponeurosis, but reduced in the Osr2-creKI;pMes-Noggin soft palate. Because BMP signaling balanced the Noggin and Sox9 expression during skeletogenesis (Nifuji and Noda, 1999; Zehentner et al., 1999), both the overexpressed Noggin and suppressed BMP-Smad signaling could downregulate Sox9 expression, through which attenuated the osteo-chondrogenic specification of the aponeurosis. Similarly, the decreased Tnc and Col1a1 transcription in the medial mesenchyme also suggested the suppressed differentiation of the Osr2-creKI;pMes-Noggin aponeurosis. Additionally, the little impacted Sox9, TnC, and Col1 expression in the medial mesenchyme of Myf5-cre;pMes-Noggin soft palate supported the notion that the aponeurosis specification and differentiation were critical for the fusion of soft palate. Actually, even in the plastic surgery for cleft soft palates or submucous cleft palates, the extension of aponeurosis by Zig-Zag incision and suture, instead of the bilateral LVP connection, was critical for the re-building of soft palate (Losee and Kirschner, 2009), which suggested the significance of the sufficient volume of the aponeurosis in the fusion and integrity of soft palate.
In summary, we investigated the defects in the soft palate of Osr2-creKI;pMes-Noggin mice to address the impacts of the suppressed BMP signaling on the development of soft palate. The Noggin overexpression in palatal mesenchyme mainly inhibited the differentiation of aponeurosis and tendons, which resulted in the hypoplasia of palatal muscles. The overexpressed Noggin also decreased the mesenchymal cell proliferation and survival by disrupting epithelial Shh expression, which reduced the size of soft palatal shelves. Although the myogenesis and tenogenesis were critical for the function of soft palate, they were dispensable for the fusion of soft palate. On the contrary, the cleft in the Osr2-creKI;pMes-Noggin soft palate was attributed to the reduced cell proliferation and survival caused by the interrupted Shh-Gli1 signaling, and the impaired specification and differentiation of aponeurosis.
Data Availability Statement
The original contributions presented in the study are included in the article/Supplementary Material, further inquiries can be directed to the corresponding author/s.
Ethics Statement
The animal study was reviewed and approved by The Laboratory Animal Ethics Committee at Dalian Medical University.
Author Contributions
CL and JX conceived the studies and wrote the manuscript. XC, BW, HL, LZ, and WC designed the methodology and supervised the study. SW, JD, and NL conducted the experiments and acquired and analyzed the data. All the authors contributed to the article and approved the submitted version.
Funding
This work was supported by the National Natural Science Foundation of China (Grant Numbers: 81771055 to CL and 81970922 to JX).
Conflict of Interest
The authors declare that the research was conducted in the absence of any commercial or financial relationships that could be construed as a potential conflict of interest.
Publisher’s Note
All claims expressed in this article are solely those of the authors and do not necessarily represent those of their affiliated organizations, or those of the publisher, the editors and the reviewers. Any product that may be evaluated in this article, or claim that may be made by its manufacturer, is not guaranteed or endorsed by the publisher.
Acknowledgments
The authors are grateful to Professor Yingjie Wu at the Institute of Genome Engineered Animal Models for Human Diseases at Dalian Medical University and Professor Yanding Zhang at Fujian Normal University for sharing the Myf5-cre and pMes-Noggin mouse lines.
Supplementary Material
The Supplementary Material for this article can be found online at: https://www.frontiersin.org/articles/10.3389/fcell.2021.711334/full#supplementary-material
Supplementary Figure 1 | The fluorescence pattern in Osr2-creKi; Rosa26R-mT/mG soft palate. (A) The Tvp level of soft palate in E16.5 Osr2-creKi; Rosa26R-mT/mG mouse. White dotted line delineated aponeurosis; asterisk meant Hpp; the white arrows pointed to the Tvp tendons; white arrowheads pointed to Tvps. (B) The Lvp level in E16.5 Osr2-creKi; Rosa26R-mT/mG soft palate. White arrowheads delineated Lvp myofibers; asterisk meant the aponeurosis. (C) The Plp level in E16.5 Osr2-creKi; Rosa26R-mT/mG soft palate. White arrowheads delineated Plp myofibers; yellow arrowheads pointed to Spc myofibers; asterisk meant the connective tissue. (Tvp, tensor veli palatini; Lvp, levator veli palatini; Plp, palatopharyngeus).
Supplementary Figure 2 | The negative controls of Tunel assay. The Lvp levels in E14.5 Wt (A) and Osr2-creKi; pMes-Noggin soft palate (B). In both (A,B), the Tunel procedure followed the instruction in the In Situ Cell Death Detection Kit, except the solution of Blue Cap 1 was not added into the samples, but replaced by distilled water. So the TdT enzyme was left out, and no signal (green fluorescence) was detected.
References
Almalki, S. G., and Agrawal, D. K. (2016). Key transcription factors in the differentiation of mesenchymal stem cells. Differentiation 92, 41–51. doi: 10.1016/j.diff.2016.02.005
Baek, J. A., Lan, Y., Liu, H., Maltby, K. M., Mishina, Y., and Jiang, R. (2011). Bmpr1a signaling plays critical roles in palatal shelf growth and palatal bone formation. Dev. Biol. 350, 520–531. doi: 10.1016/j.ydbio.2010.12.028
Borok, M. J., Mademtzoglou, D., and Relaix, F. (2020). Bu-M-P-ing Iron: how BMP signaling regulates muscle growth and regeneration. J. Dev. Biol. 8, 4. doi: 10.3390/jdb8010004
Bush, J. O., and Jiang, R. (2012). Palatogenesis: morphogenetic and molecular mechanisms of secondary palate development. Development 139, 231–243. doi: 10.1242/dev.067082
Chen, J., Lan, Y., Baek, J., Gao, Y., and Jiang, R. (2009). Wnt/beta-catenin signaling plays an essential role in activation of odontogenic mesenchyme during early tooth development. Dev. Biol. 334, 174–185. doi: 10.1016/j.ydbio.2009.07.015
Dash, S., and Trainor, P. A. (2020). The development, patterning and evolution of neural crest cell differentiation into cartilage and bone. Bone 137:115409. doi: 10.1016/j.bone.2020.115409
Dixon, M. J., Marazita, M. L., Beaty, T. H., and Murray, J. C. (2011). Cleft lip and palate: understanding genetic and environmental influences. Nat. Rev. Genet. 12, 167–178. doi: 10.1038/nrg2933
Friedrichs, M., Wirsdöerfer, F., Flohé, S. B., Schneider, S., Wuelling, M., and Vortkamp, A. (2011). BMP signaling balances proliferation and differentiation of muscle satellite cell descendants. BMC Cell Biol. 12:26. doi: 10.1186/1471-2121-12-26
Fu, X., Xu, J., Chaturvedi, P., Liu, P., Jiang, R., and Lan, Y. (2017). Identification of Osr2 transcriptional target genes in palate development. J. Dent. Res. 96, 1451–1458. doi: 10.1177/0022034517719749
Grenier, J., Teillet, M., Grifone, R., Kelly, R. G., and Duprez, D. (2009). Relationship between neural crest cells and cranial mesoderm during head muscle development. PLoS One 4:e4381. doi: 10.1371/journal.pone.0004381
Grimaldi, A., Parada, C., and Chai, Y. (2015). A comprehensive study of soft palate development in mice. PLoS One 10:e0145018. doi: 10.1371/journal.pone.0145018
He, F., Xiong, W., Wang, Y., Matsui, M., Yu, X., Chai, Y., et al. (2010). Modulation of BMP signaling by Noggin is required for the maintenance of palatal epithelial integrity during palatogenesis. Dev. Biol. 347, 109–121. doi: 10.1016/j.ydbio.2010.08.014
Huang, A. H., Riordan, T. J., Wang, L., Eyal, S., Zelzer, E., Brigande, J. V., et al. (2013). Repositioning forelimb superficialis muscles: tendon attachment and muscle activity enable active relocation of functional myofibers. Dev. Cell 26, 544–551. doi: 10.1016/j.devcel.2013.08.007
Iwata, J., Suzuki, A., Yokota, T., Vu-Ho, T., Pelikan, R., Urata, M., et al. (2014). TGFβ regulates epithelial-mesenchymal interactions through WNT signaling activity to control muscle development in the soft palate. Development 141, 909–917. doi: 10.1242/dev.103093
Janečková, E., Feng, J., Li, J., Rodriguez, G., and Chai, Y. (2019). Dynamic activation of Wnt, Fgf, and Hh signaling during soft palate development. PLoS One 14:e0223879. doi: 10.1371/journal.pone.0223879
Lan, Y., and Jiang, R. (2009). Sonic hedgehog signaling regulates reciprocal epithelial-mesenchymal interactions controlling palatal outgrowth. Development 136, 1387–1396. doi: 10.1242/dev.028167
Li, C., Lan, Y., and Jiang, R. (2017). Molecular and cellular mechanisms of palate development. J. Dent. Res. 96, 1184–1191. doi: 10.1177/0022034517703580
Li, J., Rodriguez, G., Han, X., Janečková, E., Kahng, S., Song, B., et al. (2019). Regulatory mechanisms of soft palate development and malformations. J. Dent. Res. 98, 959–967. doi: 10.1177/0022034519851786
Li, N., Liu, J., Liu, H., Wang, S., Hu, P., Zhou, H., et al. (2021). Altered BMP-Smad4 signaling causes complete cleft palate by disturbing osteogenesis in palatal mesenchyme. J. Mol. Histol. 52, 45–61. doi: 10.1007/s10735-020-09922-4
Losee, J. E., and Kirschner, R. E. (2009). Comprehensive Cleft Care. New York, NY: McGraw-Hill Companies, Inc, 322–355.
Lu, L., Lin, M., Wang, Y., Cserjesi, P., Chen, Z., and Chen, Y. (2011). BmprIa is required in mesenchymal tissue and has limited redundant function with BmprIb in tooth and palate development. Dev. Biol. 349, 451–461. doi: 10.1016/j.ydbio.2010.10.023
Nassari, S., Duprez, D., and Fournier-Thibault, C. (2017). Non-myogenic contribution to muscle development and homeostasis: the role of connective tissues. Front. Cell Dev. Biol. 5:22. doi: 10.3389/fcell.2017.00022
Nifuji, A., and Noda, M. (1999). Coordinated expression of noggin and bone morphogenetic proteins (BMPs) during early skeletogenesis and induction of noggin expression by BMP-7. J. Bone Miner. Res. 14, 2057–2066. doi: 10.1359/jbmr.1999.14.12.2057
Ohki, S., Oka, K., Ogata, K., Okuhara, S., Rikitake, M., Toda-Nakamura, M., et al. (2020). Transforming growth factor-beta and sonic hedgehog signaling in palatal epithelium regulate tenascin-c expression in palatal mesenchyme during soft palate development. Front. Physiol. 11:532. doi: 10.3389/fphys.2020.00532
Orfei, C. P., Viganò, M., Pearson, J. R., Colombini, A., Luca, P. D., Ragni, E., et al. (2019). In Vitro induction of tendon-specific markers in tendon cells, adipose- and bone marrow-derived stem cells is dependent on TGFβ3, BMP-12 and Ascorbic Acid Stimulation. Int. J. Mol. Sci. 20:149. doi: 10.3390/ijms20010149
Parada, C., Li, J., Iwata, J., Suzuki, A., and Chai, Y. (2013). CTGF mediates Smad-dependent transforming growth factor β signaling to regulate mesenchymal cell proliferation during palate development. Mol. Cell Bio. 33, 3482–3493. doi: 10.1128/MCB.00615-13
Schwarting, T., Schenk, D., Frink, M., Benölken, M., Steindor, F., Oswald, M., et al. (2016). Stimulation with bone morphogenetic protein-2 (BMP-2) enhances bone-tendon integration in vitro. Connect Tissue Res. 57, 99–112. doi: 10.3109/03008207.2015.1087516
Schweitzer, R., Chyung, J. H., Murtaugh, L. C., Brent, A. E., Rosen, V., Olson, E. N., et al. (2001). Analysis of the tendon cell fate using Scleraxis, a specific marker for tendons and ligaments. Development 128, 3855–3866. doi: 10.1242/dev.128.19.3855
Stantzou, A., Schirwis, E., Swist, S., Alonso-Martin, S., Polydorou, I., Zarrouki, F., et al. (2017). BMP signaling regulates satellite cell-dependent postnatal muscle growth. Development 44, 2737–2747. doi: 10.1242/dev.144089
Sugii, H., Grimaldi, A., Li, J., Parada, C., Vu-Ho, T., Feng, J., et al. (2017). The Dlx5-FGF10 signaling cascade controls cranial neural crest and myoblast interaction during oropharyngeal patterning and development. Development 144, 4037–4045. doi: 10.1242/dev.155176
Tian, A., Wang, S., Wang, H., Li, N., Liu, H., Zhou, H., et al. (2021). Over-expression of Fgf8 in cardiac neural crest cells leads to persistent truncus arteriosus. J. Mol. Histol. 52, 351–361. doi: 10.1007/s10735-021-09956-2
Tzahor, E., Kempf, H., Mootoosamy, R. C., Poon, A. C., Abzhanov, A., Tabin, C. J., et al. (2003). Antagonists of Wnt and BMP signaling promote the formation of vertebrate head muscle. Genes Dev. 17, 3087–3099. doi: 10.1101/gad.1154103
Wang, H., Noulet, F., Edom-Vovard, F., Tozer, S., Grand, F. L., and Duprez, D. (2010). Bmp signaling at the tips of skeletal muscles regulates the number of fetal muscle progenitors and satellite cells during development. Dev. Cell 18, 643–654. doi: 10.1016/j.devcel.2010.02.008
Wu, W., Gu, S., Sun, C., He, W., Xie, X., Li, X., et al. (2015). Altered FGF signaling pathways impair cell proliferation and elevation of palate shelves. PLoS One 10:e0136951. doi: 10.1371/journal.pone.0136951
Xiong, W., He, F., Morikawa, Y., Yu, X., Zhang, Z., Lan, Y., et al. (2009). Hand2 is required in the epithelium for palatogenesis in mice. Dev. Biol. 330, 131–141. doi: 10.1016/j.ydbio.2009.03.021
Zehentner, B. K., Dony, C., and Burtscher, H. (1999). The transcription factor Sox9 is involved in BMP-2 signaling. J. Bone Miner. Res. 14, 1734–1741. doi: 10.1359/jbmr.1999.14.10.1734
Zhang, Z., Song, Y., Zhao, X., Zhang, X., Fermin, C., and Chen, Y. (2002). Rescue of cleft palate in Msx1-deficient mice by transgenic Bmp4 reveals a network of BMP and Shh signaling in the regulation of mammalian palatogenesis. Development 129, 4135–4146. doi: 10.1242/dev.129.17.4135
Zhou, J., Gao, Y., Lan, Y., Jia, S., and Jiang, R. (2013). Pax9 regulates a molecular network involving Bmp4, Fgf10, Shh signaling and the Osr2 transcription factor to control palate morphogenesis. Development 140, 4709–4718. doi: 10.1242/dev.099028
Keywords: palatogenesis, cleft soft palate, BMP signaling, aponeurosis, myogenesis
Citation: Deng J, Wang S, Li N, Chen X, Wang B, Liu H, Zhu L, Cong W, Xiao J and Liu C (2021) Noggin Overexpression Impairs the Development of Muscles, Tendons, and Aponeurosis in Soft Palates by Disrupting BMP-Smad and Shh-Gli1 Signaling. Front. Cell Dev. Biol. 9:711334. doi: 10.3389/fcell.2021.711334
Received: 18 May 2021; Accepted: 06 August 2021;
Published: 07 September 2021.
Edited by:
Marcela Buchtova, Institute of Animal Physiology and Genetics, Czech Academy of Sciences, CzechiaReviewed by:
M. Douglas Benson, Texas A&M University, United StatesMatthew Anderson, National Cancer Institute at Frederick, United States
Copyright © 2021 Deng, Wang, Li, Chen, Wang, Liu, Zhu, Cong, Xiao and Liu. This is an open-access article distributed under the terms of the Creative Commons Attribution License (CC BY). The use, distribution or reproduction in other forums is permitted, provided the original author(s) and the copyright owner(s) are credited and that the original publication in this journal is cited, in accordance with accepted academic practice. No use, distribution or reproduction is permitted which does not comply with these terms.
*Correspondence: Jing Xiao, xiaoj@dmu.edu.cn; Chao Liu, cliu@dmu.edu.cn
†These authors have contributed equally to this work