Super-Resolution Imaging Approaches for Quantifying F-Actin in Immune Cells
 Evelyn Garlick
 Steven G. Thomas
 Dylan M. Owen2,3*†
- 1Institute of Cardiovascular Sciences, College of Medical and Dental Science, University of Birmingham, Birmingham, United Kingdom
- 2Centre of Membrane Proteins and Receptors, University of Birmingham and University of Nottingham, Midlands, United Kingdom
- 3Institute for Immunology and Immunotherapy, College of Medical and Dental Science and School of Mathematics, College of Engineering and Physical Science, University of Birmingham, Birmingham, United Kingdom
Immune cells comprise a diverse set of cells that undergo a complex array of biological processes that must be tightly regulated. A key component of cellular machinery that achieves this is the cytoskeleton. Therefore, imaging and quantitatively describing the architecture and dynamics of the cytoskeleton is an important research goal. Optical microscopy is well suited to this task. Here, we review the latest in the state-of-the-art methodology for labeling the cytoskeleton, fluorescence microscopy hardware suitable for such imaging and quantitative statistical analysis software applicable to describing cytoskeletal structures. We also highlight ongoing challenges and areas for future development.
Introduction
The actin cytoskeleton is a key cellular component in many biological processes and is particularly implicated in a range of functions associated with immune cells. For example, actin polymerization is responsible for the spreading of lymphocytes over target antigen-presenting cells (APC), creating a large contact area (Dustin and Cooper, 2000), whereas cortical actin retrograde flow drives T cell signaling microclusters toward the synapse center through frictional coupling (Billadeau et al., 2007; DeMond et al., 2008; Hartman et al., 2009; Yu et al., 2013; Kumari et al., 2014; Ashdown et al., 2017). In cytotoxic lymphocytes, cortical actin at the immunological synapse must be remodeled to an actin mesh, which allows the release of cytotoxic granules (Carisey et al., 2018). Actin is also responsible for driving cell migration in response to cytokines (Samstag et al., 2003; Shannon et al., 2020) and processes such as phagocytosis (Castellano et al., 2001; May and Machesky, 2001).
For these reasons, there has been a long-standing goal to understand the architecture of the cytoskeleton in immune cells and numerous techniques have been deployed for this purpose. For example, transmission electron microscopy has been used to image the ultrastructure of cytoskeletal components (Svitkina, 2009). However, in recent years, optical microscopy has come to the forefront of these endeavors for several reasons. Firstly, optical microscopy is relatively non-invasive, allowing cytoskeletal architecture to be imaged in live cells and cytoskeletal dynamics to be captured and analyzed. Fluorescence microscopy is also specific, allowing particular proteins of interest to be labeled and observed (Lichtman and Conchello, 2005).
For many years, fluorescence microscopy has been held back by its intrinsic resolution limit of around 200 nm. The development of super-resolution (Hell and Wichmann, 1994; Betzig et al., 2006) approaches has broken this barrier and now allows cytoskeletal architecture to be imaged and quantified on the nanoscale. Combined with developments in probes, labeling technology, and in quantitative analysis, advances in microscope design are proving transformative to our understanding of the many diverse functions of the cytoskeleton in immune cell function.
Here, we will review the latest developments in cytoskeletal labeling, applicable microscope hardware, and the latest quantitative analysis methodology.
Labeling
For fixed samples, the gold standard label for filamentous (F-) actin is phalloidin. A bicyclic heptapeptide initially isolated from the death cap mushroom (Amanita phalloides), phalloidin is an F-actin stabilizing toxin first used to visualize F-actin in 1979 (Wulf et al., 1979). Fluorescent phalloidins are widely used to visualize F-actin in many applications. Interestingly, the specific fluorophore conjugated to phalloidin can affect imaging outcomes. For example, phalloidin-AlexaFluor 488 has been shown to provide superior detail and longevity of stain over other derivatives like AlexaFluor 405 (DesMarais et al., 2019). However, the choice of label will, to some degree, be application dependent.
Since phalloidin cannot permeate live cells, fixation is important. Paraformaldehyde (PFA) can lead to disruption of the actin cytoskeleton (Leyton-Puig et al., 2016; Pereira et al., 2019) so use of a cytoskeletal stabilizing buffer is recommended. This results in more faithful preservation of actin architecture. Methanol fixation, while often favored for microtubule preservation, results in significant actin disruption and should be avoided (Whelan and Bell, 2015; DesMarais et al., 2019).
There are also numerous staining options for live imaging of actin. For a thorough review of actin labeling, see Melak et al. (2017). Direct tagging of actin subunits with recombinant fluorescent proteins (FP) is possible and has been used extensively. These constructs must be expressed exogenously, and although capable of co-polymerizing with the untagged endogenous actin (Westphal et al., 1997), FP-actin kinetics and behavior can be impeded (Aizawa et al., 1997; Deibler et al., 2011; Nagasaki et al., 2017) and non-integrated monomers can generate background. Tagging actin binding proteins (ABPs) is therefore a more attractive option. Their capacity to bind more efficiently to actin filaments than monomers results in better identification of the filamentous cytoskeleton. Examples of ABPs include derivatives of the calponin homology domain of utrophin (Burkel et al., 2007), a short peptide from the rat inositol 1,4,5-trisphosphate 3-kinase (ITPK) called F-Tractin (Schell et al., 2001) and a 17-amino acid peptide derived from Abp140 called Lifeact (Riedl et al., 2010). The generation of a GFP-Lifeact transgenic mouse line (Riedl et al., 2010) has allowed live actin imaging in vivo, along with tissue-specific expression using a cre inducible mouse line (Schachtner et al., 2012). Additionally, Lifeact can be adapted for use with single-molecule imaging strategies such as IRIS (Kiuchi et al., 2015). While widely used, actin binding protein derivatives should still be approached with caution. For example, Utrophin derivatives can induce actin aggregates in both the nucleus and cytoplasm, and recent findings suggest that Lifeact-TagGFP2 can disrupt actin architecture in a dose-dependent manner (Flores et al., 2019).
SiR actin is an F-actin probe based on jasplakinolide, an actin binder and potent promoter of nucleation. The silicon rhodamine (SiR) probe is fluorogenic (Lukinavičius et al., 2014), cell permeable, and can be added to live cells in culture without washing. As SiR actin is a derivative of jasplakinolide, however, higher concentrations can impact dynamics significantly (Lukinavičius et al., 2014).
Newer labeling strategies like nanobodies and affimers have generated interest in recent years. For example, fluorophore fused nanobodies (“chromobodies”) can retain labeling functionality when expressed intracellularly, allowing for specific live-cell imaging (Rothbauer et al., 2006; Schiavon et al., 2020). In general, nanobodies offer significant antigen specificity and reduced size over standard antibodies. Affimers are synthetic reagents generated from non-antibody scaffold proteins such as Adhirons (Tiede et al., 2014). Lopata et al. (2018) demonstrated the identification and validation of four affimers that specifically recognize F-actin. Their versatility and potential for live-cell application make them important reagents for the future (Lopata et al., 2018). Some of the more widely used labeling strategies are summarized in Table 1.
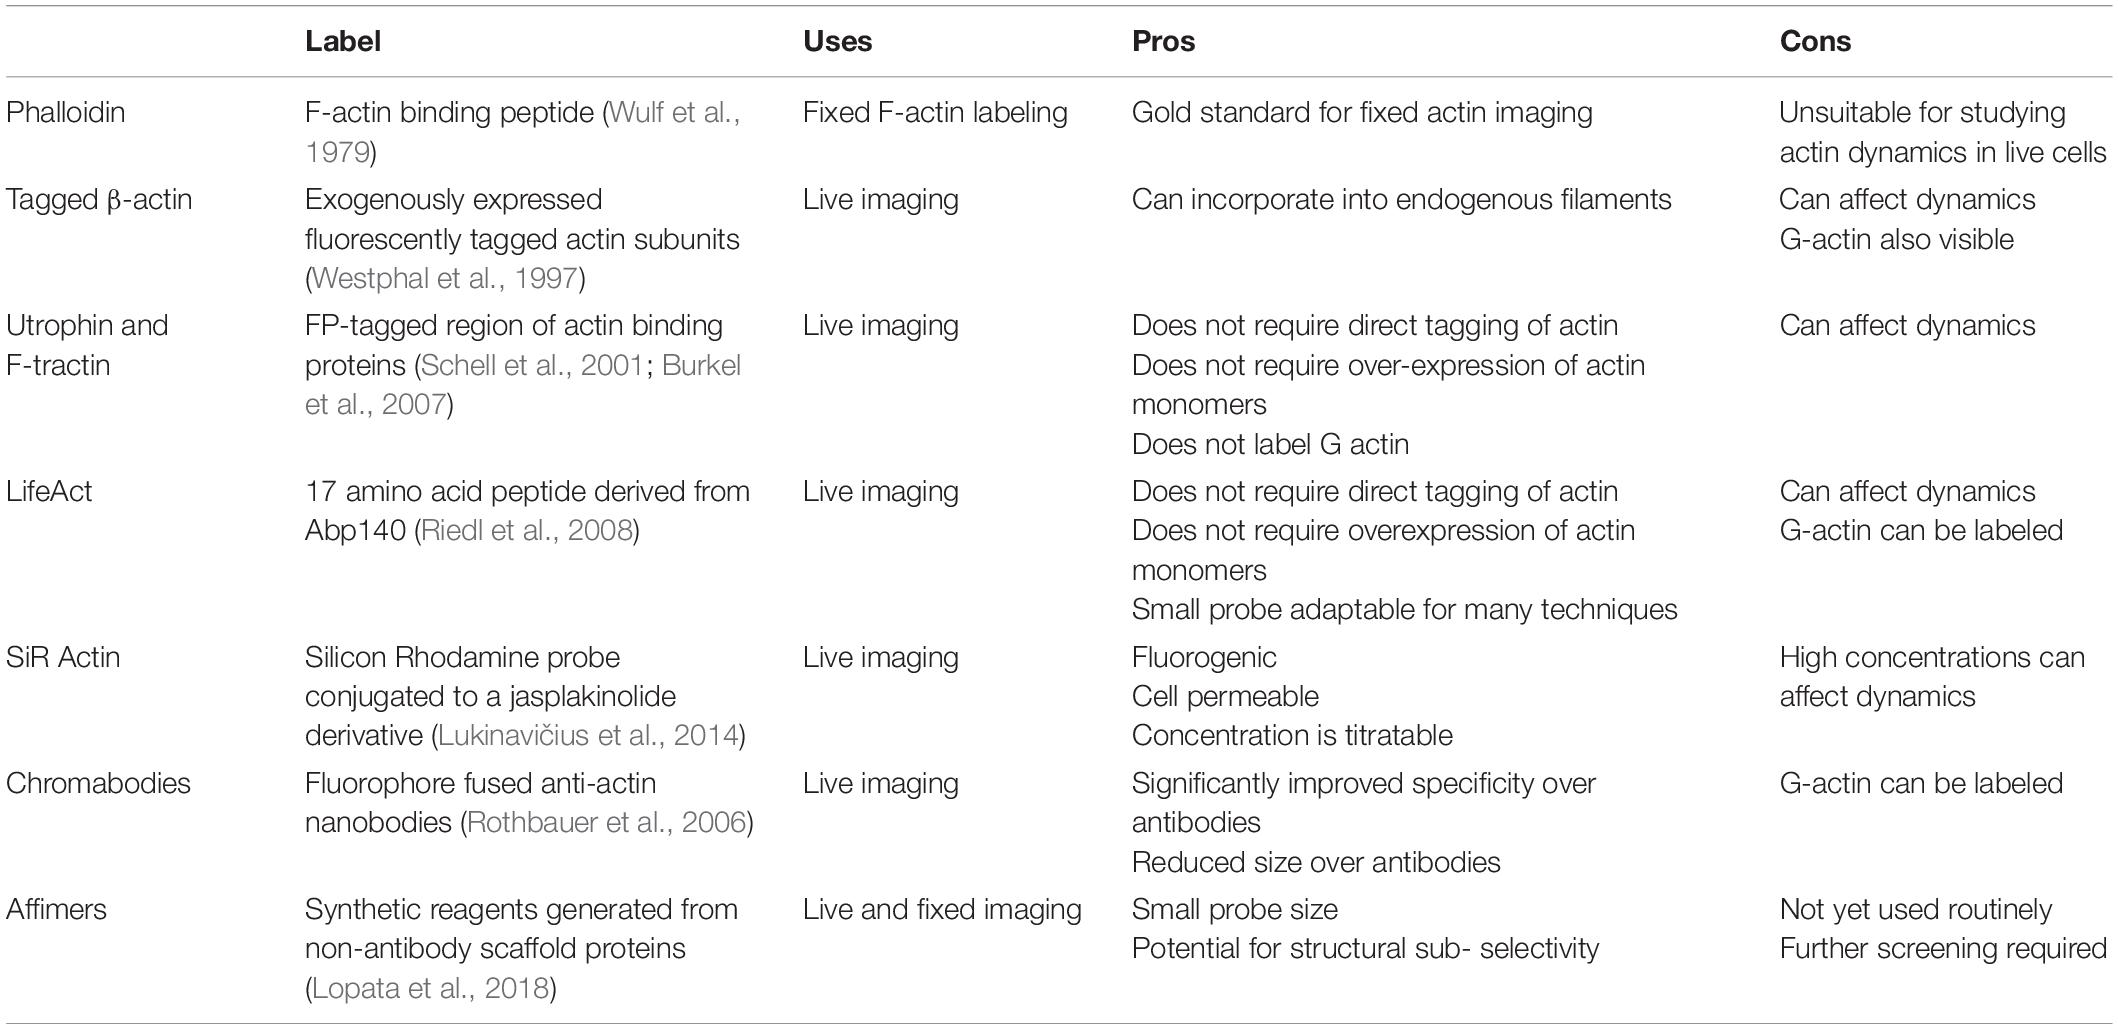
Table 1. Summary of the advantages and disadvantages of different actin labeling strategies.
Microscopy Techniques
Simple assessment of gross actin structures is easily achieved using diffraction-limited imaging systems. Abbe’s law, often referred to as the diffraction limit, describes how the minimum resolution achievable in a system is dependent on the numerical aperture of the lens and the wavelength of the incident light. Due to these limitations, the maximum resolving power of diffraction-limited systems is ∼200 nm laterally and ∼600 nm axially. One of the simplest fluorescence techniques, wide-field epifluorescence imaging, involves illumination of the full sample. This results in the camera or detector receiving all emitted light, both in and out of focus, which can reduce the images’ signal-to-noise ratio (SNR) significantly as well as limit optical sectioning capacity. Epifluorescence microscopes are, however, simple systems capable of high-speed acquisition, and combination with image post-processing like deconvolution can provide powerful insight into dynamic actin processes.
Total internal reflection fluorescence microscopy (TIRF) is achieved by angling the incident light such that it is entirely reflected, rather than refracted. At this so-called critical angle, an evanescent wave is generated that decays exponentially with depth, restricting fluorophore excitation to approximately 200 nm from the coverslip and reducing the out-of-focus background. TIRF is therefore often the technique of choice when imaging dynamic actin in adherent cells.
The dynamics of actin in T cell synapses are well imaged with TIRF. For example, Ritter et al. (2017) used TIRF imaging to follow cortical actin recovery in cytotoxic T cell synapses following lytic granule secretion (Ritter et al., 2017). Time lapse imaging allowed assessment of the cortical actin structure pre- and post-secretion, providing insight into the tightly regulated process. The relatively lengthy time courses (<10 min) with high temporal resolution (2.4-s intervals for two color experiments) were possible due to TIRF microscopy. Variation in the actin structure of stable and unstable immune synapses has also been investigated using TIRF, including on supported lipid bilayers (Kumari et al., 2020). Wagh et al. (2020) used TIRF to quantify actin reorganization in the immune synapse of CD8 effector T cells relative to Bcl10 expression. Analysis resulted in the identification of two phases of dynamics—a faster initial stage and slower latter, both of which were significantly faster in Bcl10–/– cells. In this case, the high temporal resolution possible with TIRF was essential.
Confocal microscopy is another workhorse of diffraction-limited imaging. By applying a pinhole in front of the detector, out-of-focus light is discarded. Point scanning microscopes must raster scan across the sample, meaning the method is less suited to fast imaging. Laser intensity is often increased too. Spinning disk confocal microscopes can overcome some of the limitations on speed and phototoxicity by inclusion of an array of microlenses, allowing multiple focused beams of light to be swept across the sample to reduce intense laser exposure. Resonant scanning confocal microscopy also improves acquisition speed in single point scanning systems, using a resonant mirror scanner that oscillates at a fixed frequency to improve framerate to video rate (30 fps) and beyond. Confocal microscopes are a solid choice for actin imaging given their advantages over widefield microscopy and common presence in core facilities.
Lightsheet microscopy is regarded as one of the gentlest techniques for live-cell imaging. A sheet of light, hundreds of nanometers thick, is generated perpendicular to the imaging objective and moved through the sample. This planar illumination significantly reduces out-of-focus light, improving signal to noise and reducing phototoxicity. This technique also permits rapid capture of 3D data. A variant of this concept, lattice light sheet (Chen et al., 2014) microscopy, replaces the conventional sheet with an optical lattice, further reducing phototoxicity and improving imaging speed. Examples of light-sheet imaging of the cytoskeleton in immune cells include imaging the retrograde flow of cortical actin in cell–cell synapses (Ritter et al., 2015) and actin protrusions in cytotoxic T cells (Tamzalit et al., 2019) and neutrophils (Fritz-Laylin et al., 2017).
While the diffraction-limited techniques are widely used to study immune cells, in many cases, cytoskeletal structures need to be studied on the nanoscale. There are now multiple techniques capable of breaking the diffraction limit (Illustrated in Figure 1). Fluorescence microscopy can obtain resolutions only previously possible with electron microscopy, with single-molecule localization microscopy (SMLM) techniques routinely reporting resolving power of up to 10 nm.
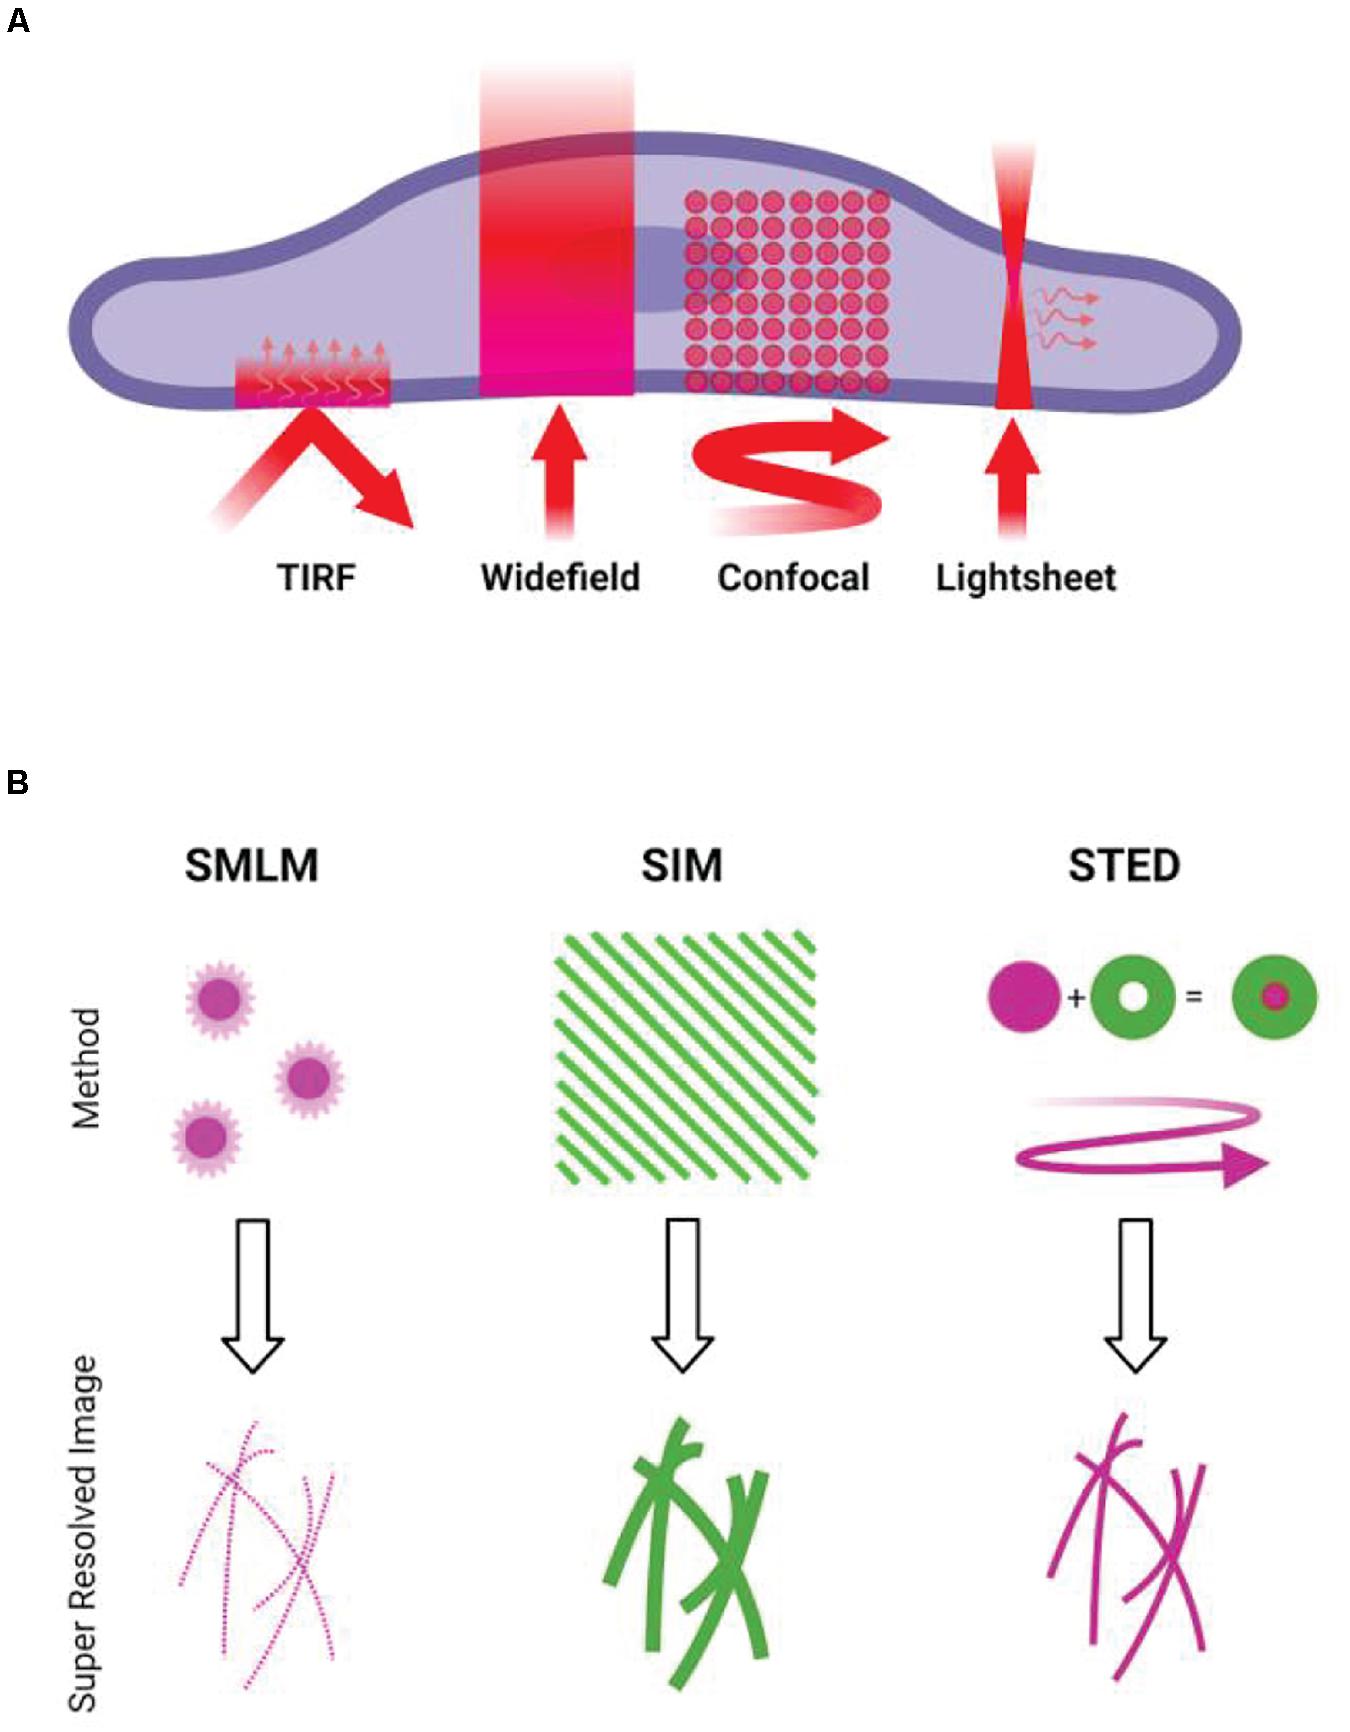
Figure 1. Overview of microscopy techniques commonly used for imaging actin. (A) Diffraction-limited techniques. TIRF, showing the incident light and resulting evanescent wave. Widefield epifluorescence, showing illumination of the full volume of the specimen. Confocal, showing the rastering of the scanning focal point. Lightsheet, showing the sheet illumination and resulting detection at an angle to illumination. (B) Illustrations of the concepts behind common super-resolution techniques. SMLM requires the stochastic activation and localization of single fluorophores, building up a pointillist image of the structure. SIM involves projection of patterned illumination at multiple angles, using the resulting Moiré fringes to reconstruct a higher frequency information. STED uses a depletion laser that surrounds the point of illumination, reducing the size of the point spread function of the illumination beam.
Structured illumination microscopy (SIM) allows extraction of higher-resolution information by illuminating the sample in a known pattern—usually stripes, but variations like lattice SIM use differing illumination patterns. The pattern is translated and rotated across several frames, and the interference of this light pattern with the sample generates so-called Moiré fringes. High-frequency information is then extracted during computational reconstruction, generating images with roughly a 2× increase in resolution. Reconstruction artifacts can be an issue, especially in thicker or more densely labeled samples [see Demmerle et al. (2017), for images and explanations of common issues]. Critical inspection of reconstruction results, as well as using packages such as SIMCheck (Ball et al., 2015), is best practice. Structured Illumination can also be applied to lattice light sheet microscopy, allowing rapid and gentle acquisition of live-cell super-resolved data (Wagh et al., 2020). In immune cells, SIM has been used with TIRF illumination to image cortical actin labeled with phalloidin (Ritter et al., 2017) and in live cells using LifeAct (Ashdown et al., 2017), both at the T-cell immunological synapse. Colin-York used TIRF SIM to show differences between cytoskeletal behavior in primary and immortalized T cells (Colin-York et al., 2020) and Brown used SIM to analyze cortical actin at the sites of lytic granule release at NK cell synapses (Brown et al., 2011).
Another point scanning technique, stimulated emission depletion (STED) microscopy (Hell and Wichmann, 1994), achieves super-resolution by selectively depleting fluorophores around a central focal point. As the size of the excitation point is reduced by a doughnut-shaped depletion laser, resolutions of 30–80 nm can be achieved. Optical sectioning is also a particular strength, as the technique is point scanning, and diffractive optical elements can be introduced to generate an additional depletion doughnut in z (Klar et al., 2000). Intense laser power in the depletion beam is required, making phototoxicity a key consideration. Recent developments in this technique (MINFLUX) (Balzarotti et al., 2017) reduces the phototoxicity caused by the high laser intensities of STED. Fritzche used STED to image the actin cytoskeleton in immune cells (Fritzsche et al., 2017) and Clausen used the method to analyze the relationship between the actin cortex and the membrane (Clausen et al., 2017). Carisey showed the applicability of STED (as well as TIRF SIM) to image the dynamics of actin in NK cells (Carisey et al., 2018) and Rak used similar methodology to analyze the architecture of the actin cortex during lytic granule release (Rak et al., 2011).
Single-molecule localization microscopy techniques boast impressive resolutions. All techniques under this umbrella rely on detection and mathematical localization of individual fluorophores, but achieve this stochastic imaging in different ways. Key examples include stochastic optical reconstruction microscopy (STORM) (Rust et al., 2006), which utilizes the photophysical properties of certain fluorophores (most often Alexa-Fluor 647) in order to push them in and out of a transient dark state. Photoactivated localization microscopy (PALM) (Betzig et al., 2006) relies on photoswitchable proteins to illuminate limited subsets of the sample. Points accumulation for imaging in nanoscale topography (PAINT) (Sharonov and Hochstrasser, 2006) makes use of repeated association and dissociation of the labeled probe, be that through transient interaction between complementary DNA oligonucleotides (DNA-PAINT) (Schnitzbauer et al., 2017), the most commonly implemented option, and IRIS uses the repeated binding of the LifeAct peptide (Kiuchi et al., 2015). IRIS was later used with quantitative analysis to dissect the architecture of cortical actin at the T-cell immune synapse (Peters et al., 2018). Actin has been successfully imaged using all of these techniques. Given the small size of individual actin filaments (∼7 nm), the approximate resolution of 100 nm of techniques like SIM can still obscure significant detail in the actin architecture, which can be revealed with SMLM. As yet, however, this high resolution comes at the expense of live-cell imaging. Most examples are of fixed cells, as toxic blinking buffers (mostly for dSTORM), high laser intensities, and long acquisition times needed limit live applicability.
Many live super-resolution techniques require specialized optical setups and can have limitations in terms of labels and imaging speed. Development of algorithmic approaches to live super-resolution microscopy allows circumvention of some of these issues. Examples include SOFI (super-resolution optical fluctuation imaging, which analyzes temporal fluctuations of the emitters) (Dertinger et al., 2009) and super-resolution radial fluctuations (SRRF) (Gustafsson et al., 2016). SRRF, which uses fluorescence fluctuations over time to calculate radiality on a subpixel basis, is a widely applicable technique, being capable of taking raw widefield, TIRF, confocal, and even SMLM data. The technique has been demonstrated as a way to image LifeAct-GFP labeled actin in T-cell immunological synapses (Gustafsson et al., 2016), with significant improvement in resolution.
Correlative approaches, where multiple imaging techniques are applied to the same cell, are becoming more prevalent in the field. Correlative light and electron microscopy (CLEM) provides the as-yet unparalleled resolving power of electron microscopy techniques while also overcoming some of the labeling limitations inherent in using EM alone. Much of this work has been done outside of immune cells, for example, in neurons, elucidating new nanoscale cytoskeletal structures (Vassilopoulos et al., 2019); however, super-resolution CLEM has been used to image multiple proteins relative to the actin structure around clusters of podosomes in dendritic cells (Joosten et al., 2018), providing insight into differential association of particular proteins with different structures in the podosome. Correlative approaches do extend beyond EM, however. For example, a recent study used SMLM in conjunction with AFM to image podosomes in THP-1 cells (Hirvonen et al., 2020), opening possibilities for dual structural and mechanobiological mapping. The main recent imaging strategies used to image F-actin are summarized in Table 2.
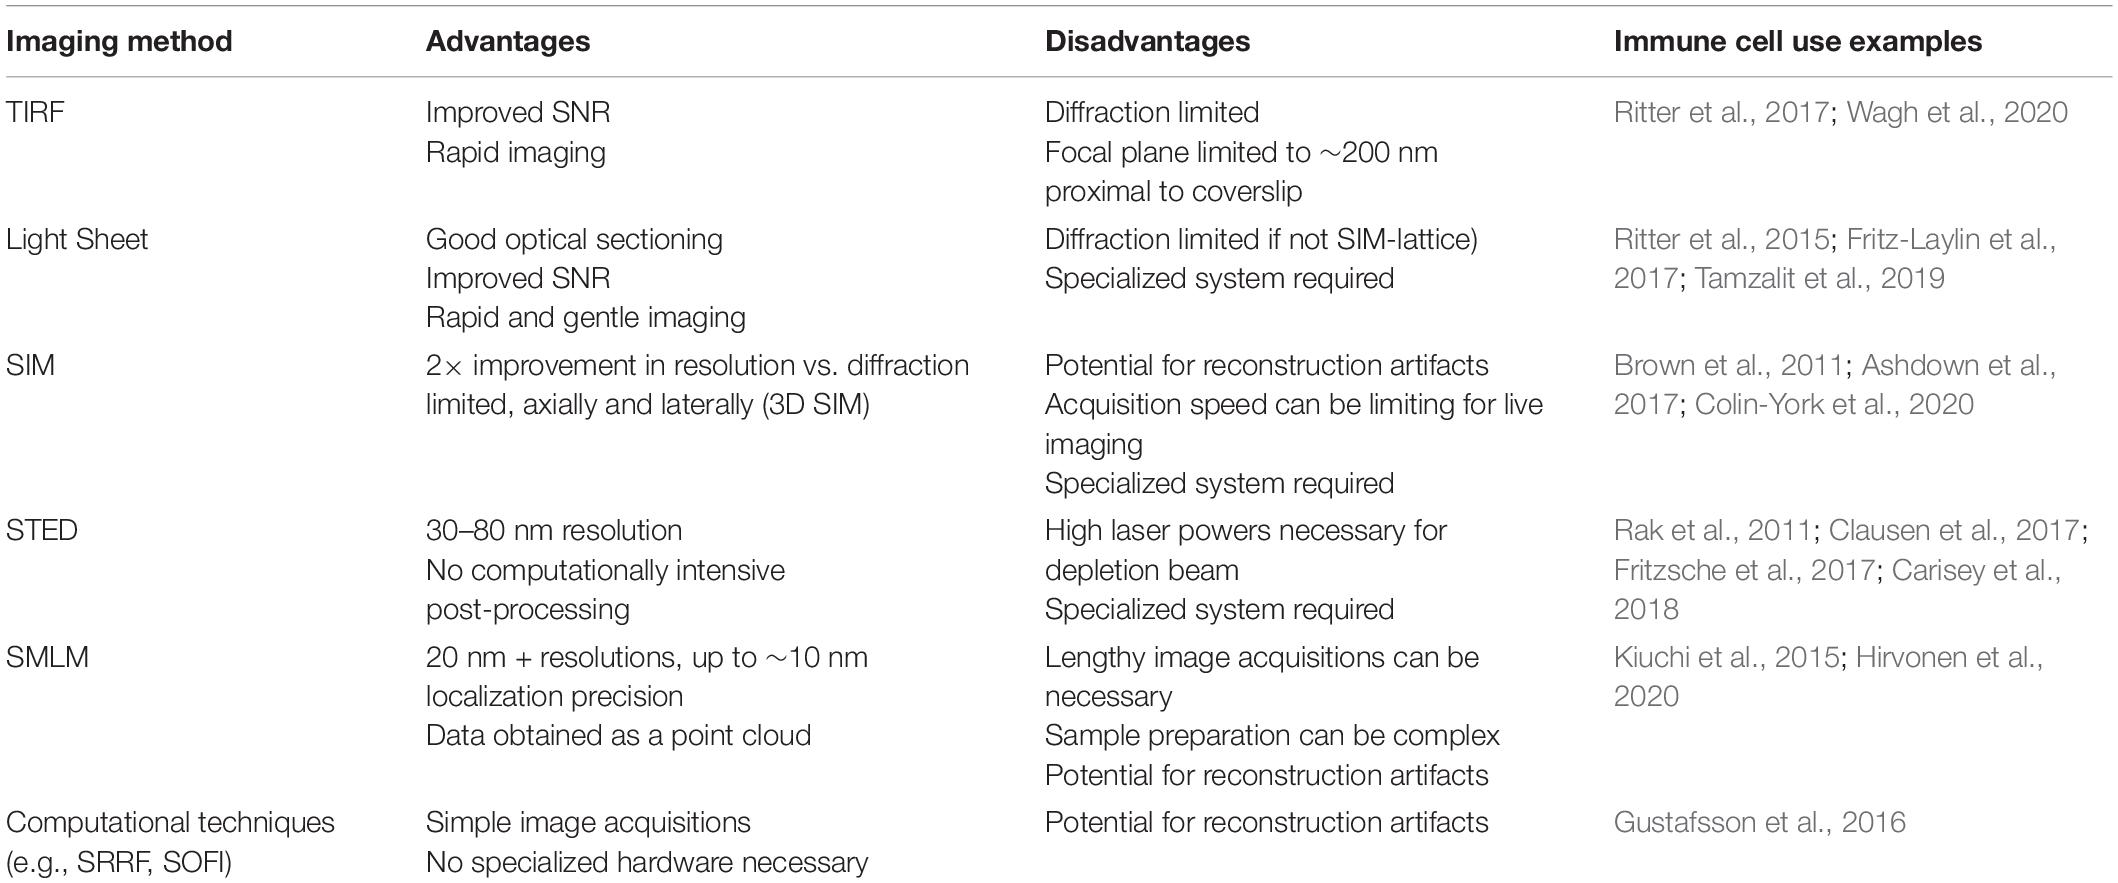
Table 2. Summary of key microscope techniques applied to cytoskeletal imaging.
Quantification
Once sample preparation, labeling, and imaging have been performed, images must be analyzed to extract biologically meaningful, quantitative data. The type of analysis performed depends largely on the biological question being asked. For example, a key differentiator is whether dynamic, live-cell data are being analyzed. Dynamic imaging analysis may involve quantifying flow or the stability of a particular architecture (Ashdown and Owen, 2018; Shannon et al., 2020), for example. In static structures, far richer descriptions of the actin architecture are generally possible.
For components of the cytoskeleton that are typically fibrous structures, the first step is usually to attempt to trace the fibers themselves to generate a mathematical representation of the architecture. This can then be interrogated to extract specific descriptive features. Examples of descriptors that might be desirable when quantifying a fibrous pattern include the number or density of fibers in a given area or volume, the lengths of fibers, or measures of co-orientation and co-linearity between fibers. They may also include the sizes and shapes of enclosed areas between fibers and analysis of branching angles and cross-points as well as curvature measures. These different parameters are illustrated in Figure 2.
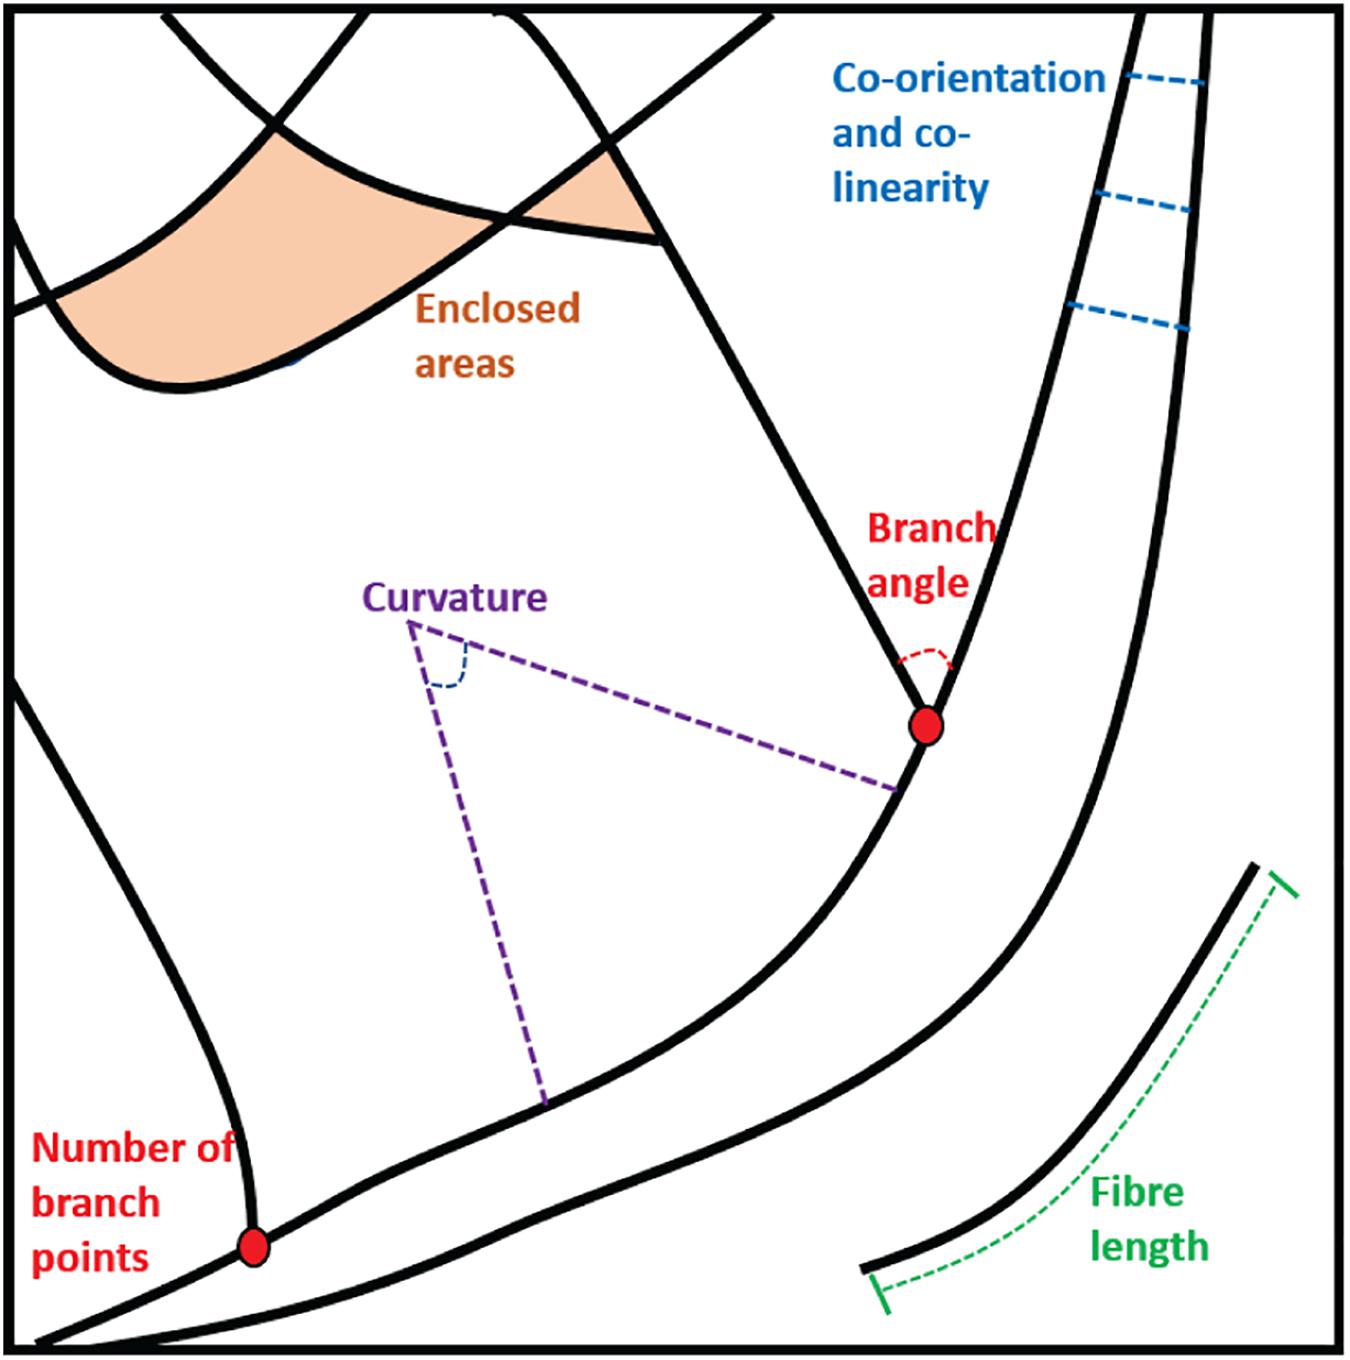
Figure 2. Examples of the parameters that can be extracted from static fiber analysis: Enclosed areas, branch points and angles, fiber lengths and measures of curvature, co-orientation, and co-linearity.
There are many competing algorithms capable of analyzing fibrous architecture and providing these descriptions, but they can generally be divided into two groups—those that work on pixelated images such as those derived from widefield, TIRF, confocal, STED, or reconstructed SIM images, and those that work with pointillist data—the x,y coordinates derived from SMLM imaging.
For methods that produce pixelated images, methods for analyzing actin distributions have existed for some time. Many of the algorithms are related to those that can be used to trace other fibrous structures—dendrites or axons from neuronal images are another common example (Kayasandik et al., 2018). Many are available in image analysis packages such as ImageJ (Schneider et al., 2012) and more exist in various proprietary packages (Schindelin et al., 2012). They often take the form of a ridge estimating algorithm. Many of these, however, begin with some form of cleanup of the raw image—for example, noise filtering. Recently, machine-learning approaches have proven to be well suited for this task and user-friendly packages capable of using machine learning to clean and enhance cytoskeletal images have become available (von Chamier et al., 2021).
One particularly widely applied method of analyzing actin fibrous architecture from pixelated images in immune cells is to quantify the size distributions of clearances between fibers. For cortical actin, this parameter represents a measure of what size of object could traverse the meshwork when traveling from an intracellular pool to the plasma membrane. Such a method has been used to analyze clearances in NK cells (Rak et al., 2011), showing that cortical actin must be cleared for lytic granule release, and the application of such methodology to live-cell imaging of the cytoskeleton allowed the analysis of the dynamics of this clearance process (Carisey et al., 2018).
Zhang et al. (2017) described a method for extracting quantitative descriptions of microtubule architecture from super-resolution SMLM data, provided those data are first converted into pixelated images. Here, filamentous features are enhanced using filters and biologically derived constraints are used to join filament sections together. This allowed the extraction of many of the desirable descriptors: filament length, number of filaments, and so on (Zhang et al., 2017). Somewhat similarly, Kittisopikul also use filters to detect fibrous structures; however, the use of a tunable filter allows particularly detailed analysis of fiber junctions (Kittisopikul et al., 2020). Very recently, one of the most complete algorithms for analyzing fibrous patterns from pixelated images has been developed. FiNTA (Flormann et al., 2021) is based on the vector tracing of grayscale images. It provides rich descriptors of fibrous patterns such as connectivity between fibers, hold sizes and shapes, filament density, and length and measures of curvature.
One way of describing fibrous architecture directly from SMLM-derived point coordinates is to re-purpose statistical methodology designed to analyze other types of structure such as molecular clusters. One such method is Ripley’s K-function, which is based on counting the number of points within ever-increasing circles, centered on each data point. Peters et al. (2018) showed that when a fibrous cytoskeletal network is regular and periodic, this periodicity becomes evident in the Ripley’s K-function curves (Peters et al., 2017). The K-function can therefore be used to measure how regular or chaotic a fibrous pattern is (Peters et al., 2017). Moreover, for immune cell synapses, which are generally radially symmetric, especially in artificial cases such as on a hard surface or a planar-supported lipid bilayer, the method could describe the proportion of tangential and radial fiber orientations.
To extract richer descriptors, algorithms have been developed that trace fiber positions through point clouds (Peters et al., 2018). Such algorithms start at a particular point on a fiber and then attempt to “walk” along the structure, analogous to attempting to navigate along a mountain ridge. This allowed the extraction of fiber lengths, branch points, and so on. Other methods, for example, cluster analysis by Voronoi Tessellation, are applicable to fibers (Levet et al., 2015) as are machine-learning approaches (Williamson et al., 2020).
Conclusion
The actin cytoskeleton is a diverse structure. Its organization and dynamics have a profound effect on the regulation of immune cells. Here, we have reviewed optical imaging approaches for this purpose, examining labeling strategies, imaging hardware, and the associated statistical analysis. Taken together, these allow the structure and dynamics of the cytoskeleton to be quantitatively described, even on scales far below the resolution of conventional optical imaging.
Despite the recent progress, several aspects of the role of the cytoskeleton in immune cells remain to be uncovered and further developments in imaging techniques might shed light on these questions. One interesting aspect concerns the role of cortical actin in regulating the distributions and dynamics of membrane proteins. For example, it is known that many proximal signaling proteins on the surface of NK cells, B cells, and T cells are clustered on the nanoscale and show various kinds of constrained diffusion, especially at immunological synapses (Fooksman et al., 2010; Yokosuka and Saito, 2010; Pageon et al., 2013). Frameworks such as the picket fence model (Fujiwara et al., 2016) seek to explain the role of cortical actin in these processes. However, even for super-resolution techniques, the density of fibers in the cortex can be a challenge to accurately describe, especially given their dynamic nature. Correlative methods, ultra-high-resolution imaging, and live-cell SMLM could be applicable to this problem (Henriques et al., 2011; Balzarotti et al., 2017; Griffié et al., 2018; Cnossen et al., 2020).
Another aspect frequently left understudied is the 3D organization of the cytoskeleton. In immune cell processes such as phagocytosis, actin is necessarily remodeled in 3D. 3D SMLM and fiber analysis have been attempted (Peters et al., 2019), but advancements in other 3D modalities, including light sheet, would also be advantageous (Sapoznik et al., 2020).
Finally, a perhaps undervalued area is the mathematical modeling of the resulting data. A common goal is often not to image or understand the actin organization in any particular cell, but to be able to model and predict the organization in an average cell or a population of cells. To do this, statistical modeling approaches and machine learning require large amounts of data, and so high-throughput and high-content imaging systems, centered on automation, will be key.
Author Contributions
All authors listed have made a substantial, direct and intellectual contribution to the work, and approved it for publication.
Funding
This work was supported by the British Heart Foundation (BHF) (NH/18/3/33913) and BBSRC grant BB/R007365/1. EG was funded on a COMPARE Studentship.
Conflict of Interest
The authors declare that the research was conducted in the absence of any commercial or financial relationships that could be construed as a potential conflict of interest.
Publisher’s Note
All claims expressed in this article are solely those of the authors and do not necessarily represent those of their affiliated organizations, or those of the publisher, the editors and the reviewers. Any product that may be evaluated in this article, or claim that may be made by its manufacturer, is not guaranteed or endorsed by the publisher.
Acknowledgments
The authors would like to thank the Centre of Membrane Proteins and Receptors, University of Birmingham.
References
Aizawa, H., Sameshima, M., and Yahara, I. (1997). A green fluorescent protein-actin fusion protein dominantly inhibits cytokinesis, cell spreading, and locomotion in dictyostelium. Cell Struct. Funct. 22, 335–345. doi: 10.1247/csf.22.335
Ashdown, G. W., Burn, G. L., Williamson, D. J., Pandžiæ, E., Peters, R., Holden, M., et al. (2017). Live-Cell super-resolution reveals F-Actin and plasma membrane dynamics at the T cell synapse. Biophys. J. 112, 1703–1713. doi: 10.1016/j.bpj.2017.01.038
Ashdown, G. W., and Owen, D. M. (2018). Spatio-temporal image correlation spectroscopy and super-resolution microscopy to quantify molecular dynamics in T cells. Methods 140-141, 112–118. doi: 10.1016/j.ymeth.2018.01.017
Ball, G., Demmerle, J., Kaufmann, R., Davis, I., Dobbie, I. M., and Schermelleh, L. (2015). SIMcheck: a toolbox for successful super-resolution structured illumination microscopy. Sci. Rep. 5:15915. doi: 10.1038/srep15915
Balzarotti, F., Eilers, Y., Gwosch, K. C., Gynnå, A. H., Westphal, V., Stefani, F. D., et al. (2017). Nanometer resolution imaging and tracking of fluorescent molecules with minimal photon fluxes. Science 355, 606–612. doi: 10.1126/science.aak9913
Betzig, E., Patterson, G. H., Sougrat, R., Lindwasser, O. W., Olenych, S., Bonifacino, J. S., et al. (2006). Imaging intracellular fluorescent proteins at nanometer resolution. Science 313:1642. doi: 10.1126/science.1127344
Billadeau, D. D., Nolz, J. C., and Gomez, T. S. (2007). Regulation of T-cell activation by the cytoskeleton. Nat. Rev. Immunol. 7, 131–143. doi: 10.1038/nri2021
Brown, A. C. N., Oddos, S., Dobbie, I. M., Alakoskela, J.-M., Parton, R. M., Eissmann, P., et al. (2011). Remodelling of cortical actin where lytic granules dock at natural killer cell immune synapses revealed by super-resolution microscopy. PLoS Biol. 9:e1001152. doi: 10.1371/journal.pbio.1001152
Burkel, B. M., von Dassow, G., and Bement, W. M. (2007). Versatile fluorescent probes for actin filaments based on the actin-binding domain of utrophin. Cell Motil. Cytoskeleton 64, 822–832. doi: 10.1002/cm.20226
Carisey, A. F., Mace, E. M., Saeed, M. B., Davis, D. M., and Orange, J. S. (2018). Nanoscale dynamism of actin enables secretory function in cytolytic cells. Curr. Biol. CB 28, 489–502.e9. doi: 10.1016/j.cub.2017.12.044
Castellano, F., Chavrier, P., and Caron, E. (2001). Actin dynamics during phagocytosis. Semin. Immunol. 13, 347–355. doi: 10.1006/smim.2001.0331
Chen, B.-C., Legant, W. R., Wang, K., Shao, L., Milkie, D. E., Davidson, M. W., et al. (2014). Lattice light-sheet microscopy: imaging molecules to embryos at high spatiotemporal resolution. Science 346:1257998. doi: 10.1126/science.1257998
Clausen, M. P., Colin-York, H., Schneider, F., Eggeling, C., and Fritzsche, M. (2017). Dissecting the actin cortex density and membrane-cortex distance in living cells by super-resolution microscopy. J. Phys. D: Appl. Phys. 50, 064002–064002. doi: 10.1088/1361-6463/aa52a1
Cnossen, J., Hinsdale, T., Thorsen, R. Ø, Siemons, M., Schueder, F., Jungmann, R., et al. (2020). Localization microscopy at doubled precision with patterned illumination. Nat. Methods 17, 59–63. doi: 10.1038/s41592-019-0657-7
Colin-York, H., Kumari, S., Barbieri, L., Cords, L., and Fritzsche, M. (2020). Distinct actin cytoskeleton behaviour in primary and immortalised T-cells. J. Cell Sci. 133:jcs232322. doi: 10.1242/jcs.232322
Deibler, M., Spatz, J. P., and Kemkemer, R. (2011). Actin fusion proteins alter the dynamics of mechanically induced cytoskeleton rearrangement. PLoS One 6:e22941. doi: 10.1371/journal.pone.0022941
Demmerle, J., Innocent, C., North, A. J., Ball, G., Müller, M., Miron, E., et al. (2017). Strategic and practical guidelines for successful structured illumination microscopy. Nat. Protocols 12, 988–1010. doi: 10.1038/nprot.2017.019
DeMond, A. L., Mossman, K. D., Starr, T., Dustin, M. L., and Groves, J. T. (2008). T cell receptor microcluster transport through molecular mazes reveals mechanism of translocation. Biophys. J. 94, 3286–3292. doi: 10.1529/biophysj.107.119099
Dertinger, T., Colyer, R., Iyer, G., Weiss, S., and Enderlein, J. (2009). Fast, background-free, 3D super-resolution optical fluctuation imaging (SOFI). Proc. Natl. Acad. Sci. U S A. 106:22287. doi: 10.1073/pnas.0907866106
DesMarais, V., Eddy, R. J., Sharma, V. P., Stone, O., and Condeelis, J. S. (2019). Optimizing leading edge F-actin labeling using multiple actin probes, fixation methods and imaging modalities. BioTechniques 66, 113–119. doi: 10.2144/btn-2018-0112
Dustin, M. L., and Cooper, J. A. (2000). The immunological synapse and the actin cytoskeleton: molecular hardware for T cell signaling. Nat. Immunol. 1, 23–29. doi: 10.1038/76877
Flores, L. R., Keeling, M. C., Zhang, X., Sliogeryte, K., and Gavara, N. (2019). Lifeact-TagGFP2 alters F-actin organization, cellular morphology and biophysical behaviour. Sci. Rep. 9:3241. doi: 10.1038/s41598-019-40092-w
Flormann, D. A. D., Schu, M., Terriac, E., Thalla, D., Kainka, L., Koch, M., et al. (2021). A novel universal algorithm for filament network tracing and cytoskeleton analysis. FASEB J. 35:e21582. doi: 10.1096/fj.202100048R
Fooksman, D. R., Vardhana, S., Vasiliver-Shamis, G., Liese, J., Blair, D. A., Waite, J., et al. (2010). Functional anatomy of T cell activation and synapse formation. Annu. Rev. Immunol. 28, 79–105. doi: 10.1146/annurev-immunol-030409-101308
Fritz-Laylin, L. K., Riel-Mehan, M., Chen, B. C., Lord, S. J., Goddard, T. D., Ferrin, T. E., et al. (2017). Actin-based protrusions of migrating neutrophils are intrinsically lamellar and facilitate direction changes. eLife 6:e26990. doi: 10.7554/eLife.26990
Fritzsche, M., Fernandes, R. A., Chang, V. T., Colin-York, H., Clausen, M. P., Felce, J. H., et al. (2017). Cytoskeletal actin dynamics shape a ramifying actin network underpinning immunological synapse formation. Sci. Adv. 3:e1603032. doi: 10.1126/sciadv.1603032
Fujiwara, T. K., Iwasawa, K., Kalay, Z., Tsunoyama, T. A., Watanabe, Y., Umemura, Y. M., et al. (2016). Confined diffusion of transmembrane proteins and lipids induced by the same actin meshwork lining the plasma membrane. Mol. Biol. Cell 27, 1101–1119. doi: 10.1091/mbc.E15-04-0186
Griffié, J., Burn, G. L., Williamson, D. J., Peters, R., Rubin-Delanchy, P., and Owen, D. M. (2018). Dynamic bayesian cluster analysis of live-cell single molecule localization microscopy datasets. Small Methods 2:1800008. doi: 10.1002/smtd.201800008
Gustafsson, N., Culley, S., Ashdown, G., Owen, D. M., Pereira, P. M., and Henriques, R. (2016). Fast live-cell conventional fluorophore nanoscopy with ImageJ through super-resolution radial fluctuations. Nat. Commun. 7:12471. doi: 10.1038/ncomms12471
Hartman, N. C., Nye, J. A., and Groves, J. T. (2009). Cluster size regulates protein sorting in the immunological synapse. Proc. Natl. Acad. Sci. U S A. 106, 12729–12734. doi: 10.1073/pnas.0902621106
Hell, S. W., and Wichmann, J. (1994). Breaking the diffraction resolution limit by stimulated emission: stimulated-emission-depletion fluorescence microscopy. Opt. Lett. 19, 780–782. doi: 10.1364/OL.19.000780
Henriques, R., Griffiths, C., Hesper Rego, E., and Mhlanga, M. M. (2011). PALM and STORM: unlocking live-cell super-resolution. Biopolymers 95, 322–331. doi: 10.1002/bip.21586
Hirvonen, L. M., Marsh, R. J., Jones, G. E., and Cox, S. (2020). Combined AFM and super-resolution localisation microscopy: investigating the structure and dynamics of podosomes. Eur. J. Cell Biol. 99:151106. doi: 10.1016/j.ejcb.2020.151106
Joosten, B., Willemse, M., Fransen, J., Cambi, A., and van den Dries, K. (2018). Super-Resolution Correlative Light and Electron Microscopy (SR-CLEM) reveals novel ultrastructural insights into dendritic cell podosomes. Front. Immunol. 9:1908. doi: 10.3389/fimmu.2018.01908
Kayasandik, C., Negi, P., Laezza, F., Papadakis, M., and Labate, D. (2018). Automated sorting of neuronal trees in fluorescent images of neuronal networks using NeuroTreeTracer. Sci. Rep. 8:6450. doi: 10.1038/s41598-018-24753-w
Kittisopikul, M., Vahabikashi, A., Shimi, T., Goldman, R. D., and Jaqaman, K. (2020). Adaptive multiorientation resolution analysis of complex filamentous network images. Bioinformatics 36, 5093–5103. doi: 10.1093/bioinformatics/btaa627
Kiuchi, T., Higuchi, M., Takamura, A., Maruoka, M., and Watanabe, N. (2015). Multitarget super-resolution microscopy with high-density labeling by exchangeable probes. Nat. Methods 12, 743–746. doi: 10.1038/nmeth.3466
Klar, T. A., Jakobs, S., Dyba, M., Egner, A., and Hell, S. W. (2000). Fluorescence microscopy with diffraction resolution barrier broken by stimulated emission. Proc. Natl. Acad. Sci. U S A. 97:8206. doi: 10.1073/pnas.97.15.8206
Kumari, S., Curado, S., Mayya, V., and Dustin, M. L. (2014). T cell antigen receptor activation and actin cytoskeleton remodeling. Biochimica et Biophysica Acta (BBA) - Biomembranes 1838, 546–556. doi: 10.1016/j.bbamem.2013.05.004
Kumari, S., Mak, M., Poh, Y.-C., Tohme, M., Watson, N., Melo, M., et al. (2020). Cytoskeletal tension actively sustains the migratory T-cell synaptic contact. EMBO J. 39:e102783. doi: 10.15252/embj.2019102783
Levet, F., Hosy, E., Kechkar, A., Butler, C., Beghin, A., Choquet, D., et al. (2015). SR-Tesseler: a method to segment and quantify localization-based super-resolution microscopy data. Nat. Methods 12, 1065–1071. doi: 10.1038/nmeth.3579
Leyton-Puig, D., Kedziora, K. M., Isogai, T., Broek, B. V. D., Jalink, K., and Innocenti, M. (2016). PFA fixation enables artifact-free super-resolution imaging of the actin cytoskeleton and associated proteins. Biol. Open 5, 1001–1009. doi: 10.1242/bio.019570
Lichtman, J. W., and Conchello, J. A. (2005). Fluorescence microscopy. Nat. Methods 2, 910–919. doi: 10.1038/nmeth817
Lopata, A., Hughes, R., Tiede, C., Heissler, S. M., Sellers, J. R., Knight, P. J., et al. (2018). Affimer proteins for F-actin: novel affinity reagents that label F-actin in live and fixed cells. Sci. Rep. 8:6572. doi: 10.1038/s41598-018-24953-4
Lukinavičius, G., Reymond, L., D’Este, E., Masharina, A., Göttfert, F., Ta, H., et al. (2014). Fluorogenic probes for live-cell imaging of the cytoskeleton. Nat. Methods 11, 731–733. doi: 10.1038/nmeth.2972
May, R. C., and Machesky, L. M. (2001). Phagocytosis and the actin cytoskeleton. J. Cell Sci. 114, 1061. doi: 10.1242/jcs.114.6.1061
Melak, M., Plessner, M., and Grosse, R. (2017). Actin visualization at a glance. J. Cell Sci. 130, 525–530. doi: 10.1242/jcs.204487
Nagasaki, A., Kijima, T. S., Yumoto, T., Imaizumi, M., Yamagishi, A., Kim, H., et al. (2017). The position of the GFP tag on actin affects the filament formation in mammalian cells. Cell Struct. Funct. 42, 131–140. doi: 10.1247/csf.17016
Pageon, S. V., Cordoba, S. P., Owen, D. M., Rothery, S. M., Oszmiana, A., and Davis, D. M. (2013). Superresolution microscopy reveals nanometer-scale reorganization of inhibitory natural killer cell receptors upon activation of NKG2D. Sci. Signal. 6:ra62. doi: 10.1126/scisignal.2003947
Pereira, P. M., Albrecht, D., Culley, S., Jacobs, C., Marsh, M., Mercer, J., et al. (2019). Fix your membrane receptor imaging: actin cytoskeleton and CD4 membrane organization disruption by chemical fixation. Front. Immunol. 10:675. doi: 10.3389/fimmu.2019.00675
Peters, R., Benthem Muñiz, M., Griffié, J., Williamson, D. J., Ashdown, G. W., Lorenz, C. D., et al. (2017). Quantification of fibrous spatial point patterns from single-molecule localization microscopy (SMLM) data. Bioinformatics 33, 1703–1711. doi: 10.1093/bioinformatics/btx026
Peters, R., Griffié, J., Burn, G. L., Williamson, D. J., and Owen, D. M. (2018). Quantitative fibre analysis of single-molecule localization microscopy data. Sci. Rep. 8:10418. doi: 10.1038/s41598-018-28691-5
Peters, R., Griffié, J., Williamson, D., Aaron, J., Khuon, S., and Owen, D. (2019). Development of 2-colour and 3D SMLM data analysis methods for fibrous spatial point patterns. J. Phys. D 52:014005. doi: 10.1088/1361-6463/aae7ac
Rak, G. D., Mace, E. M., Banerjee, P. P., Svitkina, T., and Orange, J. S. (2011). Natural killer cell lytic granule secretion occurs through a pervasive actin network at the immune synapse. PLoS Biol. 9:e1001151. doi: 10.1371/journal.pbio.1001151
Riedl, J., Crevenna, A. H., Kessenbrock, K., Yu, J. H., Neukirchen, D., Bista, M., et al. (2008). Lifeact: a versatile marker to visualize F-actin. Nat. Methods 5, 605–607. doi: 10.1038/nmeth.1220
Riedl, J., Flynn, K. C., Raducanu, A., Gärtner, F., Beck, G., Bösl, M., et al. (2010). Lifeact mice for studying F-actin dynamics. Nat. Methods 7, 168–169. doi: 10.1038/nmeth0310-168
Ritter, A. T., Asano, Y., Stinchcombe, J. C., Dieckmann, N. M. G., Chen, B.-C., et al. (2015). Actin depletion initiates events leading to granule secretion at the immunological synapse. Immunity 42, 864–876. doi: 10.1016/j.immuni.2015.04.013
Ritter, A. T., Kapnick, S. M., Murugesan, S., Schwartzberg, P. L., Griffiths, G. M., and Lippincott-Schwartz, J. (2017). Cortical actin recovery at the immunological synapse leads to termination of lytic granule secretion in cytotoxic T lymphocytes. Proc. Natl. Acad. Sci. U S A. 114, E6585–E6594. doi: 10.1073/pnas.1710751114
Rothbauer, U., Zolghadr, K., Tillib, S., Nowak, D., Schermelleh, L., Gahl, A., et al. (2006). Targeting and tracing antigens in live cells with fluorescent nanobodies. Nat. Methods 3, 887–889. doi: 10.1038/nmeth953
Rust, M. J., Bates, M., and Zhuang, X. (2006). Sub-diffraction-limit imaging by stochastic optical reconstruction microscopy (STORM). Nat. Methods 3, 793–795. doi: 10.1038/nmeth929
Samstag, Y., Eibert, S. M., Klemke, M., and Wabnitz, G. H. (2003). Actin cytoskeletal dynamics in T lymphocyte activation and migration. J. Leukoc. Biol. 73, 30–48. doi: 10.1189/jlb.0602272
Sapoznik, E., Chang, B.-J., Huh, J., Ju, R. J., Azarova, E. V., Pohlkamp, T., et al. (2020). A versatile oblique plane microscope for large-scale and high-resolution imaging of subcellular dynamics. eLife 9:e57681. doi: 10.1101/2020.04.07.030569
Schachtner, H., Li, A., Stevenson, D., Calaminus, S. D. J., Thomas, S., et al. (2012). Tissue inducible Lifeact expression allows visualization of actin dynamics in vivo and ex vivo. Eur. J. Cell Biol. 91, 923–929. doi: 10.1016/j.ejcb.2012.04.002
Schell, M. J., Erneux, C., and Irvine, R. F. (2001). Inositol 1,4,5-Trisphosphate 3-Kinase a associates with f-actin and dendritic spines via its N terminus ∗. J. Biol. Chem. 276, 37537–37546. doi: 10.1074/jbc.M104101200
Schiavon, C. R., Zhang, T., Zhao, B., Moore, A. S., Wales, P., Andrade, L. R., et al. (2020). Actin chromobody imaging reveals sub-organellar actin dynamics. Nat. Methods 17, 917–921. doi: 10.1038/s41592-020-0926-5
Schindelin, J., Arganda-Carreras, I., Frise, E., Kaynig, V., Longair, M., Pietzsch, T., et al. (2012). Fiji: an open-source platform for biological-image analysis. Nat. Methods 9, 676–682. doi: 10.1038/nmeth.2019
Schneider, C. A., Rasband, W. S., and Eliceiri, K. W. (2012). NIH Image to ImageJ: 25 years of image analysis. Nat. Methods 9, 671–675. doi: 10.1038/nmeth.2089
Schnitzbauer, J., Strauss, M. T., Schlichthaerle, T., Schueder, F., and Jungmann, R. (2017). Super-resolution microscopy with DNA-PAINT. Nat. Protocols 12, 1198–1228. doi: 10.1038/nprot.2017.024
Shannon, M. J., Pineau, J., Griffié, J., Aaron, J., Peel, T., Williamson, D. J., et al. (2020). Differential nanoscale organisation of LFA-1 modulates T-cell migration. J. Cell Sci. 133:jcs232991. doi: 10.1242/jcs.232991
Sharonov, A., and Hochstrasser, R. M. (2006). Wide-field subdiffraction imaging by accumulated binding of diffusing probes. Proc. Natl. Acad. Sci. U S A. 103:18911. doi: 10.1073/pnas.0609643104
Svitkina, T. (2009). Imaging cytoskeleton components by electron microscopy. Methods Mol. Biol. (Clifton, N.J.) 586, 187–206. doi: 10.1007/978-1-60761-376-3_10
Tamzalit, F., Wang, M. S., Jin, W., Tello-Lafoz, M., Boyko, V., Heddleston, J. M., et al. (2019). Interfacial actin protrusions mechanically enhance killing by cytotoxic T cells. Sci. Immunol. 4:eaav5445. doi: 10.1126/sciimmunol.aav5445
Tiede, C., Tang, A. A. S., Deacon, S. E., Mandal, U., Nettleship, J. E., et al. (2014). Adhiron: a stable and versatile peptide display scaffold for molecular recognition applications. Protein Eng. Des. Select. PEDS 27, 145–155. doi: 10.1093/protein/gzu007
Vassilopoulos, S., Gibaud, S., Jimenez, A., Caillol, G., and Leterrier, C. (2019). Ultrastructure of the axonal periodic scaffold reveals a braid-like organization of actin rings. Nat. Commun. 10:5803. doi: 10.1038/s41467-019-13835-6
von Chamier, L., Laine, R. F., Jukkala, J., Spahn, C., Krentzel, D., Nehme, E., et al. (2021). Democratising deep learning for microscopy with ZeroCostDL4Mic. Nat. Commun. 12:2276. doi: 10.1038/s41467-021-22518-0
Wagh, K., Wheatley, B. A., Traver, M. K., Hussain, I., Schaefer, B. C., and Upadhyaya, A. (2020). Bcl10 is associated with actin dynamics at the T cell immune synapse. Cell Immunol. 356:104161. doi: 10.1016/j.cellimm.2020.104161
Westphal, M., Jungbluth, A., Heidecker, M., Mühlbauer, B., Heizer, C., Schwartz, J.-M., et al. (1997). Microfilament dynamics during cell movement and chemotaxis monitored using a GFP–actin fusion protein. Curr. Biol. 7, 176–183. doi: 10.1016/S0960-9822(97)70088-5
Whelan, D. R., and Bell, T. D. M. (2015). Image artifacts in Single Molecule Localization microscopy: why optimization of sample preparation protocols matters. Sci. Rep. 5:7924. doi: 10.1038/srep07924
Williamson, D. J., Burn, G. L., Simoncelli, S., Griffié, J., Peters, R., Davis, D. M., et al. (2020). Machine learning for cluster analysis of localization microscopy data. Nat. Commun. 11:1493. doi: 10.1038/s41467-020-15293-x
Wulf, E., Deboben, A., Bautz, F. A., Faulstich, H., and Wieland, T. (1979). Fluorescent phallotoxin, a tool for the visualization of cellular actin. Proc. Natl. Acad. Sci. U S A. 76, 4498–4502. doi: 10.1073/pnas.76.9.4498
Yokosuka, T., and Saito, T. (2010). The immunological synapse, TCR microclusters, and T cell activation. Curr. Top. Microbiol. Immunol. 340, 81–107. doi: 10.1007/978-3-642-03858-7_5
Yu, Y., Smoligovets, A. A., and Groves, J. T. (2013). Modulation of T cell signaling by the actin cytoskeleton. J. Cell Sci. 126:1049. doi: 10.1242/jcs.098210
Keywords: actin, microscopy, super-resolution, fiber analysis, cytoskeleton
Citation: Garlick E, Thomas SG and Owen DM (2021) Super-Resolution Imaging Approaches for Quantifying F-Actin in Immune Cells. Front. Cell Dev. Biol. 9:676066. doi: 10.3389/fcell.2021.676066
Received: 04 March 2021; Accepted: 20 May 2021;
Published: 19 August 2021.
Edited by:
Sudha Kumari, Massachusetts Institute of Technology, United StatesReviewed by:
Maté Biro, University of New South Wales, AustraliaPieta Mattila, University of Turku, Finland
Copyright © 2021 Garlick, Thomas and Owen. This is an open-access article distributed under the terms of the Creative Commons Attribution License (CC BY). The use, distribution or reproduction in other forums is permitted, provided the original author(s) and the copyright owner(s) are credited and that the original publication in this journal is cited, in accordance with accepted academic practice. No use, distribution or reproduction is permitted which does not comply with these terms.
*Correspondence: Dylan M. Owen, d.owen@bham.ac.uk
†ORCID: Evelyn Garlick, orcid.org/0000-0002-9292-1354; Steven G. Thomas, orcid.org/0000-0001-8733-7842; Dylan M. Owen, orcid.org/0000-0002-5284-2782