Improving the sensitivity of cochlear implant integrity testing by recording electrode voltages with surface electrodes
 Mary Grasmeder
 Katrine Rogers2†
  Ziya Aydin
 Kate Hough
 Carl Verschuur
 Tracey Newman
- 1Auditory Implant Service, University of Southampton, Southampton, United Kingdom
- 2School of Mathematics and Statistics, Open University, Milton Keynes, United Kingdom
- 3Hearing and Balance Centre, University of Southampton, Southampton, United Kingdom
- 4Faculty of Medicine, University of Southampton, Southampton, United Kingdom
Introduction: Identification of faults with the internal, implanted, part of a cochlear implant presents a challenge for the cochlear implant community. Advanced Bionics Ultra V1 devices are vulnerable to moisture ingress, a hard failure, resulting in reduced volume and clarity for the recipient. The manufacturer uses a trans-impedance test “Electrical Field Imaging” to identify faulty Ultra V1 devices but reports the sensitivity of the test to be only 70–90%.
Methods: In our clinic we performed Electrode Voltage measurements with surface electrodes and have compared the two tests. Electrical Field imaging and Electrode Voltage (EV) measurements were available for 65 devices. Surface electrodes were attached to the earlobes and forehead and potentials measured in three montages: ipsilateral earlobe and forehead, contralateral earlobe and forehead, and both earlobes; voltages were extracted and relative voltages across the array were calculated.
Results: Relative EV were compared for the two earlobes montage and fitted to a third order polynomial function. A new criterion for identifying faulty devices was derived, with a deviation of <6% for individual electrodes for normally functioning devices or ≥6% for faulty devices. All devices which were normal according to the new criterion (N = 15) had a normal electrical field imaging test, whilst 17/50 devices which were abnormal had normal electrical field imaging and 33/50 which were abnormal had abnormal electrical field imaging.
Discussion: The REVs test was well-tolerated and carried out in a routine cochlear implant clinic. Together with test sensitivity and reliability this may make it a new routine assessment tool to aid in distinguishing hard and soft failures.
1 Introduction
Cochlear implants (CIs) are reported to be the most successful neural prostheses developed to date (Wilson and Dorman, 2008). Financial estimates are returns of between 1.62 and 1.84 for every dollar invested in cochlear implant care in low-middle and high-income settings (World Health Organization, 2021). They have restored hearing to around 700,000 people worldwide (www.ewing-foundation.org.uk) over the last three decades. However, recipients can experience a deterioration in the sound quality over time. One reason for this is that the internal component of the device can become faulty, a so-called hard failure, and may require replacement. A recent systematic review estimated 4.7% of all cochlear implants have been re-implanted (Liu et al., 2023). A challenge for the cochlear implant community is how best to support the growing number of recipients and in particular how to identify and manage problems that arise as the CI devices age. Typically, manufacturers attend clinics to test the internal part of a device if it is suspected to be faulty, but this situation limits the number of tests that can be performed. This approach is unlikely to be sustainable and does not necessarily result in all the available information being utilized, as the focus of the assessment is on the function of the device, rather than the position of the electrodes or the condition of the cochlea.
In February 2020, Advanced Bionics corporation recalled Ultra V1 cochlear implants (CIs), due to a vulnerability of the implanted device to moisture ingress. Moisture ingress leads to partial short circuits to the implant's reference electrodes, resulting in reduced amplitude stimuli and reduced sound quality (Eitutis et al., 2022; Gärtner and Lenarz, 2022; Lindquist et al., 2022; McHugh et al., 2022; Schwam et al., 2023; Winchester et al., 2023). Clinicians may observe changes in impedance telemetry, neural response imaging, soundfield aided thresholds and speech perception assessments as the issue progresses. However, as none of these clinical outcomes are diagnostic for the specific fault, further test(s) are required to be confident that any change in performance has been caused by malfunctioning electrodes, rather than a physiological issue or problem with the position of the electrodes.
Advanced Bionics (AB) provide a test for assessment of electrode function in these devices, Electrical Field Imaging (EFI), which is available via their Active Insertion Monitoring “AIM tablet” (Eitutis et al., 2022) and can be performed in routine cochlear implant audiology clinics. It is the first integrity test that the manufacturer has provided for routine clinical use, beyond standard impedance telemetry. It is a test of trans-impedance measurements and the fault appears as a reduction in the trans-impedance for affected electrodes. The test includes a software tool for automated analysis of the results, detailing which electrodes are likely to be affected by the issue. An example is shown in Figure 1. The test has some limitations, as the manufacturer's analysis tool warns that it may be inaccurate in cases of partially inserted electrode arrays, recipients with abnormal anatomy and should not be used before 3 months post-surgery. Eitutis et al. (2022) and Gärtner and Lenarz (2022) give examples of Ultra V1 CI faults that did not register on the manufacturer's automated analysis tool. The manufacturer has recently reported that the sensitivity of the test falls between 70 and 90% (Boyle, June 2023, personal communication).
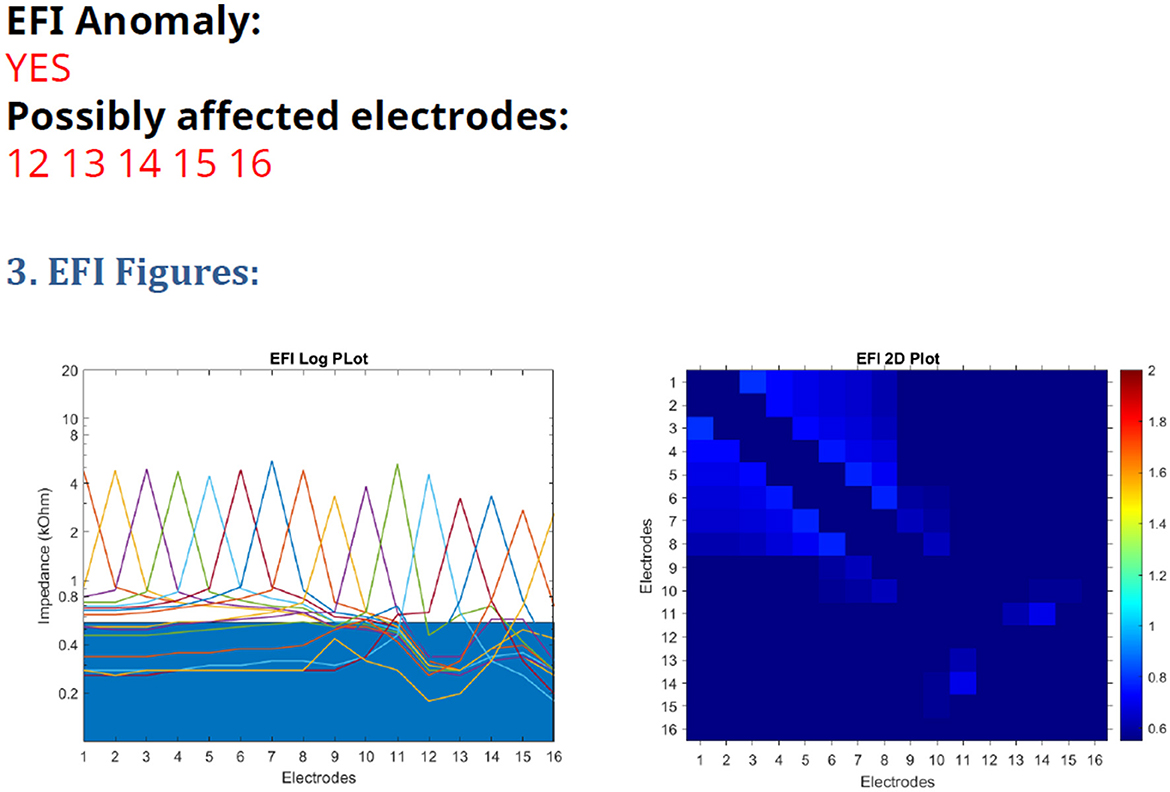
Figure 1. EFI test printout from the AIM tablet, with a line graph on the (left) and heatmap on the (right).
Averaged Electrode Voltages (AEVs), recorded using surface electrodes, have been used for integrity testing for many years for Nucleus devices. Individual electrodes are stimulated sequentially in common ground, bipolar and monopolar modes during the manufacturer's integrity test. Voltages are compared for individual electrodes for each stimulation mode: traces for normally functioning devices show smooth changes across the array, whilst faulty electrodes may have unexpectedly low or high amplitudes, altered morphology or phases with reversed polarity (Hughes, 2013). Electrode faults are much more commonly observed in common ground and bipolar modes than in monopolar modes (Hughes et al., 2004). A limitation of the test is that it requires subjective assessment of the traces by highly trained professionals to determine if an electrode is faulty or not.
Advanced Bionics devices can only be stimulated in monopolar mode, so AEV measurements seem like an unlikely candidate for integrity testing of electrode faults. However, the AB Ultra V1 issue involves partial short circuits involving the reference electrodes, one of which forms part of the implant package. This is located just under the skin, creating a potential which can be picked up by surface electrodes, as found by a recent study (Eitutis et al., 2022). When peak-to-peak voltages were measured, with recording electrodes positioned on the contralateral mastoid and high forehead, similar AEV amplitudes were recorded for normally functioning electrodes. Faulty devices showed a drop in AEV amplitude of ≥20% for an electrode or group of electrodes; a drop of 15–19% may also be indicative of the fault. Reduced AEV amplitudes for monopolar recordings correspond to a reduction in output from the device and reduced audibility for the recipient. As such they are a very useful measure of electrode function. However, with testing sessions that required 150 recordings for each electrode for three different stimulus levels, taking ~1 h each, the authors (Eitutis et al., 2022) did not advocate that AEVs are measured routinely for all recipients of these devices.
In a previous study (Grasmeder et al., 2021) we reported on recording electrode voltages (REVs) using surface electrodes without averaging. This method is considerably quicker than using averaging, as EVs for all the electrodes on the array can be recorded within a single time window of 10 ms. Trace repeatability in the previous study was considered acceptable, especially for monopolar testing, even though the amplifier used had a modest sampling rate. Many current amplifiers are capable of much higher sampling rates, which means that they can capture individual cochlear implant stimuli more effectively. For example, a sampling rate of 400 kHz will capture 40 samples for a 100 μs stimulus pulse, sufficient to observe individual stimuli and allow distortions in the waveform to be observed. This opens up the possibility that REVs could be used in cochlear implant clinics to assess electrode function routinely, as the recordings are both accurate and quick.
The recording montages used differed between studies: in our protocol one of the recording electrodes was always on the same (ipsilateral) side of the head as the implant and the other on the forehead, whereas in the AEV study (Eitutis et al., 2022) the recording electrodes were placed on the forehead and opposite (contralateral) side of the head. EVs are likely to have larger amplitudes when one of the recording electrodes is positioned close to the implant. There is a risk that amplitudes may be too small for easy recording when the recording electrodes are at a greater distance from the implant. However, a study evaluating electrode position (Eitutis et al., 2022) recorded from the contralateral side of the head and forehead found AEVs were similar for different electrodes for normally functioning devices on the contralateral side. In contrast, recordings from pediatric cases showed a drop in amplitude at the basal end of the array when one of the recording electrodes was positioned on the ipsilateral side of the head.
Our previous study (Grasmeder et al., 2021) identified differences in EVs between fully inserted and partially inserted electrode arrays and for different recording electrode positions. This finding is consistent with the observation that EVs are non-uniform across the array even for normally functioning devices when one of the recording electrodes is positioned on the ipsilateral side to the implant (Eitutis et al., 2022). We found that these differences can be larger in electrode arrays which are not fully inserted or where basal electrodes have been deactivated.
There can also be differences in EV amplitudes for children of different ages (Garnham et al., 2001; Monin et al., 2006), whilst adults with fully inserted devices showed much less variability for the same stimulation mode (Grasmeder et al., 2021). If performance has deteriorated to the point where replacement of the device is deemed appropriate, there is a further opportunity to test the device once it has been explanted and returned to the manufacturer for analysis; it undergoes a series of tests to determine if it is faulty for regulatory purposes. The assessment includes a dry electrode impedance test, which is sensitive to partial short circuits. If an Ultra V1 device has been affected by moisture ingress, one or more electrodes will have a lower impedance than the expected value of approximately 66–68 kOhms. This test is likely to be more sensitive to moisture ingress than the algorithm associated with the manufacturer's EFI test and should be considered as the “gold standard” test of this issue, as it is a direct measure of impedance. However, this has the disadvantage that it can never be performed when the device is in use, meaning there is a need for a reliable easily deployed and well tolerated test in clinic.
In this study, we compare EFI and EV recordings in recipients of Advanced Bionics Ultra V1 devices; we assess the possibility that EV recordings could be analyzed objectively to identify electrode faults in these devices. In our clinic we had measured EVs in three montages and analyzed the recordings subjectively. Our intention was to identify electrode faults in patients of all ages, regardless of electrode position, based on the premise that electrode faults would be present in all montages tested. In some cases, repeated measurements were performed at successive clinic appointments enabling the evolution of a device issue to be tracked over time. We also report on the proportion of devices affected and the number of patients who had re-implantation.
2 Materials and methods
2.1 Ethical review
Ethical approval was granted by the University of Southampton Ethics and Research Governance system (study numbers 73887, 79665) and by the NHS ethics system (312360). Conduct of the study complied with the ethical approval.
2.2 Methods
CI recipients under the care of the University of Southampton Auditory Implant Service received 83 Ultra V1 devices between August 2017 and February 2020. Following the device recall, recipients of these devices were informed of the issue. Pediatric CI users were invited to attend the clinic for assessment of their hearing and their CI devices routinely. Adults CI users were invited to attend for assessment of their device if a change in their hearing with their implant was reported or observed in routine tuning/hearing review appointments, or if a problem was suspected from previous impedance telemetry measurements. If a problem was identified, routine device assessments were performed regularly until a decision was made to explant the device. After 3 or 4 years of device use, adults whose devices had not yet been tested were invited to the clinic for this purpose, even if no problems were suspected.
Impedance telemetry was performed using the manufacturer's programming software (Soundwave or CI target). The manufacturer's EFI test was performed via the AIM tablet and analyzed using the AB EFI analysis tool version 2.5.
Recordings of EV (REVs test) were made using the EMS Surpass system. This has a very high maximum sampling rate, 400 kHz, enabling even individual CI pulses to be captured in detail. CI stimulation was as in the previous study (Grasmeder et al., 2021): CIs were stimulated in live mode from the Soundwave software. A level of 79 charge units was used for both threshold (T) and most comfortable (M) levels, for all electrodes except E8, which was stimulated at 120 units to provide a “marker electrode” that allowed identification of electrode number in the resulting traces. Electrodes which would otherwise be deactivated in an individual's map were activated for the test. The implant was stimulated using an Advanced Bionics Q90 or Q70 processor and the HiRes-S strategy, with the pulse width set to manual, 100 μs. This gives a continuous train of biphasic pulses, with the electrodes being stimulated in numerical order from apex to base.
In the Surpass system, the highpass and lowpass filters were set to 200 Hz and 100 kHz, respectively, after confirmation that these settings captured all the signal from an implant-in-a-box without aliasing. A 1-channel snapshot recording was performed with a full-scale deflection of ± 4 mV, sampling rate 400 kHz, window length 10 ms. This captured three stimulation cycles of the implant. A further one second of raw data was captured, in case of any concerns of intermittency (although this is not a feature of the Ultra V1 issue). These recordings were made at least three times each for three montages for tests from November 2020 onwards, or for the two montages relating to the ipsilateral earlobe for the earliest tests. The test setup is shown in Figure 2.
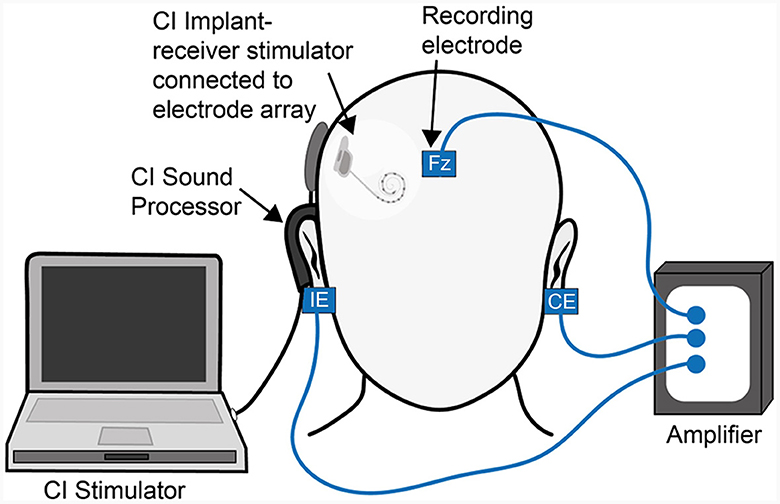
Figure 2. Test overview illustrating the recording electrode positions: “IE” represents the ipsilateral earlobe, “CE” the contralateral earlobe, “Fz” the high forehead. In montage “IE/Fz” the electrodes on the IE and high forehead are used as the active and reference recording electrodes, respectively, whilst the electrode on the CE is used as the ground. The electrode connections are swapped at the amplifier end to create the “IE/CE” and “CE/Fz” montage recordings, with the remaining recording electrode used as the ground.
Recordings typically take <5 min per ear, and a further 5–10 min should be allowed for preparing the skin and attaching single-use electrodes (either 15 x 20 mm, 20 x 22 mm, or circular with 24 mm diameter, with either disposable or reusable leads). Only very limited skin preparation was undertaken; in children the skin was usually wiped using a single use alcohol wipe; in adults an abrasive skin preparation gel was also used to remove make-up and any surface debris but there was no expectation of low contact impedances, which can be difficult to achieve on the earlobes.
Immediately after being made, recordings were examined to see if there was noticeable baseline drift or unexpected noise in the trace, which would make the trace difficult to interpret. If so, a further recording was made. Occasionally individual electrodes were difficult to identify in a particular montage and the remaining two montages were used instead. In young children, EV amplitudes measured using a snapshot recording are typically large enough for easy interpretation when the CE/Fz montage is used. By contrast, they may be more difficult to interpret in other montages: often small with an increase at the basal end in the IE/Fz montage and larger with a decrease in amplitude at the basal end in the IE/CE montage. In adults, amplitudes can be too small for subjective interpretation in the CE/Fz montage but are generally larger in the IE/CE and IE/Fz montages, where differences of amplitude between electrodes are obvious to the naked eye. However, there is normally a reduction in amplitude at the basal end in the IE/Fz and IE/CE montages, so care is required in interpreting the traces.
A modest, smooth change in amplitude across the array is expected for normally functioning, fully inserted devices when a recording electrode is placed on the IE (Grasmeder et al., 2021). This means that determining a fault from a 20% reduction in amplitude relative to the electrode with the highest amplitude (Eitutis et al., 2022), is likely to be inappropriate for the IE/Fz and IE/CE montages. The previous suggestion (Mens et al., 1994), derived from measurements in Nucleus devices, of a 20% drop in EV amplitude relative to the average amplitude of the adjacent electrodes may be a more suitable criterion to use. However, that is not possible for electrodes at either end of the array or appropriate when a group of adjacent electrodes are faulty. For our clinical test, we assumed that peak-to-peak EVs change smoothly across the array in normally functioning devices; faulty electrodes are indicated by a non-smooth trace, corresponding to a drop in amplitude on one or more electrodes. We also assumed that the Ultra V1 issue would result in non-smooth traces in all recording montages, as the issue would be present each time the CI was stimulated.
For the purpose of this investigation, individual EV peaks were labeled, and amplitudes were measured, so that the extent of the drops in amplitude associated with the fault could be assessed. The EV for electrode 8, the marker electrode, was multiplied by 0.658 to compensate for the higher stimulation level (120 Vs. 79 units). Further information was gathered from CI recipients' individual files: date of birth, age at implant, implant type, date of implant, full or partial insertion, anatomy of the cochlea, and any electrodes which were found to be faulty on analysis by the manufacturer following explanation.
3 Results
3.1 Statistical analysis
Statistical analysis was performed in SPSS version 26; parametric tests were used for variables which were normally distributed, or non-parametric tests for those which were not.
Boxplots show the interquartile range for the variable, with the median within the box; the whisker shows the range of data, unless outliers were present, which are shown separately; outliers marked with an open circle fall more than 1.5 box lengths from the lower or upper edge of the box; outliers marked with an asterisk fall more than 3 box lengths from its lower or upper edge.
3.2 Participants
By March 2023, recipients of seven devices were no longer registered with the service; 76 of the original 83 devices were therefore investigated. Twenty five devices had been explanted due to device issues, one had been explanted for medical reasons and 50 devices remained in situ.
REVs testing had been performed for 68 of the 76 devices that continued to be supported by the service, including the 25 which were subsequently explanted and replaced with a different device. Of these, 59 were Ultra V1 devices and nine were Ultra V1 3D devices; all had mid scala electrode arrays except for one device received by an adult, which had a Slim J electrode array. All devices had been fully inserted except one received by a child, which had three extra-cochlear electrodes. This device was included in the analysis but is discussed separately below. The anatomy of the cochlea was recorded as normal on the pre-operative CT and/or MRI scan report in all cases.
Forty eight of the devices tested were implanted in adults, mean age 63.6 years, range 24.2–87.0 years, and 20 in children, mean age 4.0 years, range 1.1–9.3 years. Thirty seven devices had been tested at least twice, 17 in children and 20 in adults. Each test included recordings in the IE/Fz and IE/CE montages, but twelve tests had not included the CE/Fz montage, which was introduced after the other two montages, and for two devices the traces were too small to mark confidently in the CE/Fz montage.
EFI tests were conducted during the same appointment as REVs tests, once this became available to the service in November 2020, except in one case in which it was missed. For three devices, an EFI test result was not available for the most recent test and for five devices this was not available for the earlier test. For tests conducted before November 2020, if a manufacturer's integrity test had been performed, the EFI result was taken from the integrity test report, which applied to seven earlier tests and two later tests.
3.3 Impedance telemetry
Of the 68 devices tested, impedance telemetry data was available for 67 devices; in one case, telemetry data had been deleted for the explanted Ultra V1 device following surgery for re-implantation. Thirty seven of the 67 devices (55%) had normal impedance telemetry at each clinic visit. For 22 devices (33%) an open circuit was recorded on impedance telemetry the first time the check was performed at device activation, but this resolved upon conditioning the device (Zarandy et al., 2009). Five devices (7%) had persistent open circuits from the time of device activation. Four devices (6%) gave short circuit readings for one or more electrodes, with the first observation of this made 2 or 3 years following activation.
3.4 Trace morphology
The AB Ultra V1 device produces charge-balanced biphasic pulses. Example traces are shown in Figure 3.
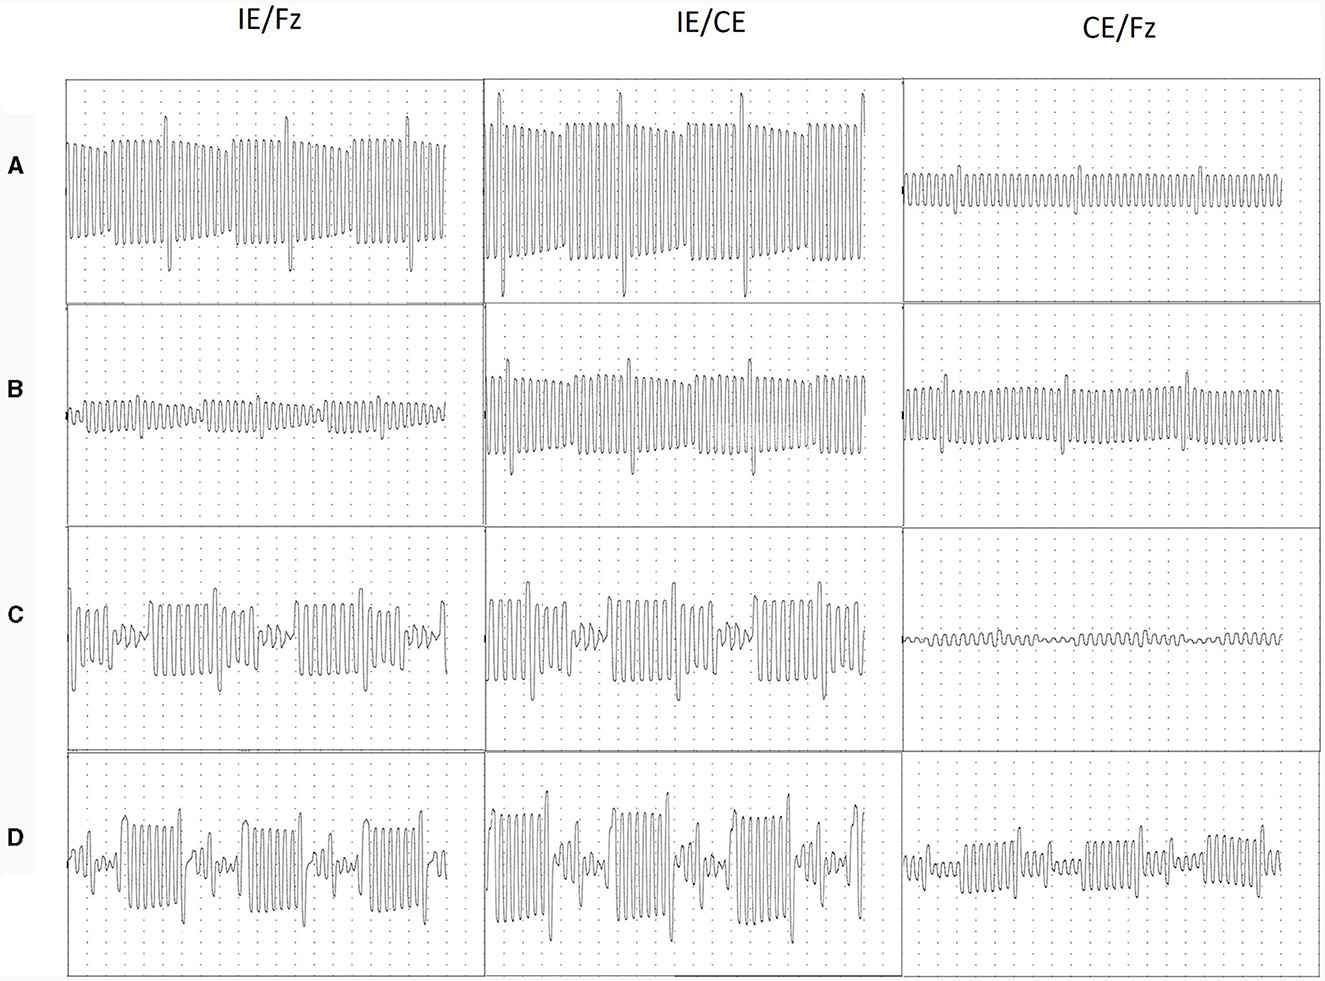
Figure 3. Traces recorded in a 10 msec time window, corresponding to three cycles of CI stimulation. Normally functioning devices (A) older adult; (B) child aged 7; Abnormally functioning devices (C) older adult; (D) child aged 4. Electrodes were stimulated sequentially starting from E1 and were identified using E8 as a marker electrode. E8 was stimulated at 120 units, compared to 79 units for the remaining electrodes. For all traces, each division shown on the image represents 250 μs on the time, x-axis; for adults each division represents 100 μV on the y-axis and for children each division represents 50 μV on the y-axis.
Voltages recorded for each cycle were highly repeatable, as shown in Figure 3. However, in some cases where electrode function was abnormal, peaks were difficult to separate, especially in the IE/Fz montage. In these cases, the morphology of the traces in different montages were compared and the most likely peak or inflection in the trace was assigned to each electrode. EV amplitudes for normally functioning devices were consistent in the CE/Fz montage, with the exception of the marker electrode; in the IE/Fz and IE/CE montages, amplitudes varied for normally functioning devices but in a gradual manner across the array. For faulty devices, EV amplitudes were unpredictable with abrupt changes between electrodes.
3.5 Voltage amplitudes
Mean peak-to-peak amplitudes across the electrode array were compared across montages and between adults and children, as shown in Figure 4.
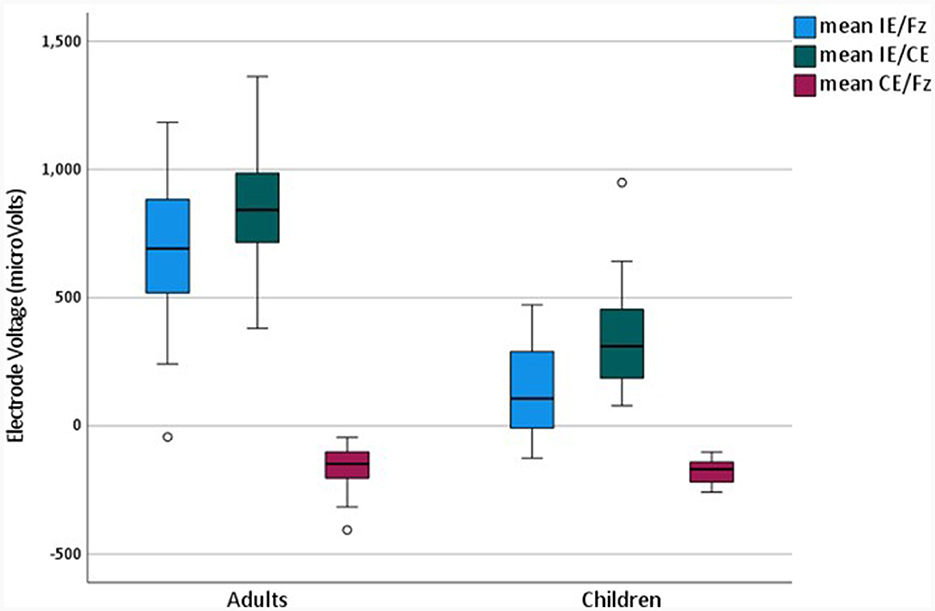
Figure 4. Mean Electrode Voltages for adults and children in different montages for the later completed test.
Repeated measures analysis of variance was performed to compare mean voltages for different montages, which were averaged across all electrodes for 43 devices in adults and 19 in children. A main effect of montage [F(1.21, 72.4) = 421.3, p < 0.001], and an interaction between montage and age were observed [F(1.21, 72.4) = 56.4, p < 0.001], with the Greenhouse-Geisser correction for sphericity applied. Bonferroni-corrected pairwise comparisons were significant for all possible montage comparisons [p < 0.001]. EV Amplitudes were largest in the IE/CE montage, smaller in the IE/Fz montage and smallest in the CE/Fz montage for both adults and children. Amplitudes for the IE/CE and IE/Fz montages were larger for adults than for children but were not significantly different between adults and children for the CE/Fz montage {independent samples t-test: IE/Fz [t(51.9) = 10.0, p < 0.001], IE/CE [t(41.8) = 8.27, p < 0.001], independent samples Mann-Whitney U Test: CE/Fz: [z = 1.67, p > 0.05]}.
Voltages were compared for individual electrodes for the later completed tests as shown in Figure 5.
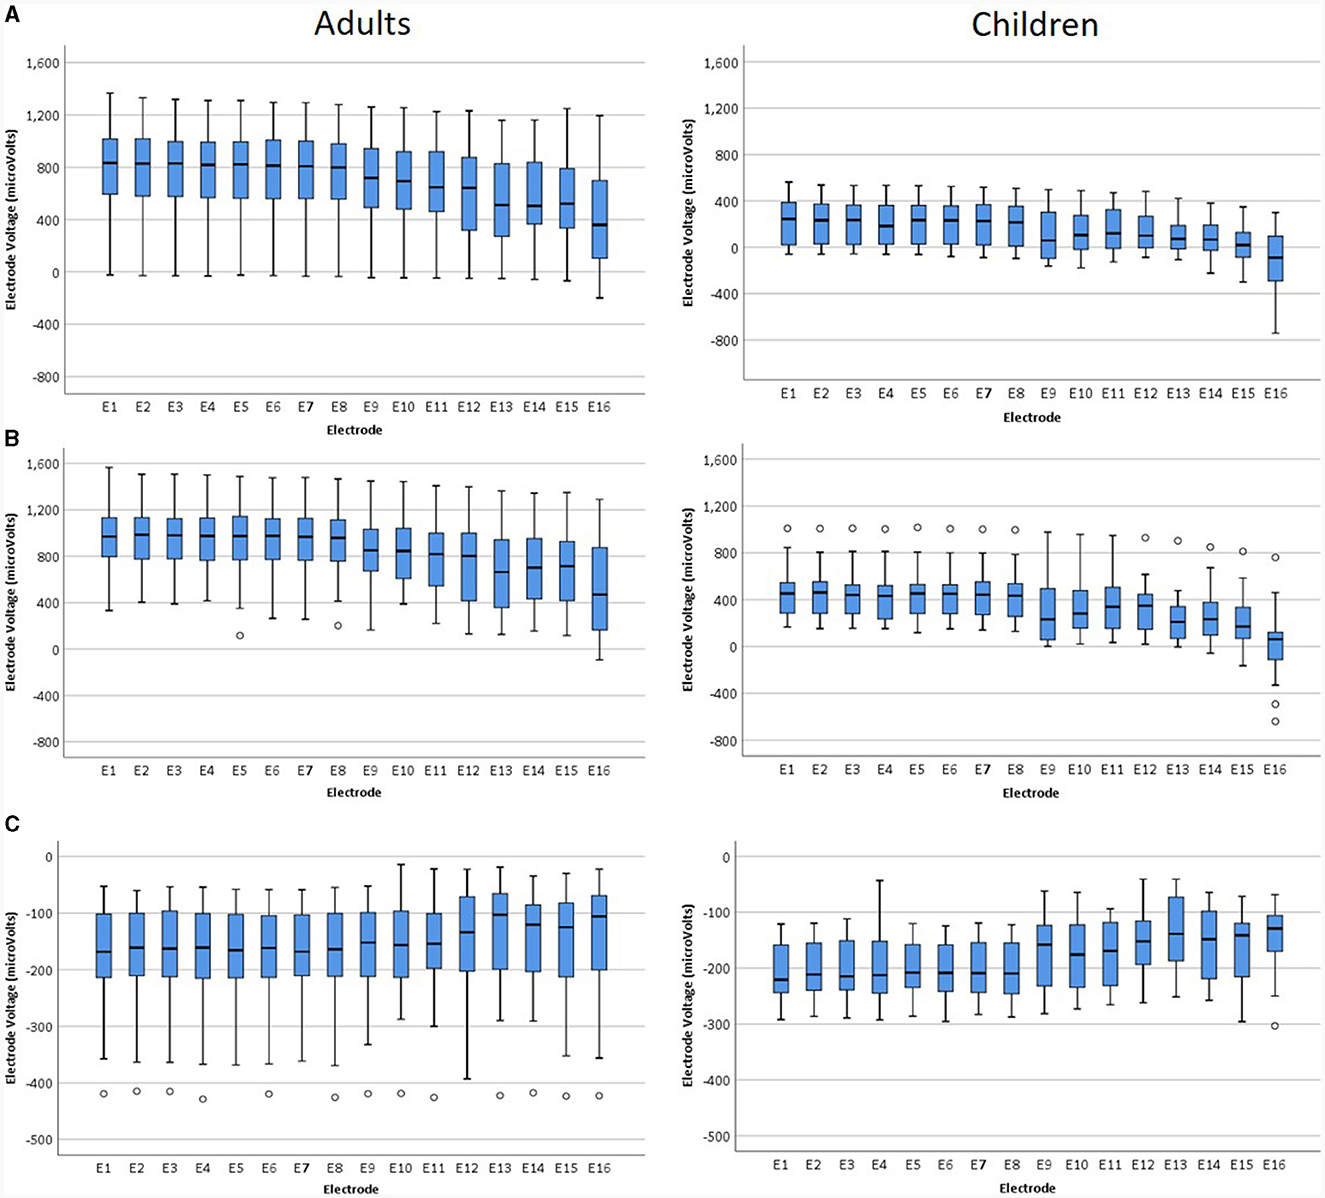
Figure 5. Voltages for individual electrodes for adults and children: (A) IE/Fz montage, (B) IE/CE montage, (C) CE/Fz montage for later tests.
The Friedman test was performed for each montage for adults and children separately, to compare amplitudes for individual electrodes, giving a highly statistically significant result for each montage for both adults and children. Children: IE/Fz [X2 (15) = 236.1, p < 0.001], IE/CE [X2 (15) = 246.1, p < 0.001], CE/Fz [X2 (15) = 94.4, p < 0.001], adults: IE/Fz [X2 (15) = 546.4, p < 0.001], IE/CE [X2 (15) = 531.7, p < 0.001], CE/Fz [X2 (15) = 69.4, p < 0.001]. Bonferroni corrections were not applied as the probability was returned as 0.000 in SPSS in each case. For adults, median EV amplitudes were positive for all electrodes for the IE/Fz and IE/CE montages and negative for all electrodes for the CE/Fz montage, due to the first phase being positive for the IE/Fz and IE/CE montages but negative for the CE/Fz montage. The magnitude of EVs were larger for apical electrodes than for basal electrodes in all montages, with electrode 1 having the largest magnitude for the IE/Fz and CE/Fz montages, electrode 2 having the largest magnitude for the IE/CE montage and electrode 16 the smallest magnitude in all montages. For children, median EV amplitudes were positive for all electrodes for the IE/CE montage, negative for all electrodes for the CE/Fz montage and started positive at the apical end but dropped below zero at the basal end in the IE/Fz montage. The magnitude of the median EV was largest for electrode 1 in the IE/Fz and CE/Fz montages and for electrode 2 in the IE/CE montage. The magnitude of the median EV was smallest for electrode 15 in the IE/Fz montage and electrode 16 in the IE/CE and CE/Fz montages.
Relative EV amplitudes were calculated for the IE/CE montage, in which amplitudes were largest. The relEV amplitude was defined as the peak-to-peak amplitude for each electrode relative to the maximum peak-to-peak amplitude for an individual electrode for that montage for each participant. This was investigated for the earlier tests. The results are shown in Figure 6, grouped according to each device's result on the manufacturer's EFI test and REVs test result. Those in the “normal” group had a normal EFI test result and the REVs test was normal based on the criteria suggested by Mens et al. (1994) and Eitutis et al. (2022). Those in the “abnormal” group had abnormal EFI and the REVs test result was abnormal on one or both criteria; those in the “inconclusive” group had normal EFI but were abnormal on one or both of the REVs test criteria.
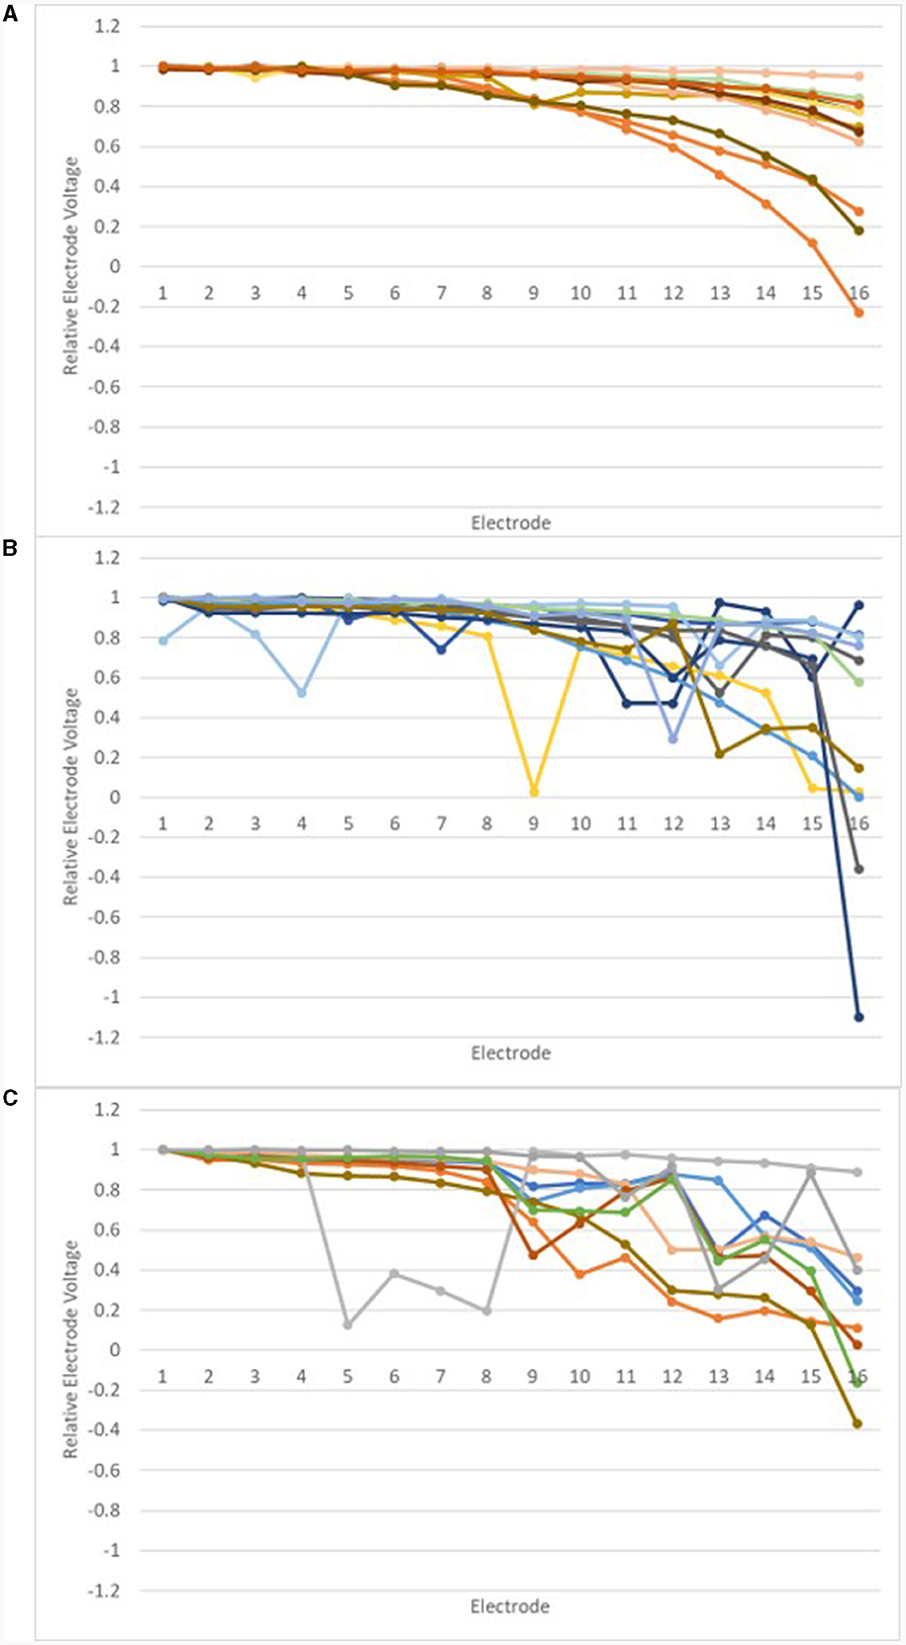
Figure 6. Relative EVs in the IE/CE montage for earlier tests: normal group (A), inconclusive group (B) and abnormal group (C).
Relative EV amplitudes changed gradually across the array for those in the normal group; abrupt changes of amplitude were observed for devices in the abnormal group and most devices in the inconclusive group.
3.6 Trace repeatability and changes in electrode voltage over time
Trace repeatability was assessed by comparing EVs recorded in repeated tests for devices in the normal group; changes in EVs were found for devices in the inconclusive and abnormal groups, which had been tested twice. relEVs are shown in Figure 7 for six devices which were in the normal group on both occasions and for devices tested twice, which were in the inconclusive and abnormal groups at the earlier test.
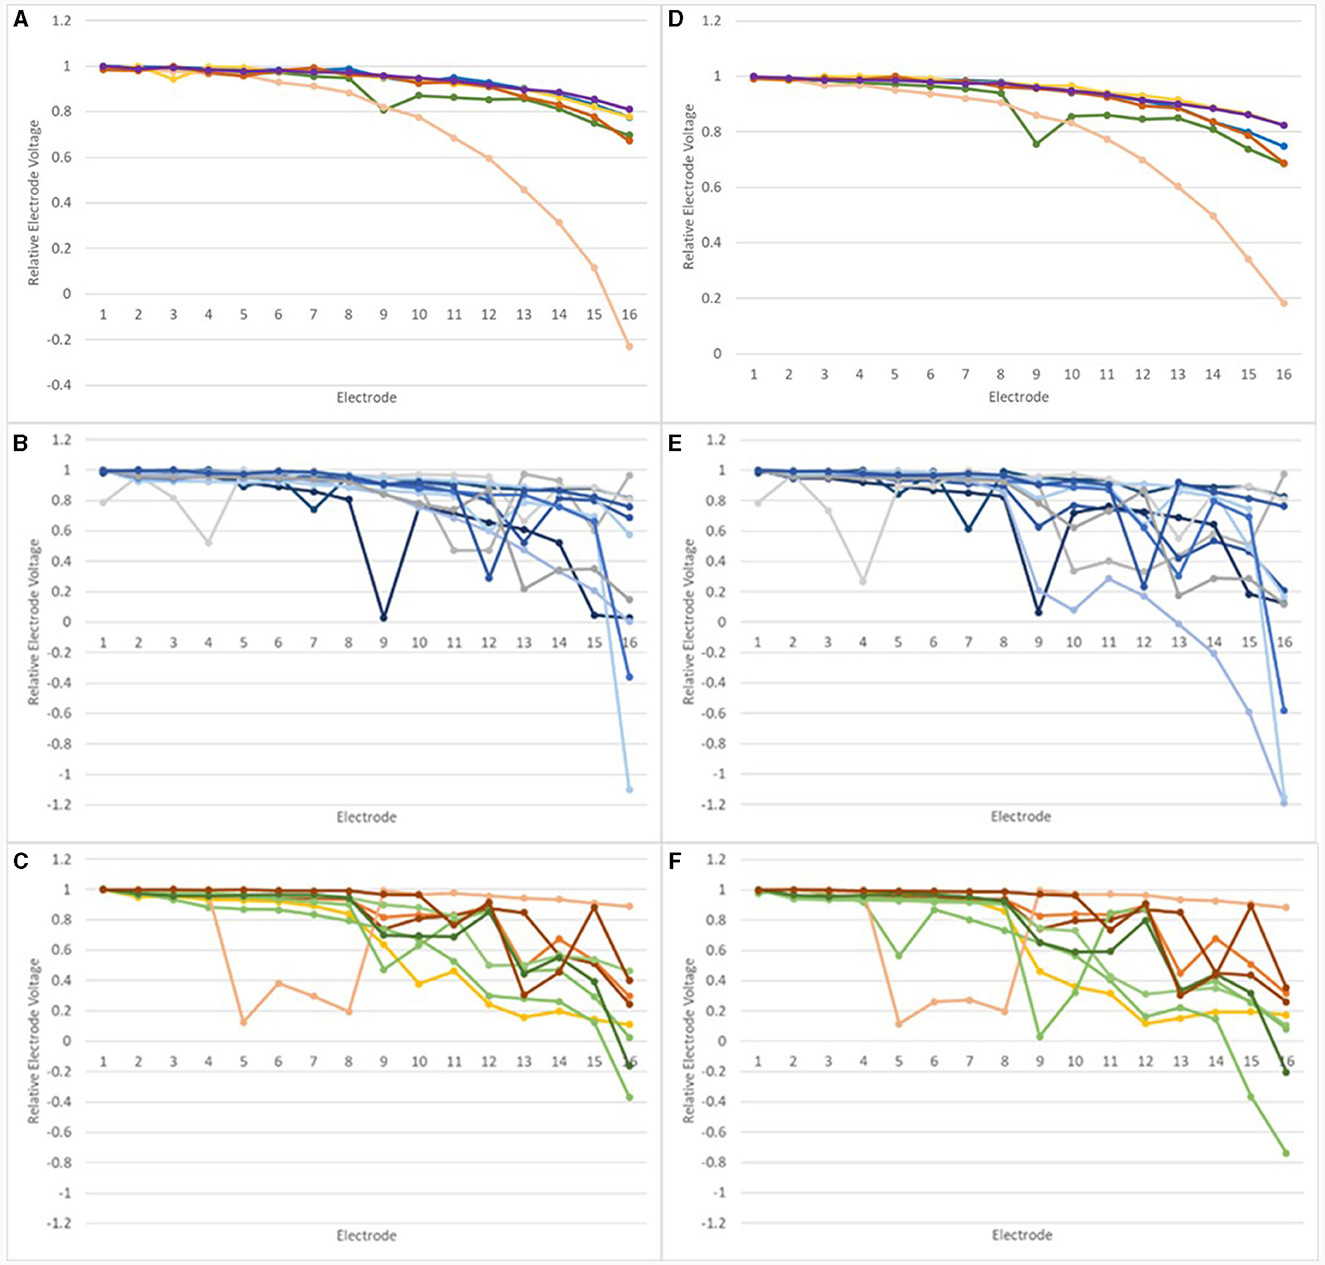
Figure 7. Relative Electrode Voltages in the IE/CE montage for devices tested at least twice: (A) normal devices, earlier test; (B) inconclusive devices, earlier test; (C) abnormal devices, earlier test; (D) normal devices, later test; (E) inconclusive devices, later test, (F) abnormal devices, later test.
A non-parametric correlation, Spearman's rho, was performed for relEVs for each normal device to compare the earlier and later tests. Correlations (2-tailed) were significant for all devices, with Spearman's rho values of 0.987, 0.918, 0.997, 0.859, 0.872, and 0.988, respectively, p < 0.001 in each case, showing excellent repeatability.
The mean number of tests per device was 2.1, range 1–6. The mean age of devices at the earlier test, for devices tested twice was 2.6 years, range 0.9–4.4 years; the mean age of devices at the later test was 3.5 years, range 1.2–5.2 years. The mean time between earlier and later tests was 1.1 years, range 0.2–2.6 years.
relEVs in the IE/CE montage are shown in Figure 8 for one adult's device which was tested five times prior to explantation. relEVs were similar for different electrodes at the earliest test but became gradually more different across the array, especially at the basal end, over time.
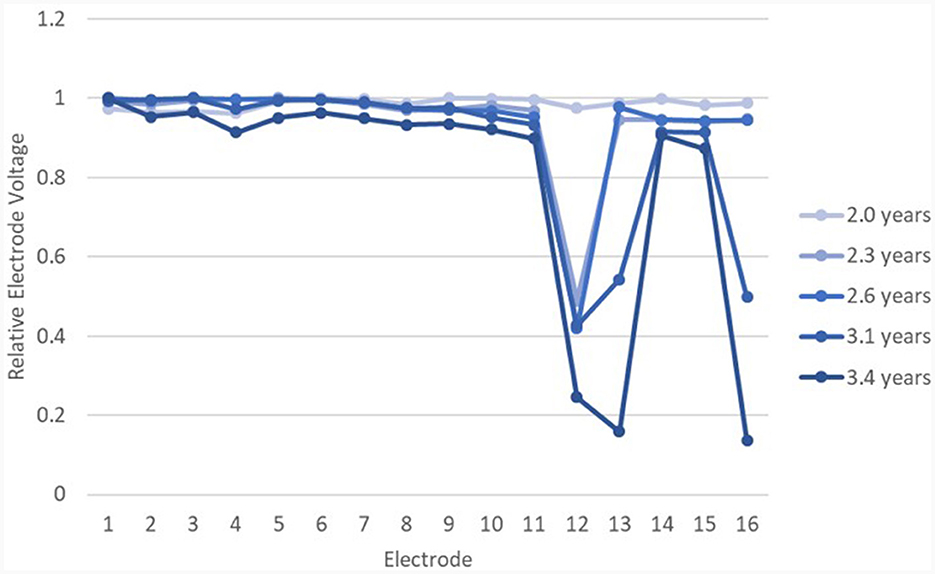
Figure 8. relEVs for device 26 over time in the IE/CE montage, beginning at 2 years post surgery. The EFI test was normal until the last test at 3.4 years post surgery.
3.7 Mathematical description of normal for relEVs
For all devices in the normal and abnormal groups at the earlier test, a third order polynomial function (cubic) was fitted to the IE/CE relEVs, as shown in Figure 9.
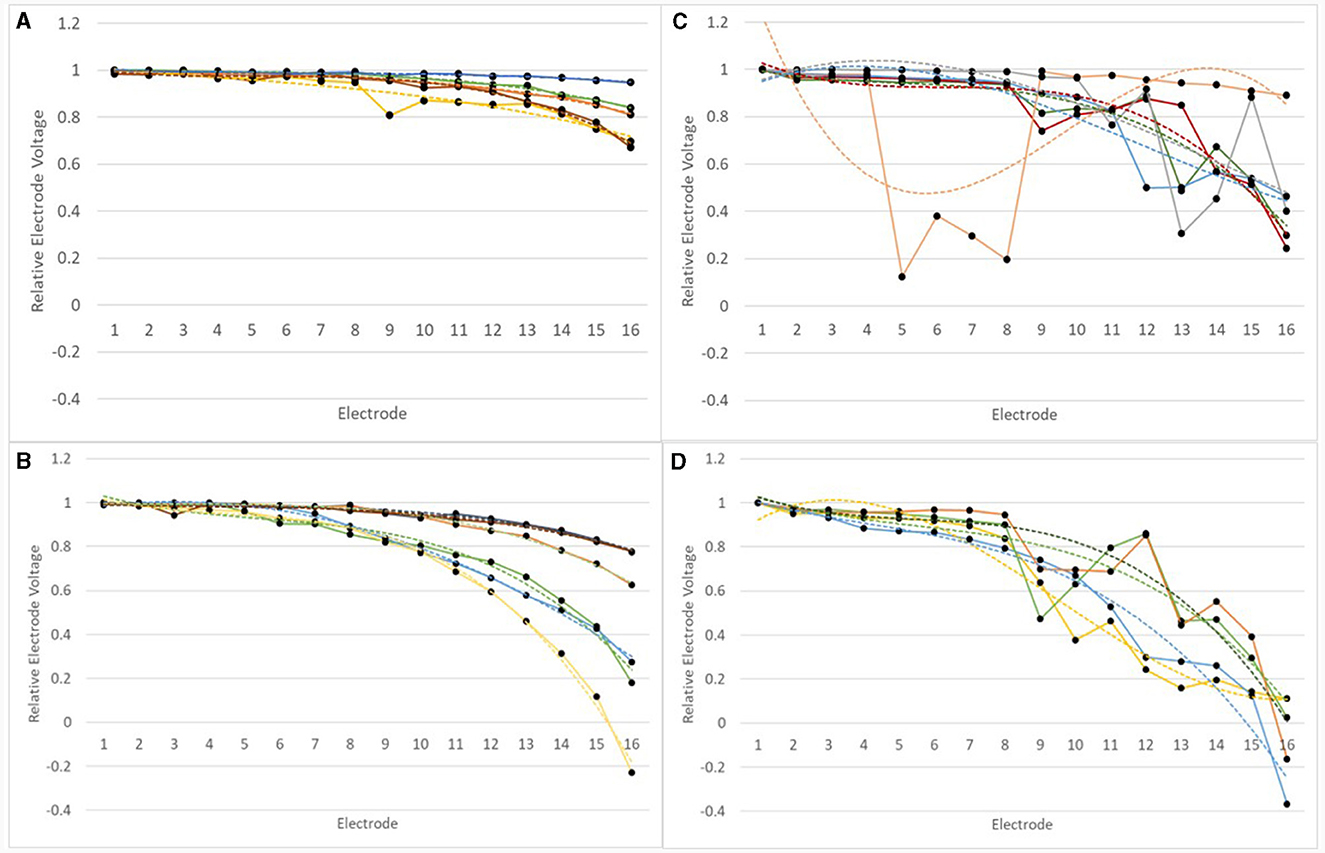
Figure 9. RelEVs in the IE/CE montage for devices which were normal or abnormal at earlier tests for adults and children. RelEVs are shown by a solid line with filled circles representing the voltage for individual electrodes. A third order polynomial function was fitted to the curve for each device and this is shown as a dotted line of the same color. (A) normal devices group, adults; (B) normal devices group, children; (C) abnormal devices group, adults; (D) abnormal devices group, children.
Goodness of fit, R2values, varied between 0.8907 and 0.9968 for normal devices. relEVs across the array varied for some devices much more than others. For children (N = 6), the range of relative EV drop from E1 to E16 was 0.21–1.23, mean drop = 0.59; for adults (N = 5) the range of relative EV drop from E1 to E16 was 0.05–0.33, mean drop = 0.21. A drop of 5% represents a nearly flat profile across the array.
Goodness of fit, R2, values varied between 0.475 and 0.965 within the abnormal group. The magnitude of the deviation in relEV from the cubic function, |d_relEV|, was calculated for each electrode for the earlier tests. |d_relEV| is shown in Figure 10 for the normal group.
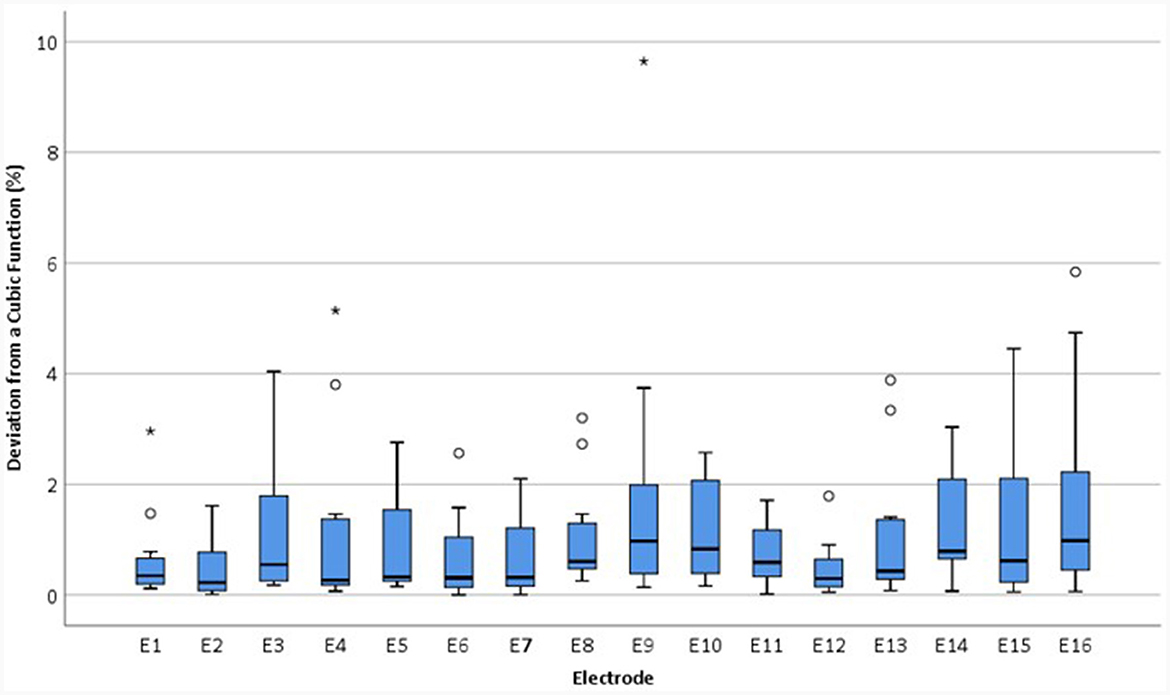
Figure 10. Boxplots showing the magnitude of the deviation in relEV from a cubic function for individual electrodes for each device, |d_relEV|, based on earlier tests in the IE/CE montage for the normal group.
|d_relEV| values for the abnormal and inconclusive groups are shown in Figure 11.
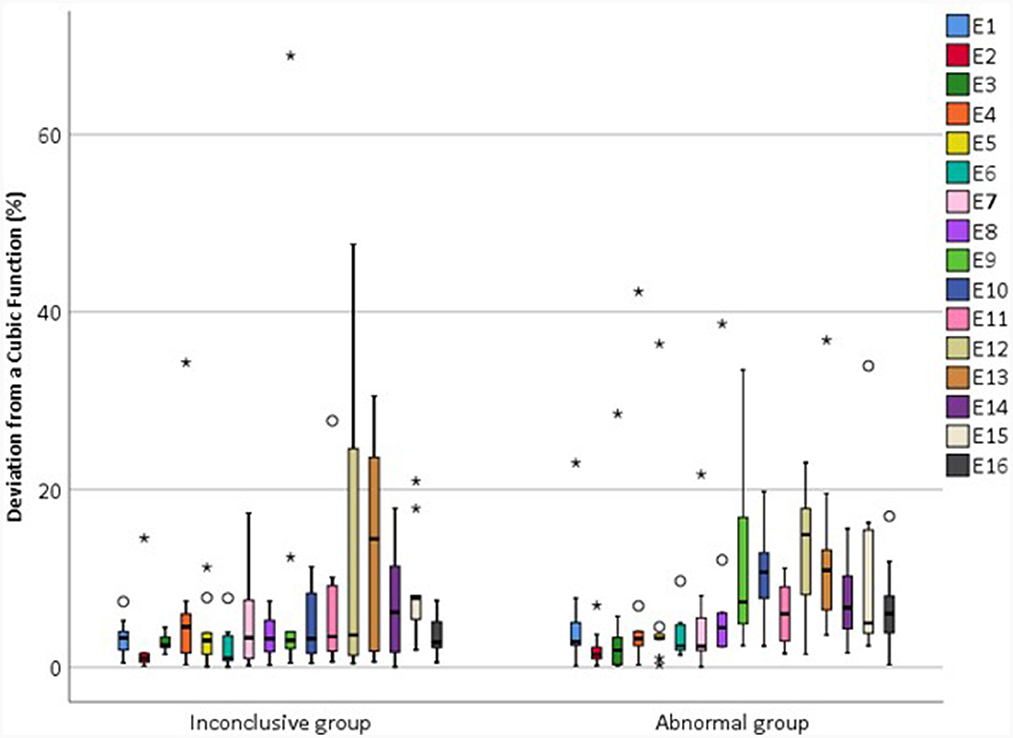
Figure 11. Magnitude of the deviation in relEV from a cubic function for individual electrodes for each device, |d_relEV|, based on earlier tests in the IE/CE montage for the inconclusive and abnormal groups.
The mean |d_relEV| for normal devices was 1.06%, standard deviation 1.30%; all electrodes had a deviation of <6% from the cubic function, except for one extreme outlier of 9.6%. For abnormal devices, the mean of |d_relEV| rose to 7.75%, with a maximum of 42.3%; for inconclusive devices, the mean was 6.18%, with a maximum of 68.9%.
In order to compare |d_relEV| for the different groups, the maximum |d_relEV| was found for each device at the earlier test. Results are shown in Figure 12.
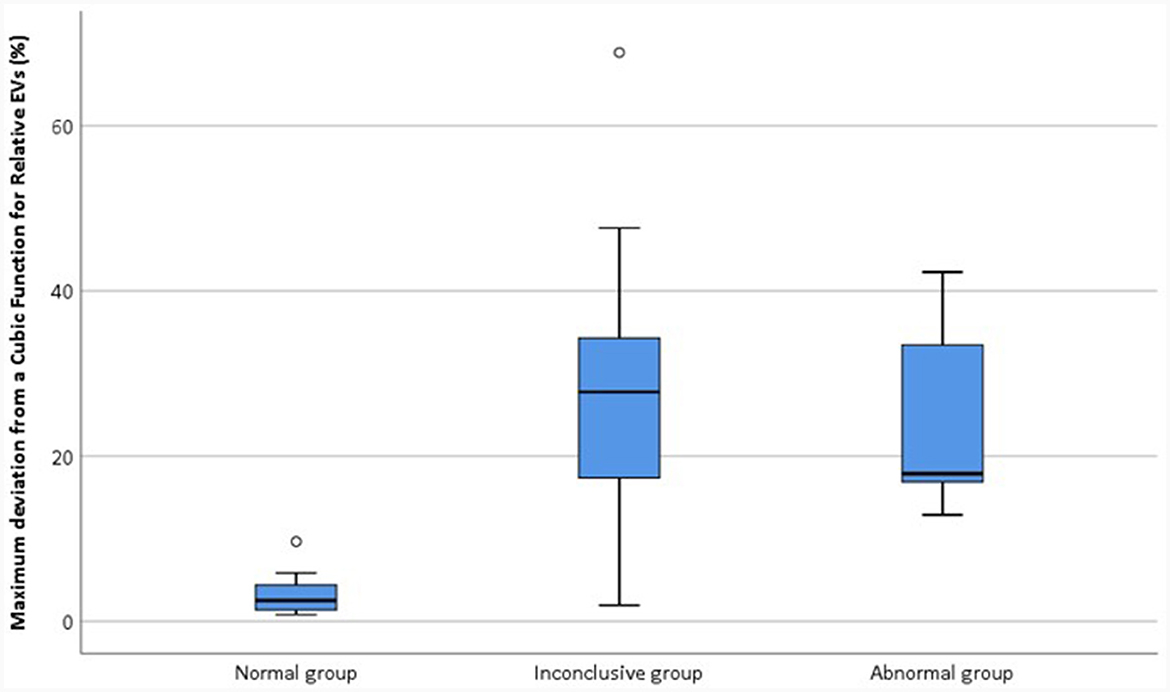
Figure 12. Boxplots showing the maximum |d_relEV| for each device by group, for earlier tests.
The Kruskal-Wallis test was performed to compare the maximum |d_relEV| for devices in different groups. A significant effect of group was found [H(2) = 16.7, p < 0.001]. Wilcoxon signed rank tests were used to compare the groups and it was found that the normal group had significantly different |d_relEV| when compared with both the inconclusive group [Z = −3.15, p < 0.01] and the abnormal group [Z = −3.76, p < 0.001]. However, there was no significant difference in the maximum |d_relEV| for devices in the inconclusive and abnormal groups [Z = −0.574, p > 0.05].
Within the inconclusive group, there was considerable variability in the goodness-of-fit to a cubic function. One device in this group had a maximum |d_relEV| of 1.9%, whilst the other devices had a maximum |d_relEV| of 7.9–68.9%. The device with |d_relEV| of 1.9% had an unusual profile, in that EVs had a rising profile in the CE/Fz montage and as such did not meet the criterion of Eitutis et al. (2022) for a normal device. However, as the IE/CE and CE/Fz profiles look very similar for this test but of opposite polarity, and the CE/Fz profile looks very different in a subsequent test, it is likely that a recording error in the CE/Fz montage was responsible for this occurrence and the trace that was labeled CE/Fz represents the CE/IE montage instead. This device would otherwise have been categorized as normal.
3.8 Derivation of a new criterion of device functionality
Devices with normal function, according to the previous criteria, had EVs which fit a cubic function very well. Those with abnormal function did not fit a cubic function well, whilst those in the inconclusive group were comparable to those in the abnormal group.
The results suggest that the maximum |d_relEV| could be used as a metric for determining whether a device is faulty or not. A new criterion for a faulty device was established from the results for devices which had been tested twice. Devices would be labeled “new normal” if all electrodes had relative EVs which deviated by <6% from a cubic function, or “new abnormal” if one or more electrode deviated by 6% or more.
This criterion was applied to 29 devices, which had only been tested once, and had a “later” test only. Ten of these were found to have maximum |d_relEV| of <6% and were therefore labeled “new normal.” All of these had normal EFI. Of the 19 devices which had deviation ≥6%, or “new abnormal,” 15 devices had abnormal EFI whilst four devices had normal EFI. Relative EVs in the IE/CE montage for the four devices labeled “new abnormal” but with normal EFI are shown in Figure 13.
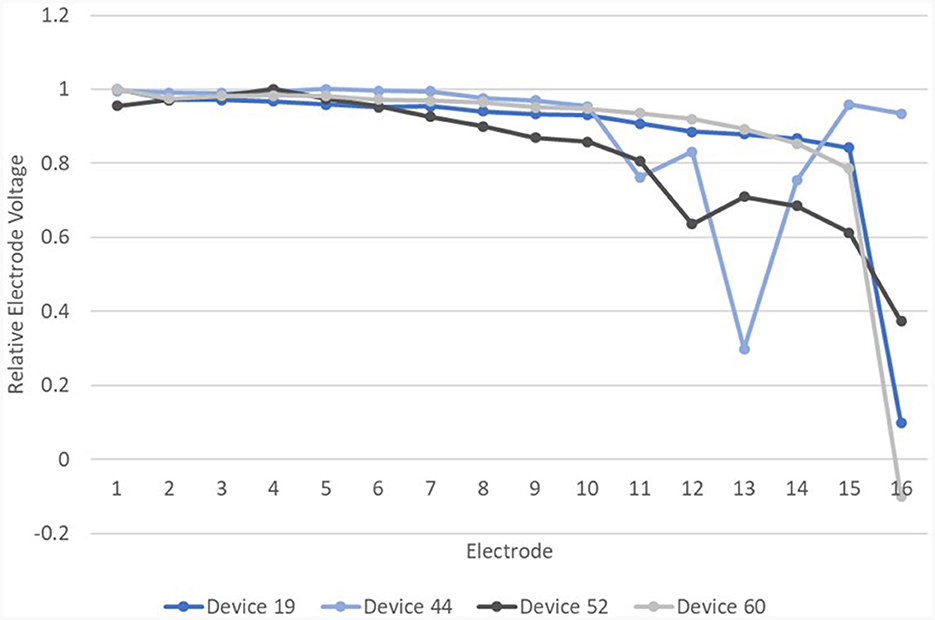
Figure 13. Relative EVs in the IE/CE montage for devices with normal EFI but one or more electrodes with deviation >6% from a cubic function.
Of these four devices, device 19, which showed an abrupt drop in |d_relEV| for electrode 16, had an open circuit on impedance telemetry on electrode 16 at the time of testing. Device 52 was subsequently explanted and device analysis following explantation revealed corrosion of electrode 12, which also showed a drop in |d_relEV|. Device 44 has been tested subsequently and found to have abnormal EFI. Device 60 has shown the same result on retesting. Three of these four devices therefore have other independent evidence of electrode faults.
Further evidence of abnormal device function was found in device analysis reports for the other explanted devices. All 26 device analysis reports confirmed a fault, including for the device which was explanted for medical reasons (discomfort from the implant site).
For the 13 devices which had been tested twice and were found to be in the “new abnormal” group but with normal EFI, three of these devices were subsequently explanted. The explanted device analysis reports confirmed these devices were affected by the V1 issue. Two of the other devices had independent evidence of persistent faulty electrodes on impedance telemetry: both had short circuits. Another device has been tested again and found to have abnormal EFI. The remaining devices will undergo further follow-up.
To establish the likely number of faulty devices as of March 2023, the maximum |d_relEV| was found for all “later tests” where an EFI test had also been performed. Fifteen devices were normal according to the new criterion (23%), whilst 50 devices were abnormal (77%). All devices in the new normal group had normal EFI; 33 devices in the new abnormal group had abnormal EFI (66%) whilst 17 (34%) had normal EFI, suggesting a sensitivity of 66% for the manufacturer's EFI test. All devices with abnormal EFI also had abnormal REVs, suggesting a specificity of 100% for the REVs test. relEVs for the new normal and new abnormal devices are shown in Figure 14.
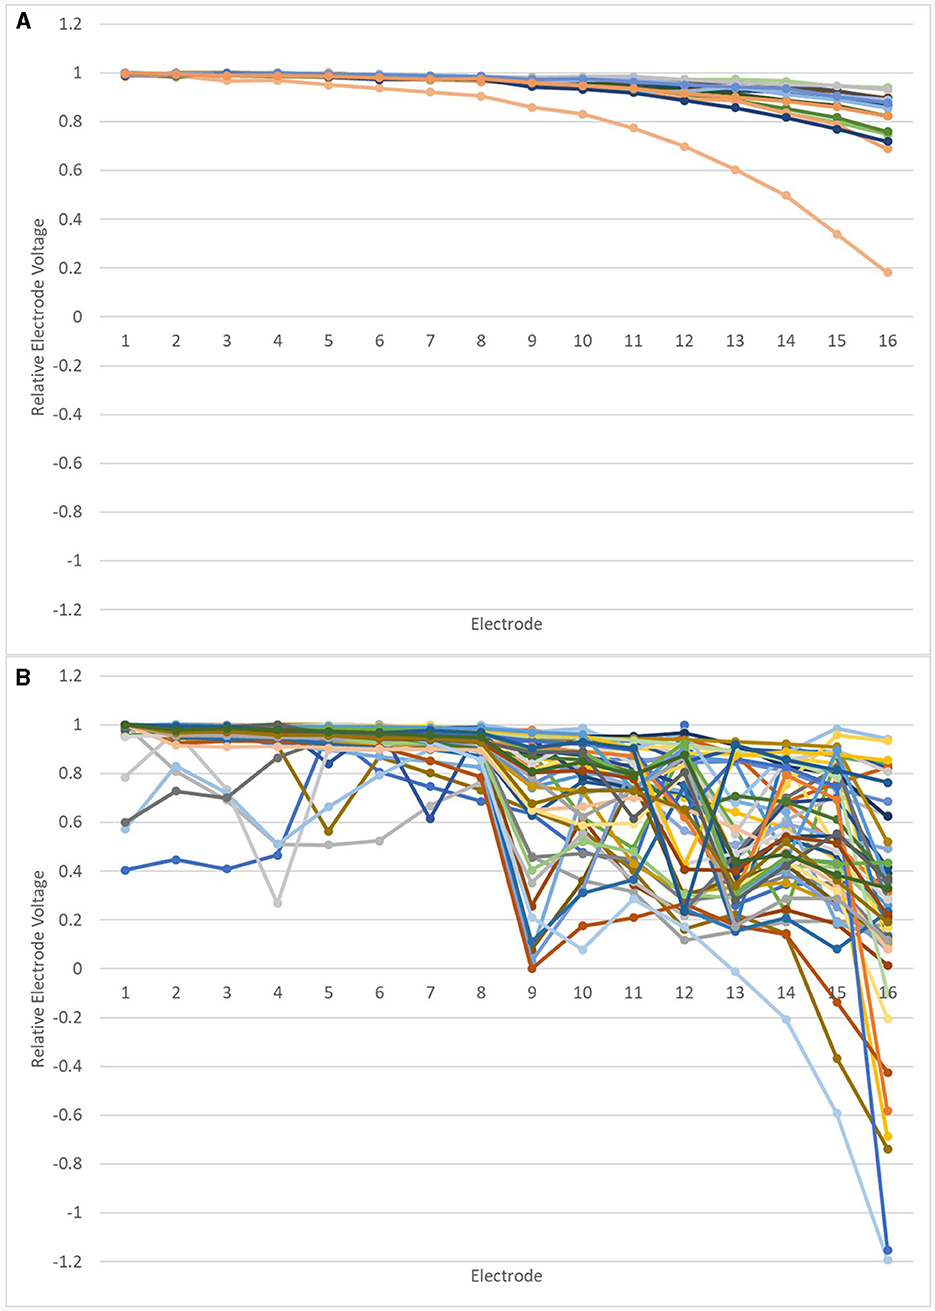
Figure 14. relEVs for “new normal” and “new abnormal” devices at later tests.
4 Discussion
A major challenge for cochlear implant clinical centers is in maintaining and managing the growing number of CI devices as they age. If integrity testing is to be widely conducted by CI clinics in the future, there will be a need for both good quality recordings of EVs and/or EFI and objective or preferably automated interpretation of the recordings, which will need to be sufficiently sensitive to device issues. This study identifies a way to do this by measuring EVs with recording electrodes on the earlobes and comparing results to a cubic function fit to the relative EVs obtained. Normal Ultra V1 devices are well-fit to a cubic function whilst faulty devices are not. This method will also identify the faulty electrodes by progressively removing electrodes that fall below the polynomial function until a good fit is obtained. The extent to which this is possible will depend on the extent of the problem, as it will not be possible to fit an appropriate cubic function to a device which has many faulty electrodes, whereas the appropriate cubic function can be identified from the fifteen normal electrodes in cases where just a single electrode is faulty.
This method of recording EVs is quick and accurate and only requires the CI recipient to have three recording electrodes attached to their head for a short time, whilst hearing quiet background noise through their CI. As such, it is suitable for CI recipients of all ages, including those with complex needs. The opportunity to view the traces also facilitates feedback of the result to the recipient and, where necessary, counseling related to the issue. However, more work is needed before this finding can be widely used in a clinical setting. The study cohort was limited to 65 devices, tested on both REVs and EFI. It did not include any patients identified to have abnormal anatomy and there was only one confirmed case, a child, of a partial insertion. The partially inserted device had 13 intra-cochlear electrodes out of 16; it fell into the new abnormal group on both occasions and had abnormal EFI both times. The fault was identified from the IE/CE montage recordings but is more evident (Figure 15) in the CE/Fz montage. Further testing, such as an additional montage, may prove helpful to separate device and electrode position issues in some cases of partial insertion. The lack of relEVs measures from people with known abnormal cochlear anatomy mean it is still unknown whether the data will fit a cubic function for them. Until such a time as the test is fully validated, caution is required in interpretation of REVs test results. In cases where the REVs test is abnormal but the EFI test is normal, it would be appropriate to discuss findings with the manufacturer. Continued monitoring of the device combined with retuning may be the most appropriate management choice. There is a need to consider whether replacement of the device is likely to result in improved performance, especially for devices which are only mildly affected by the issue.
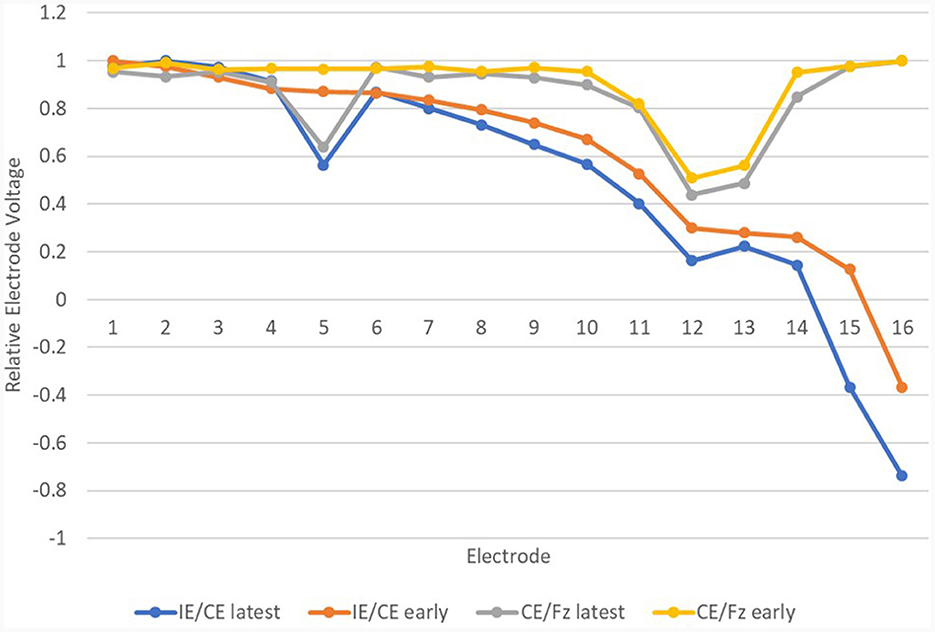
Figure 15. relEVs in the IE/CE and CE/Fz montage for the device with extra-cochlear electrodes.
EVs measured using monopolar modes have much larger amplitudes than those measured from intra-cochlear modes (Grasmeder et al., 2021), which implies that the CI reference electrode (here the CI case electrode) dominates the voltages recorded. In adults, the recording electrodes are further from the CI case electrode than in children, especially for the forehead and contralateral earlobe electrodes. The distance of the recording electrodes from the CI electrodes affects the amplitudes recorded, and so traces look different for children and adults. If the raw data is examined for children in the IE/Fz montage, there are instances where the traces are distorted, such as in Figure 3D. This is less obvious in the IE/CE montage and not at all obvious in the CE/Fz montage. The implication is that this distortion is associated with the electrodes on the array and can be observed if these electrodes have sufficient influence on the EVs recorded and are not swamped by the influence of the CI case electrode, which is only just under the skin. It may be that there are further abnormalities present in these devices, beyond those that are found by measuring EVs in the IE/CE montage. Ideally, REVs testing would be performed not just for monopolar stimulation, but also for intra-cochlear modes such as common ground and/or bipolar, in order to identify electrode faults that affect the electrodes on the array only and do not involve the CI reference electrode(s).
In summary, a new criterion for identifying faulty AB Ultra V1 devices has been described in this study, based on EVs recordings in the IE/CE montage. Cubic functions were fitted to relative EVs across the array and normally functioning electrodes had relative EVs with <6% deviation from the function. The EVs were quickly and accurately recorded by a modern evoked potentials system with a high sampling rate of 400 kHz. As such this method is clinically viable; it is also highly sensitive and specific to the issue of moisture ingress.
Data availability statement
The data analyzed in this study is subject to the following licenses/restrictions: Due to ethical restrictions these data are not publicly available. Data are however available from the corresponding author on reasonable request and with permission of the data custodian. The data supporting the findings of this study, and a link to request the data will be made available from the University of Southampton repository. Requests to access these datasets should be directed to m.l.grasmeder@soton.ac.uk.
Ethics statement
The studies involving humans were approved by Health Research Authority, UK and the University of Southampton Research Integrity and Governance Team. The studies were conducted in accordance with the local legislation and institutional requirements. Written informed consent for participation was not required from the participants or the participants' legal guardians/next of kin in accordance with the national legislation and institutional requirements.
Author contributions
MG: Conceptualization, Data curation, Formal analysis, Investigation, Methodology, Writing – original draft, Writing – review & editing, Funding acquisition. KR: Formal analysis, Methodology, Funding acquisition, Writing – original draft. ZA: Data curation, Formal analysis, Writing – original draft. KH: Data curation, Formal analysis, Investigation, Writing – original draft. CV: Formal analysis, Methodology, Writing – original draft. TN: Formal analysis, Funding acquisition, Investigation, Methodology, Project administration, Writing – original draft, Writing – review & editing.
Funding
The author(s) declare financial support was received for the research, authorship, and/or publication of this article. This work was supported by the Engineering and Physical Sciences Research Council, grant numbers EP/W018764/1 and EP/W018918/1.
Acknowledgments
We thank the study participants for their commitment to the study, and the members of our PPI group, All_Ears@UoS for their expertise in developing and reviewing the application for ethical approval of the study.
Conflict of interest
The authors declare that the research was conducted in the absence of any commercial or financial relationships that could be construed as a potential conflict of interest.
Publisher's note
All claims expressed in this article are solely those of the authors and do not necessarily represent those of their affiliated organizations, or those of the publisher, the editors and the reviewers. Any product that may be evaluated in this article, or claim that may be made by its manufacturer, is not guaranteed or endorsed by the publisher.
References
Eitutis, S. T., Tam, Y. C., Roberts, I., Swords, C., Tysome, J. R., Donnelly, N. P., et al. (2022). Detecting and managing partial shorts in cochlear implants: a validation of scalp surface potential testing. Clin. Otolaryngol. 47, 641–649. doi: 10.1111/coa.13963
Garnham, J., Marsden, J., and Mason, S. M. (2001). Profiles of AEVs for intra- and post-operative integrity test measurements in young children with the Nucleus mini 22 cochlear implant. Br. J. Audiol. 35, 31–42. doi: 10.1080/03005364.2001.11742729
Gärtner, L., and Lenarz, T. (2022). Advanced bionics HiRes ultra and ultra 3D series cochlear implant recall: time course of anomalies. Laryngoscope 132, 2484–2490. doi: 10.1002/lary.30151
Grasmeder, M., Verschuur, C., Ferris, R., Basodan, S., Newman, T., and Sanderson, A. (2021). Piloting the recording of electrode voltages (REVS) using surface electrodes as a test to identify cochlear implant electrode migration, extra-cochlear electrodes and basal electrodes causing discomfort. Cochlear Implants Int. 22, 157–169. doi: 10.1080/14670100.2020.1863701
Hughes, M. L. (2013). Objective Measures in Cochlear Implants: Plural. San Diego, CA: Plural Publishing.
Hughes, M. L., Brown, C. J., and Abbas, P. J. (2004). Sensitivity and specificity of averaged electrode voltage measures in cochlear implant recipients. Ear Hear 25, 431–446. doi: 10.1097/01.aud.0000145111.92825.cc
Lindquist, N. R., Cass, N. D., Patro, A., Perkins, E. L., Gifford, R. H., Haynes, D. S., et al. (2022). HiRes ultra series recall: failure rates and revision speech recognition outcomes. Otol. Neurotol. 43, E738–E45. doi: 10.1097/MAO.0000000000003598
Liu, H. T., Yao, X. Y., Kong, W. L., Zhang, L., Si, J. Y., Ding, X. Y., et al. (2023). Cochlear Reimplantation rate and cause: a 22-year, single-center experience, and a meta-analysis and systematic review. Ear Hear 44, 43–52. doi: 10.1097/AUD.0000000000001266
McHugh, C. I., Swedenborg, B. K., Chen, J. X., Jung, D. H., Mankarious, L. A., Quesnel, A. M., et al. (2022). Voluntary field recall of advanced bionics hires cochlear implants: a single-institution experience. Otol. Neurotol. 43, E1094–E9. doi: 10.1097/MAO.0000000000003711
Mens, L. H. M., Oostendorp, T., and Vandenbroek, P. (1994). Identifying electrode failures with cochlear implant generated surface-potentials. Ear Hear 15, 330–338. doi: 10.1097/00003446-199408000-00007
Monin, D. L., Kazahaya, K., and Franck, K. H. (2006). Routine use of the crystal device integrity testing system in pediatric patients. J. Am. Acad. Audiol. 17, 722–732. doi: 10.3766/jaaa.17.10.4
Schwam, Z. G., Perez, E., Goldin, L., Wong, K. V., Fan, C. L., Oh, S., et al. (2023). Institutional experience with cochlear implants falling under the 2020 FDA corrective action. Otol. Neurotol. 44, 229–232. doi: 10.1097/MAO.0000000000003798
Wilson, B. S., and Dorman, M. F. (2008). Cochlear implants: a remarkable past and a brilliant future. Hear Res. 242, 3–21. doi: 10.1016/j.heares.2008.06.005
Winchester, A., Kay-Rivest, E., Friedmann, D. R., McMenomey, S. O., Shapiro, W. H., Roland, J. T., et al. (2023). HiRes ultra series cochlear implant field recall: failure rates and early outcomes. Cochlear Implants Int. 24, 87–94. doi: 10.1080/14670100.2022.2145689
Keywords: cochlear implant, electrode voltage, integrity test, surface potential, Ultra V1, electrical field imaging, device failure
Citation: Grasmeder M, Rogers K, Aydin Z, Hough K, Verschuur C and Newman T (2024) Improving the sensitivity of cochlear implant integrity testing by recording electrode voltages with surface electrodes. Front. Audiol. Otol. 2:1342263. doi: 10.3389/fauot.2024.1342263
Received: 21 November 2023; Accepted: 29 January 2024;
Published: 15 February 2024.
Edited by:
Chin-Tuan Tan, The University of Texas at Dallas, United StatesReviewed by:
Richard Charles Dowell, The University of Melbourne, AustraliaBrett Martin, The City University of New York, United States
Copyright © 2024 Grasmeder, Rogers, Aydin, Hough, Verschuur and Newman. This is an open-access article distributed under the terms of the Creative Commons Attribution License (CC BY). The use, distribution or reproduction in other forums is permitted, provided the original author(s) and the copyright owner(s) are credited and that the original publication in this journal is cited, in accordance with accepted academic practice. No use, distribution or reproduction is permitted which does not comply with these terms.
*Correspondence: Mary Grasmeder, m.l.grasmeder@soton.ac.uk
†ORCID: Mary Grasmeder orcid.org/0000-0001-9020-328X
Katrine Rogers orcid.org/0000-0001-9641-6032
Ziya Aydin orcid.org/0009-0008-9936-4002
Kate Hough orcid.org/0000-0002-5160-2517
Tracey Newman orcid.org/0000-0002-3727-9258