 Robert F. Collison
 Emma C. Raven
 Charles P. Pignon
 Stephen P. Long
- 1Department of Plant Sciences, University of Oxford, Oxford, United Kingdom
- 2Carl R. Woese Institute for Genomic Biology, University of Illinois, Urbana, IL, United States
- 3Department of Crop Sciences, University of Illinois, Urbana, IL, United States
- 4Department of Plant Biology, University of Illinois, Urbana, IL, United States
- 5Lancaster Environment Centre, Lancaster University, Lancaster, United Kingdom
Zea mays and Miscanthus × giganteus use NADP-ME subtype C4 photosynthesis and are important food and biomass crops, respectively. Both crops are grown in dense stands where shaded leaves can contribute a significant proportion of overall canopy productivity. This is because shaded leaves, despite intercepting little light, typically process light energy very efficiently for photosynthesis, when compared to light-saturated leaves at the top of the canopy. However, an apparently maladaptive loss in photosynthetic light-use efficiency as leaves become shaded has been shown to reduce productivity in these two species. It is unclear whether this is due to leaf aging or progressive shading from leaves forming above. This was resolved here by analysing photosynthesis in leaves of the same chronological age in the centre and exposed southern edge of field plots of these crops. Photosynthetic light-response curves were used to assess maximum quantum yield of photosynthesis; the key measure of photosynthetic capacity of a leaf in shade. Compared to the upper canopy, maximum quantum yield of photosynthesis of lower canopy leaves was significantly reduced in the plot centre; but increased slightly at the plot edge. This indicates loss of efficiency of shaded leaves is due not to aging, but to the altered light environment of the lower canopy, i.e., reduced light intensity and/or altered spectral composition. This work expands knowledge of the cause of this maladaptive shade response, which limits productivity of some of the world’s most important crops.
Introduction
C4 grasses of the Andropogoneae represent some of the most important cultivated plants on the planet, making up a significant proportion of our food and fibre production, as well as providing major bioenergy crops. All members of this monophyletic tribe use the NADP-ME subtype of C4 photosynthesis, with some species using substantial PCK activity. This tribe includes crops such as Saccharum officinarum L. (sugarcane), the greatest producer of harvested biomass globally, and Zea mays L. (maize), the single largest source of grain globally (Christin et al., 2009; Welker et al., 2014; FAOSTAT, 2017). Other C4 NADP-ME crops of this tribe are highly productive in the face of extreme climatic conditions, and thus vital to food production in drought prone environments. Sorghum bicolor (Lu.) Moench (sorghum), for instance, is the second most extensively cultivated crop plant in Africa behind Z. mays thanks to its high drought tolerance (FAOSTAT, 2017; Hadebe et al., 2017). The tribe also includes the most productive temperate biomass crop known, Miscanthus × giganteus Greef et Deu. (Heaton et al., 2008; LeBauer et al., 2018).
The theoretical maximum efficiency of conversion of solar energy to biomass is 6% for C4 compared to 4.6% for C3 photosynthesis at 30°C and 380 ppm atmospheric CO2: this improved photosynthetic light-use efficiency contributes to higher yields in C4 crops (Zhu et al., 2008). The key metric for photosynthetic light-use efficiency is the quantum yield of CO2 assimilation, i.e., the mol CO2 assimilated per mol photons of light. In a typical light-response curve, the quantum yield of CO2 assimilation is greatest when light is limiting, and declines at high light as photosynthesis becomes light-saturated. The maximum quantum yield of CO2 assimilation (ϕCO2 max, app), achieved under limiting light, is therefore paramount for the productivity of shade leaves. Shade leaves are estimated to contribute around 50% of total canopy carbon gain in field crops and may represent >80% of leaves in a dense crop stand (Baker et al., 1988; Long, 1993; Hikosaka et al., 2016). Accordingly, leaves of most plants respond to increasing shade by maintaining or increasing ϕCO2 max, app so that they can make maximum use of the limited light. However, in Z. mays and M. × giganteus a significant decrease in ϕCO2 max, app has been observed in leaves as they become progressively shaded by new leaves forming above them, with a projected cost of up to 10% of potential canopy CO2 assimilation (Pignon et al., 2017). With the continued trend of increasing planting density this loss will likely increase into the future (Lobell et al., 2014).
Shade acclimation in C4 species has been studied primarily by comparing plants grown in high vs. low light (Tazoe et al., 2008; Sales et al., 2018; Sonawane et al., 2018). On this basis, it has been observed that C4 species have relatively poor acclimation to shade relative to C3 species (Sage and McKown, 2006), but C4 grasses which use the NADP-ME subtype, such as Z. mays, acclimate to shade more readily than those using NAD-ME or PEP-CK subtypes (Sonawane et al., 2018). However, in these studies the shaded leaves grow while the entire plant is shaded, such that their entire development occurs in the shade. In crop fields, leaves form in full sunlight, but then become progressively shaded after they have completed development as new leaves form above them (Yabiku and Ueno, 2019). Less is known about acclimation in this situation, which is particularly relevant to crop productivity. Plasticity to shade in this context is more limited, since leaves are already fully formed and acclimated to high light before becoming shaded. In grasses, plasticity of key physiological traits, such as leaf nitrogen (N) content, declines with increasing leaf age (Niinemets, 2016a). In addition, shade in the lower canopy is not simply reduced light quantity, but also altered spectral light composition, with relative depletion of red and blue, and enrichment of green and near infrared, plus an increased incidence of light fluctuations due to sun flecks (Pearcy, 1990). Leaves of NADP-ME C4 grasses lose photosynthetic efficiency under these conditions (Kromdijk et al., 2008; Kubasek et al., 2013; Pignon et al., 2017).
The two major distinctions between a sun and shade leaf in a C4 grass canopy are leaf age and light environment. Understanding whether the decline of photosynthetic efficiency in shade leaves results from age, light environment, or both, is an important first step in devising strategies to overcome this costly maladaptation in these key crops. For instance, efforts to optimize canopy architecture have involved producing crops with more erect (Perez et al., 2018; San et al., 2018) or more transparent (Slattery et al., 2016; Walker et al., 2018) leaves that increase light availability at the bottom of the canopy to increase canopy photosynthesis (Zhu et al., 2010). This strategy may not be as effective in C4 grass canopies if the leaves at the bottom of the canopy have lost efficiency in low light due to age, and so have limited ability to utilize the increased levels of PPFD enabled by these canopy alterations.
Classically, leaf shade adaptation involves maintaining maximum quantum yields on an absorbed light basis (ϕCO2 max, abs), and increasing leaf light absorbance (α) through increased chlorophyll concentration, to deliver increased photosynthesis in the shade. However, prior evidence has shown the reverse to occur in Z. mays and M. x giganteus, with a decrease in ϕCO2 max, abs and significant cost to canopy photosynthesis (Pignon et al., 2017). Here, we tested the following hypothesis: chronological age is responsible for the loss of maximum quantum yields of photosynthesis in field plots of the C4 NADP-ME grasses Z. mays and M. x giganteus. Leaves were collected from the top and bottom of the canopy at the south exposed edge and at the centre of field plots of these crops, such that lower canopy leaves from both plot positions were of the same chronological age, but only those at the plot centre were shaded. This enabled separation of the effects of environment and chronological age on differences in photosynthetic efficiency between sun and shade leaves in a field production setting. The maximum quantum yield of CO2 assimilation, and its underlying physiological drivers, were determined from leaf gas exchange, modulated chlorophyll fluorescence and light absorbance measurements.
Materials and Methods
Plant Material
Measurements were taken on Zea mays and Miscanthus × giganteus. Leaves were collected from >1 ha plots of a high-yielding modern Z. mays hybrid as described previously (Pignon et al., 2017) on the University of Illinois South Farms (40°02′N, 88°14′W, 216 m above sea level), and leaves of M. × giganteus (“Illinois” clone) from 4 ha plots on University of Illinois Energy Farm (40°07′N, 5 88°21′W, 228 m above sea level) as described previously (Joo et al., 2017). Soils at these sites are deep Drummer/Flanagan series (a fine silty, mixed, mesic Typic Endoaquoll) with high organic matter typical of the central Illinois region of the Corn Belt (Smith et al., 2013). Both plots were rainfed. The M. × giganteus plots were 9 years old, with a stem density of about 100 tillers m–2; these plots were unfertilized. Z. mays was sown in early May at a density of 75,000 seeds ha–1. Prior to planting, 140 kg [N] ha–1 was applied, in line with regional production practice.
Measurements were taken between July 26 and August 06 of 2018. Leaves were cut pre-dawn at the base, then the base was submerged in water and re-cut to prevent air blockage in the xylem as described in Pignon et al. (2017). Removing leaves from plants in this way has been shown not to bias photosynthetic measurements (Leakey et al., 2006). Leaves were then brought back to the laboratory, where they remained in low light until measurement. This procedure avoided any photoinhibition or transient water stress that could develop differentially in shade and sun leaves over a day.
Leaves were sampled from two canopy positions (upper and lower) and two plot positions, centre and the south edge. For each plant sampled, two leaves were collected; an upper canopy leaf, defined as the youngest fully expanded leaf, indicated by a fully emerged ligule, and a lower canopy leaf; the seventh counting down from the first fully emerged leaf. This ensured that within a species and canopy position, leaves from the plot centre and edge were of the same age. The lower canopy leaves in the plot centre were strongly shaded, whereas lower canopy leaves at the plot’s edge were not. The south edge of the plot was chosen since on clear sky days these leaves were exposed to sunlight for 12 h per day.
Measurement of Photosynthesis
Portable photosynthetic gas exchange systems (LI 6400 and LI 6400-40 modulated fluorescence chamber head; LI-COR, Inc., Lincoln, NE, United States) were used to measure CO2 and water vapor exchange on a 2 cm2 area of each leaf, along with modulated chlorophyll fluorescence, in the system’s controlled environment leaf cuvette. Air temperature was controlled at a constant 25.0°C, chamber [CO2] at 400 ppm, and water vapour pressure deficit at 1.6–2.4 kPa.
The measurement sequence began with estimation of maximum dark-adapted quantum yield of PSII photochemistry (Fv/Fm). A photosynthetic light response curve was generated as follows: integrated LEDs emitted uniform light consisting of 10% blue (465 nm wavelength) and 90% red (635 nm wavelength) across the leaf surface. In order to limit photoinhibition caused by sudden exposure to saturating light on enclosure in the cuvette, leaves were first subjected to a photosynthetic photon flux density (PPFD) of 100 μmol m–2 s–1 for 5 min, and subsequently exposed to 2000 μmol m–2 s–1 for 30–60 min until A reached a steady-state. PPFD was then decreased from 2000 in steps to 1500, 1000, 500, 200, 180, 160, 140, 120, 100, 80, 60, 40, 20, and 0 μmol m–2 s–1. Each PPFD step lasted 5–10 min to allow A to reach a steady state before measuring. Steady-state gas-exchange was recorded at each level of PPFD and used to calculate A (von Caemmerer and Farquhar, 1981). Modulated fluorescence measurements were made at each level of PPFD to determine the operating quantum yield of PSII (ϕPSII) using a multiphase flash protocol (Loriaux et al., 2013). In turn, ϕPSII was used to calculate the rate of linear electron flux through PSII (J), using measured values for leaf fractional absorptance of photosynthetically active photon flux (α, described below) and assuming a photon partitioning factor of 0.4 for PSII vs. PSI, i.e., accounting for increased photon partitioning to PSI to produce ATP through cyclic electron flux (Yin and Struik, 2012; Ver Sagun et al., 2019). Each A-PPFD response curve was fit to a four-parameter non-rectangular hyperbola using PROC NLIN (SAS v9.4, SAS Institute, Cary, NC, United States), which produced an asymptote, taken to represent light-saturated A (Asat), and a Y-intercept, taken to represent dark respiration (Rd). The third parameter described light-limited A and the fourth parameter described the inflexion between light-limited and light-saturated A with increasing PPFD.
After gas-exchange measurements were completed, absorptance (α) was measured using an integrating sphere and associated spectrometer (Jaz-Spectroclip-TR, Ocean Optics, Largo, FL, United States) and operating software (Spectrasuite, Ocean Optics). α was weighted for 10% blue (465 nm wavelength) and 90% red (635 nm wavelength) incident light to match illumination in the gas-exchange chamber.
The maximum quantum yield of CO2 assimilation on an incident light basis (ϕCO2 max, app) was calculated from the slope of the linear regression of A against PPFD from 40 to 140 μmol m–2 s–1 using PROC GLM (SAS v9.4) (Yin et al., 2014; Pignon et al., 2017). This interval was chosen to account for the Kok effect where respiration increases at very low light levels (PPFD < 40 μmol m–2 s–1), and to avoid high light levels (PPFD > 140 μmol m–2 s–1) where A is no longer strictly light-limited causing deviations from the linear relationship of A and PPFD. The maximum quantum yield of CO2 assimilation on an absorbed light basis (ϕCO2 max, abs) was given by ϕCO2 max, app /α. Finally, the maximum quantum yield of CO2 assimilation on an absorbed light basis and corrected for concurrent changes in ϕPSII (ϕCO2 max, abs PSII) was calculated as in Yin et al. (2014). To test for alternative electron sinks to photosynthetic carbon metabolism, the slope of A vs. J was calculated for PPFD between 40 and 140 μmol m–2 s–1 using linear regression (SAS v9.4). The slope of this relationship gives the mol CO2 assimilated per mol electrons in linear electron flux (1/k) (Baker, 2008). Here k is the mol electrons through linear electron flux required for photosynthesis to fix one mol CO2. 1/k is an indicator of alternative energy sinks, where any reduction in 1/k is assumed to result from alternative energy sinks, including utilization of ATP and NADPH in processes other than photosynthetic carbon metabolism.
Statistical Analysis
Data were analysed by ANOVA using PROC GLM (SAS v9.4), testing for the fixed effect of species (S effect: Z. mays vs. M. x giganteus), the fixed effect of canopy position (C effect: upper vs. lower canopy), and the fixed effect of plot position (P effect: centre vs. edge), along with all two-way interactions (S x P, S x C, P x C). This model was used to test for significant (p = 0.05 threshold) and marginally significant (p = 0.1 threshold) differences in the following traits: ϕCO2 max, app, ϕCO2 max, abs, ϕCO2 max, abs PSII, 1/k, α, Asat, Rd, and Fv/Fm. Homogeneity of group variances was tested by Levene’s at p = 0.05 threshold in PROC GLM (SAS v9.4). Normality of Studentized residual distribution was tested by Shapiro–Wilk at p = 0.01 threshold in PROC UNIVARIATE (SAS v9.4). Replication was n = 8–16 in different traits.
Results
In this study, the three key measures of photosynthetic efficiency (ϕCO2 max, app, ϕCO2 max, abs and ϕCO2 max, abs PSII) all derive from the linear slope, at low PPFD, of the A-PPFD response curve (Figure 1). There was a significant interaction (p < 0.05) between canopy position and plot position for all three of these metrics (Figure 2A: P x C interaction, Supplementary Table S1: P x C interaction). This was because photosynthetic efficiency was greater at the top than the bottom of the canopy at the plot centre, while the opposite was seen at the plot edge where photosynthetic efficiency was slightly lower at the top than at the bottom of the canopy. Indeed, at the plot centre lower canopy leaves of both Z. mays and M. x giganteus showed a 2–18% reduction across all measures of photosynthetic efficiency compared to the upper canopy leaves (ϕCO2 max, app, ϕCO2 max, abs, ϕCO2 max, abs PSII, Figure 2A and Supplementary Table S1). In contrast, at the edge of the plots, the lower canopy leaves for both Z. mays and M. x giganteus showed 2–9% greater efficiency than the upper canopy leaves for the same measurements. In addition, Z. mays recorded significantly (p < 0.0001) and up to 43% greater values than M. x giganteus for ϕCO2 max, app, ϕCO2 max, abs, and ϕCO2 max, abs PSII (Figure 2A: S effect and Supplementary Table S1: S effect). Finally, ϕCO2 max, abs at the plot edge was marginally significantly (p = 0.07) and up to 25% greater than at the plot centre (Figure 2A: P effect).
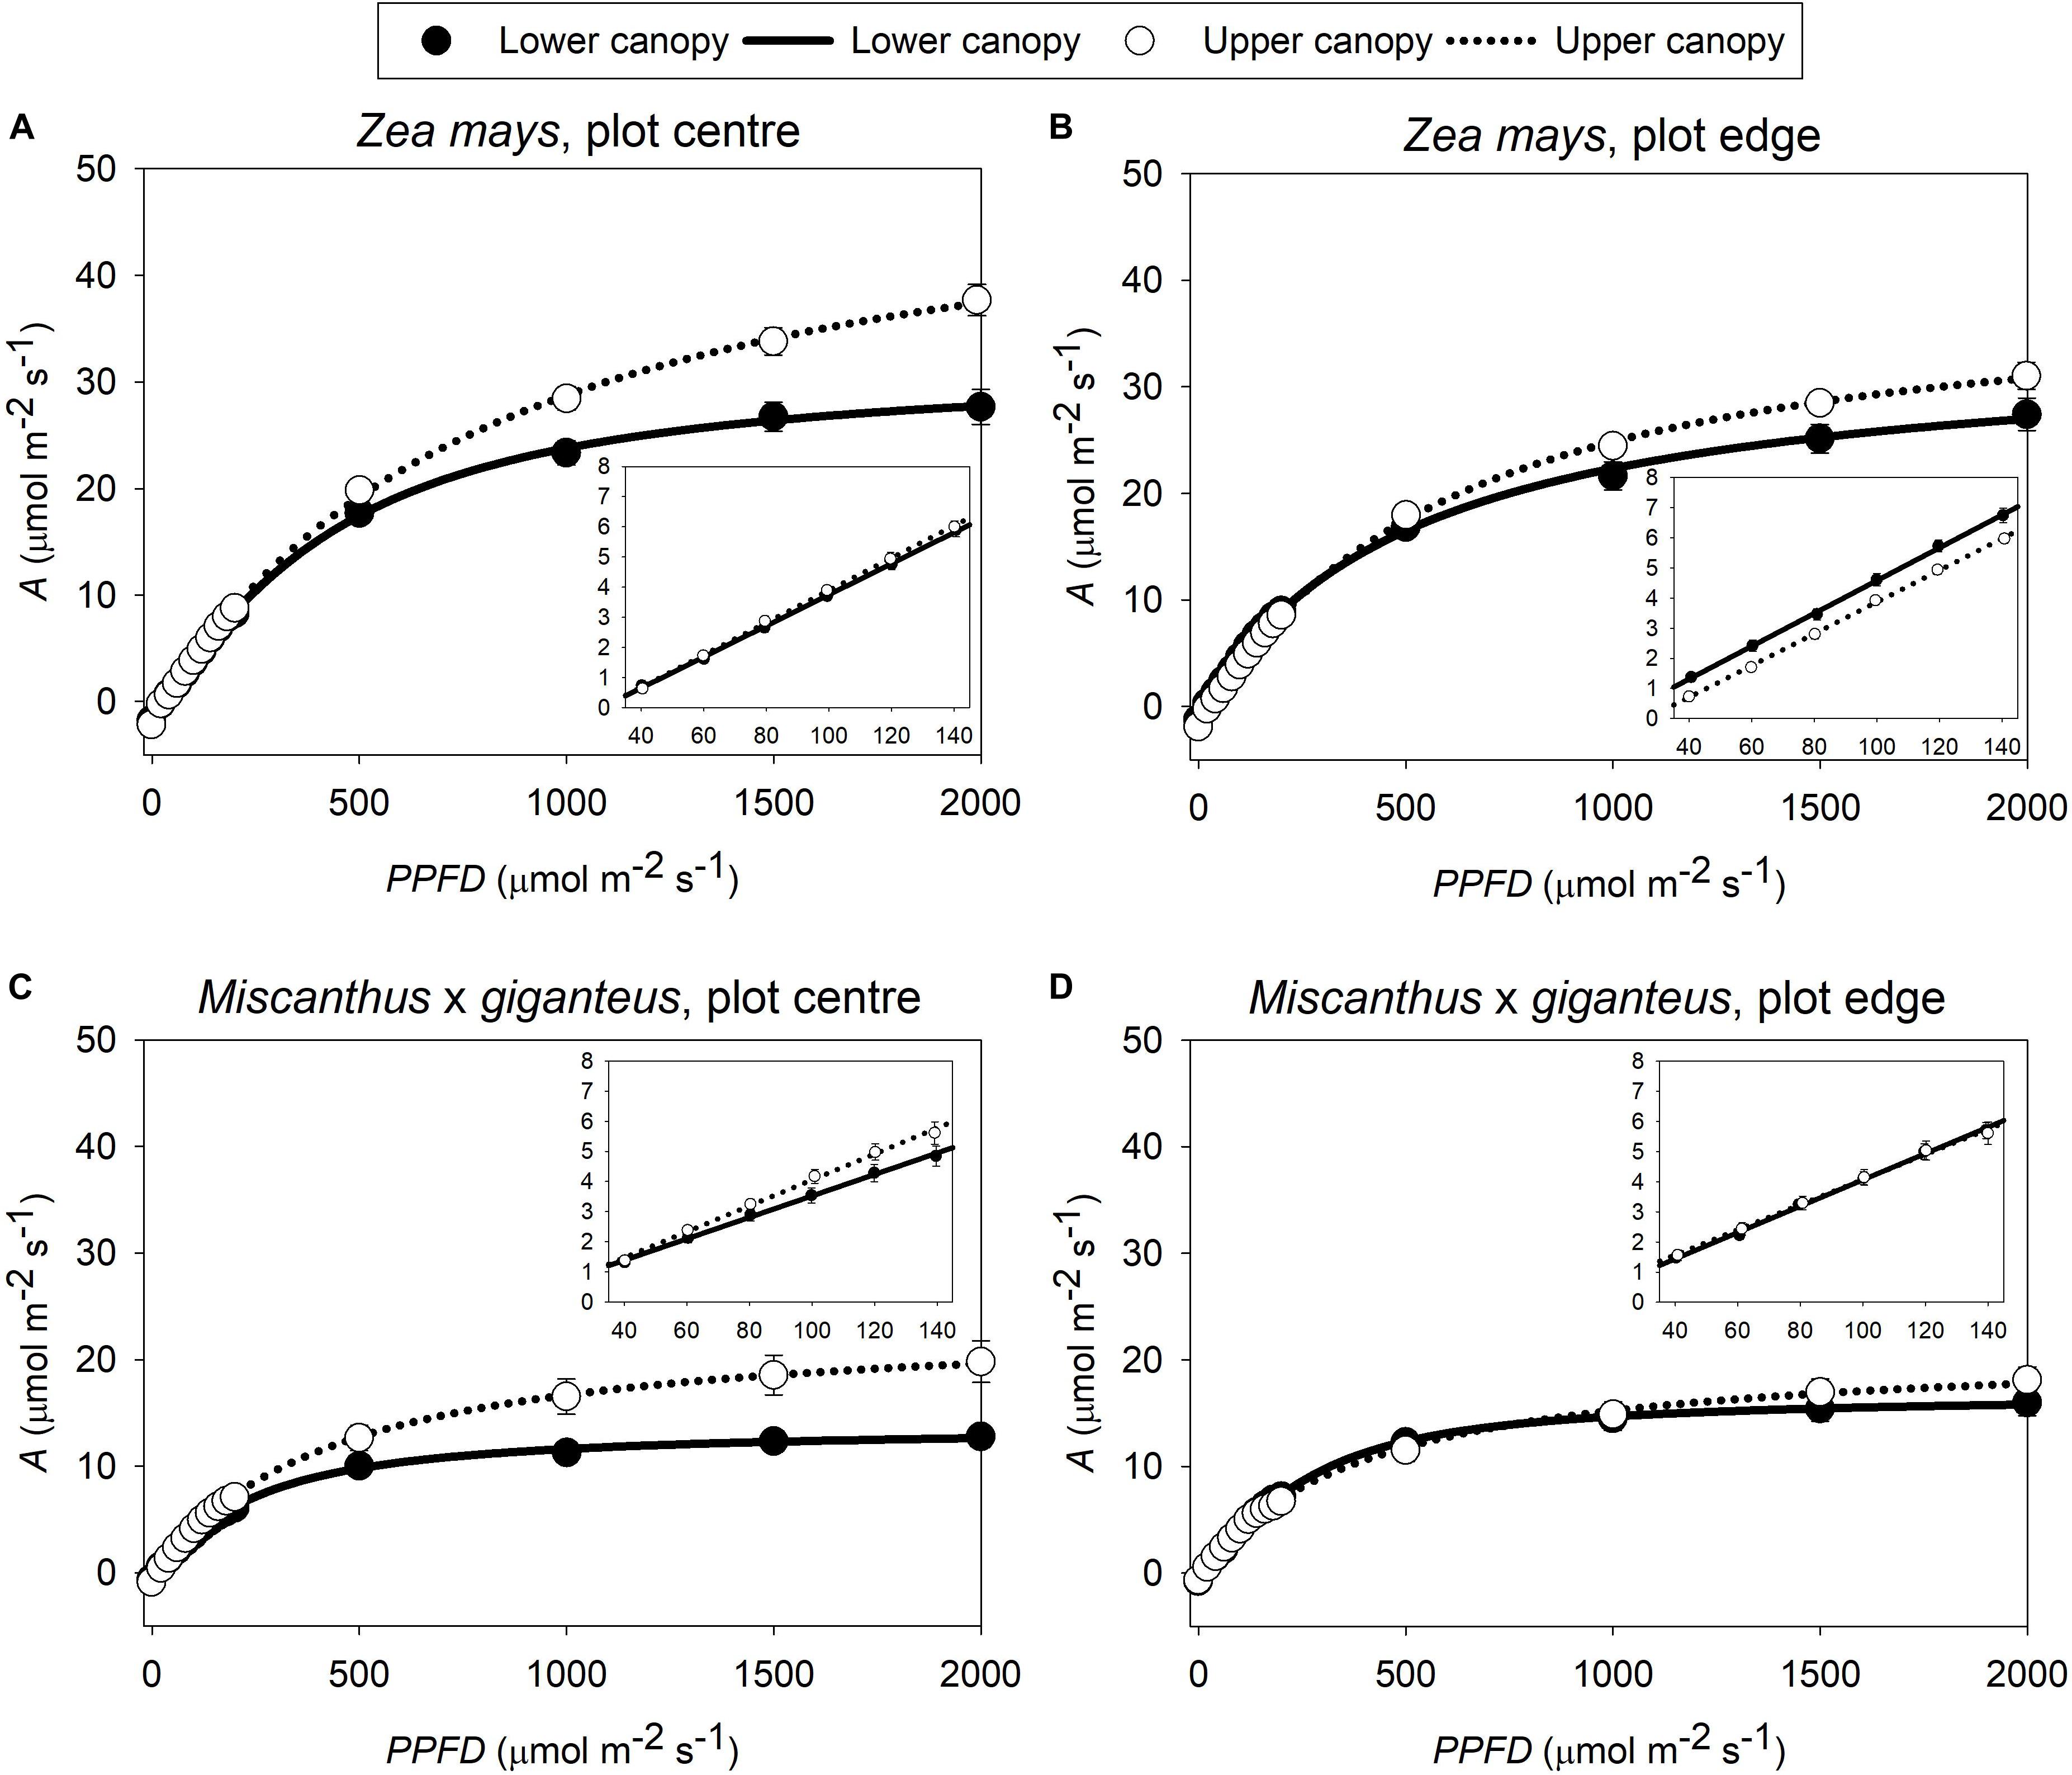
Figure 1. Average response curves of A to PPFD in both canopy positions (upper, lower) of (A) Z. mays in plot centre and (B) plot edge; and (C) M. x giganteus in plot centre and (D) plot edge (n = 8–16). Symbols give the mean A ± s.e. at each level of PPFD. Lines give the non-rectangular hyperbolae fit to these measurements. In each panel, the inset shows the light-limited section of the response curve (PPFD from 40 to 140 μmol m–2 s–1), used to estimate maximum quantum yields by linear regression: the slope of this regression gives the trait ϕCO2 max, app.
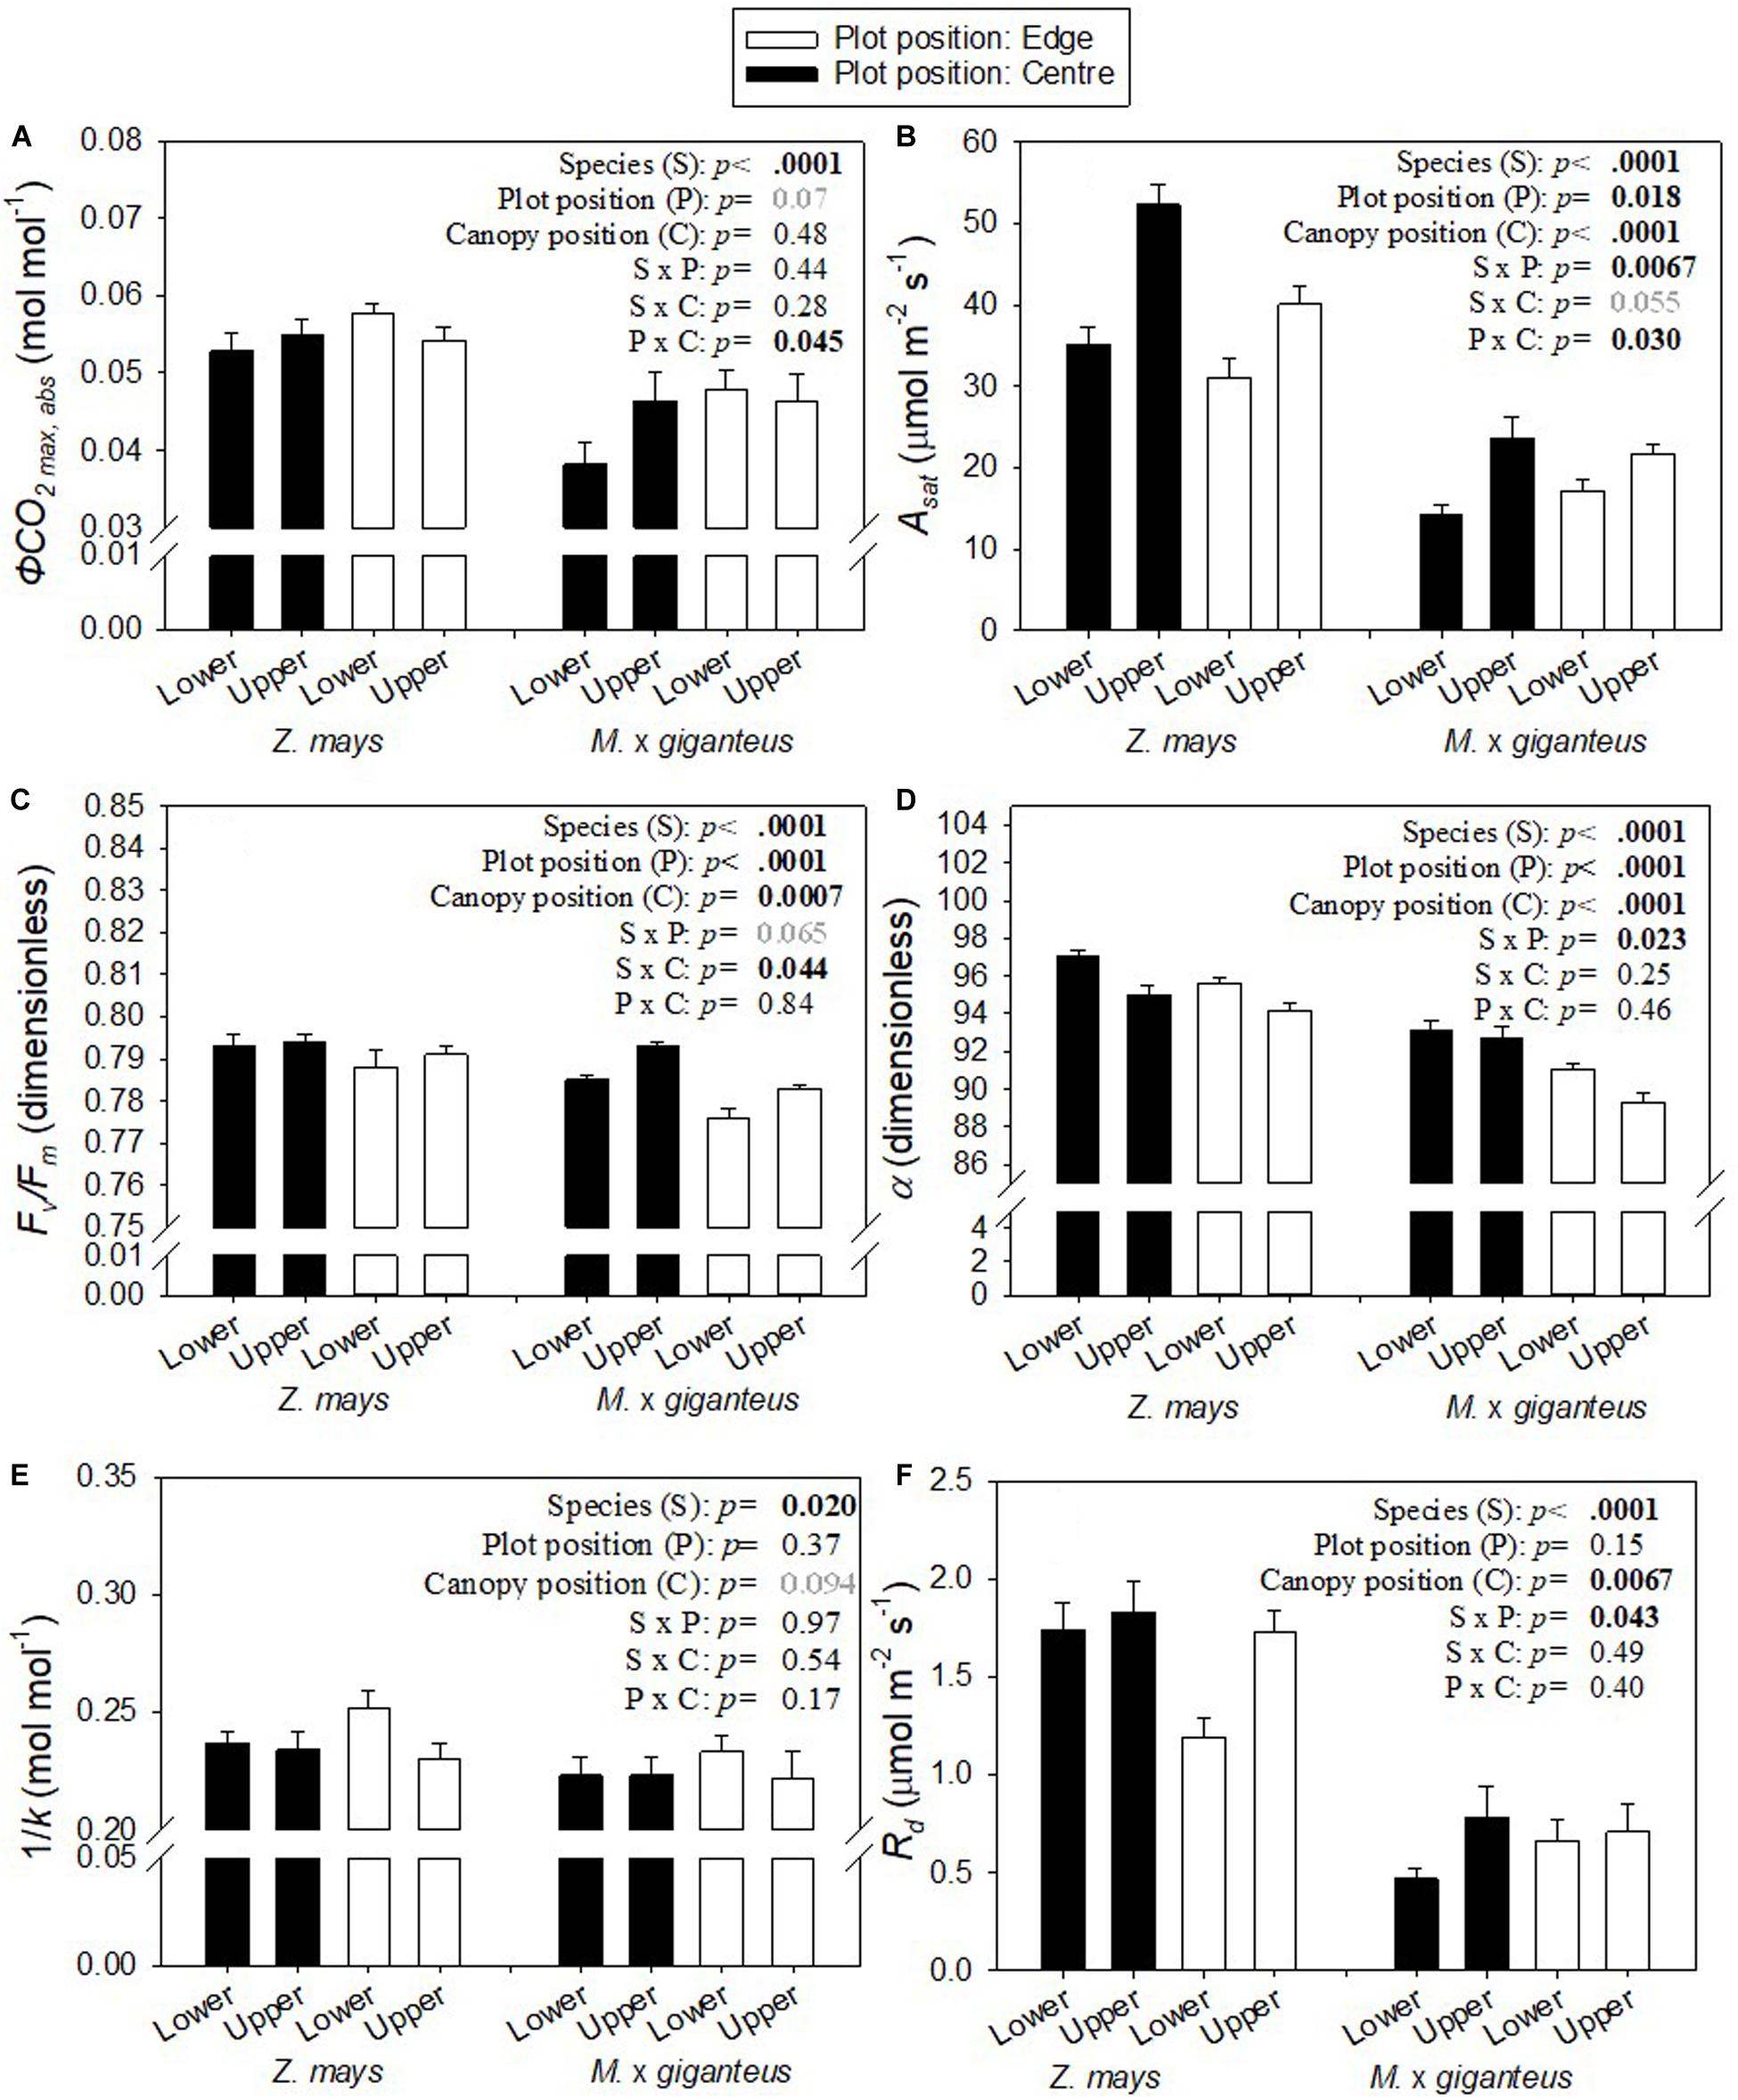
Figure 2. Mean ± s.e. for (A) ϕCO2 max,abs, (B) Asat, (C) Fv/Fm, (D) α, (E) 1/k, and (F) Rd for Z. mays and M. x giganteus for upper and lower canopy leaves in both plot positions (centre, edge) (n = 8–16). p-values are from ANOVA testing the fixed effects of species, plot position, canopy position, and all two-way interactions. Significant p-values (< 0.05) are in bold black. Marginally significant p-values (< 0.1) are in bold grey.
The only other measure that showed a statistically significant interaction of plot and canopy position was Asat. Asat was significantly (p < 0.0001) and up to 2-fold greater in Z. mays than M. x giganteus (Figure 2B, S effect), significantly (p = 0.018) greater at the centre than at the edge of the plot (Figure 2B, P effect), and significantly (p < 0.0001) greater at the top than at the bottom of the canopy (Figure 2B, C effect). The difference in Asat between canopy levels was more pronounced at the centre than at the edge of plots, leading to a significant interaction (p = 0.03) of canopy position and plot position (Figure 2B: P x C interaction). Relative to the upper canopy, Asat was decreased in the lower canopy by 30 and 40% in Z. mays and M. x giganteus, respectively, in the centre of the plots and by 23 and 21% in Z. mays and M. x giganteus, respectively, at the edge of the plots. Asat showed significant interaction (p = 0.0067) of species and plot position (Figure 2B: S x P interaction), and a marginally significant interaction (p = 0.055) of species and canopy position (Figure 2B: S x C interaction). This was because differences in Asat between canopy positions and between plot positions were more pronounced in Z. mays than in M. x giganteus.
There were statistically significant (p = 0.0007) decreases in Fv/Fm in the lower canopy relative to the upper canopy, but in absolute terms this was a minor difference at less than 1% (Figure 2C: C effect). There were similarly small, but significant (p < 0.0001), decreases in Fv/Fm at the edge relative to the centre (Figure 2C: P effect), and in M. x giganteus relative to Z. mays (Figure 2C: S effect). Differences in Fv/Fm between canopy positions and between plot positions were slightly more pronounced in M. x giganteus than in Z. mays, resulting in a significant interaction (p = 0.044) of species and canopy position (Figure 2C: S x C interaction), and a marginally significant interaction (p = 0.065) of species and plot position (Figure 2C: S x P interaction).
Lower canopy leaves had significantly (p < 0.0001) and up to 2% greater α than upper canopy leaves (Figure 2D: C effect). α was also significantly (p < 0.0001) lower in M. x giganteus in comparison to Z. mays (Figure 2D: S effect) and significantly (p < 0.0001) greater at the plot centre than at the edge (Figure 2D: P effect). There was a significant interaction (p = 0.023) of species with plot position (Figure 2F: S x P interaction) because the difference in α between species was 5% at the edge of the plots and only 3% in the centre of the plots.
1/k, i.e., the ratio of A to J (Figure 3), was marginally significantly (p = 0.094), and up to 9% greater in lower canopy leaves than upper canopy leaves (Figure 2E: C effect). 1/k was also significantly (p = 0.02) and 4–8% greater in Z. mays than in M. x giganteus (Figure 2E: S effect).
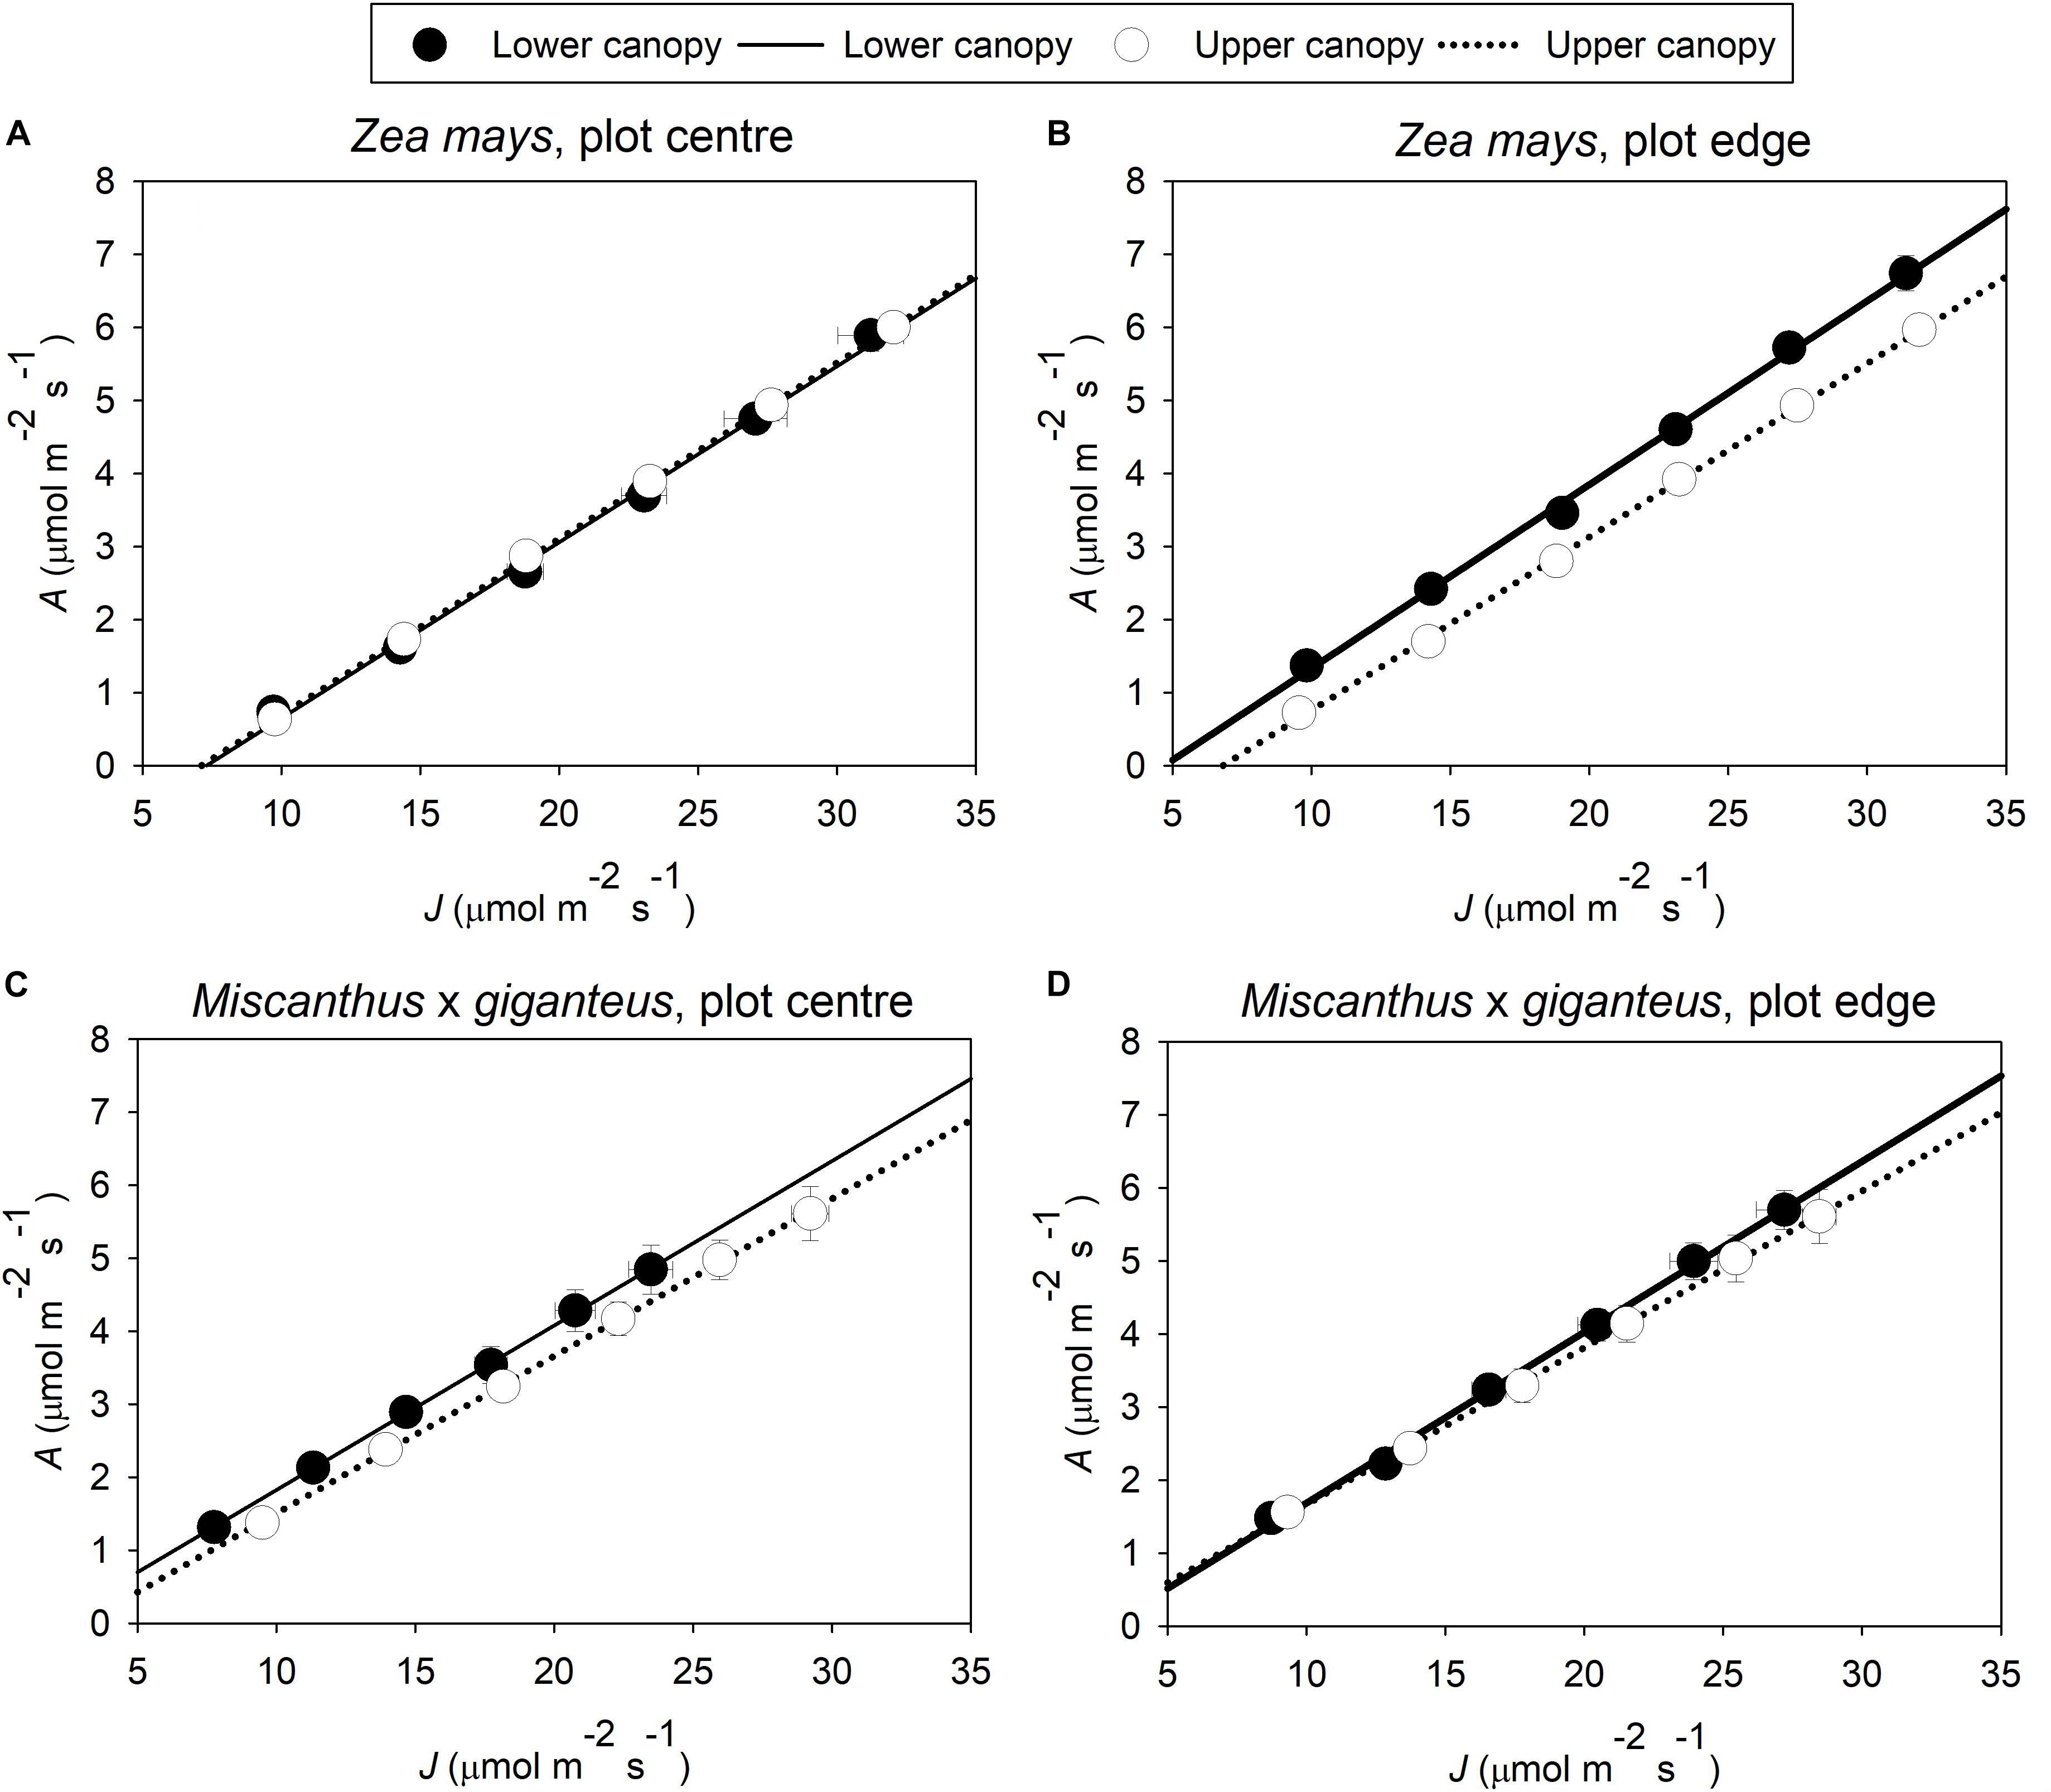
Figure 3. Average linear responses of A to J in (A) Z. mays in plot centre and (B) plot edge; and (C) M. x giganteus in plot centre and (D) plot edge (n = 8–16). Data is from light-limited measurements (PPFD from 40 to 140 μmol m–2 s–1). Symbols give the mean A ± s.e. and mean J ± s.e. at each level of PPFD. Lines give the best-fit linear regression; the slope of this regression gives the trait 1/k.
Rd was significantly (p = 0.0067) and 5–66% greater in upper canopy leaves than lower canopy leaves (Figure 2F: C effect). In line with the higher Asat, Rd was also significantly (p < 0.0001) greater in Z. mays than in M. x giganteus (Figure 2F: S effect). The difference in Rd between species was less pronounced at the edge than at the centre of the plots, resulting in a significant (p = 0.043) interaction between species and plot position (Figure 2F: S x P interaction). There was 144 and 80% difference between species for upper and lower canopy leaves at the plot edge, respectively, compared to 135 and 270% difference between species for upper and lower canopy leaves at the plot centre.
Discussion
Reduced Maximum Quantum Yield of CO2 Assimilation Is Not Caused by Increased Leaf Age
In a self-shading crop canopy, the optimal response to shade would be to maintain or increase ϕCO2 max, abs and increase α in order to maximize photosynthesis in light limited conditions. This would increase the linear slope of the response of A to PPFD at low light. This response is observed in shade adapted C3 plants and in C3 cereal crops (Givnish, 1988; Beyschlag et al., 1990; Hoyaux et al., 2008). However, the two C4 crops Z. mays and M. x giganteus studied here, show decreased ϕCO2 max, abs in the lower canopy at the plot centre, but not at the plot edge. This suggests that loss of ϕCO2 max, abs in shade leaves was not due to leaf age, since leaf age was equivalent across plot positions for each species and canopy position. Understanding the basis for this maladaptive response in photosynthetic efficiency is important, as it costs an estimated 10% of potential canopy CO2 assimilation in the field (Pignon et al., 2017).
If not age, then some environmental factor must trigger the decline in ϕCO2 max, abs of these shaded leaves. The most obvious environmental change between the top and bottom of the canopy is the light environment, with lower leaves receiving less light and an altered spectral distribution, depleted of red and blue and enriched in far-red wavelengths (Sattin et al., 1994). The hypothesis that self-shading is the primary cause for the loss of ϕCO2 max, abs in shade leaves of these C4 NADP-ME crops is supported by the following observations: (1) when comparing both studied species, the loss of ϕCO2 max, abs in shade leaves at the plot centre was more pronounced in M. x giganteus, which produces a denser canopy with considerably more self-shading than Z. mays. Profiles of canopy light interception in field stands of both species show that the lowest photosynthetically active leaves of Z. mays receive as much as twice the incident PPFD compared to equivalent leaves in M. x giganteus (Pignon et al., 2017). (2) In a previous study comparing two field-grown sugarcane varieties with high and low self-shading, photosynthetic light response curves measured at the top and bottom of the canopy produced contrasting results in the response of A to PPFD at low PPFD (<500 μmol m–2 s–1) (Marchiori et al., 2014). In the low self-shading variety, A at low PPFD was slightly greater at the bottom than at the top of the canopy, while the opposite was seen in the high self-shading variety. These studies implemented shade acclimation under realistic field conditions, which produce different results than artificial shading including altered spectral light composition and increased incidence of sun and shade flecks (Pearcy, 1990; Bellasio and Griffiths, 2014; Yabiku and Ueno, 2019).
These findings are important in light of recent efforts to develop crops with a more even vertical light distribution, where either more erect (Perez et al., 2018; San et al., 2018) or more transparent (Slattery et al., 2016; Walker et al., 2018) leaves allow more light to filter to the bottom of the canopy, ultimately increasing canopy photosynthesis (Zhu et al., 2010). The benefits of this type of canopy manipulation could be 2-fold in NADP-ME C4 crops such as Z. mays, M. x giganteus, sugarcane or sorghum, providing both increased light to drive more photosynthesis and minimizing the loss of photosynthetic efficiency in lower canopy leaves.
Apart from light, temperature is one other important change in microclimate between canopy and plot positions, as shaded leaves can be expected to be cooler. However, temperature is a less likely candidate than light to explain the lost photosynthetic efficiency of shaded leaves seen at the plot centre in the present study. In C3 plants, ϕCO2 max, abs is highly temperature-sensitive, primarily due to increased photorespiration at high temperatures (Ehleringer and Bjorkman, 1977; Long and Spence, 2013). In contrast, due to the C4 cycle’s suppression of photorespiration, ϕCO2 max, abs has been found to be constant with temperature from 15 to 40°C in C4 species such as Atriplex rosea (Ehleringer and Bjorkman, 1977) and Alloteropsis semialata (Osborne et al., 2008). Although loss of ϕCO2 max, abs has been observed in NADP-ME C4 grasses such as Z. mays due to photodamage during long-term exposure to a combination of high light and cool temperatures (<15°C) (Long and Spence, 2013), this is unlikely to have occurred in the warm summer months during which the present study took place, with maximum daily air temperatures ranging from 19.5 to 33°C at the time measurements were taken. Indeed, since the lower canopy leaves on the exposed southern edge of the stands were exposed to higher light intensities than the shaded lower leaves in the centre of the stands, the expectation would be of a lower ϕCO2 max, abs due to photodamage in the exposed lower canopy leaves, yet the opposite was found.
Physiological Traits Underpinning Maximum Quantum Yield of CO2 Assimilation
Under limiting light, reduced α in lower canopy leaves would limit the amount of incident light made available for use within the leaf, and would result in reduced maximum quantum yield on an incident light basis (i.e., ϕCO2 max, app). The fact that α increased in lower canopy leaves shows that in fact their light absorption was improved, not impaired. This pattern in α, along with Rd and Asat, matches established mechanisms of acclimation to low light, as shade leaves: (1) reduce Rd, (2) remobilize N away from photosynthetic enzymes and toward chlorophyll to improve α under limiting light, and (3) translocate N to the upper canopy so sun leaves can increase photosynthetic enzyme content and improve Asat (Boardman, 1977; Chen et al., 2014; Niinemets, 2016b; D’Odorico et al., 2018).
Because of the difference in light availability between sun and shade leaves, shade leaves benefit from partitioning relatively more N toward chlorophyll, compared to sun leaves that partition much more N toward photosynthetic enzymes. Therefore, while shade leaves typically reallocate the N stored in their photosynthetic enzymes and decrease total N content, this primarily results in a loss of Asat, while the apparent maximum quantum yield (ϕCO2 max, app) rises due to increased chlorophyll and, in turn, increased α. The unusual feature in this study is that ϕCO2 max, app falls despite an increase in α – hence our use of the term maladaptive to describe the response of studied shade leaves to low light. Also, as ϕCO2 max, abs is measured on an absorbed light basis and derived from the initial linear slope of the light response curve, it is by definition where A is strictly light-limited, ruling out any limitation by N or protein amounts which primarily affect Asat (Hikosaka and Terashima, 1995). In fact, the maximum quantum yield of CO2 assimilation corrected for chlorophyll content was equivalent in N-stressed and control maize plants (Lu and Zhang, 2000).
Efficient energy transfer at PSII is essential to power photosynthesis under limiting light. Fv/Fm is an effective probe to determine whether damage to PSII has occurred (Baker, 2008). However, the <1% loss of Fv/Fm observed here in lower canopy leaves cannot explain the much more substantial losses in ϕCO2 max,abs.
1/k, i.e., the ratio of A to the rate of linear electron transport through PSII (J) at low light, is decreased when the energetic compounds NADPH, reduced ferredoxin, and ATP, produced through linear electron flux, are diverted away from photosynthetic carbon metabolism and into other energy-consuming processes (e.g., nitrogen metabolism, Mehler reaction) (Delatorre et al., 1991; Baker, 2008). This is observed as a reduced slope of the linear relationship of A to J. Under limiting light, this will cause a decline in ϕCO2 max, abs. However, in lower canopy leaves, 1/k was greater than at the top of the canopy, implying leaves at the bottom of the canopy actually had fewer, not more, alternative energy sinks to photosynthetic carbon metabolism. In fact, alternative energy sinks overall were minimal: 1/k was always close to the theoretical maximum of 0.25 mol mol–1, i.e., for each mol CO2 assimilated, a theoretical minimum of k = 4 mol electron equivalents must be produced through linear electron flux when there are no alternative energy sinks (Baker, 2008).
One possible explanation for loss of ϕCO2 max, abs without reduced 1/k is that lower canopy leaves in the plot centre did have increased alternative sinks, but these were not detected by the leaf fluorescence measurements. One caveat of PSII fluorescence is that the signal is primarily obtained from PSII closest to the leaf surface, with less contribution from PSII deeper in the leaf. Therefore 1/k is obtained from A throughout the entire leaf cross-section, and J obtained from PSII fluorescence at the leaf surface. If alternative energy sinks diverted NADPH and ATP from deeper PSII, this could result in a decrease of ϕCO2 max, abs without an apparent effect to 1/k. Additionally, 1/k only measures the partitioning toward A of NADPH and ATP produced through linear electron flux. ATP can also be produced through cyclic electron flux around PSI, a process which bypasses PSII and produces only ATP (von Caemmerer, 2000). Alternative energy sinks for the ATP produced through cyclic electron flux would not be reflected in 1/k, since 1/k is based on the photochemical efficiency of PSII and not PSI. For instance, shaded leaves of field-grown M. x giganteus show signs of increased leakage of CO2 from bundle-sheath cells, which should incur additional ATP consumption to power C4 overcycling of CO2 (Kromdijk et al., 2008). However, C4 NADP-ME grasses including Z. mays showed increased photon partitioning to PSI, but no significant change in cyclic electron flux, when grown in the shade (Ver Sagun et al., 2019).
ϕCO2 max, abs measured in non-stressed conditions is typically well conserved across various species (Long et al., 1993). Surprisingly, here Z. mays showed ϕCO2 max, abs 23% greater than M. x giganteus. This may be explained in part by the greater Fv/Fm and 1/k in Z. mays relative to M. x giganteus. In previous measurements on nearby plots of the same species, ϕCO2 max, abs of M. x giganteus and Z. mays were within just 9% of one another (Pignon et al., 2017), suggesting the greater inter-species difference observed here may be an effect of different location or growing season.
Potential Effects of Breeding and Management on Maximum Quantum Yield of CO2 Assimilation
These results raise the question of why such productive crops show a maladaptive acclimation to shade. Zea mays in particular is being grown at ever greater densities (Lobell et al., 2014), resulting in increased leaf area indices and self-shading, but these high densities are a recent construct of cultivation. The ancestors of cultivated Z. mays grew largely as isolated plants in semi-arid and nutrient limited environments, such that they would have evolved as plants in which most or all leaves were exposed to full sunlight and shading was rare. Similarly, Miscanthus spp. often occur as single tall clumps, standing above surrounding plants and so too would experience relatively little shading, compared to field production stands. Having evolved as sun plants, there may have been insufficient time for them to adapt to the recent production in dense stands.
Although both species are part of the same C4 evolutionary clade, modern Z. mays hybrids have been subject to centuries of selection for productivity, which has been particularly intense in the last 50 years, while M. x giganteus is only just emerging as a crop. This may suggest that there is variability that could be selected to overcome this significant Achilles heel in this important group of crops. Z. mays is considered to have diverged in the evolution of the Andropogoneae before divergence of the genera Saccharum, Sorghum and Miscanthus (Kim et al., 2014; Singh et al., 2019). The occurrence of this maladaptation in both Z. mays and M. x giganteus suggests that the major crops sorghum and sugarcane are likely similarly affected. Given that Z. mays accounts for more cereal grain than any other crop globally, overcoming this maladaptation to shade would contribute very significantly toward meeting the 60% increase in food demand anticipated for mid-century (Long et al., 2015; FAO, 2017).
Data Availability Statement
All original data is freely available without restrictions from the Illinois Data Bank, 10.13012/B2IDB-4821336_V1.
Author Contributions
RC and ER collected the physiological data and wrote the manuscript. CP supervised the experiment, performed the statistical analysis, and assisted in manuscript writing. SL conceived the experiment and assisted in manuscript writing.
Funding
This work was supported by the project Realizing Increased Photosynthetic Efficiency that is funded by the Bill & Melinda Gates Foundation, the Foundation for Food and Agriculture Research, and the UK Department for International Development (UK Aid) under grant number OPP1172157.
Conflict of Interest
The authors declare that the research was conducted in the absence of any commercial or financial relationships that could be construed as a potential conflict of interest.
Acknowledgments
We thank Prof. Andrew Leakey for his support.
Supplementary Material
The Supplementary Material for this article can be found online at: https://www.frontiersin.org/articles/10.3389/fpls.2020.00783/full#supplementary-material
References
Baker, N. R. (2008). Chlorophyll fluorescence: a probe of photosynthesis in vivo. Annu. Rev. Plant Biol. 59, 89–113. doi: 10.1146/annurev.arplant.59.032607.092759
Baker, N. R., Long, S. P., and Ort, D. R. (1988). Photosynthesis and temperature, with particular reference to effects on quantum yield. Symp. Soc. Exp. Biol. 42, 347–375.
Bellasio, C., and Griffiths, H. (2014). Acclimation of C4 metabolism to low light in mature maize leaves could limit energetic losses during progressive shading in a crop canopy. J. Exp. Bot. 65, 3725–3736. doi: 10.1093/jxb/eru052
Beyschlag, W., Barnes, P. W., Ryel, R., Caldwell, M. M., and Flint, S. D. (1990). Plant competition for light analyzed with a multispecies canopy model.2. Influence of photosynthetic characteristics on mixtures of wheat and wild oat. Oecologia 82, 374–380. doi: 10.1007/bf00317486
Boardman, N. K. (1977). Comparative photosynthesis of sun and shade plants. Annu. Rev. Plant Physiol. 28, 355–377. doi: 10.1146/annurev.pp.28.060177.002035
Chen, A., Lichstein, J. W., Osnas, J. L. D., and Pacala, S. W. (2014). Species-independent down-regulation of leaf photosynthesis and respiration in response to shading: evidence from six temperate tree species. PLoS One 9:e91798. doi: 10.1371/journal.pone.0091798
Christin, P. A., Samaritani, E., Petitpierre, B., Salamin, N., and Besnard, G. (2009). Evolutionary Insights on C4 Photosynthetic Subtypes in Grasses from Genomics and Phylogenetics. Genome Biol. Evol. 1, 221–230. doi: 10.1093/gbe/evp020
Delatorre, A., Delgado, B., and Lara, C. (1991). nitrate-dependent O2 evolution in intact leaves. Plant Physiol. 96, 898–901. doi: 10.1104/pp.96.3.898
D’Odorico, P., Emmel, C., Revill, A., Liebisch, F., Eugster, W., and Buchmann, N. (2018). Vertical patterns of photosynthesis and related leaf traits in two contrasting agricultural crops. Funct. Plant Biol. 46, 213–227.
Ehleringer, J., and Bjorkman, O. (1977). Quantum yields for CO2 uptake in C3 and C4 plants - dependence on temperature, CO2, and O2 concentration. Plant Physiol. 59, 86–90. doi: 10.1104/pp.59.1.86
FAO (2017). The Future of Food and Agriculture Trends and Challenges. Rome: Food and Agriculture Organisation.
FAOSTAT (2017). Database Collection of the Food and Agriculture Organization of the United Nations. Rome: FAO.
Givnish, T. J. (1988). Adaptation to sun and shade - a whole-plant perspective. Austr. J. Plant Physiol. 15, 63–92.
Hadebe, S. T., Modi, A. T., and Mabhaudhi, T. (2017). Drought tolerance and water use of cereal crops: a focus on sorghum as a food security crop in Sub-Saharan Africa. J. Agron. Crop Sci. 203, 177–191. doi: 10.1111/jac.12191
Heaton, E. A., Dohleman, F. G., and Long, S. P. (2008). Meeting US biofuel goals with less land: the potential of Miscanthus. Glob. Chang. Biol. 14, 2000–2014. doi: 10.1111/j.1365-2486.2008.01662.x
Hikosaka, K., Noguchi, K., and Terashima, I. (2016). “Modeling leaf gas exchange,” in Canopy Photosynthesis: From Basics to Applications, Vol. 42, eds K. Hikosaka, U. Niinemets, and N. P. R. Anten (Dordrecht: Springer), 60–99.
Hikosaka, K., and Terashima, I. (1995). A model of the acclimation of photosynthesis in the leaves of C3 plants to sun and shade with respect to nitrogen use. Plant Cell Environ. 18, 605–618. doi: 10.1111/j.1365-3040.1995.tb00562.x
Hoyaux, J., Moureaux, C., Tourneur, D., Bodson, B., and Aubinet, M. (2008). Extrapolating gross primary productivity from leaf to canopy scale in a winter wheat crop. Agric. Forest Meteorol. 148, 668–679. doi: 10.1016/j.agrformet.2007.11.010
Joo, E., Zeri, M., Hussain, M. Z., Delucia, E. H., and Bernacchi, C. J. (2017). Enhanced evapotranspiration was observed during extreme drought from Miscanthus, opposite of other crops. Glob. Chang. Biol. Bioenergy 9, 1306–1319. doi: 10.1111/gcbb.12448
Kim, C., Wang, X. Y., Lee, T. H., Jakob, K., Lee, G. J., and Paterson, A. H. (2014). Comparative analysis of Miscanthus and Saccharum reveals a shared whole-genome duplication but different evolutionary fates. Plant Cell 26, 2420–2429. doi: 10.1105/tpc.114.125583
Kromdijk, J., Schepers, H. E., Albanito, F., Fitton, N., Carroll, F., Jones, M. B., et al. (2008). Bundle sheath leakiness and light limitation during C4 leaf and canopy CO2 uptake. Plant Physiol. 148, 2144–2155. doi: 10.1104/pp.108.129890
Kubasek, J., Urban, O., and Santrucke, J. (2013). C4 plants use fluctuating light less efficiently than do C3 plants: a study of growth, photosynthesis and carbon isotope discrimination. Physiol. Plant 149, 528–539. doi: 10.1111/ppl.12057
Leakey, A. D. B., Uribelarrea, M., Ainsworth, E. A., Naidu, S. L., Rogers, A., Ort, D. R., et al. (2006). Photosynthesis, productivity, and yield of maize are not affected by open-air elevation of CO2 concentration in the absence of drought. Plant Physiol. 140, 779–790. doi: 10.1104/pp.105.073957
LeBauer, D., Kooper, R., Mulrooney, P., Rohde, S., Wang, D., Long, S. P., et al. (2018). BETYdb: a yield, trait, and ecosystem service database applied to second-generation bioenergy feedstock production. Glob. Chang. Biol. Bioenergy 10, 61–71. doi: 10.1111/gcbb.12420
Lobell, D. B., Roberts, M. J., Schlenker, W., Braun, N., Little, B. B., Rejesus, R. M., et al. (2014). Greater sensitivity to drought accompanies maize yield increase in the US midwest. Science 344, 516–519. doi: 10.1126/science.1251423
Long, S. P. (1993). The Significance of Light-limiting Photosynthesis to Crop Canopy Carbon Gain and Productivity—A Theoretical Analysis. Dordrecht: Springer.
Long, S. P., Marshall-Colon, A., and Zhu, X. G. (2015). Meeting the global food demand of the future by engineering crop photosynthesis and yield potential. Cell 161, 56–66. doi: 10.1016/j.cell.2015.03.019
Long, S. P., Postl, W. F., and Bolharnordenkampf, H. R. (1993). Quantum yields for uptake of carbon-dioxide in C3 vascular plants of contrasting habitats and taxonomic groupings. Planta 189, 226–234.
Loriaux, S. D., Avenson, T. J., Welles, J. M., McDermitt, D. K., Eckles, R. D., Riensche, B., et al. (2013). Closing in on maximum yield of chlorophyll fluorescence using a single multiphase flash of sub-saturating intensity. Plant Cell Environ. 36, 1755–1770. doi: 10.1111/pce.12115
Lu, C. M., and Zhang, J. H. (2000). Photosynthetic CO2 assimilation, chlorophyll fluorescence and photoinhibition as affected by nitrogen deficiency in maize plants. Plant Sci. 151, 135–143. doi: 10.1016/s0168-9452(99)00207-1
Marchiori, P. E. R., Machado, E. C., and Ribeiro, R. V. (2014). Photosynthetic limitations imposed by self-shading in field-grown sugarcane varieties. Field Crops Res. 155, 30–37. doi: 10.1016/j.fcr.2013.09.025
Niinemets, U. (2016a). Leaf age dependent changes in within-canopy variation in leaf functional traits: a meta-analysis. J. Plant Res. 129, 313–338. doi: 10.1007/s10265-016-0815-2
Niinemets, U. (2016b). “Within-canopy variations in functional leaf traits: structural, chemical and ecological controls and diversity of responses,” in Canopy Photosynthesis: From Basics to Applications, Vol. 42, eds K. Hikosaka, U. Niinemets, and N. P. R. Anten (Dordrecht: Springer), 101–141. doi: 10.1007/978-94-017-7291-4_4
Osborne, C. P., Wythe, E. J., Ibrahim, D. G., Gilbert, M. E., and Ripley, B. S. (2008). Low temperature effects on leaf physiology and survivorship in the C3 and C4 subspecies of Alloteropsis semialata. J. Exp. Bot. 59, 1743–1754. doi: 10.1093/jxb/ern062
Pearcy, R. W. (1990). Sunflecks and photosynthesis in plant canopies. Annu. Rev. Plant Physiol. Plant Mol. Biol. 41, 421–453. doi: 10.1146/annurev.pp.41.060190.002225
Perez, R. P. A., Dauzat, J., Pallas, B., Lamour, J., Verley, P., Caliman, J. P., et al. (2018). Designing oil palm architectural ideotypes for optimal light interception and carbon assimilation through a sensitivity analysis of leaf traits. Ann. Bot. 121, 909–926. doi: 10.1093/aob/mcx161
Pignon, C. P., Jaiswal, D., McGrath, J. M., and Long, S. P. (2017). Loss of photosynthetic efficiency in the shade. An achilles heel for the dense modern stands of our most productive C4 crops? J. Exper. Bot. 68, 335–345. doi: 10.1093/jxb/erw456
Sage, R. F., and McKown, A. D. (2006). Is C4 photosynthesis less phenotypically plastic than C3 photosynthesis? J. Exper. Bot. 57, 303–317. doi: 10.1093/jxb/erj040
Sales, C. R. G., Ribeiro, R. V., Hayashi, A. H., Marchiori, P. E. R., Silva, K. I., Martins, M. O., et al. (2018). Flexibility of C4 decarboxylation and photosynthetic plasticity in sugarcane plants under shading. Environ. Exp. Bot. 149, 34–42. doi: 10.1016/j.envexpbot.2017.10.027
San, N. S., Ootsuki, Y., Adachi, S., Yamamoto, T., Ueda, T., Tanabata, T., et al. (2018). A near-isogenic rice line carrying a QTL for larger leaf inclination angle yields heavier biomass and grain. Field Crops Res. 219, 131–138. doi: 10.1016/j.fcr.2018.01.025
Sattin, M., Zuin, M. C., and Sartorato, I. (1994). Light quality beneath field-grown maize, soybean and wheat canopies - red-far red variations. Physiol. Plant 91, 322–328. doi: 10.1034/j.1399-3054.1994.910230.x
Singh, R. B., Singh, B., and Singh, R. K. (2019). Cross-taxon transferability of sugarcane expressed sequence tags derived microsatellite (EST-SSR) markers across the related cereal grasses. J. Plant Biochem. Biotechnol. 28, 176–188. doi: 10.1007/s13562-019-00502-6
Slattery, R. A., Grennan, A. K., Sivaguru, M., Sozzani, R., and Ort, D. R. (2016). Light sheet microscopy reveals more gradual light attenuation in light-green versus dark-green soybean leaves. J. Exp. Bot. 67, 4697–4709. doi: 10.1093/jxb/erw246
Smith, C. M., David, M. B., Mitchell, C. A., Masters, M. D., Anderson-Teixeira, K. J., Bernacchi, C. J., et al. (2013). Reduced nitrogen losses after conversion of row crop agriculture to perennial biofuel crops. J. Environ. Qual. 42, 219–228. doi: 10.2134/jeq2012.0210
Sonawane, B. V., Sharwood, R. E., Whitney, S., and Ghannoum, O. (2018). Shade compromises the photosynthetic efficiency of NADP-ME less than that of PEP-CK and NAD-ME C4 grasses. J. Exp. Bot. 69, 3053–3068. doi: 10.1093/jxb/ery129
Tazoe, Y., Hanba, Y. T., Furumoto, T., Noguchi, K., and Terashima, I. (2008). Relationships between quantum yield for CO2 assimilation, activity of key enzymes and CO2 leakiness in Amaranthus cruentus, a C4 dicot, grown in high or low light. Plant Cell Physiol. 49, 19–29. doi: 10.1093/pcp/pcm160
Ver Sagun, J., Badger, M. R., Chow, W. S., and Ghannoum, O. (2019). Cyclic electron flow and light partitioning between the two photosystems in leaves of plants with different functional types. Photosynth. Res. 142, 321–334.
von Caemmerer, S. (2000). “Modelling C4 photosynthesis,” in Biochemical Models of Leaf Photosynthesis, ed. S. Von Caemmerer (Collingwood: CSIRO Publishing), 91–122.
von Caemmerer, S., and Farquhar, G. D. (1981). Some relationships between the biochemistry of photosynthesis and the gas exchange of leaves. Planta 153, 376–387. doi: 10.1007/bf00384257
Walker, B. J., Drewry, D. T., Slattery, R. A., VanLoocke, A., Cho, Y. B., and Ort, D. R. (2018). Chlorophyll can be reduced in crop canopies with little penalty to photosynthesis. Plant Physiol. 176, 1215–1232. doi: 10.1104/pp.17.01401
Welker, C. A. D., Kellogg, E. A., and Prado, J. (2014). Andropogoneae versus Sacchareae (Poaceae: Panicoideae): the end of a great controversy. Taxon 63, 643–646. doi: 10.12705/633.5
Yabiku, T., and Ueno, O. (2019). Structural and photosynthetic re-acclimation to low light in C4 maize leaves that developed under high light. Ann. Bot. 124, 437–445. doi: 10.1093/aob/mcz092
Yin, X., Belay, D., van der Putten, P., and Struik, P. (2014). Accounting for the decrease of photosystem photochemical efficiency with increasing irradiance to estimate quantum yield of leaf photosynthesis. Photosynth. Res. 122, 323–335. doi: 10.1007/s11120-014-0030-8
Yin, X. Y., and Struik, P. C. (2012). Mathematical review of the energy transduction stoichiometries of C4 leaf photosynthesis under limiting light. Plant Cell Environ. 35, 1299–1312. doi: 10.1111/j.1365-3040.2012.02490.x
Zhu, X.-G., Long, S. P., and Ort, D. R. (2008). What is the maximum efficiency with which photosynthesis can convert solar energy into biomass? Curr. Opin. Biotechnol. 19, 153–159. doi: 10.1016/j.copbio.2008.02.004
Keywords: C4 photosynthesis, canopy, bioenergy, food security, quantum yield, shade acclimation, photosynthetic light-use efficiency, leaf aging
Citation: Collison RF, Raven EC, Pignon CP and Long SP (2020) Light, Not Age, Underlies the Maladaptation of Maize and Miscanthus Photosynthesis to Self-Shading. Front. Plant Sci. 11:783. doi: 10.3389/fpls.2020.00783
Received: 19 March 2020; Accepted: 18 May 2020;
Published: 24 June 2020.
Edited by:
Florian A. Busch, Australian National University, AustraliaReviewed by:
Paulo Eduardo Ribeiro Marchiori, Universidade Federal de Lavras, BrazilElias Kaiser, Wageningen University & Research, Netherlands
Copyright © 2020 Collison, Raven, Pignon and Long. This is an open-access article distributed under the terms of the Creative Commons Attribution License (CC BY). The use, distribution or reproduction in other forums is permitted, provided the original author(s) and the copyright owner(s) are credited and that the original publication in this journal is cited, in accordance with accepted academic practice. No use, distribution or reproduction is permitted which does not comply with these terms.
*Correspondence: Stephen P. Long, slong@illinois.edu