 Anupma Sharma1
 Jinjin Song2
 Qingfan Lin1
 Ratnesh Singh1Ninfa Ramos3
 Kai Wang2
 Jisen Zhang2
 Ray Ming2,4
 Qingyi Yu1,2,5*
- 1Texas A&M AgriLife Research and Extension Center at Dallas, Texas A&M University System, Dallas, TX, United States
- 2FAFU and UIUC-SIB Joint Center for Genomics and Biotechnology, Fujian Provincial Key Laboratory of Haixia Applied Plant Systems Biology, Key Laboratory of Genetics, Breeding and Multiple Utilization of Crops, Ministry of Education, Haixia Institute of Science and Technology, College of Life Science, Fujian Agriculture and Forestry University, Fuzhou, China
- 3Texas A&M AgriLife Research Center at Weslaco, Texas A&M University System, Weslaco, TX, United States
- 4Department of Plant Biology, University of Illinois at Urbana–Champaign, Urbana, IL, United States
- 5Department of Plant Pathology and Microbiology, Texas A&M University, College Station, TX, United States
Sugarcane (Saccharum spp. hybrids) is an economically important crop widely grown in tropical and subtropical regions for sugar and ethanol production. However, the large genome size, high ploidy level, interspecific hybridization and aneuploidy make sugarcane one of the most complex genomes and have long hampered genome research in sugarcane. Modern sugarcane cultivars are derived from interspecific hybridization between S. officinarum and S. spontaneum with 80–90% of the genome from S. officinarum and 10–20% of the genome from S. spontaneum. We constructed bacterial artificial chromosome (BAC) libraries of S. officinarum variety LA Purple (2n = 8x = 80) and S. spontaneum haploid clone AP85-441 (2n = 4x = 32), and selected and sequenced 97 BAC clones from the two Saccharum BAC libraries. A total of 5,847,280 bp sequence from S. officinarum and 5,011,570 bp from S. spontaneum were assembled and 749 gene models were annotated in these BACs. A relatively higher gene density and lower repeat content were observed in S. spontaneum BACs than in S. officinarum BACs. Comparative analysis of syntenic regions revealed a high degree of collinearity in genic regions between Saccharum and Sorghum bicolor and between S. officinarum and S. spontaneum. In the syntenic regions, S. spontaneum showed expansion relative to S. officinarum, and both S. officinarum and S. spontaneum showed expansion relative to sorghum. Among the 75 full-length LTR retrotransposons identified in the Saccharum BACs, none of them are older than 2.6 mys and no full-length LTR elements are shared between S. officinarum and S. spontaneum. In addition, divergence time estimated using a LTR junction marker and a syntenic gene shared by 3 S. officinarum and 1 S. spontaneum BACs revealed that the S. spontaneum intergenic region was distant to those from the 3 homologous regions in S. officinarum. Our results suggested that S. officinarum and S. spontaneum experienced at least two rounds of independent polyploidization in each lineage after their divergence from a common ancestor.
Introduction
Sugarcane (Saccharum spp. hybrids) produces approximately 80% of the world’s sugar production and is also an important source of biomass. Due to its high productivity, sugarcane is used as biorefineries for the production of biomass, bioenergy and biomaterials (Botha and Moore, 2014; Gómez-Merino et al., 2014). Sugarcane belongs to the genus Saccharum that was traditionally divided into six species, two wild species S. spontaneum and S. robustum, and four cultivated species S. officinarum, S. edule, S. barberi, and S. sinense (Zhang et al., 2013). However, as originally proposed by Irvine (1999), recent evidence based on morphological, cytological and population structure supported the classification of genus Saccharum into two horticultural species, S. spontaneum and S. officinarum, of which the latter one includes the other four Saccharum species and their interspecific hybrids (Zhang et al., 2013). Saccharum spp. and Sorghum bicolor belong to the grass tribe Andropogoneae in the subfamily Panicoideae. Within the tribe Andropogoneae, Saccharum, Miscanthus, Erianthus, Narenga, and Sclerostachya form a closely related interspecific breeding group - commonly known as the ‘Saccharum complex.’
Saccharum officinarum (2n = 80) has high sugar content and low fiber, but poor disease resistance. S. spontaneum (2n = 36–128) is a low sugar, high fiber, disease-resistant species. Modern sugarcane cultivars are mainly derived from interspecific hybridization between S. officinarum and S. spontaneum to combine high sugar content from S. officinarum and disease resistance from S. spontaneum. Modern sugarcane hybrids are complex polyploids and aneuploids (2n = 80–140) and are comprised of 70–80% of chromosomes from S. officinarum, 10–20% from S. spontaneum, and 10% recombinants (D’Hont et al., 1996). The uneven progenitor genome contribution in the interspecific hybrids of sugarcane is due to a phenomenon called female restitution, wherein chromosome transmission is 2n from the female parent S. officinarum and n from the male parent S. spontaneum (Bremer, 1961).
Whole genome duplication (polyploidy) is common in plants and has been linked to rapid speciation and adaption (Otto and Whitton, 2000; Soltis et al., 2009; Van de Peer et al., 2017). Polyploids are classified as autopolyploids, allopolyploids, or segmental allopolyploids (Stebbins, 1947). Autopolyploids arise via whole genome duplication within the same species; allopolyploids arise via hybridization between two different species with concominant genome doubling; and segmental allopolyploids carry two partially differentiated genomes (Stebbins, 1947). Multiple rounds of ancient (paleo) and/or recent polyploidization events are evident in most angiosperm genomes (Soltis et al., 2009; Jiao and Paterson, 2014). Polyploidization is typically followed by genomic reorganization/fractionation that over time returns the genome to diploid state (Langham et al., 2004; Adams and Wendel, 2005). All the species in the genus Saccharum are polyploid and there is no related diploid or tetraploid progenitors known. Despite high ploidy, Saccharum species form mainly bivalents at meiosis, and display varying degrees of polysomy and preferential pairing among chromosomes. S. robustum shows high proportion of preferential pairing, S. officinarum shows some preferential pairing, S. spontaneum shows no preferential pairing, and the hybrids of S. officinarum and S. spontaneum display a continuous range of pairing affinities between chromosomes (D’Hont et al., 2008).
Assumption of molecular clock is useful for estimation of divergence time between species by comparing the divergence between genomic features such as genes and/or TEs. However, many factors contribute to the variation in molecular date estimates including the uncertainty in the absolute age of the evolutionary event used to calibrate the molecular clock, the use of different genes or genomic regions that may be under different selective constraints, and different methods used to estimate divergence times (Gaut et al., 1996; Gaut, 2002). The average synonymous substitution rate obtained from the grass adh1/2 alleles (6.5 × 10⁻⁹ per site per year) estimated by assuming the maize–rice divergence time of 50 million years (mys) (Gaut et al., 1996) is commonly employed to estimate the divergence time in grasses. And, a two-fold higher substitution rate of 1.3 × 10⁻⁸ mutations per site per year is commonly used to estimate the insertion time of LTR retrotransposons (Ma and Bennetzen, 2004).
The polyploidization and divergence history of Saccharum lineage remains poorly understood. The octaploid sugarcane genome has experienced two rounds of whole genome duplication since its divergence from sorghum, and is thus, an ideal system to study the impact of polyploidy on speciation, subgenome divergence and genomic adaption to the duplicated state (Kim et al., 2014). Recent studies have variably estimated the divergence time of sugarcane and sorghum (Jannoo et al., 2007; Wang et al., 2010; Kim et al., 2014; Vilela et al., 2017) and different models have been proposed for the type and time of polyploidy in sugarcane (Kim et al., 2014; Vilela et al., 2017). Kim et al. (2014) proposed that an allopolyploidy in the common ancestor of Miscanthus-Saccharum resulted in the divergence of Saccharinae and Sorghinae subtribes, and subsequent Saccharum-specific autopolyploidy resulted in random chromosome pairing within a group but infrequent pairing between groups. Although this scenario explains preferential pairing observed in S. officinarum, it does not explain no preferential pairing in S. spontaneum. Vilela et al. (2017) suggested that S. officinarum and S. spontaneum lineages each experienced independent autopolyploidization after their divergence. Further research is still needed to fully understand the polyploidization and divergence history of sugarcane.
The large genome size, high ploidy level, interspecific hybridization and aneuploidy make sugarcane one of the most complex genomes and have long hampered genome research in sugarcane. The two sugarcane progenitors, S. officinarum and S. spontaneum are an ideal genomic resource to infer evolutionary history of the genus Saccharum, as well as to study the complex mechanisms leading to the superior productivity of sugarcane cultivars. In this study, we selected and sequenced homo/homeologous BACs from S. officinarum and S. spontaneum BAC libraries, and conducted comparative analysis to assess variation in genome size, and mode and time of divergence between Saccharum and sorghum, and between the modern sugarcane progenitor species, S. spontaneum and S. officinarum.
Materials and Methods
Construction of Saccharum officinarum and Saccharum spontaneum BAC Libraries
Young leaf tissue was harvested from Saccharum officinarum variety LA Purple (2n = 8X = 80) and S. spontaneum haploid clone AP85–441 (2n = 4X = 32) and used for nuclei extraction. Nuclei was isolated following the protocol described by Ming et al. (2001). The high molecular weight DNA was extracted from nuclei and then embedded in agarose and partially digested with Hind III. The fraction at approximately 120 kb was recovered and cloned into Hind III linearized pSMART BAC vector (Lucigen)1. A total of 76,800 colonies for LA Purple and 38,400 colonies for AP85-441 were archived in 384-well plates with freezing medium. BAC clones were spotted onto high-density nylon filters (Performa II Nylon Filters, Genetix) using Q-Pix2 (Genetix) for hybridization screening.
Screening the BAC Libraries
PCR primers targeting the genes involved in sucrose, lignin, and cellulose biosynthesis pathways were designed using Primer Premier 5 software2 and used for RT-PCR amplification. PCR products were purified using Wizard® SV Gel and PCR Clean-Up System (Promega) and used as probes to screen the BAC libraries. Hybridization screening of the BAC libraries was performed using the method described by Yu et al. (2011). High-density membranes of the BAC libraries were prehybridized in 0.5 M Na2HPO4, 7% SDS, 1 mM EDTA, 100 μg ml-1 heat-denatured herring sperm DNA for at least 4 h. Probes were labeled using a random primer labeling system (NEBlot Kit, New England Biolabs). The hybridization was performed overnight at 55°C in 0.5 M Na2HPO4, 7% SDS, 1 mM EDTA, 100 μg ml-1 heat-denatured herring sperm DNA with 32P-labeled probes. Hybridized membranes were washed twice in 0.5 × SSPE/0.5% SDS for 10 min each time.
Verification of BAC Clones
BAC DNA was isolated using the alkaline lysis method and digested with Hind III. The digested DNA samples were electrophoresed through a 0.8% agarose gel. After electrophoresis, the gel was blotted onto Amersham Hybond N+ membranes (GE Healthcare) using standard methods (Sambrook et al., 1987). Southern hybridization was performed using the method described by Yu et al. (2011).
Sequencing BAC Clones and Sequence Assembly
BAC DNA was extracted from selected BAC clones using QIAGEN Large-Construct kit (Qiagen) and used for pyrosequencing on a Roche 454 GS FLX+ Titanium platform at Texas A&M AgriLife Genomics & Bioinformatics Service. Each BAC clone was labeled with a unique multiplex identifier and every 12 BACs were pooled at equal amount and sequenced on one region of a four-gasket sequencing run.
The sequence reads were assembled using Newbler with default parameter settings. Sequence reads matching the Escherichia coli genome and the BAC vector were removed and trimmed. The sequence gaps were filled by primer walking and/or directly sequencing PCR products when possible.
Sugarcane Repeat Database and Estimation of Repeat Content
We used both de novo and structure-based approaches to identify high-copy number repeats in the 475 sugarcane BACs, including the BACs assembled in this study and 378 sugarcane BACs downloaded from GenBank. The BACs downloaded from GenBank included 2 BACs of AP85-441 (S. spontaneum), 4 BACs of LA Purple (S. officinarum), and 372 BACs of the modern sugarcane cultivar R570 (an interspecific hybrid between S. officinarum and S. spontaneum) (Supplementary Table S1). The TEdenovo pipeline from the REPET package (Flutre et al., 2011) and RepeatModeler (Smit and Hubley, 2008) were used to de novo predict sugarcane repeats by an all-by-all comparison with default parameters. Among the de novo identified repeats that were classified as chimeric or SSR by the TEdenovo, those with less than 10 copies (at 80% coverage threshold) in the sugarcane BACs and those with matches to repeat-masked plant CDS sequences were filtered. Finally, we used ProtExcluder3 to remove protein coding genes from repeat library by mapping putative repeats against the plant protein database where transposon proteins were excluded4. In addition, LTR_finder (Xu and Wang, 2007) was used to predict full-length LTR retrotransposon and TRIMs. MITE_hunter (Han and Wessler, 2010) was used to generate consensus representative sequences for sugarcane MITEs. All repeats were combined and clustered using VSEARCH (Rognes et al., 2016). The consensus sequences obtained from VSEARCH were then annotated using the RepeatClassifier script of the RepeatModeler package by comparison to the Repbase database (Jurka et al., 2005). The final non-redundant repeat database was made using CD-Hit-EST (Li and Godzik, 2006) at 80% sequence identity. The full-length LTR representatives were classified by comparing their RT domains to the ones of the classified sugarcane LTR retrotransposons (Domingues et al., 2012) and to the Gypsy Database 2.0 (Llorens et al., 2011). The repeat content of the Saccharum BACs was estimated by RepeatMasker (Smit et al., 1996) using the custom sugarcane repeat database.
Gene Model Prediction and Annotation
We used MAKER (Cantarel et al., 2008) to annotate genes in the assembled Saccharum BACs. The gene models were predicted based on the combined available evidence based on matches to the repeat database, EST/cDNA, and proteins, as well as predictions by ab initio gene prediction programs. The repeats database included the MIPS Repeat Element Database (mips-REdat)5 (Nussbaumer et al., 2013), the Repbase repeat database6 (Jurka et al., 2005) and the sugarcane repeats identified in this study. The transcript evidence included five RNAseq assemblies and the in-house sugarcane ESTs. The protein evidence included the plant protein database from the ProtExcluder package and plant proteins downloaded from Phytozome (Goodstein et al., 2012). Gene predictors, SNAP (Korf, 2004) using O. sativa hmm parameter and AUGUSTUS (Stanke et al., 2006) using maize hmm parameter, were run within MAKER on both masked and unmasked sequence and gene models with the best AED score per locus was selected. Gene models with evidence support (AED score > 1) or PFAM domains with default parameters in InterProScan were selected. The gene models were then annotated based on homology to the UniRef90 protein database (Suzek et al., 2007).
Estimation of Insertion Time of Full Length LTR Retrotransposon Elements
The full-length LTR retrotransposons were identified based on full-length matches to the LTR consensus sequences using BLAST. The pairwise alignment between 5′ and 3′ LTR of each copy was generated by BLAST2seq. Pairwise alignments were conducted to estimate the number of base substitutions per site based on the Kimura 2-parameter model using MEGA7 (Kumar et al., 2016). The divergence time was estimated using the mutation rate of 1.3 × 10⁻⁸ mutations per site per year (Ma and Bennetzen, 2004). We used junctions formed at the LTR insertion sites as markers (Luce et al., 2006) to identify shared insertion sites between and within S. officinarum and S. spontaneum. Up to 2 kb of the shared TE sequence (smaller than 2 kb in case of truncation) at the junction site was used for estimation of sequence divergence between paired BACs using the mutation rate of 1.3 × 10⁻⁸ mutations per site per year (Ma and Bennetzen, 2004).
Identification of Syntenic Gene Pairs and Calculation of the Ka/Ks Values
The BAC sequences were uploaded to COGE. SynMap2 at CoGe (Lyons and Freeling, 2008) was used to identify syntenic gene pairs between sorghum and Saccharum species (S. officinarum and S. spontaneum), and between S. officinarum and S. spontaneum. The homologous gene pairs were identified using discontinuous MegaBLAST algorithm and e-value less than 0.001. Relative gene order was used to compute chains of syntenic genes using DAGchainer (Haas et al., 2004), allowing a maximum distance of 30 genes and minimum number of 2 aligned gene pairs. A coverage depth ratio of 1 sorghum to 8 sugarcane genes was used. The pairwise CDS alignments for the syntenic gene pairs were generated using MACSE (Ranwez et al., 2011), and the rate of synonymous (Ks) and non-synonymous (Ka) substitutions for each syntenic gene pair was calculated using the Nei–Gojobori model in MEGA 7.0 (Kumar et al., 2016). The Ks values were converted to divergence times using the average synonymous substitution rate of the grass adh1/2 alleles (6.5 × 10⁻⁹ per site per year) estimated by assuming the maize–rice divergence time of 50 mys (Gaut et al., 1996).
Visualization of Orthologous BACs
The orthologous BACs were visualized using EasyFig (Sullivan et al., 2011). The repeat regions were lower case masked to allow BLAST extension from genes into neighboring shared ancestral repeats and suppress cross matches between other repeat regions.
Results
BAC Library Construction, and Selection and Sequencing BACs
A BAC library of AP85-441 (S. spontaneum, 2n = 4X = 32) and a BAC library of LA Purple (S. officinarum, 2n = 8X = 80) were constructed using Hind III partially digested high-molecular-weight DNA. The BAC library of AP85-441 consists of 38,400 clones and the BAC library of LA Purple consists of 76,800 clones. We randomly picked 120 clones from each library to estimate the average insert size. The average insert size of the BAC library of AP85–441 was estimated at 110 kb and the one of the BAC library of LA Purple was estimated at 120 kb. Since the genome sizes of AP85–441 and LA Purple are 3.36 Gb/2C and 7.66 Gb/2C (Zhang et al., 2012), the BAC libraries of AP85-441 and LA Purple represent approximately 1.26 and 1.20 genome equivalents, respectively.
We used the probes designed for the genes on sucrose, lignin, and cellulose biosynthesis pathways to screen the two Saccharum BAC libraries and selected 53 LA Purple BACs (named with So) and 44 AP85–441 BACs (named with Ss) for sequencing. The total length of the assembled sequence for the 97 BACs is 10,858,850 bp, 5,847,280 bp for the 53 So BACs and 5,011,570 bp for the 43 Ss BACs. These sequences represent approximately 0.08% of the LA purple genome and 0.15% of the AP85–441 genome based on an estimated genome size of 7.66 Gb for LA Purple and 3.36 Gb for AP85–441 (Zhang et al., 2012).
Among the 97 BACs, 79 BACs (41 So BACs and 38 Ss BACs) could be completed by primer walking, and each was assembled into a single contig. Seven BACs (5 So BACs and 2 Ss BACs) were each assembled into two ordered and oriented contigs. Three BACs (2 So BACs and 1 Ss BACs) were each assembled into three ordered but not oriented contigs. The rest 8 BACs (5 So BACs and 3 Ss BACs) were assembled into 7–21 contigs, of which the internal contigs couldn’t be ordered and oriented. Sequence assembly statistics of the 97 BACs was summarized in Supplementary Table S2. The assembled BACs have been deposited in GenBank and the GenBank accession numbers are MH182499-MH182581 and KU685404-KU685417.
Gene Prediction and Annotation
We used MAKER to annotate the Saccharum BACs and obtained 778 gene models that had an Annotation Edit distance (AED) score < 1.00 and/or had a PFAM domain. The AED score measures the congruence between an annotation with its supporting evidence, and ranges from 0 to 1, where value 0 indicates perfect match of annotation to the evidence and value 1 indicates no evidence support of annotation. We filtered 29 gene models that had TE-related PFAM domains and AED value of 1.00. The remaining 749 genes models (401 from Ss BACs and 348 from So BACs) had AED score < 1.00 and/or had a non-TE related PFAM domain. The Ss BACs have a relatively higher gene density (approximately 80 genes per Mb) compared to the So BACs (63 genes per Mb), which is consistent with the lower repeat content in Ss BACs than in So BACs (See details in “Repeat content in selected Saccharum BACs” and Table 1). The functional annotation of gene models was based on sequence similarity search in the UniRef90 database (Supplementary Table S3).
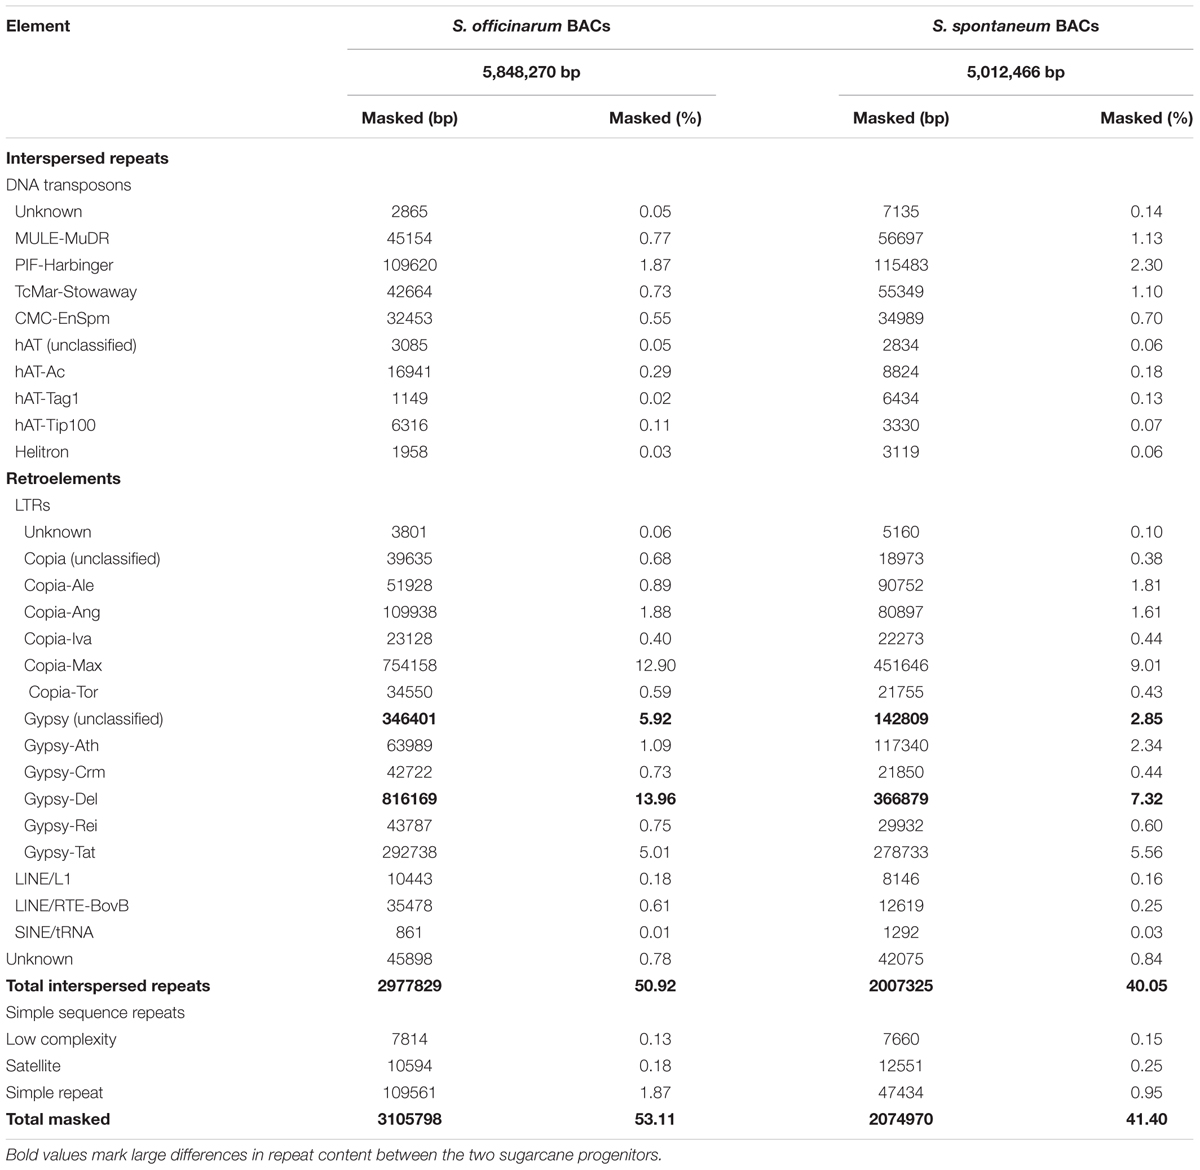
TABLE 1. Summary of repeat content of Saccharum officinarum and Saccharum spontaneum BACs.
Approximately 86% of the gene models in Ss BACs and 89% of the gene models in So BACs had an AED ≤ 0.5 (Supplementary Figure S1). Although six gene models were annotated as TE-related genes, we did not filter them because they could be bona fide expressed TEs as evidenced by their AED scores < 1.00. Thirty-two gene models may be pseudogenes because they had an AED score of 1.00 but contained non-TE related PFAM domains. Twenty-eight gene models with AED < 1.00 might be caused by artifacts or spurious protein alignments as they do not contain a PFAM domain and had an eAED score of 1.00.
Repeat Content in Selected Saccharum BACs
We compiled a custom repeat database for sugarcane and used RepeatMasker to estimate the repeat content in selected Saccharum BACs using the sugarcane repeat library. The So BACs and Ss BACs contain 53 and 41% repetitive sequences, respectively (Table 1). This repeat content may be underestimated because some bona fide repeats may escape detection due to their low copy number in the examined BACs and the repeat consensus sequences may not capture the full range of the repeat sequence variation. Like in other plants, LTR retrotransposons are the most abundant repeat in Saccharum BACs, accounting for 45% of the So BAC sequences and 33% of the Ss BAC sequences. The maximus lineage of the Ty1/Copia type and the Del lineage of the Ty3/Gypsy type elements form the largest fraction of LTR retrotransposon in both So and Ss BACs. In general, So BACs contain a higher total interspersed repeat content and total LTR retrotransposon content than Ss BACs. For the major LTR retrotransposons, a much higher percentage of Max lineage (Copia), Del lineage (Gypsy), and unclassified Gypsy LTR retrotransposons was observed in So BACs than in Ss BACs. Some of the unclassified Gypsy elements are possibly LARD elements that are related to Del.
Identification of Syntenic Regions Between Saccharum and Sorghum and Between S. officinarum and S. spontaneum
We used SynMap to identify syntenic regions between Saccharum and sorghum genomes. Fifty-seven syntenic blocks were identified by mapping 87 Saccharum BACs (45 So and 42 Ss BACs) against sorghum genome based on synteny of 205 So and 227 Ss gene models to the sorghum gene models (Supplementary Table S3). The syntenic regions for seven Saccharum BACs (6 So BACs and 1 Ss BAC) could not be identified by SynMap due to lack of a minimum of two genes syntenic to sorghum genes. We individually BLASTed these 7 Saccharum BACs into sorghum genome and identified seven syntenic blocks of which three have been identified by other Saccharum BACs using SynMap. The map location of the 94 Saccharum BACs on sorghum chromosomes are summarized in Figure 1 and Supplementary Table S3. Based on the map location in sorghum genome, we grouped the 94 Saccharum BACs into 61 homology groups. We further grouped the 61 homology groups into 8 types based on the number of So and Ss BACs mapped to a sorghum syntenic region. The eight types of homology groups were named Sb-2So-2Ss, Sb-3So-1Ss, Sb-2So-0Ss, Sb-2So-1Ss, Sb-1So-2Ss, Sb-0So-1Ss, Sb-1So-1Ss, Sb-1So-0Ss. The detailed information of the 61 homology groups can be found in Supplementary Table S4.
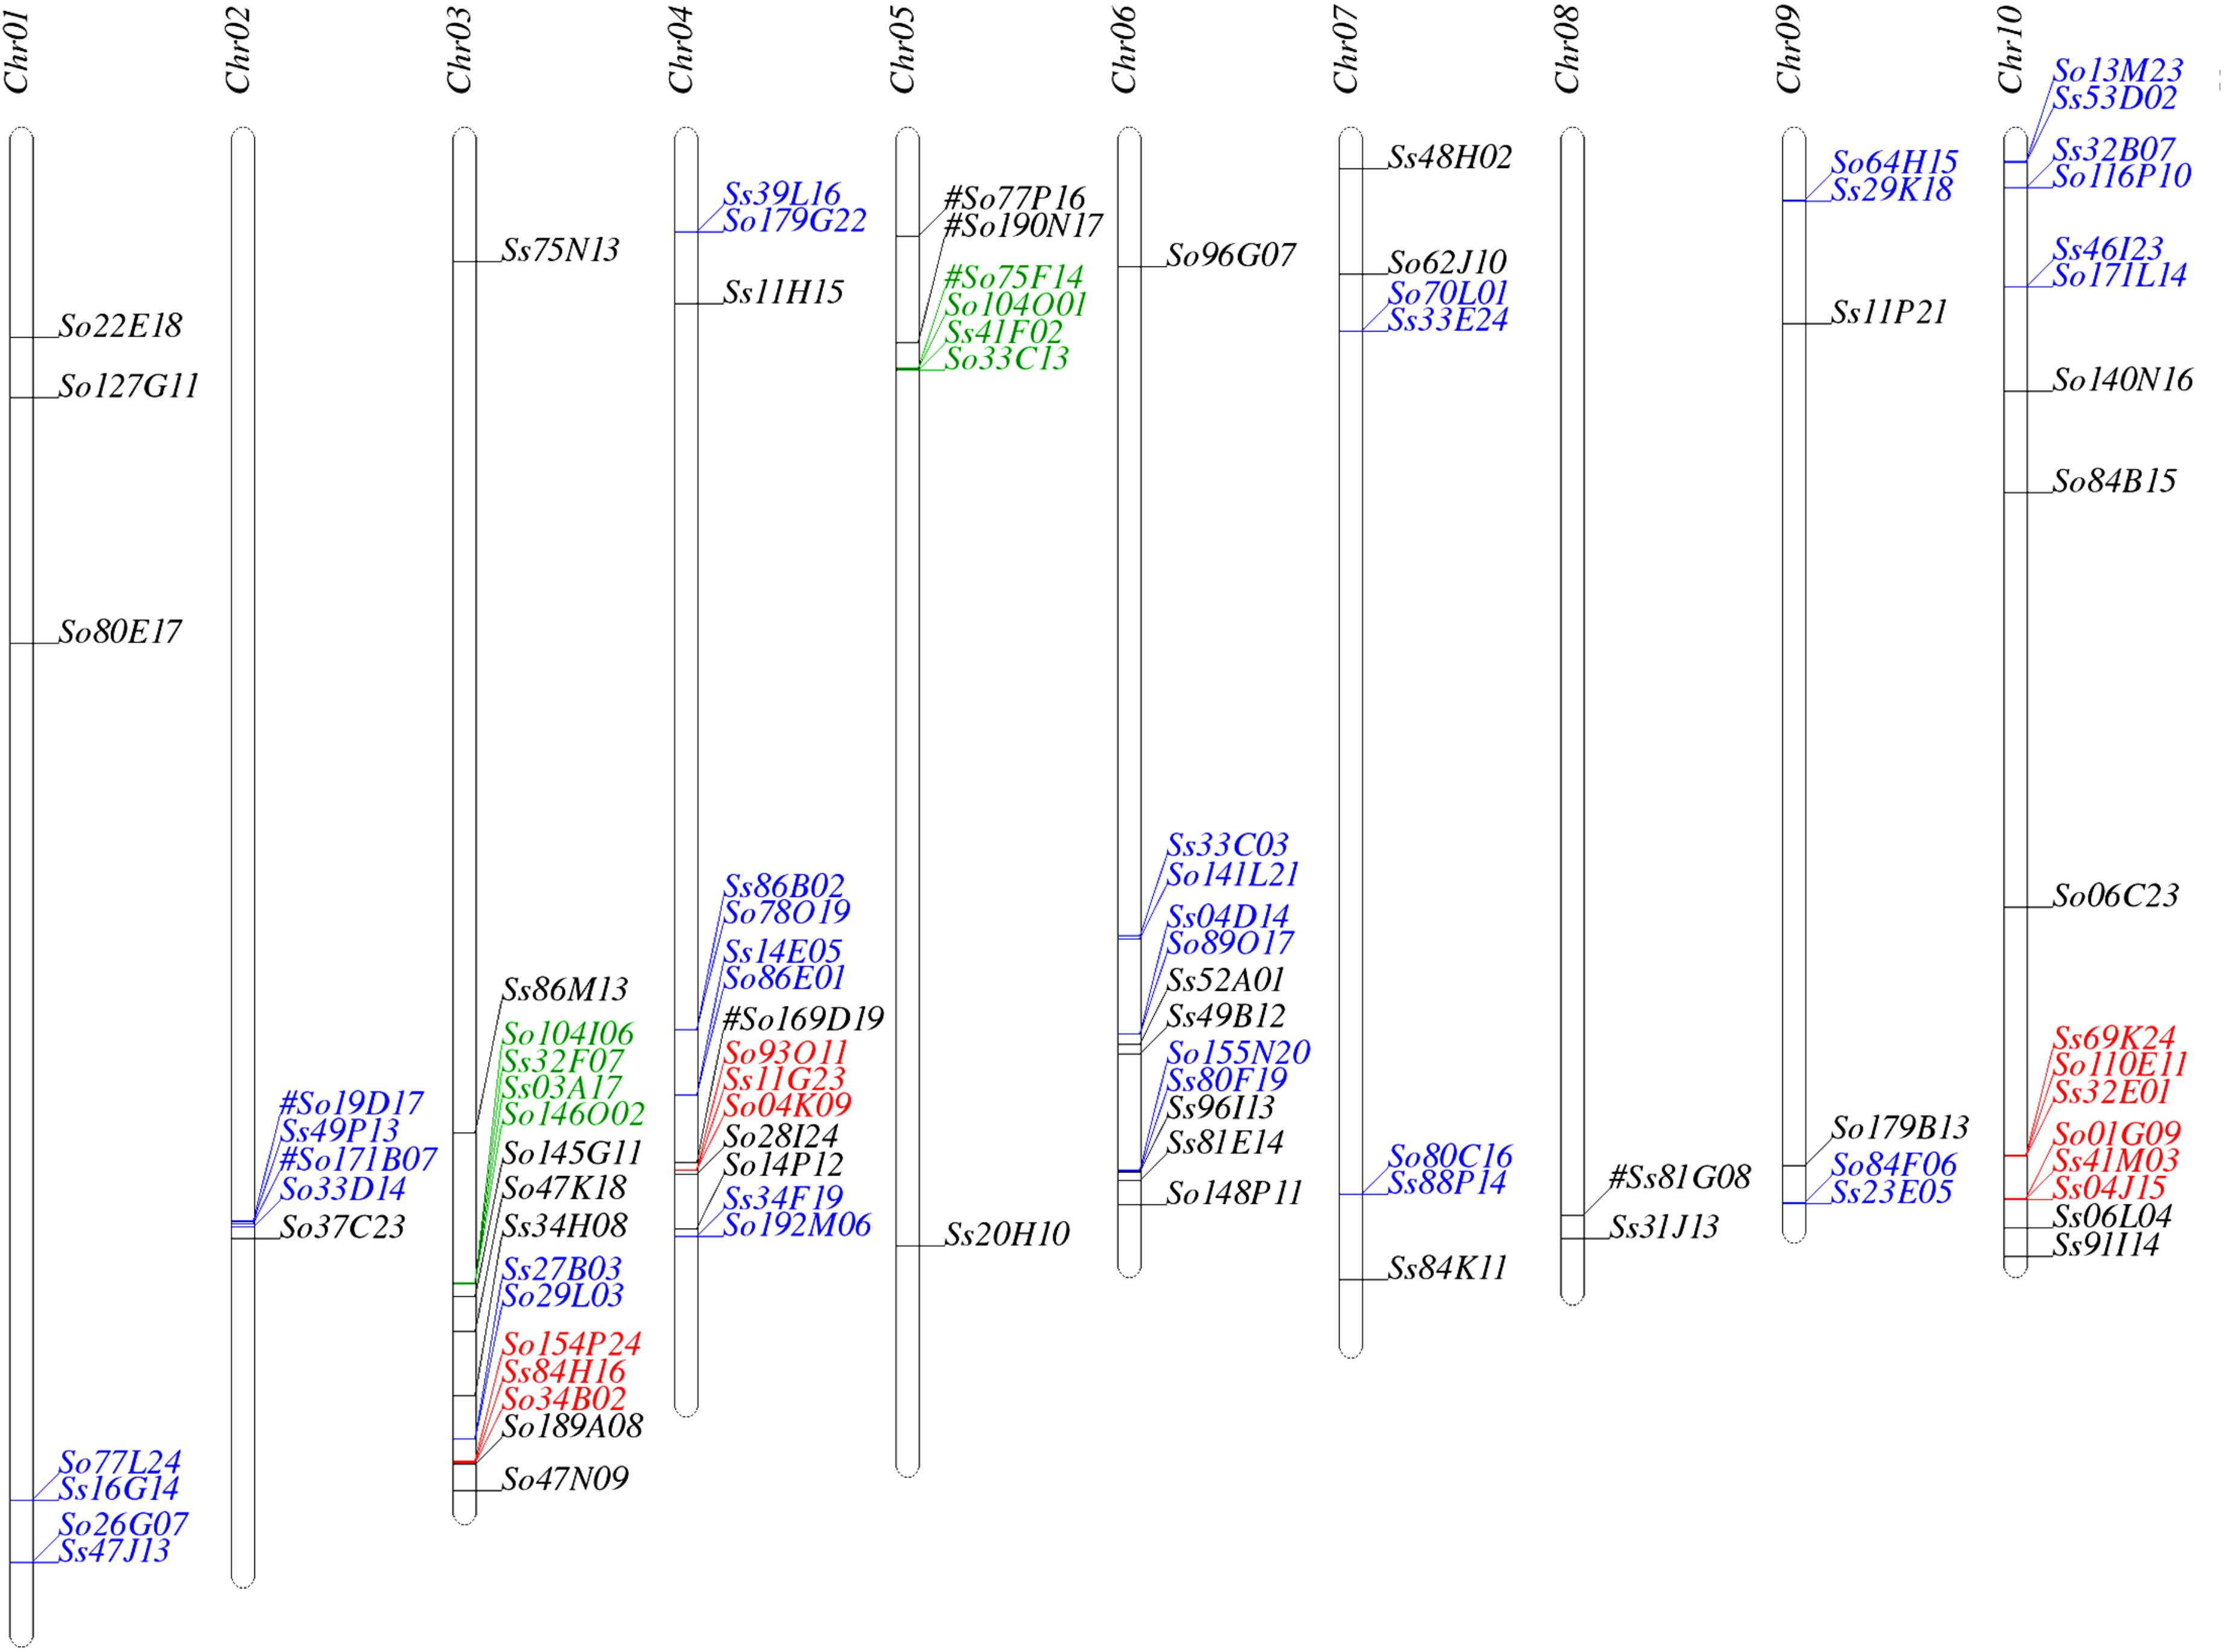
FIGURE 1. Mapping the Saccharum BACs on sorghum chromosomes. Homologous groups of two, three, and four BACs are shown in blue, red, and green, respectively. #: These homologous BACs were identified by Blast.
A schematic representation of a syntenic region between sorghum, S. officinarum (BACs So104I06 and So146O02), and S. spontaneum (BACs Ss03A17 and Ss32F07) is shown in Figure 2. The schematic for additional homologous groups is shown in Supplementary Figure S2. A high degree of collinearity in genic regions was observed between Saccharum and sorghum and between S. officinarum and S. spontaneum. The collinearity was interrupted by interspersed repeats (Figure 2). We used the mRNA coordinates of the syntenic genes to delineate and assess the pairwise difference in the length of the syntenic regions and the syntenic genes from sorghum and Saccharum. Of the 51 syntenic regions identified between S. officinarum and sorghum genomes, 29 showed expansion in S. officinarum and 22 showed expansion in sorghum (Figure 3A). Of the 44 syntenic regions identified between S. spontaneum and sorghum gnomes, 33 showed expansion in S. spontaneum and 11 showed expansion in sorghum (Figure 3A). And, of the 31 syntenic regions identified between S. officinarum and S. spontaneum, 17 had expanded in S. officinarum and 14 had expanded in S. spontaneum. Most expanded regions had up to 2-fold expansion, although there were few outliers (>3-fold expansion) that might be caused by genome rearrangements, genome mis-assembly and/or high repeat insertions. Including the outliers, the total length of the syntenic regions in sorghum was 1.1-fold of S. officinarum and 0.96-fold of S. spontaneum. After excluding the outliers (with >3-fold expansion), the total length of syntenic regions in sorghum was 0.92-fold of S. officinarum and 0.77-fold of S. spontaneum. Overall, S. spontaneum showed expansion relative to S. officinarum, and both S. officinarum and S. spontaneum showed expansion relative to sorghum.
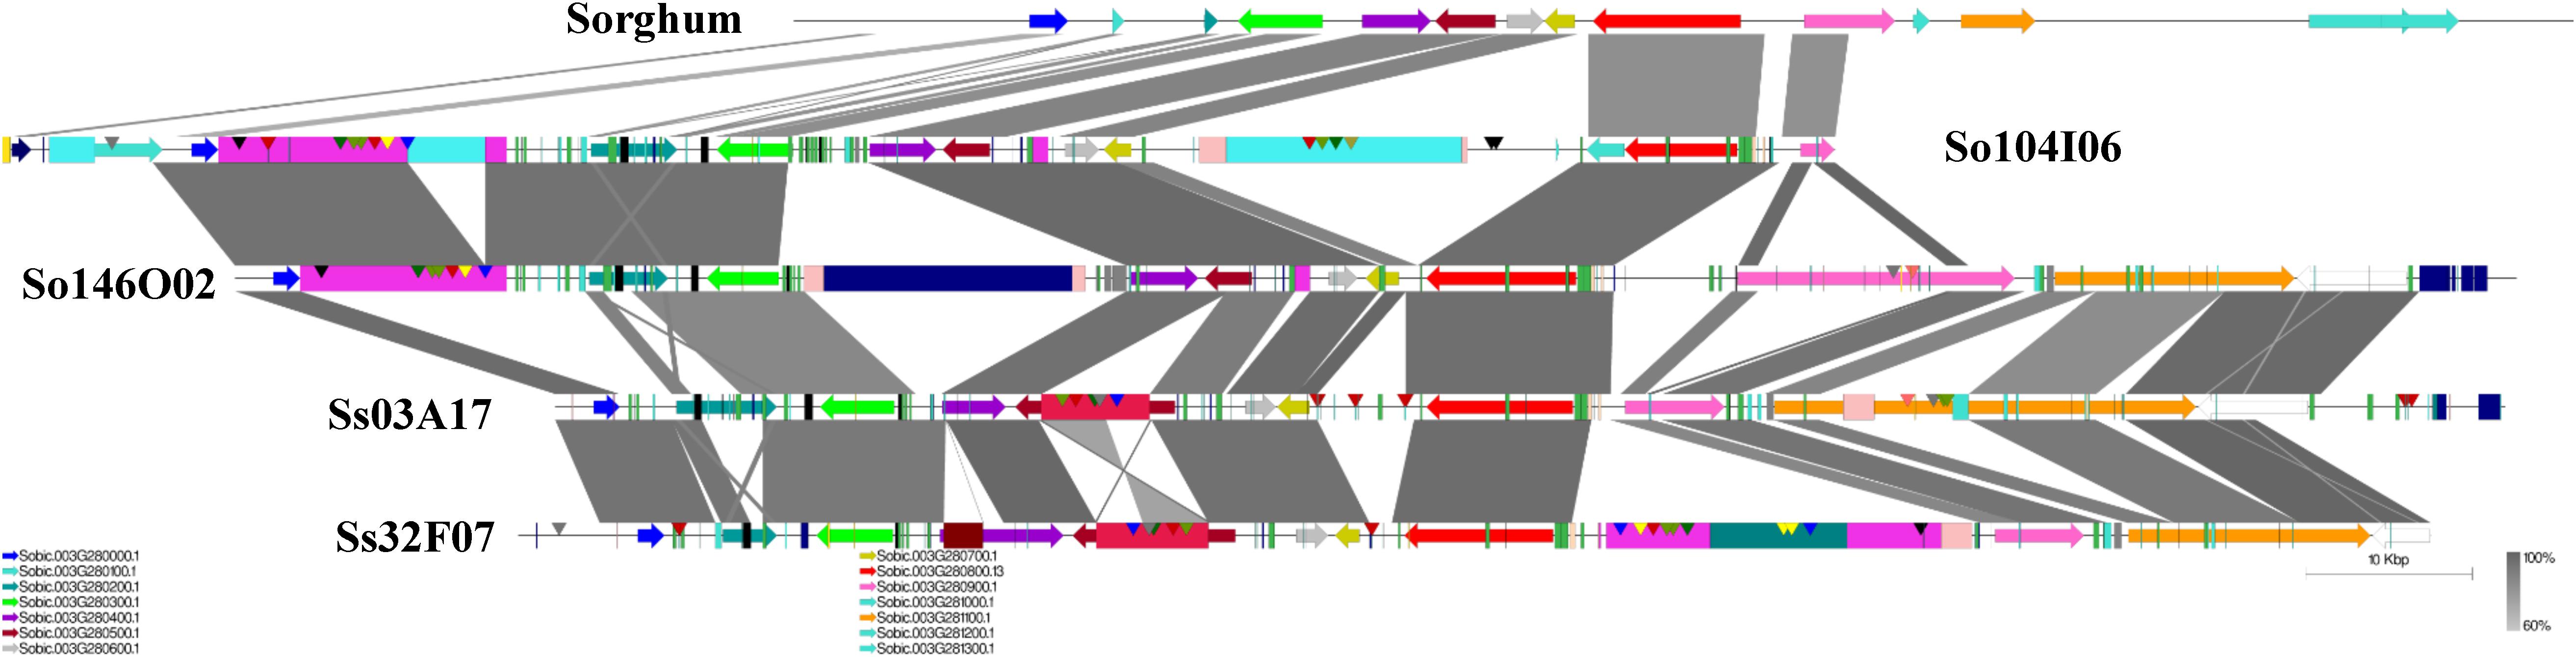
FIGURE 2. A schematic representation of a syntenic region between Saccharum and sorghum and between S. officinarum and S. spontaneum. The color-coded arrows represent genes, rectangles represent repeats, and conserved domains in transposable elements are represented by pointers. The blast similarity between annotated genic regions is shown by connectors in gray color gradient. A high degree of co-linearity is shared between Saccharum and sorghum and between S. officinarum and S. spontaneum. The large TEs are shared by homologous regions within the same species but not by the ones from different Saccharum species.
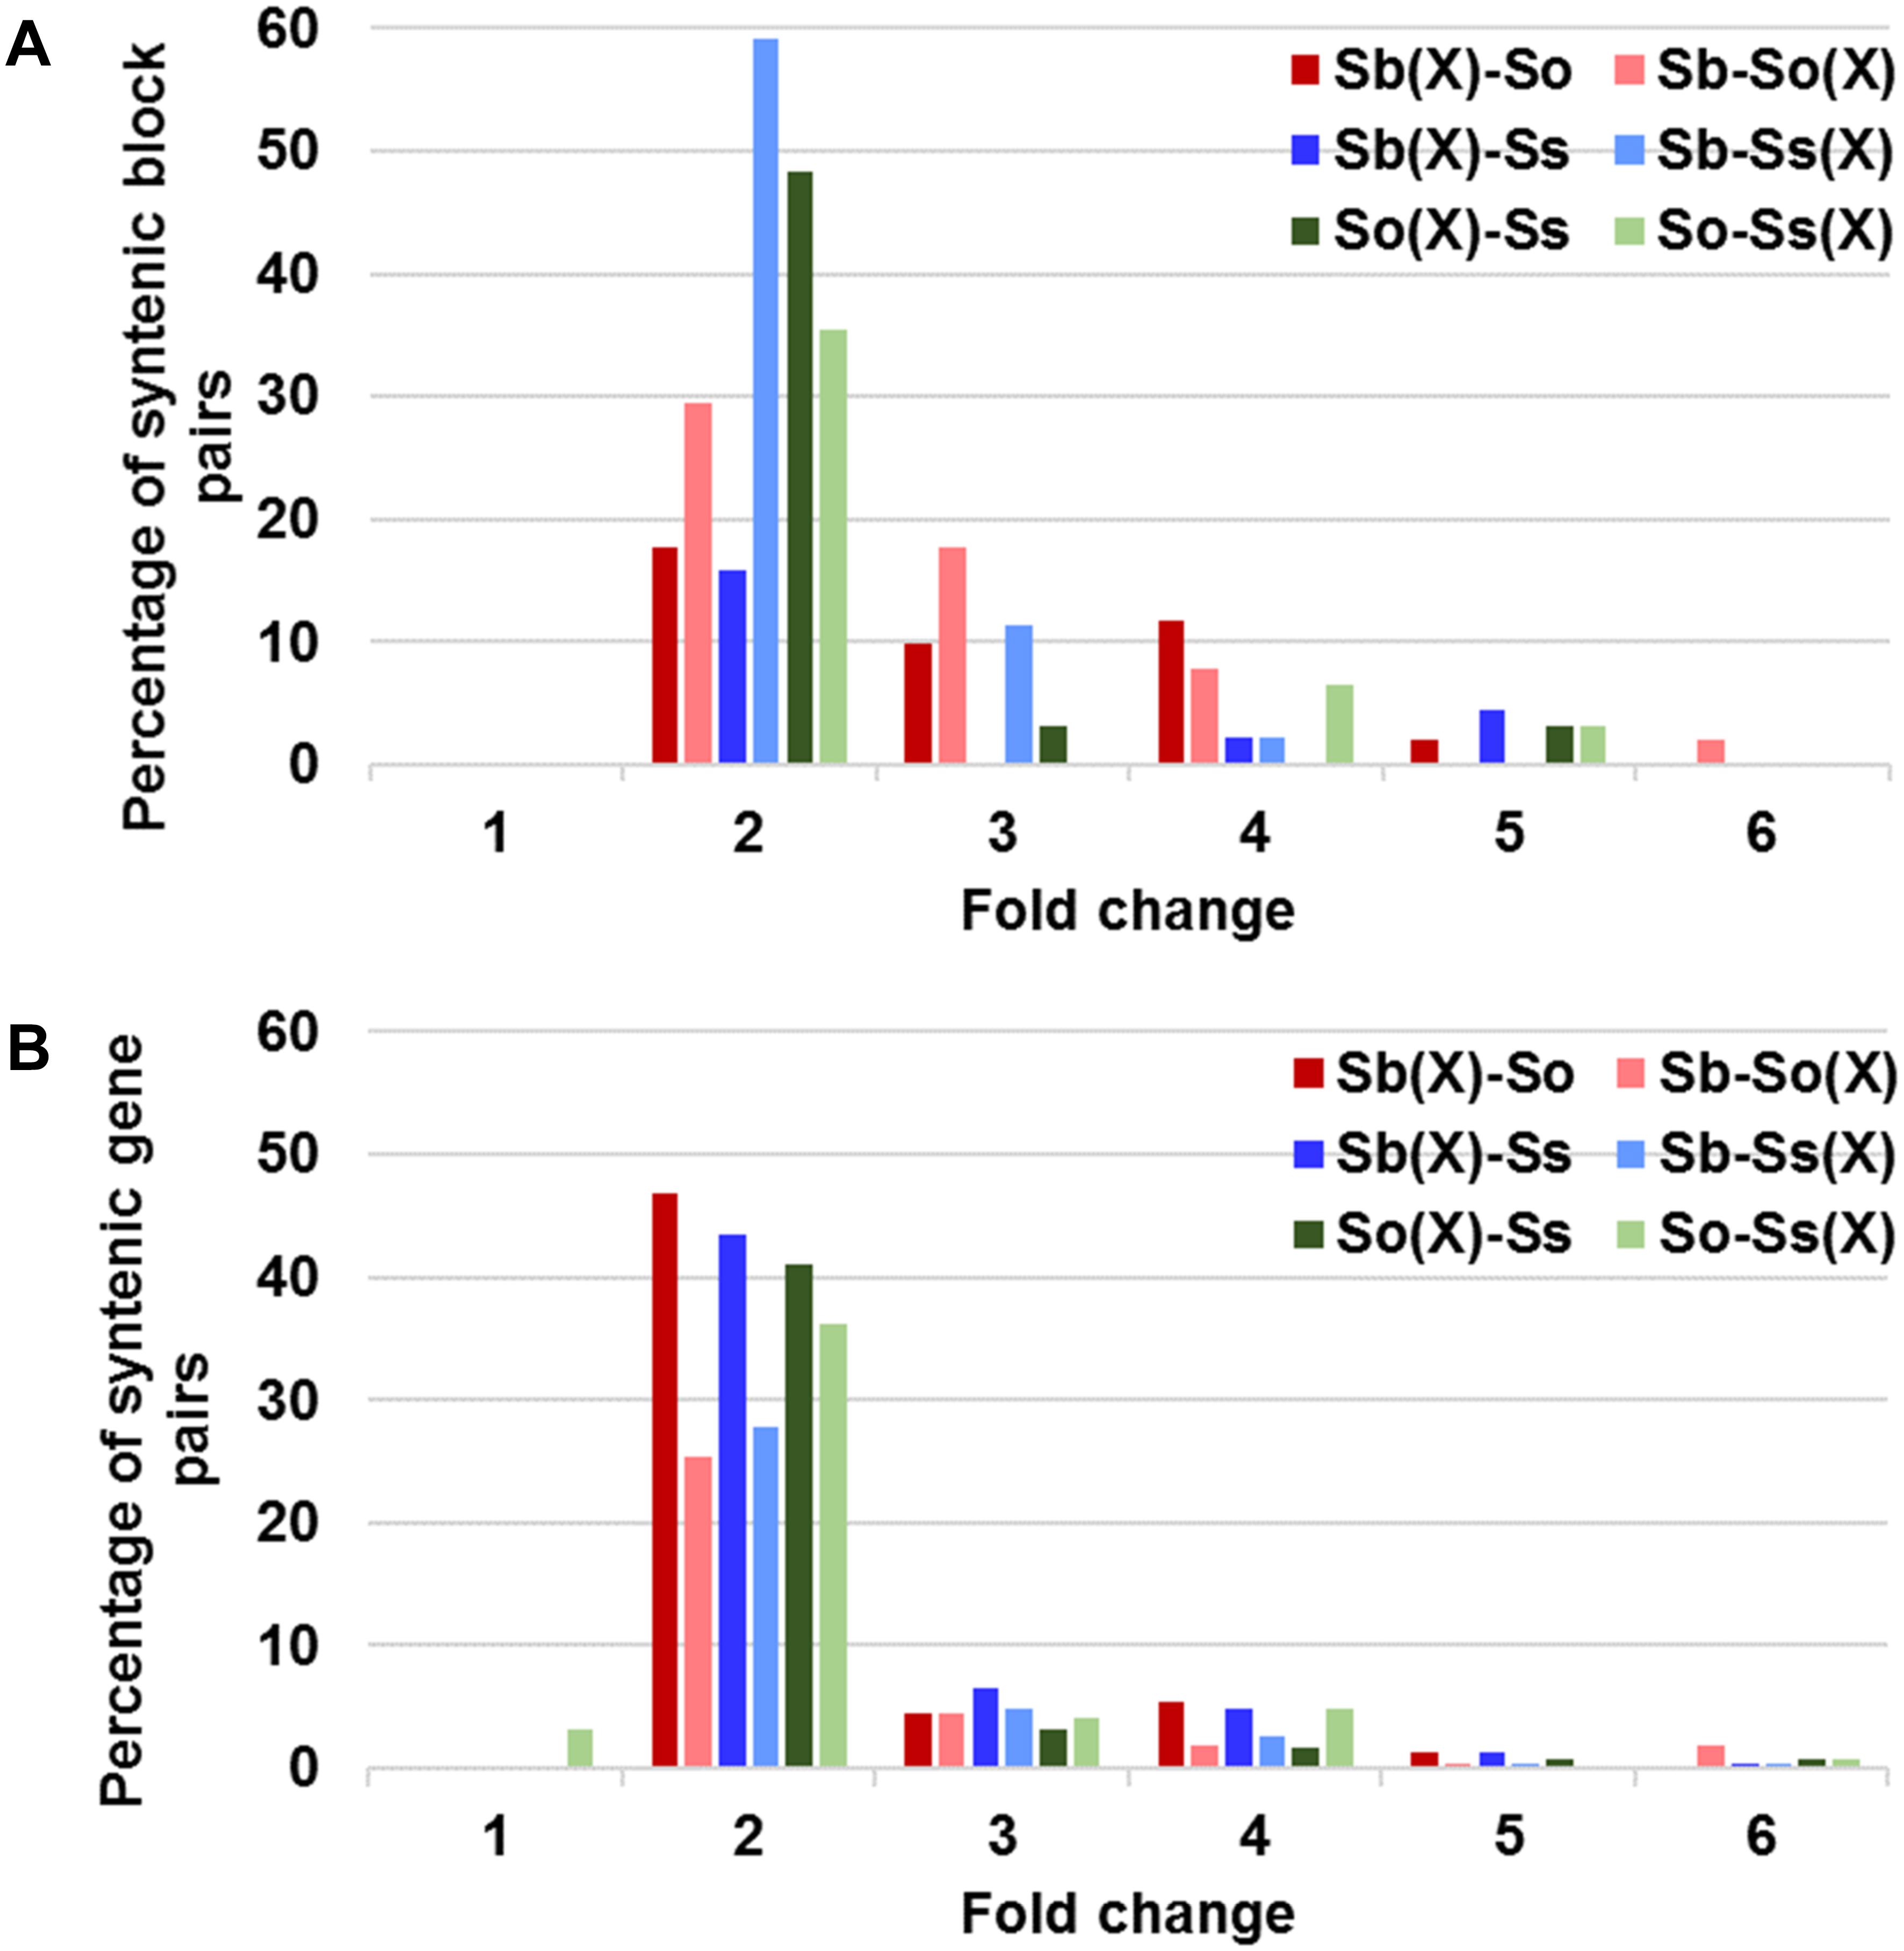
FIGURE 3. Relative size expansion between Saccharum and sorghum and between Saccharum officinarum and Saccharum spontaneum in syntenic blocks (A) and syntenic gene pairs (B). X: expansion.
We also compared the expansion within the annotated genes and found that the expansion in genic regions was at a much smaller scale (Figure 3B). Approximately half or more than half (46–65%) of gene pairs showed < 1.3-fold expansion. Approximately 20% of S. officinarum and S. spontaneum genes showed < 1.3-fold expansion relative to sorghum genes, approximately 27% of sorghum genes showed < 1.3-fold expansion relative to S. officinarum and S. spontaneum genes, and approximately 35% of S. officinarum genes and 30% of S. spontaneum genes had <1.3-fold expansion relative to S. spontaneum and S. officinarum genes, respectively. Our result indicated that the expansion of syntenic regions in Saccharum was largely caused by the expansion in the intergenic regions.
Evolutionary Divergence Between Syntenic Gene Pairs
We estimated the Ks and Ka values of syntenic gene pairs between sorghum and S. officinarum, sorghum and S. spontaneum, and S. officinarum and S. spontaneum. The frequency distribution of the Ks, Ka, and Ka/Ks for the three comparisons is shown in Figure 4. The distribution of the Ks and Ka values of sorghum/S. officinarum and sorghum/S. spontaneum showed similar patterns. The peak Ks value for syntenic genes between sorghum and S. officinarum and between sorghum and S. spontaneum was 0.10 and the estimated divergence time was 7.7 mys. The peak Ks value of syntenic gene pairs between S. officinarum and S. spontaneum was 0.02 and the estimated divergence time was 1.5 mys. The peak Ka value for syntenic gene pairs was 0.2 for sorghum/S. officinarum and sorghum/S. spontaneum, and 0.1 for S. officinarum/S. spontaneum. The Ka/Ks values of most gene pairs (86–98%) was less than 1.00 suggesting that most syntenic gene pairs are under purifying selection (Table 2).
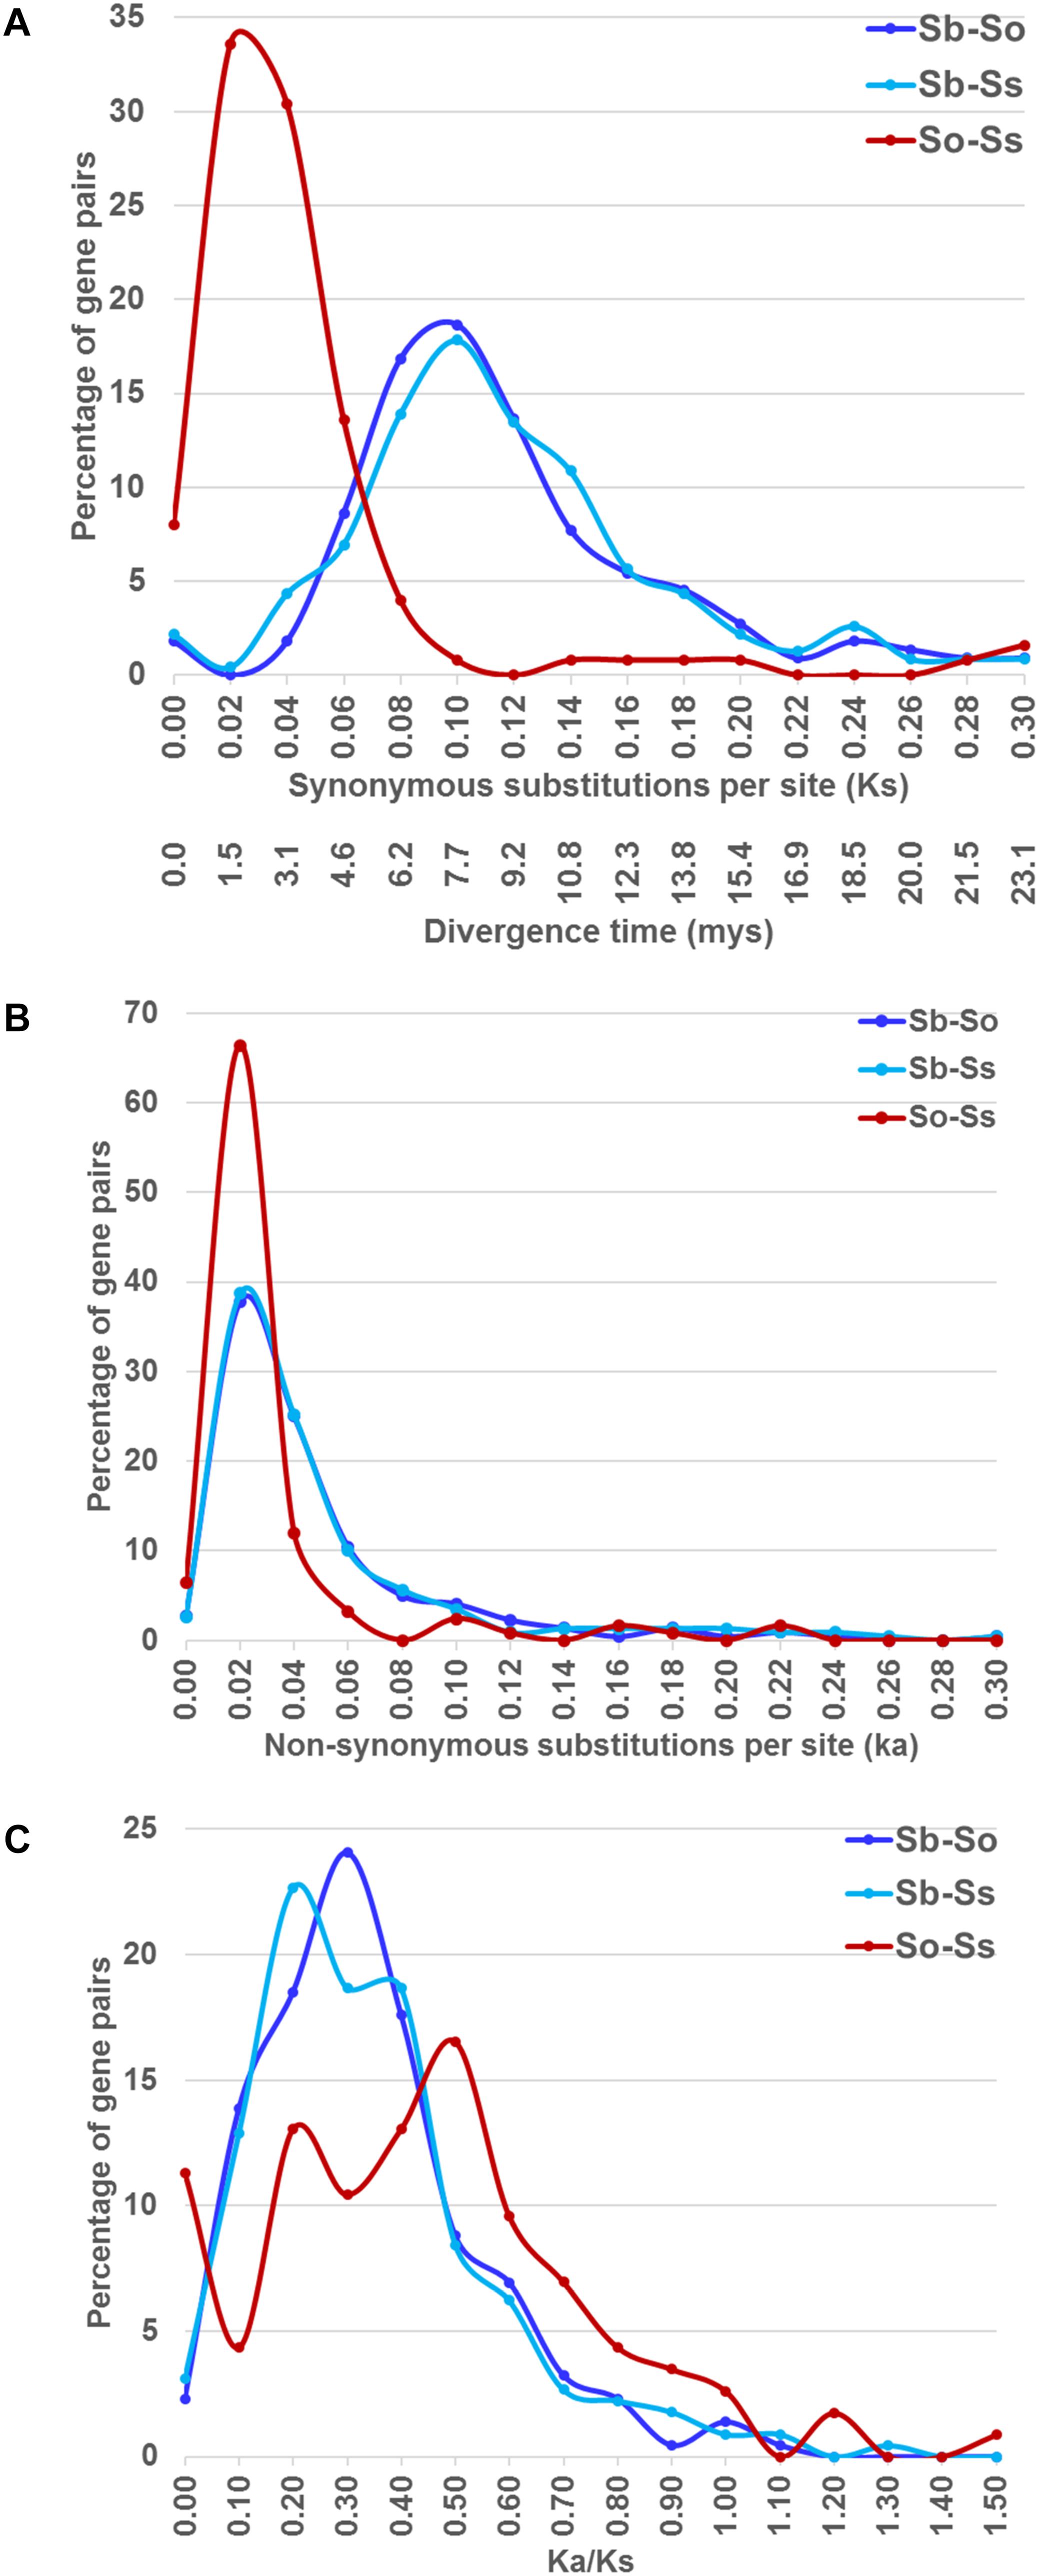
FIGURE 4. The frequency distribution of the Ks and the corresponding divergence times (A), Ka (B), and Ka/Ks values (C) between sorghum and Saccharum, and between S. officinarum and S. spontaneum.
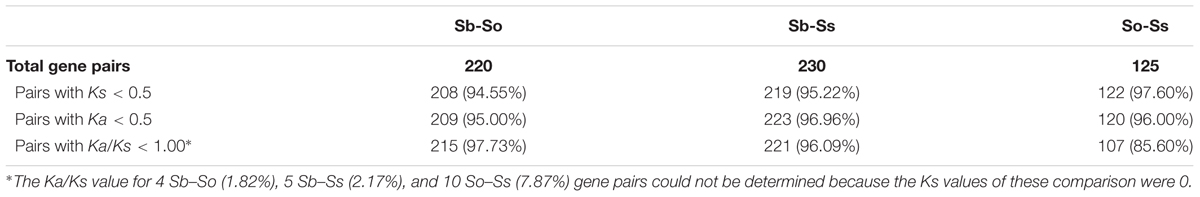
TABLE 2. Number of syntenic gene pairs used for calculation of Ks, Ka, and Ka/Ks ratios.
Insertion Time of LTR Retrotransposon Lineages in S. officinarum and S. spontaneum
Retrotransposon activation can be triggered by many factors including genome duplication. Therefore, it would be interesting to see the impact of genome duplication on LTR retrotransposons in Saccharum genomes. We extracted the full-length LTR retrotransposon copies from the So and Ss BACs and estimated their insertion times. The number of full-length LTR retrotransposon copies extracted from So (38 copies) and Ss (37 copies) BACs were similar (Figure 5). However, there were more Del and Max lineage members in So BACs than in Ss BACs. Overall, the full-length LTR retrotransposons in Ss BACs are younger than in So BACs (Figure 6). In Ss BACs, 67 and 89% of the full-length LTR retrotransposons are younger than 0.5 and 1 million years, respectively. In So BACs, 32 and 60% of the full-length elements are younger than 0.5 and 1 million years, respectively (Figure 6). None of the full-length LTR retrotransposons in Ss BACs are older than 2 mys, which is the estimated time when S. officinarum and S. spontaneum diverged. Interesting, none of the intact LTR retrotransposons were shared between S. officinarum and S. spontaneum.
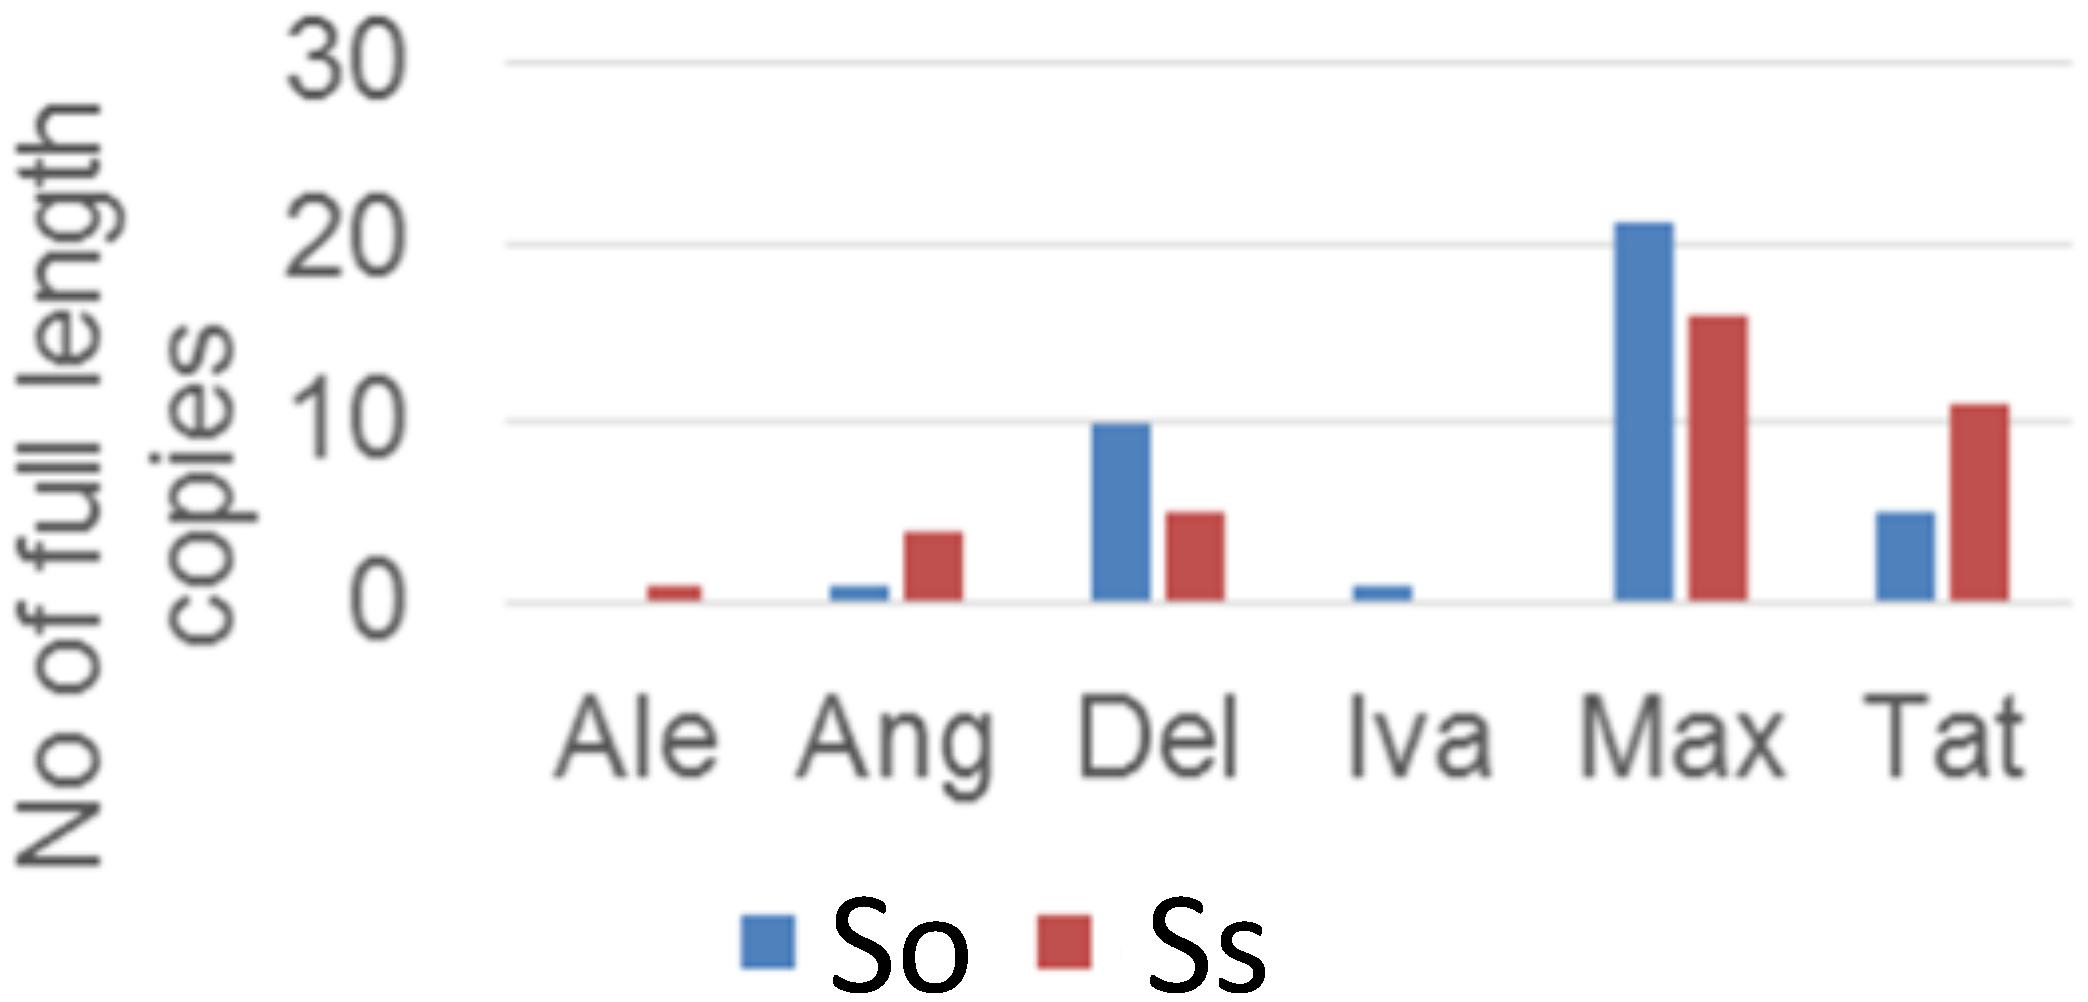
FIGURE 5. Full-length LTR retrotransposon copies in So and Ss BACs.
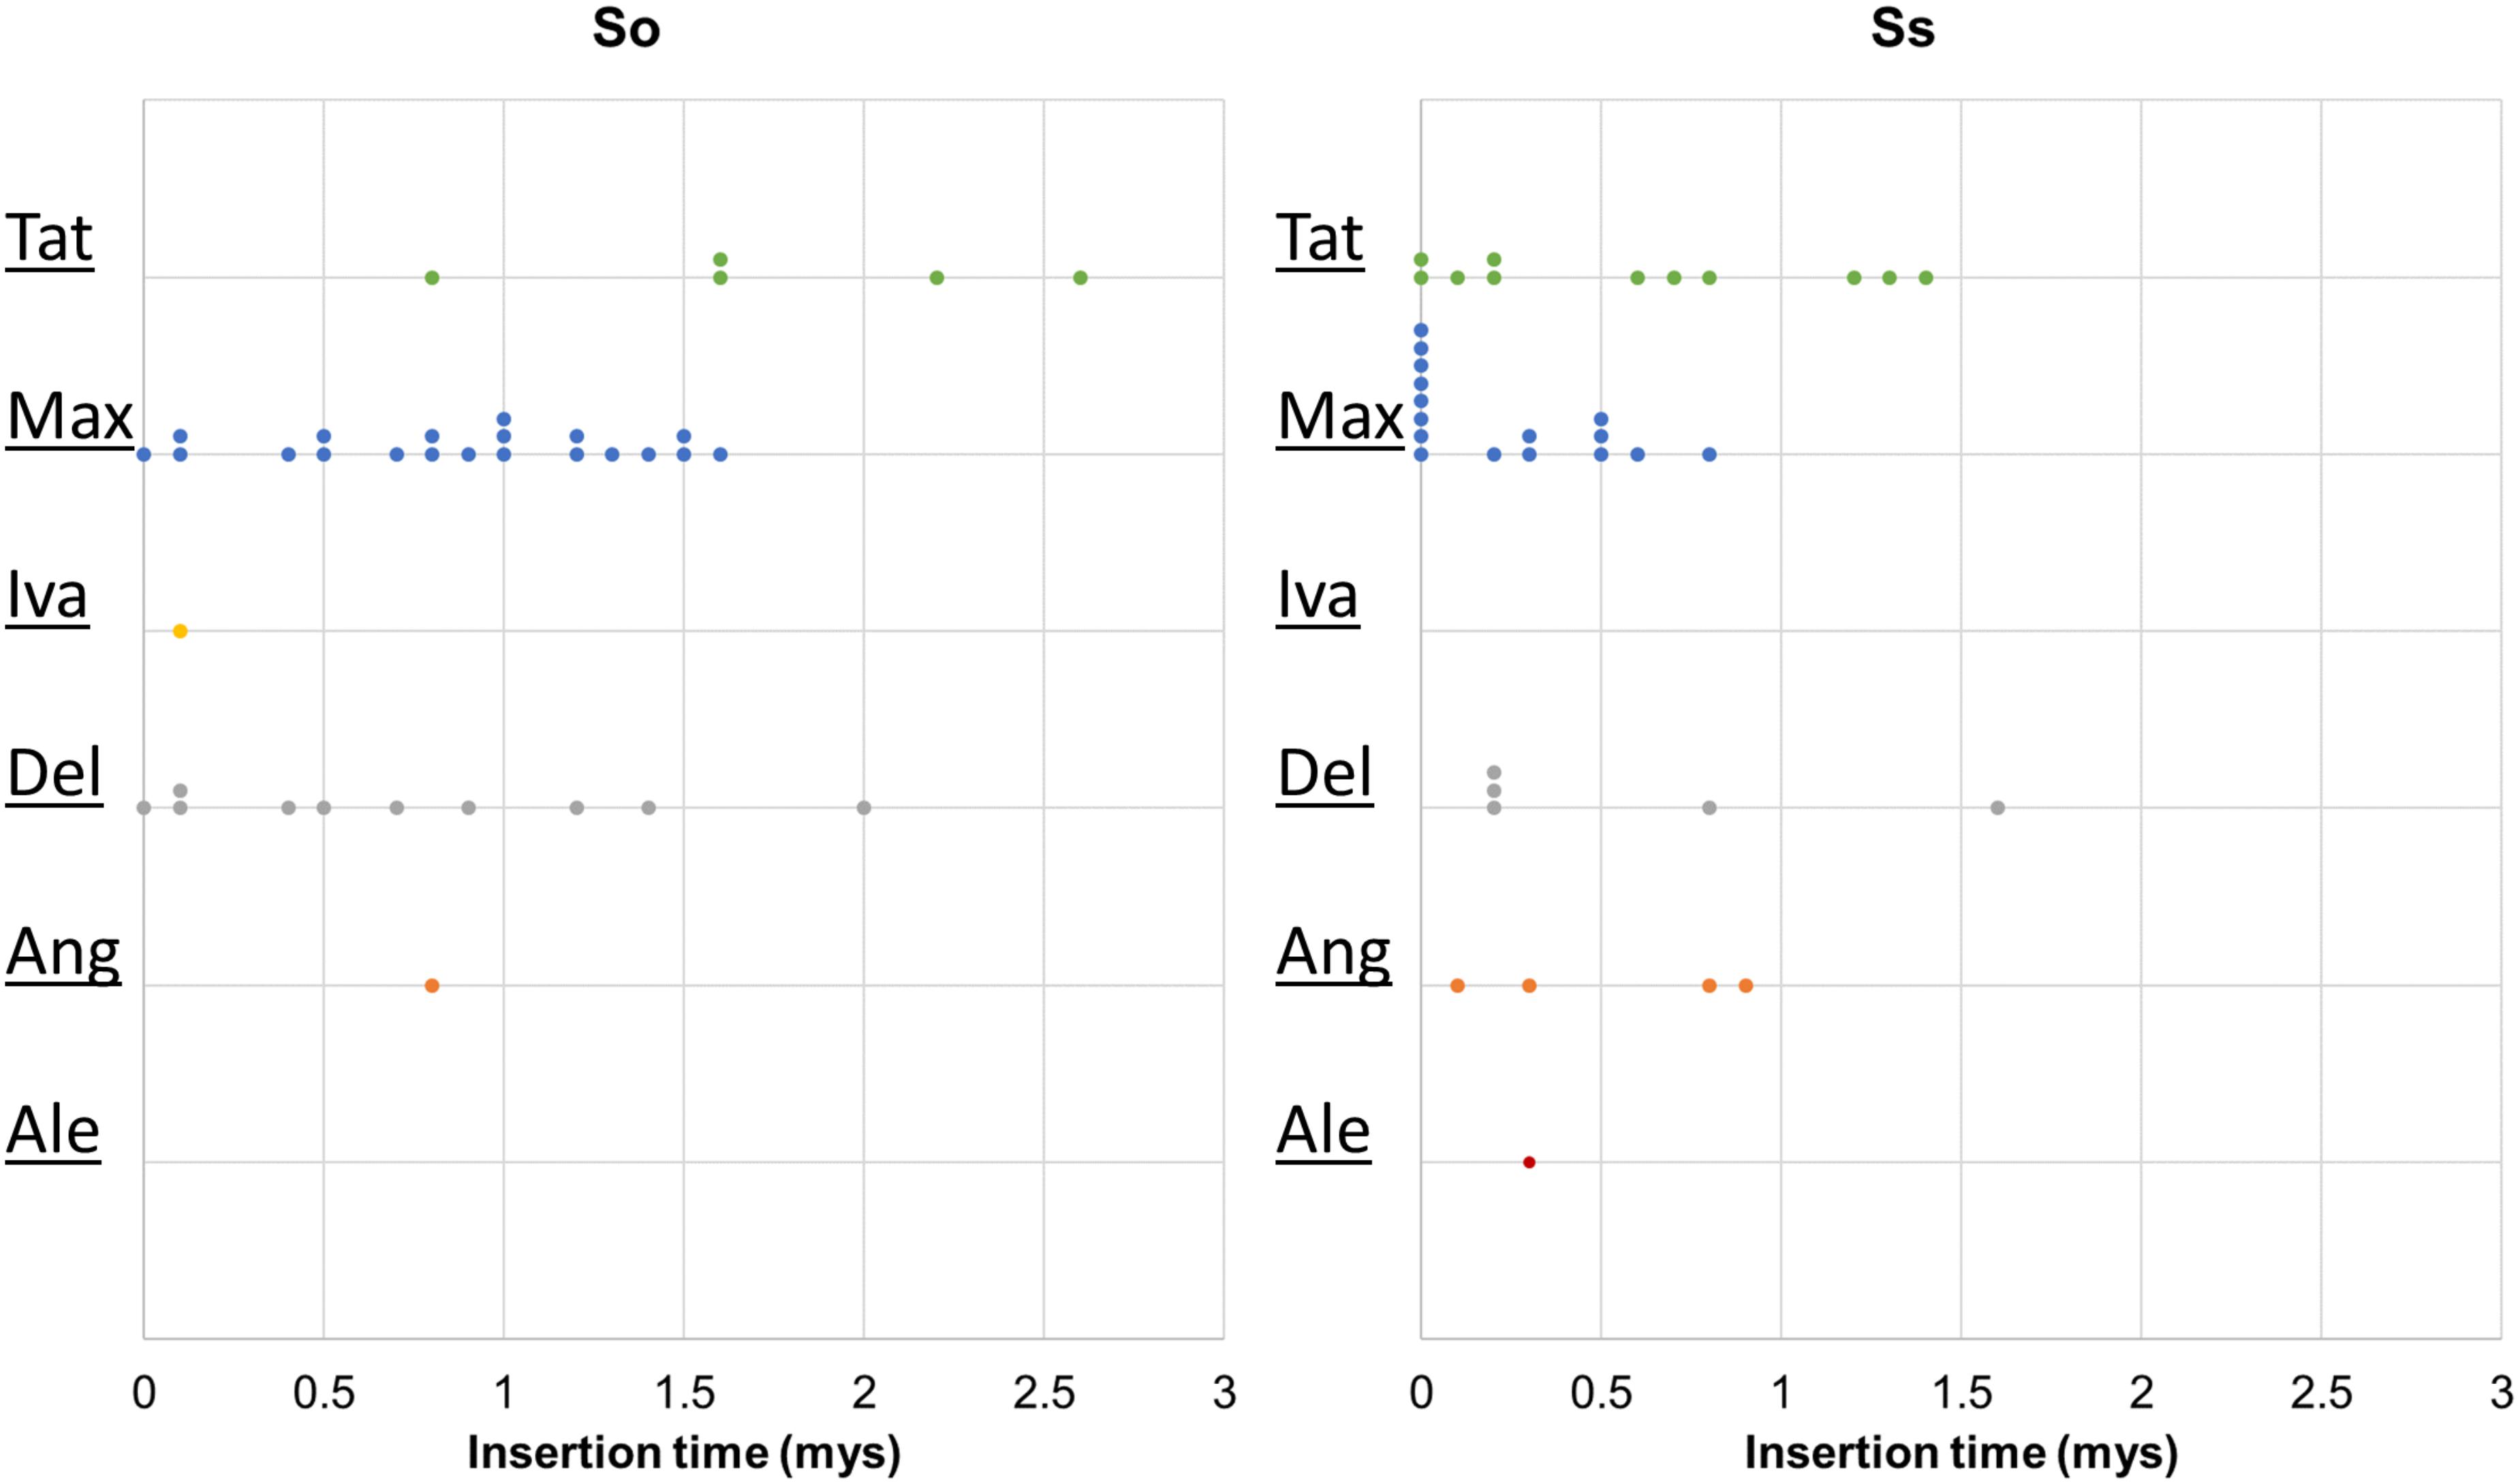
FIGURE 6. Insertion time of LTR retrotransposon families. The insertion time of LTR retrotransposon families in So (left graph) and Ss (right graph) BACs are shown. The X axis represents the insertion time (mys). Each dot in the graph represents insertion time of one element and these are stacked when more than one element has the same insertion time for easy visualization of copy number. The insertion time was calculated based on substitution rate of 1.3 × 10⁻⁸ (Ma and Bennetzen, 2004).
Since S. officinarum and S. spontaneum diverged from a common ancestor recently, we would expect that remnants of some LTR retrotransposon fragments predating the divergence of S. officinarum and S. spontaneum have been retained and can be identified in the two genomes. TE insertions into the genome or within other TEs form unique junctions at their insertion sites, which can be used as markers even though the original copy has mostly degenerated (Luce et al., 2006). We identified signatures of shared LTR retrotransposon insertions between paired homologous BACs. A total of 18 LTR junction markers were identified in paired homologous BACs between S. officinarum and S. spontaneum, 11 were identified in paired homologous BACs within S. officinarum, and 4 were identified in paired homologous BACs within S. spontaneum (Table 3). It was estimated that S. officinarum and S. spontaneum diverged from a common ancestor approximately 1.5 – 2 mys (Jannoo et al., 2007). Interestingly, the insertion times of all the LTR junction markers shared by homologous BACs within S. officinarum and within S. spontaneum were estimated at ≤2 mys, while the insertion times of all except three LTR junction markers shared between S. officinarum and S. spontaneum were estimated > 1.5 mys (Figure 7).
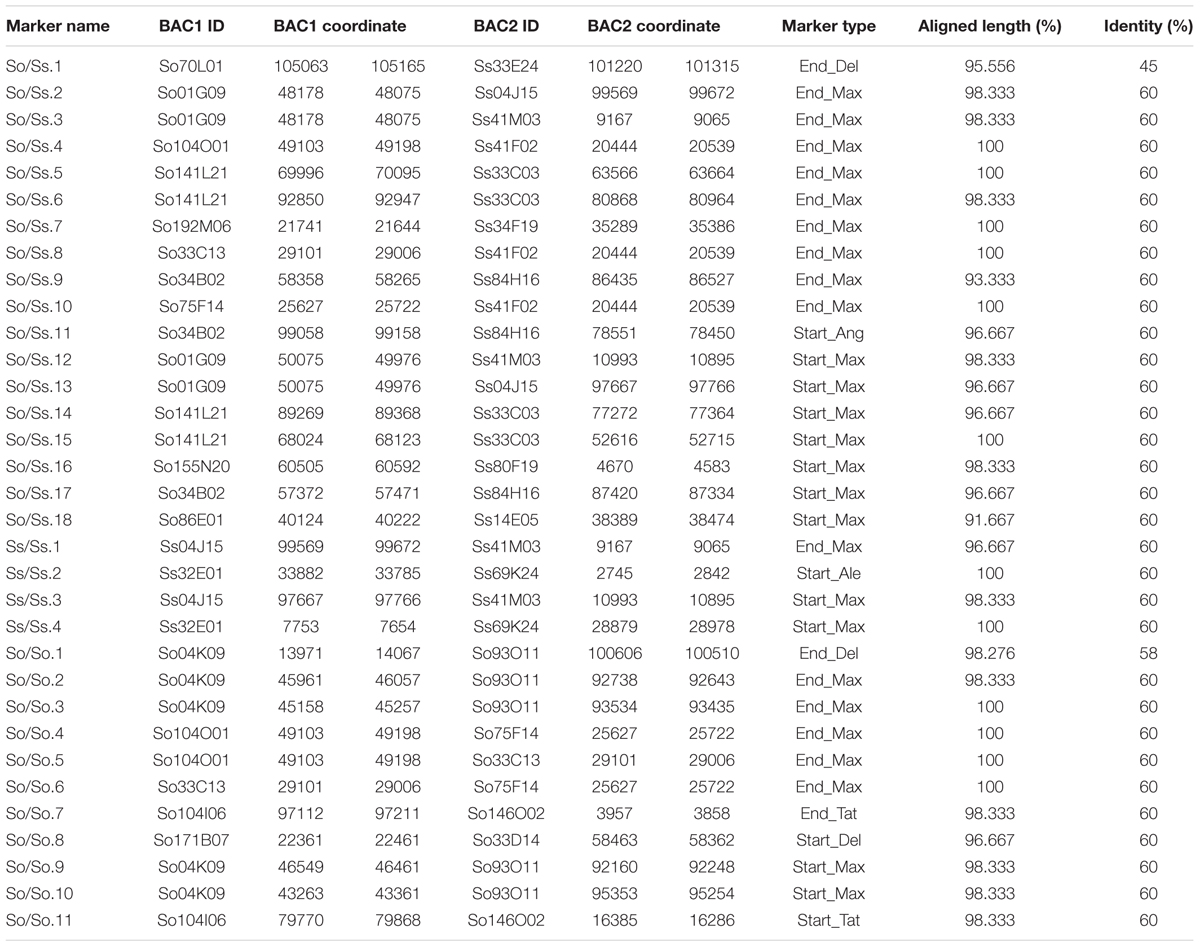
TABLE 3. LTR junction marker identified in paired homologous BACs in Saccharum BACs.
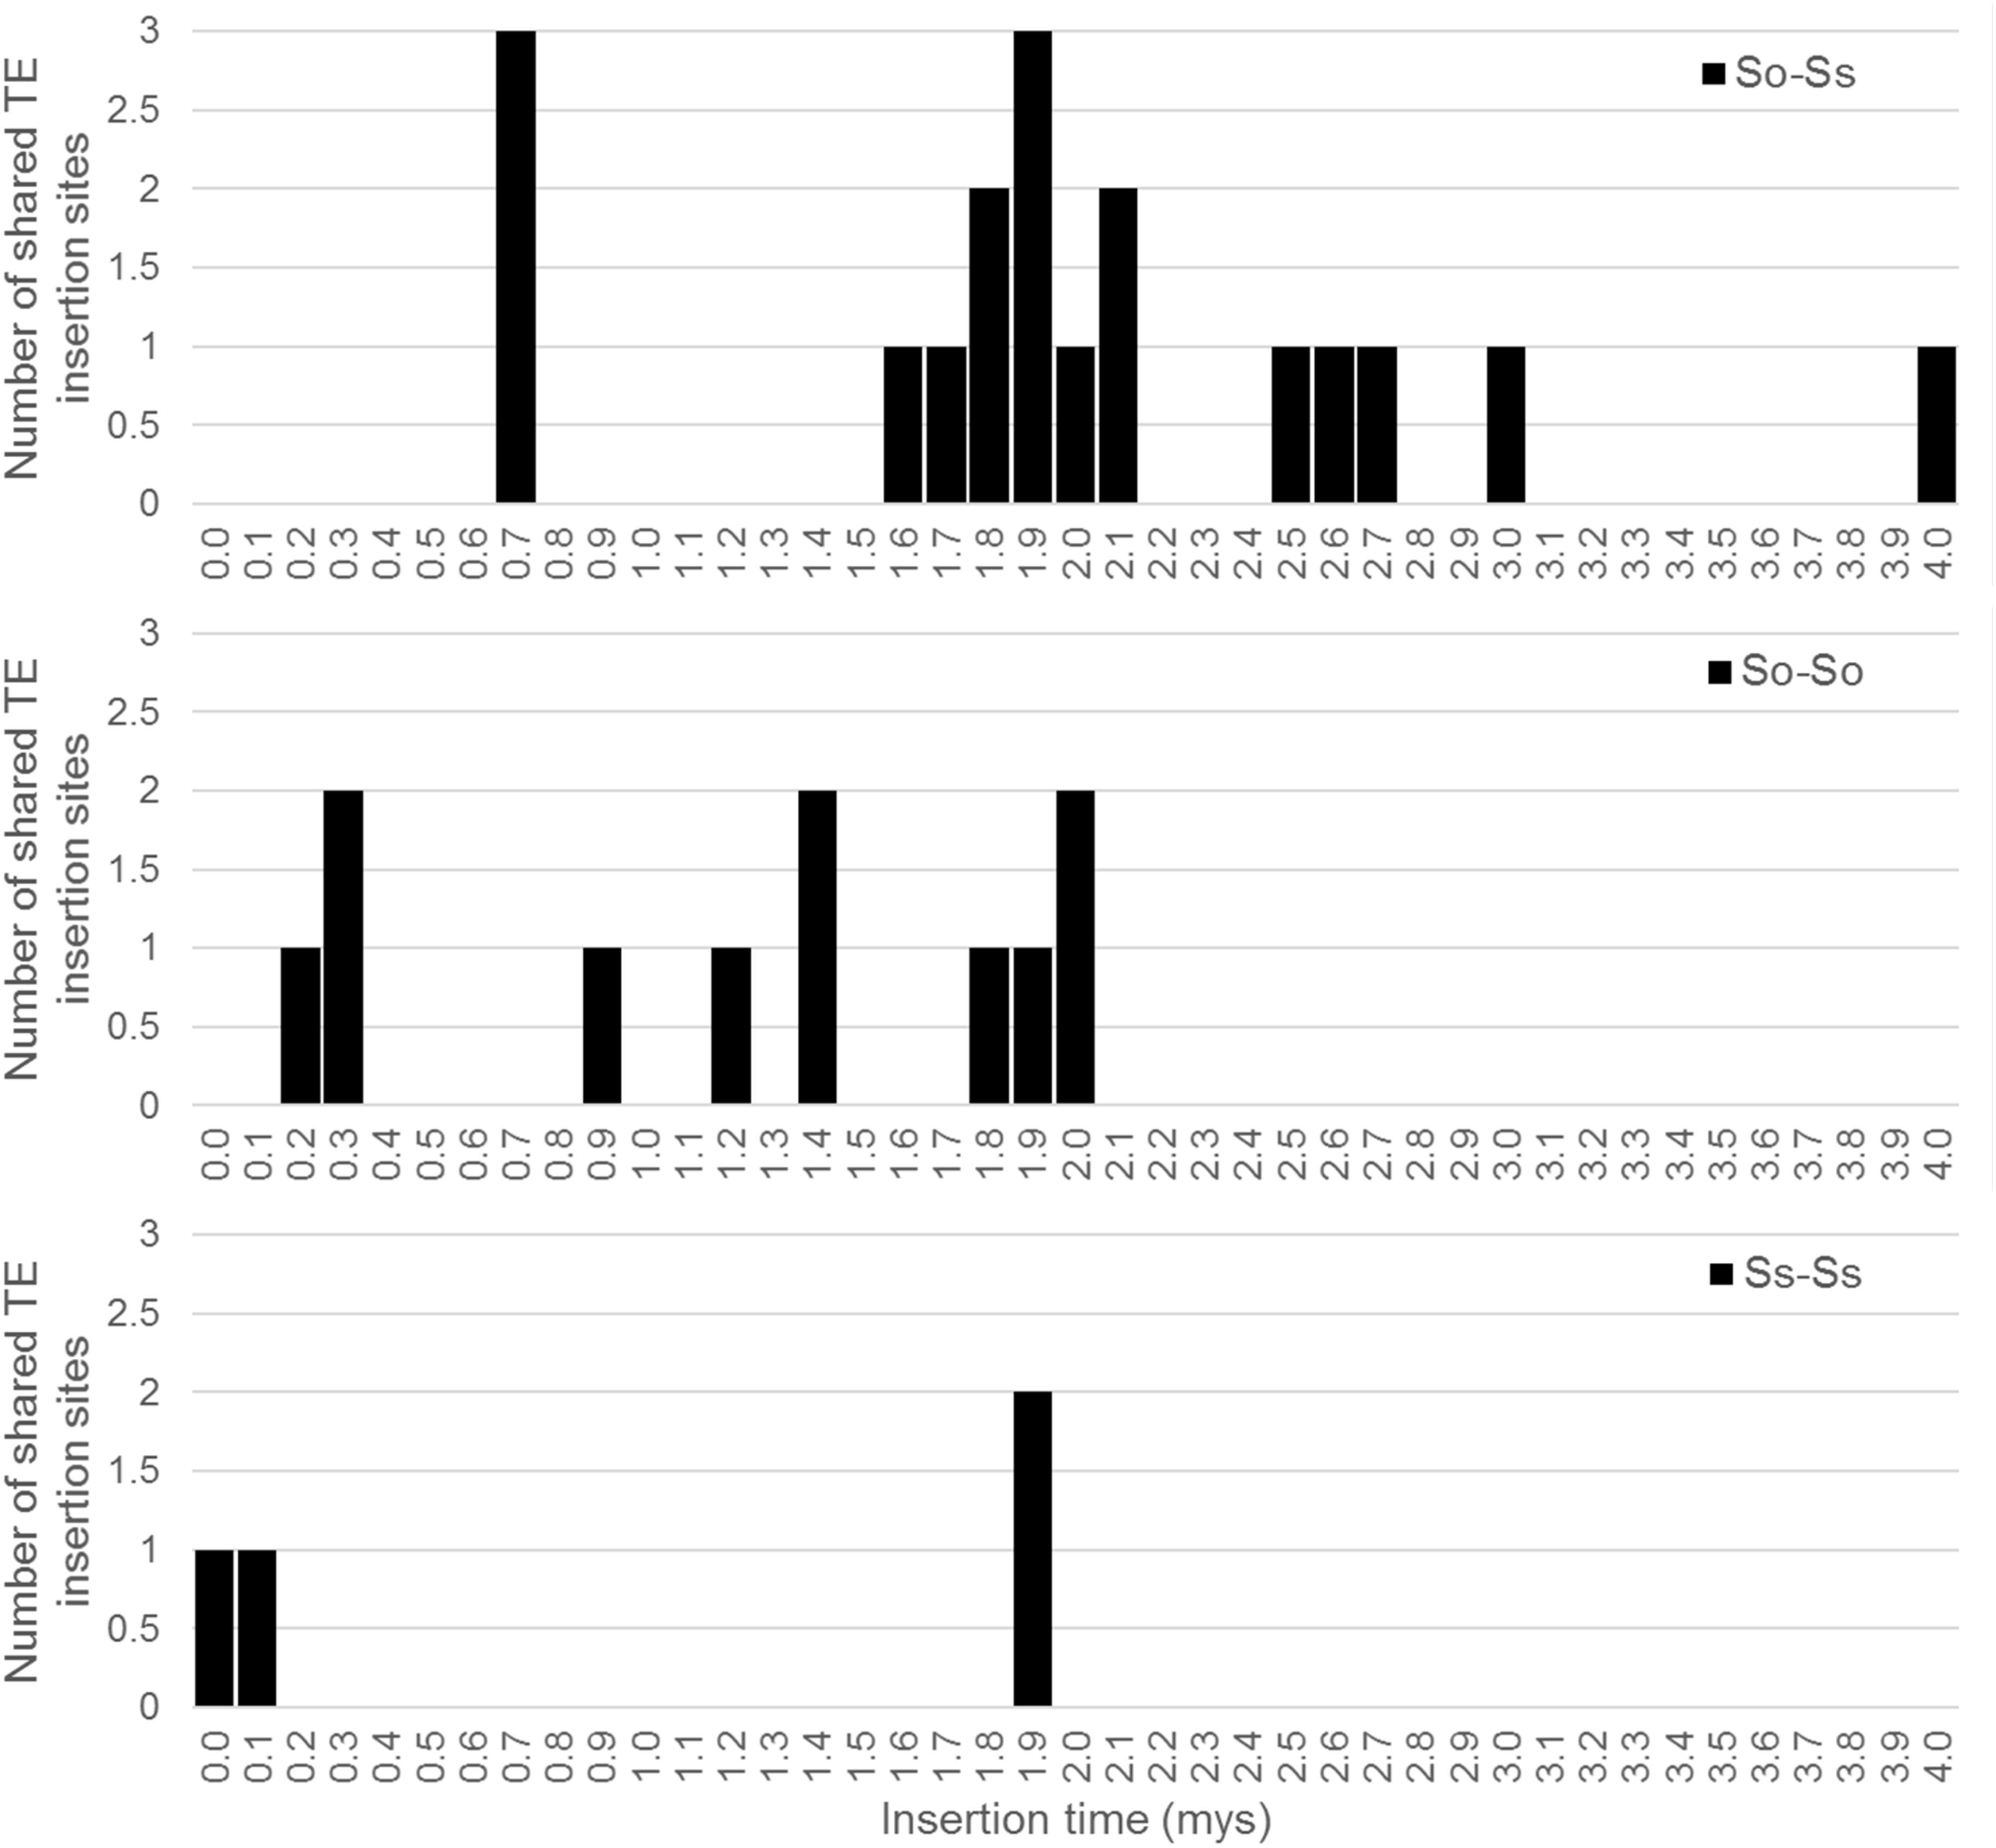
FIGURE 7. Insertion times of LTR junction markers shared between Saccharum BACs. The X axis represents the insertion time (mys) and the Y axis represents the number of shared LTR junction markers. The insertion time was calculated based on substitution rate of 1.3 × 10⁻⁸ per site per year (Ma and Bennetzen, 2004).
The LTR junction marker with the lowest divergence between S. officinarum and S. spontaneum was present in three So BACs (So104O01, So33C13, and So75F14) and one Ss (Ss41F02) BAC. A 7 kb-long multiple alignment was generated from the homologous region containing the LTR junction marker from the four BACs and used to estimate the divergence time of the intergenic region. The K values based on the homologous intergenic region showed that Ss41F02 diverged from the common ancestor of So104O01, So33C13, and So75F14 (K = 0.035–0.039) first, followed by the divergence of So33C13 from the common ancestor of So75F14 and So104O01 (K = 0.023 and 0.025), and So104O01 and So75F14 diverged the most recently (K = 0.012). The same pattern of divergence was observed using the divergence (Ks) of a syntenic gene shared by all four BACs (Figure 8).
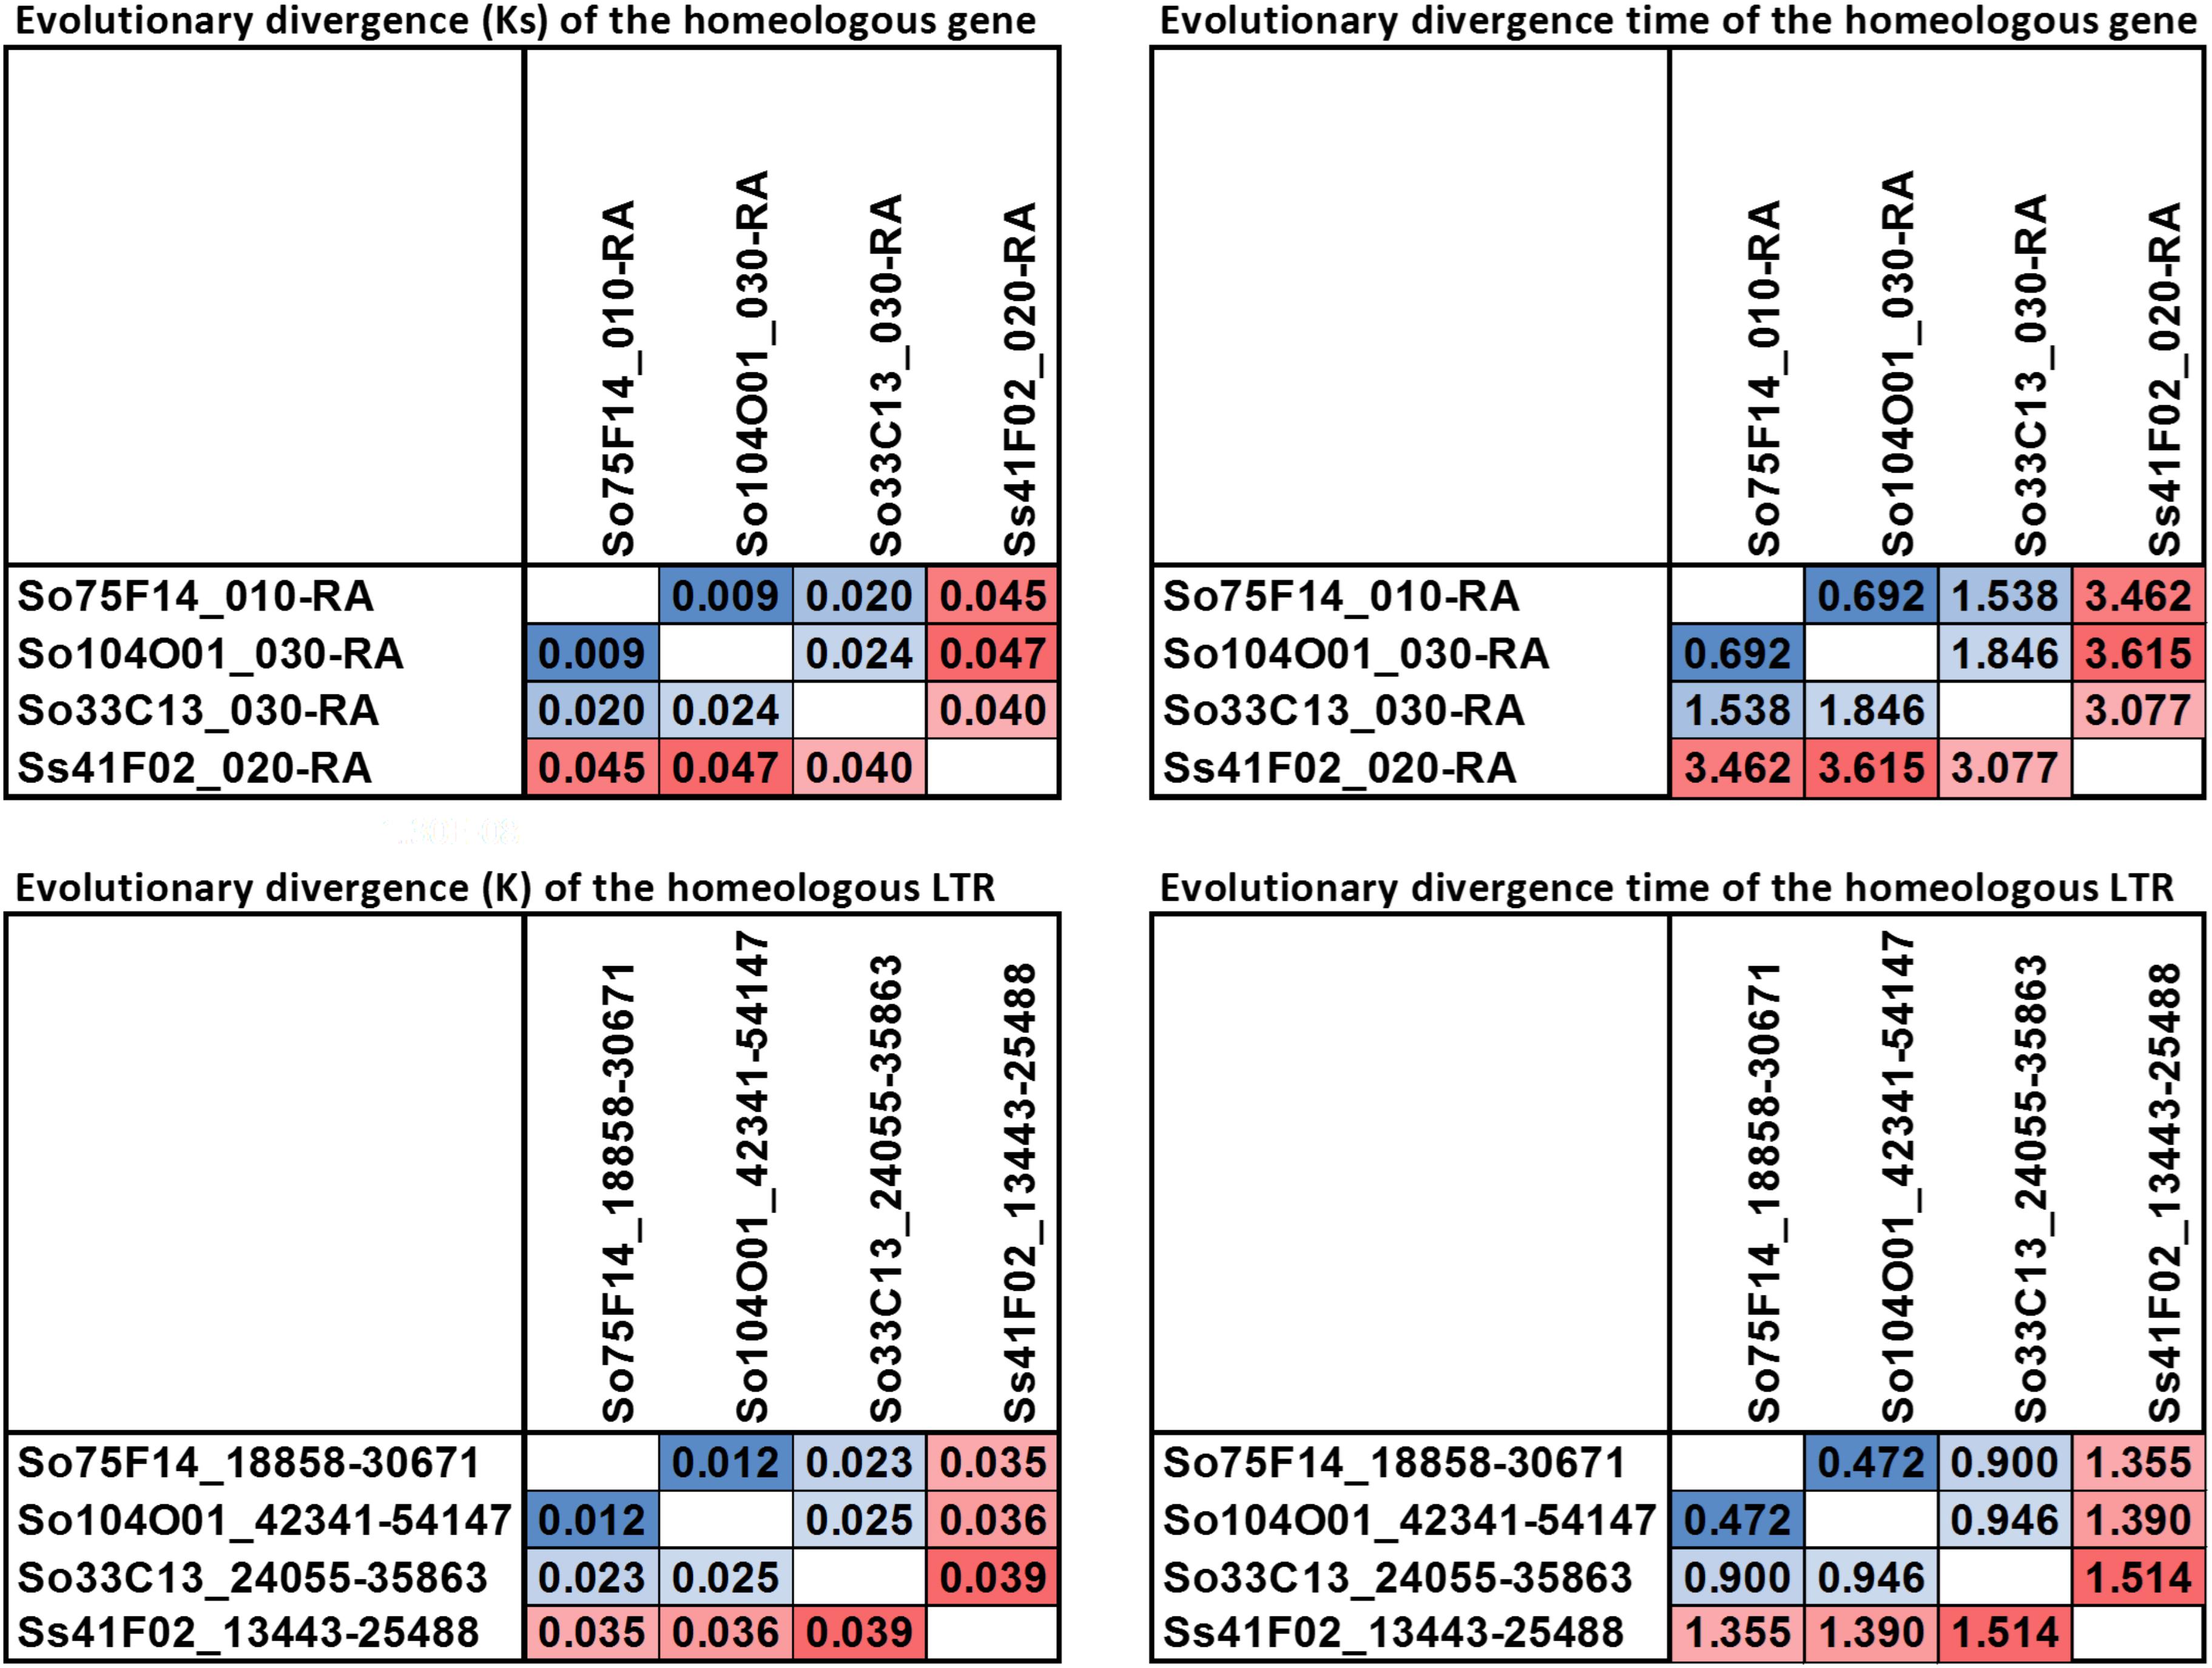
FIGURE 8. Pairwise evolutionary distance for a homeologous gene and a LTR. The homeologous gene and LTR sequence share a higher similarity among the three So BACs than to the Ss BAC.
Discussion
Sugarcane (Saccharum) is closely related to sorghum (Sorghum bicolor). The two progenitors of modern sugarcane, S. officinarum and S. spontaneum, are octoploids, which have experienced two rounds of whole genome duplications since the divergence of Saccharum and sorghum. The divergence time between sorghum and sugarcane has been variously estimated at 8–9 mys based on Adh1 gene (Jannoo et al., 2007), 7.7 mys based on 67 pairs of orthologous genes (Wang et al., 2010), 5.0–7.4 mys based on three homologous regions (Vilela et al., 2017), and 5.4 mys by Kim et al. (2014). Similarly, the divergence time of S. officinarum and S. spontaneum was also variably estimated at 1.5–2 mys based on Adh1 gene (Jannoo et al., 2007), and 2.5–2.8 mys based on TOR haplotypes (Vilela et al., 2017). We estimated the divergence time of sugarcane and sorghum at 7.7 mys (Ks = 0.10) and the divergence time of S. officinarum and S. spontaneum at 1.5 mys (Ks = 0.02) based on synonymous distance between syntenic gene pairs from S. officinarum, S. spontaneum and sorghum genomes. Our divergence time estimates overlap with those reported in previous studies and are expected to be more accurate because we used the mutation rate of a much larger number of genes from the two sugarcane progenitors.
The evolutionary history of polyploidization events in the genus Saccharum is still debated. Kim et al. (2014) proposed that allopolyploidy occurred in the common ancestor of Saccharum and Miscanthus, followed by Saccharum-specific autopolyploidy based on the distribution of Ks value peaks between Saccharum and Miscanthus paralogs. The authors used sorghum exons to identify paralogous Miscanthus exons, which were subsequently used to identify sugarcane paralogs from NCBI EST database. The authors used 2368 pairs of Miscanthus exons (equivalent to ∼391 genes, assuming 6.05 exons per transcript estimated for sorghum) to identify sugarcane paralogs from EST database. However, it is not clear whether the sugarcane paralogs were from S. officinarum only, as most ESTs in GenBank are from the sugarcane hybrid R570 which contains about 20% of the genome from S. spontaneum. Furthermore, a different research group reported that S. officinarum experienced two rounds of autopolyploidization and S. spontaneum experienced multiple polyploidization events independently after the two species separated from each other based on the distribution of shared TEs at the TOR and LFY haplotypes derived from S. officinarum and S. spontaneum genomes in the sugarcane hybrid R570 (Vilela et al., 2017). The authors found that most TE insertions occurred after the estimated divergence of S. officinarum and S. spontaneum at 2.5 to 3.5 mys and some of these insertions were restricted to S. officinarum haplotypes (Vilela et al., 2017). In this study, the authors did not find evidence of allopolyploidy shared between Saccharum and Miscanthus based on Ks values and shared TE insertions.
If Saccharum lineage originated from an allopolyploid ancestor followed by Saccharum-specific autopolyploidy, the distribution of Ks values of S. officinarum and S. spontaneum gene pairs should form two peaks, the older peak representing the divergence between the two distinct sub-genomes of the allopolyploid ancestor and the younger peak representing the divergence between the genes derived from the two sub-genomes via autopolyploidization. In our study, we detected a single sharp Ks peak at 0.02, which represents the divergence of S. officinarum and S spontaneum at 1.5 mys. Our result does not support the hypothesis of allopolyploidy occurred in the ancestor of Saccharum and Miscanthus followed by Saccharum-specific autopolyploidy.
Transposable elements form a large fraction of plant genomes. Although transposable element activity is tightly controlled in plant genomes by silencing or eliminating the TE copies, retrotransposition of TEs can be induced by stress (Wessler, 1996; Ito et al., 2016), tissue culture (Hirochika et al., 1996; Rhee et al., 2010), or events such as hybridization and polyploidy (Kashkush et al., 2002; Vicient and Casacuberta, 2017). Transposable element activation following polyploidy has been reported in numerous studies. Periodic bursts of centromeric LTR retrotransposon activity occurred after allopolyploidy through repeated formation of recombinants in maize genome (Sharma et al., 2008). Similarly, specific LTR retrotransposon families showed proliferation following autopolyploidy in the Buckler Mustard species complex (Bardil et al., 2015) and allopolyploidy in several other plant systems (Parisod et al., 2010; Senerchia et al., 2014). With the passage of time, TE insertions degenerate due to mutations, nested insertions, and deletions, making it difficult to identify shared insertions in diverged genomes. The half-life of LTR retrotransposons is shorter in smaller genomes such as Arabidopsis and rice and longer in large genomes such as wheat (Wicker and Keller, 2007). The half-life of LTR retrotransposons in rice, one of the smallest cereal genomes, was estimated at 4–6 my (Ma and Bennetzen, 2004; Zhang and Gao, 2017), which is longer than the estimated time of allopolyploidy in sugarcane at 3.8–4.6 mys (Kim et al., 2014). Surprisingly, most full-length LTR retrotransposon copies have inserted recently in both S. officinarum and S. spontaneum, long after the time of allopolyploidy (3.8 mys) proposed by Kim et al. (2014). In fact, of the 38 full-length retrotransposon elements identified in S. officinarum and 37 elements in S. spontaneum, none of them were older than 2.6 my and most had inserted in S. officinarum and S. spontaneum within the recent 1.6 and 0.9 my, respectively. Although a few full-length LTR retrotransposon insertions were shared by homologous chromosomes within S. officinarum and within S. spontaneum, no full-length elements were shared between S. officinarum and S. spontaneum. If retrotransposition was activated following allopolyploidy, a large number of young TEs should be identified in both S. officinarum and S. spontaneum genomes. A dearth of TE insertions shared by S. officinarum and S. spontaneum supports the latter hypothesis that two or more autopolyploidization events occurred independently in S. officinarum and S. spontaneum after their divergence. Contrary to earlier expectations, however, it is possible that retrotransposition was not activated following allopolyploidy in Saccharum or that the LTR insertions were purged from Saccharum genome rather quickly.
Although no shared full-length LTR retrotransposons were identified in S. officinarum and S. spontaneum, several remnants of shared TEs were identified based on unique TE junctions in S. officinarum and S. spontaneum. In general, the estimated number of nucleotide substitutions per site (K) between S. officinarum and S. spontaneum were much higher than those between homologous regions within S. officinarum and within S. spontaneum. Divergence time estimated using an intergenic region harboring a TE-junction shared by 3 So and 1 Ss BACs revealed that the S. spontaneum intergenic region was distant to those from the 3 homologous regions in S. officinarum. In addition, the same pattern of divergence was observed using the divergence (Ks) of a syntenic gene shared by all four BACs. Our result supports the latter hypothesis that S. officinarum experienced independent autopolyploidization events following its divergence from S. spontaneum (Vilela et al., 2017). However, we cannot exclude the possibility that high recombination and gene conversion may have homogenized the regions we examined from S. officinarum and S. spontaneum. Therefore, close examination of shared TEs at several other locations is warranted.
In summary, S. officinarum and S. spontaneum share a high degree of collinearity in genic regions. We did not find evidence of an early allopolyploidy in Miscanthus–Saccharum ancestor as proposed by Kim et al. (2014). The presence of many young LTR TEs, the absence of TEs closer to the proposed time of allopolyploidy, and high similarity of intergenic regions and a syntenic gene in at least 3 So BACs relative to the Ss BAC lend strong support to the hypothesis that S. officinarum and S. spontaneum experienced at least two rounds of independent polyploidizations in each lineage after their divergence from each other roughly 2 mys. The S. officinarum and S. spontaneum BAC libraries are a valuable resource for genomic studies of Saccharum and provide the foundation for identification of S. spontaneum and S. officinarum fractions in modern sugarcane genome. These BAC libraries can also be used for identification and characterization of targeted gene families, and for comparative and evolutionary genomics studies in sugarcane.
Data Availability Statements
The assembled BACs have been deposited in GenBank under the accession numbers MH182499-MH182581 and KU685404-KU685417.
Author Contributions
QY and RM designed the experiments, coordinated, and organized the all research activities. AS, JS, QL, RS, NR, KW, and JZ conducted the experiment and data analysis. AS and QY wrote the manuscript. All the authors read and approved the final manuscript.
Funding
This project was funded by the United States Department of Energy Office of Science and Office of Biological and Environmental Research (BER) grant no. DESC0010686 to RM and QY, Texas A&M AgriLife Research Bioenergy Initiatives to QY, Texas A&M AgriLife Research Genomics Seed Grant Program to QY, the United States Department of Agriculture National Institute of Food and Agriculture Hatch Project TEX0-1-9374 to QY, and the National Natural Science Foundation of China grant no. 31628013 to QY and KW.
Conflict of Interest Statement
The authors declare that the research was conducted in the absence of any commercial or financial relationships that could be construed as a potential conflict of interest.
Acknowledgments
The open access publishing fees for this article have been covered by the Texas A&M University Open Access to Knowledge Fund (OAKFund), supported by the University Libraries and the Office of the Vice President for Research.
Supplementary Material
The Supplementary Material for this article can be found online at: https://www.frontiersin.org/articles/10.3389/fpls.2018.01414/full#supplementary-material
Footnotes
- ^ http://www.lucigen.com
- ^ http://www.premierbiosoft.com/primerdesign/
- ^ http://www.hrt.msu.edu/uploads/535/78637/CRL_Scripts1.0.tar.gz
- ^ http://www.hrt.msu.edu/uploads/535/78637/alluniRefprexp070416.gz
- ^ ftp://ftpmips.helmholtz-muenchen.de/plants/REdat/
- ^ http://www.girinst.org/
References
Adams, K. L., and Wendel, J. F. (2005). Polyploidy and genome evolution in plants. Curr. Opin. Plant Biol. 8, 135–141. doi: 10.1016/j.pbi.2005.01.001
Bardil, A., Tayalé, A., and Parisod, C. (2015). Evolutionary dynamics of retrotransposons following autopolyploidy in the Buckler Mustard species complex. Plant J. 82, 621–631. doi: 10.1111/tpj.12837
Botha, F. C., and Moore, P. H. (2014). “Biomass and bioenergy,” in Sugarcane: Physiology, Biochemistry and Functional Biology, eds P. H. Moore and F. Botha (Oxford: Wiley-Blackwell), 521–540.
Bremer, G. (1961). Problems in breeding and cytology of sugar cane. Euphytica 10, 59–78. doi: 10.1007/BF00037206
Cantarel, B. L., Korf, I., Robb, S. M. C., Parra, G., Ross, E., Moore, B., et al. (2008). MAKER: an easy-to-use annotation pipeline designed for emerging model organism genomes. Genome Res. 18, 188–196. doi: 10.1101/gr.6743907
D’Hont, A., Grivet, L., Feldmann, P., Glaszmann, J. C., Rao, S., and Berding, N. (1996). Characterisation of the double genome structure of modern sugarcane cultivars (Saccharum spp.) by molecular cytogenetics. Mol. Gen. Genet. 250, 405–413. doi: 10.1007/BF02174028
D’Hont, A., Souza, G. M., Menossi, M., Vincentz, M., Van-Sluys, M.-A., Glaszmann, J. C., et al. (2008). “Sugarcane: a major source of sweetness, alcohol, and bio-energy,” in Genomics of Tropical Crop Plants Plant Genetics and Genomics: Crops and Models, Vol. 1, eds P. H. Moore and R. Ming (New York, NY: Springer), 483–513.
Domingues, D. S., Cruz, G. M., Metcalfe, C. J., Nogueira, F. T., Vicentini, R., de, S., et al. (2012). Analysis of plant LTR-retrotransposons at the fine-scale family level reveals individual molecular patterns. BMC Genomics 13:137. doi: 10.1186/1471-2164-13-137
Flutre, T., Duprat, E., Feuillet, C., and Quesneville, H. (2011). Considering transposable element diversification in de novo annotation approaches. PLoS One 6:e16526. doi: 10.1371/journal.pone.0016526
Gaut, B. S. (2002). Evolutionary dynamics of grass genomes. New Phytol. 154, 15–28. doi: 10.1046/j.1469-8137.2002.00352.x
Gaut, B. S., Morton, B. R., McCaig, B. C., and Clegg, M. T. (1996). Substitution rate comparisons between grasses and palms: synonymous rate differences at the nuclear gene Adh parallel rate differences at the plastid gene rbcL. Proc. Natl. Acad. Sci. U.S.A. 93, 10274–10279. doi: 10.1073/pnas.93.19.10274
Gómez-Merino, F. C., Sentíes-Herrera, H. E., and Trejo Téllez, L. I. (2014). “Sugarcane as a novel biofactory: potencialities and challenges,” in Biosystems Engineering: Biofactories for Food Production in the Century XXI, eds R. Guevara-Gonzalez and I. Torres-Pacheco (Cham: Springer).
Goodstein, D. M., Shu, S., Howson, R., Neupane, R., Hayes, R. D., Fazo, J., et al. (2012). Phytozome: a comparative platform for green plant genomics. Nucleic Acids Res. 40, D1178–D1186. doi: 10.1093/nar/gkr944
Haas, B. J., Delcher, A. L., Wortman, J. R., and Salzberg, S. L. (2004). DAGchainer: a tool for mining segmental genome duplications and synteny. Bioinformatics 20, 3643–3646. doi: 10.1093/bioinformatics/bth397
Han, Y., and Wessler, S. R. (2010). MITE-Hunter: a program for discovering miniature inverted-repeat transposable elements from genomic sequences. Nucleic Acids Res. 38, e199. doi: 10.1093/nar/gkq862
Hirochika, H., Sugimoto, K., Otsuki, Y., Tsugawa, H., and Kanda, M. (1996). Retrotransposons of rice involved in mutations induced by tissue culture. Proc. Natl. Acad. Sci. U.S.A. 93, 7783–7788. doi: 10.1073/pnas.93.15.7783
Irvine, J. E. (1999). Saccharum species as horticultural classes. Theor. Appl. Genet. 98, 186–194. doi: 10.1007/s001220051057
Ito, H., Kim, J.-M., Matsunaga, W., Saze, H., Matsui, A., Endo, T. A., et al. (2016). A stress-activated transposon in Arabidopsis induces transgenerational abscisic acid insensitivity. Sci. Rep. 6:23181. doi: 10.1038/srep23181
Jannoo, N., Grivet, L., Chantret, N., Garsmeur, O., Glaszmann, J. C., Arruda, P., et al. (2007). Orthologous comparison in a gene-rich region among grasses reveals stability in the sugarcane polyploid genome. Plant J. 50, 574–585. doi: 10.1111/j.1365-313X.2007.03082.x
Jiao, Y., and Paterson, A. H. (2014). Polyploidy-associated genome modifications during land plant evolution. Philos. Trans. R. Soc. Lond. B Biol. Sci. 369:20130355. doi: 10.1098/rstb.2013.0355
Jurka, J., Kapitonov, V. V., Pavlicek, A., Klonowski, P., Kohany, O., and Walichiewicz, J. (2005). Repbase update, a database of eukaryotic repetitive elements. Cytogenet. Genome Res. 110, 462–467. doi: 10.1159/000084979
Kashkush, K., Feldman, M., and Levy, A. A. (2002). Gene loss, silencing and activation in a newly synthesized wheat allotetraploid. Genetics 160, 1651–1659.
Kim, C., Wang, X., Lee, T.-H., Jakob, K., Lee, G.-J., and Paterson, A. H. (2014). Comparative analysis of Miscanthus and Saccharum reveals a shared whole-genome duplication but different evolutionary fates. Plant Cell 26, 2420–2429. doi: 10.1105/tpc.114.125583
Korf, I. (2004). Gene finding in novel genomes. BMC Bioinformatics 5:59. doi: 10.1186/1471-2105-5-59
Kumar, S., Stecher, G., and Tamura, K. (2016). MEGA7: molecular evolutionary genetics analysis version 7.0 for Bigger Datasets. Mol. Biol. Evol. 33, 1870–1874. doi: 10.1093/molbev/msw054
Langham, R. J., Walsh, J., Dunn, M., Ko, C., Goff, S. A., and Freeling, M. (2004). Genomic duplication, fractionation and the origin of regulatory novelty. Genetics 166, 935–945.
Li, W., and Godzik, A. (2006). Cd-hit: a fast program for clustering and comparing large sets of protein or nucleotide sequences. Bioinformatics 22, 1658–1659. doi: 10.1093/bioinformatics/btl158
Llorens, C., Futami, R., Covelli, L., Domínguez-Escribá, L., Viu, J. M., Tamarit, D., et al. (2011). The gypsy database (GyDB) of mobile genetic elements: release 2.0. Nucleic Acids Res. 39, D70–D74. doi: 10.1093/nar/gkq1061
Luce, A. C., Sharma, A., Mollere, O. S. B., Wolfgruber, T. K., Nagaki, K., Jiang, J., et al. (2006). Precise centromere mapping using a combination of repeat junction markers and chromatin immunoprecipitation-polymerase chain reaction. Genetics 174, 1057–1061. doi: 10.1534/genetics.106.060467
Lyons, E., and Freeling, M. (2008). How to usefully compare homologous plant genes and chromosomes as DNA sequences. Plant J. Cell Mol. Biol. 53, 661–673. doi: 10.1111/j.1365-313X.2007.03326.x
Ma, J., and Bennetzen, J. L. (2004). Rapid recent growth and divergence of rice nuclear genomes. Proc. Natl. Acad. Sci. U.S.A. 101, 12404–12410. doi: 10.1073/pnas.0403715101
Ming, R., Moore, P. H., Zee, F., Abbey, C. A., Ma, H., and Paterson, A. H. (2001). Construction and characterization of a papaya BAC library as a foundation for molecular dissection of a tree-fruit genome. Theor. Appl. Genet. 102, 892–899. doi: 10.1007/s001220000448
Nussbaumer, T., Martis, M. M., Roessner, S. K., Pfeifer, M., Bader, K. C., Sharma, S., et al. (2013). MIPS PlantsDB: a database framework for comparative plant genome research. Nucleic Acids Res. 41, D1144–D1151. doi: 10.1093/nar/gks1153
Otto, S. P., and Whitton, J. (2000). Polyploid incidence and evolution. Annu. Rev. Genet. 34, 401–437. doi: 10.1146/annurev.genet.34.1.401
Parisod, C., Alix, K., Just, J., Petit, M., Sarilar, V., Mhiri, C., et al. (2010). Impact of transposable elements on the organization and function of allopolyploid genomes. New Phytol. 186, 37–45. doi: 10.1111/j.1469-8137.2009.03096.x
Ranwez, V., Harispe, S., Delsuc, F., and Douzery, E. J. P. (2011). MACSE: multiple alignment of coding sequences accounting for frameshifts and stop codons. PLoS One 6:e22594. doi: 10.1371/journal.pone.0022594
Rhee, Y., Sekhon, R. S., Chopra, S., and Kaeppler, S. (2010). Tissue culture-induced novel epialleles of a Myb transcription factor encoded by pericarp color1 in maize. Genetics 186, 843–855. doi: 10.1534/genetics.110.117929
Rognes, T., Flouri, T., Nichols, B., Quince, C., and Mahé, F. (2016). VSEARCH: a versatile open source tool for metagenomics. PeerJ 4:e2584 doi: 10.7717/peerj.2584
Sambrook, J., Maniatis, T., Fritsch, E. F., and Laboratory, C. S. H. (1987). Molecular Cloning: A Laboratory Manual, 2nd Edn. Cold Spring Harbor, NY: Cold Spring Harbor Laboratory Press.
Senerchia, N., Felber, F., and Parisod, C. (2014). Contrasting evolutionary trajectories of multiple retrotransposons following independent allopolyploidy in wild wheats. New Phytol. 202, 975–985. doi: 10.1111/nph.12731
Sharma, A., Schneider, K. L., and Presting, G. G. (2008). Sustained retrotransposition is mediated by nucleotide deletions and interelement recombinations. Proc. Natl. Acad. Sci. U.S.A. 105, 15470–15474. doi: 10.1073/pnas.0805694105
Smit, A. F., and Hubley, R. (2008). RepeatModeler Open-1.0. Available at: http://www.repeatmasker.org/
Smit, A. F., Hubley, R., and Green, P. (1996). RepeatMasker Open-3.0. Available at: http://www.repeatmasker.org
Soltis, D. E., Albert, V. A., Leebens-Mack, J., Bell, C. D., Paterson, A. H., Zheng, C., et al. (2009). Polyploidy and angiosperm diversification. Am. J. Bot. 96, 336–348. doi: 10.3732/ajb.0800079
Stanke, M., Keller, O., Gunduz, I., Hayes, A., Waack, S., and Morgenstern, B. (2006). AUGUSTUS: ab initio prediction of alternative transcripts. Nucleic Acids Res. 34, W435–W439. doi: 10.1093/nar/gkl200
Stebbins, G. L. Jr. (1947). Types of polyploids: their classification and significance. Adv. Genet. 1, 403–429. doi: 10.1016/S0065-2660(08)60490-3
Sullivan, M. J., Petty, N. K., and Beatson, S. A. (2011). Easyfig: a genome comparison visualizer. Bioinformatics 27, 1009–1010. doi: 10.1093/bioinformatics/btr039
Suzek, B. E., Huang, H., McGarvey, P., Mazumder, R., and Wu, C. H. (2007). UniRef: comprehensive and non-redundant UniProt reference clusters. Bioinformatics 23, 1282–1288. doi: 10.1093/bioinformatics/btm098
Van de Peer, Y., Mizrachi, E., and Marchal, K. (2017). The evolutionary significance of polyploidy. Nat. Rev. Genet. 18, 411–424. doi: 10.1038/nrg.2017.26
Vicient, C. M., and Casacuberta, J. M. (2017). Impact of transposable elements on polyploid plant genomes. Ann. Bot. 120, 195–207. doi: 10.1093/aob/mcx078
Vilela, M., de, M., Del Bem, L. E., Van Sluys, M.-A., de Setta, N., Kitajima, J. P., et al. (2017). Analysis of three sugarcane homo/homeologous regions suggests independent polyploidization events of Saccharum officinarum and Saccharum spontaneum. Genome Biol. Evol. 9, 266–278. doi: 10.1093/gbe/evw293
Wang, J., Roe, B., Macmil, S., Yu, Q., Murray, J. E., Tang, H., et al. (2010). Microcollinearity between autopolyploid sugarcane and diploid sorghum genomes. BMC Genomics 11:261. doi: 10.1186/1471-2164-11-261
Wicker, T., and Keller, B. (2007). Genome-wide comparative analysis of copia retrotransposons in Triticeae, rice, and Arabidopsis reveals conserved ancient evolutionary lineages and distinct dynamics of individual copia families. Genome Res. 17, 1072–1081. doi: 10.1101/gr.6214107
Xu, Z., and Wang, H. (2007). LTR_FINDER: an efficient tool for the prediction of full-length LTR retrotransposons. Nucleic Acids Res. 35, W265–W268. doi: 10.1093/nar/gkm286
Yu, Q., Guyot, R., de Kochko, A., Byers, A., Navajas-Pérez, R., Langston, B. J., et al. (2011). Micro-collinearity and genome evolution in the vicinity of an ethylene receptor gene of cultivated diploid and allotetraploid coffee species (Coffea). Plant J. Cell Mol. Biol. 67, 305–317. doi: 10.1111/j.1365-313X.2011.04590.x
Zhang, J., Nagai, C., Yu, Q., Pan, Y.-B., Ayala-Silva, T., Schnell, R. J., et al. (2012). Genome size variation in three Saccharum species. Euphytica 185, 511–519. doi: 10.1007/s10681-012-0664-6
Zhang, J., Zhou, M., Walsh, J., Zhu, L., Chen, Y., and Ming, R. (2013). “Sugarcane genetics and genomics,” in Sugarcane: Physiology, Biochemistry, and Functional Biology, eds P. H. Moore and F. C. Botha (Hoboken, NY: John Wiley & Sons Ltd), 623–643. doi: 10.1002/9781118771280.ch23
Keywords: sugarcane, Saccharum, polyploidization, genetic divergence, retrotransposon
Citation: Sharma A, Song J, Lin Q, Singh R, Ramos N, Wang K, Zhang J, Ming R and Yu Q (2018) Comparative Analysis of Homologous Sequences of Saccharum officinarum and Saccharum spontaneum Reveals Independent Polyploidization Events. Front. Plant Sci. 9:1414. doi: 10.3389/fpls.2018.01414
Received: 15 March 2018; Accepted: 06 September 2018;
Published: 25 September 2018.
Edited by:
Jun Yang, Shanghai Chenshan Plant Science Research Center (CAS), ChinaReviewed by:
Fernando Carlos Gómez-Merino, Colegio de Postgraduados (COLPOS), MexicoRenato Vicentini, Universidade Estadual de Campinas, Brazil
Silvia Perea, Museo Nacional de Ciencias Naturales (MNCN), Spain
Niranjan Baisakh, Louisiana State University, United States
Wei Yao, Guangxi University, China
Copyright © 2018 Sharma, Song, Lin, Singh, Ramos, Wang, Zhang, Ming and Yu. This is an open-access article distributed under the terms of the Creative Commons Attribution License (CC BY). The use, distribution or reproduction in other forums is permitted, provided the original author(s) and the copyright owner(s) are credited and that the original publication in this journal is cited, in accordance with accepted academic practice. No use, distribution or reproduction is permitted which does not comply with these terms.
*Correspondence: Qingyi Yu, qyu@ag.tamu.edu