Microscopic Isthmuses and Fibrosis Within the Border Zone of Infarcted Hearts Promote Calcium-Mediated Ectopy and Conduction Block
 Fernando O. Campos
 Yohannes Shiferaw
 Rodrigo Weber dos Santos
 Gernot Plank
 Martin J. Bishop
- 1School of Biomedical Engineering and Imaging Sciences, King's College London, London, United Kingdom
- 2Department of Physics, California State University, Northridge, CA, United States
- 3Graduate Program in Computational Modelling, Federal University of Juiz de Fora, Juiz de Fora, Brazil
- 4Institute of Biophysics, Medical University of Graz, Graz, Austria
Ventricular tachycardia (VT) secondary to myocardial infarction (MI) remain a major cause of sudden death in adults. Premature ventricular complexes (PVCs), the first initiating beats of a portion of these arrhythmias, arise from triggered activity in the infarct border zone (BZ). At the cellular scale, spontaneous calcium release (SCR) events are a known cause of triggered activity and have been reported in cells that survive MI. At the tissue scale, fibrosis has been shown to play an important role in creating the substrate for VT. However, the interplay between SCR-mediated triggered activity and fibrosis upon VT formation in infarcted hearts has not been fully investigated. Here, we conduct in-silico experiments to assess how macroscopic and microscopic anatomical properties of the BZ can create a substrate for SCR-mediated VT formation. To study this question, we employ a stochastic subcellular-scale model of SCR events and action potential to simulate different cardiac preparations. Within 2D sheet models with idealized infarct scars and BZ we show that the probability of PVCs is higher, 55%, in preparations with thin conducting isthmuses (0.2 mm) transcending the scar. In an anatomically-detailed model of the rabbit ventricles with a realistic representation of intramural scars, we show that the heart's protective source-sink mismatch prevents ectopy. Furthermore, we demonstrate that fibrosis disrupts this antiarrhythmic mechanism making PVCs more likely. PVC probability is highest (≥25%) when fibrosis accounts for 60 and 90% of the BZ in the 2D sheet and the 3D anatomical model, respectively. Above these thresholds, PVC occurrence decreases because of: (1) the reduced number of myocytes in the BZ; (2) conduction block. Block is caused either by disconnection of BZ cells from the myocardium or due to source-sink mismatches at regions of rapid tissue expansion. Moreover, while outward propagation to healthy tissue may fail, PVCs traveling inward through the scar might encounter more favorable loading conditions. These PVCs may exit to the myocardium and reenter back at the region of block. Overall, our findings indicate that thin isthmuses and strands of myocytes interspersed with fibrosis can be arrhythmogenic. Ablation of these microscopic structures may prevent VT formation.
1. Introduction
Cardiovascular diseases, such as myocardial infarction (MI), continue to be the leading cause of morbidity and sudden death globally. MI is a common consequence of coronary artery disease, in which a narrowing or occlusion of an artery prevents the supply of oxygen-rich blood to the heart. A series of changes in the infarct region results in deterioration of electrical activity that has been shown to set the stage for ventricular tachycardias (VTs) [1, 2], the major cause of sudden cardiac arrest after MI [3]. Experimental evidence suggests that a variety of these arrhythmias are attributed to focal excitations in the infarct border zone (BZ) [4]. Electrophysiological and structural remodeling following MI render the region of injury more prone to reentry and triggered activity due to delayed afterdepolarizations (DADs) [1, 2].
At the cellular scale, DAD-triggered activity has been associated with “spontaneous” calcium (Ca2+) release (SCR) events from the sarcoplasmic reticulum [5, 6]. Such abnormal Ca2+ releases have been reported in Ca2+ overloaded myocytes [7], inherited heart rhythm disturbances [8], heart failure [9] as well as in cells that survive in the infarcted heart [10, 11]. DADs can be divided into subthreshold or suprathreshold depending on whether their amplitude is below or above the threshold for action potential (AP) initiation, respectively. At the tissue level, a triggered propagating AP would only be possible if the net ionic current generated by cells undergoing DADs within a given volume of myocardial tissue is sufficient to excite downstream coupled myocytes [12, 13]. This transition from single-cell to tissue/organ events depends on the electrotonic load posed by the surrounding myocardium that acts as sink for the source of depolarizing current produced by the triggered AP [13]. In MI, this protective source-sink mechanism is altered by reduced cell-to-cell coupling caused either by remodeling of gap junctions [14] or deposition of fibrous tissue as a result of wound healing [15]. While the infarct scar is important to maintain the structure of the heart wall, fibrotic inlays in the BZ have the undesired effect of disrupting the intracellular matrix. Consequently, the number of downstream cells that are coupled to each myocyte is reduced.
The notion that DADs are more likely to summate to trigger organ-scale premature ventricular complexes (PVCs) in regions experiencing lower electrotonic load has been supported by recent findings from our group [16, 17] as well as others [13]. Using in-silico experiments we have demonstrated that electrotonic loading conditions in the structurally healthy heart favor the origin of SCR-mediated PVCs in the 1D His-Purkinje system (HPS) instead of the 3D ventricles [16]. Similar to the HPS, where cells are electrically isolated from the myocardium by collagen sheaths [18], interstitial and patchy fibrosis in the infarct BZ [19, 20] can separate myocyte bundles reducing source-sink mismatches that prevent PVC formation in well coupled tissue.
While the link between subcellular SCR events and PVC formation in the structurally healthy ventricles has been a topic of intense research [8, 16, 21], the mechanism by which stochastic SCR events in cells that survive in the infarcted heart can summate to trigger PVCs remains to be elucidated. The goal of this study is to investigate the conditions under which SCR-mediated triggered activity in the infarct BZ can initiate arrhythmogenic PVCs (see schematic diagram in Figure 1). Our hypotheses are that (1) triggered activity in thin conducting isthmus within the scar or in myocytes from the BZ interspersed with fibrosis can summate to form ectopic focal sources due to the reduced electrotonic load on these cells; (2) source-sink mismatches at regions of abrupt tissue expansion such as the mouth of an isthmus or at the border between fibrotic and healthy tissue can lead to unidirectional block of PVCs setting the stage for VTs. These hypotheses are tested with the aid of state-of-the-art computer simulations within idealized as well as anatomically realistic cardiac infarct models prone to PVC formation induced by stochastic SCR events.
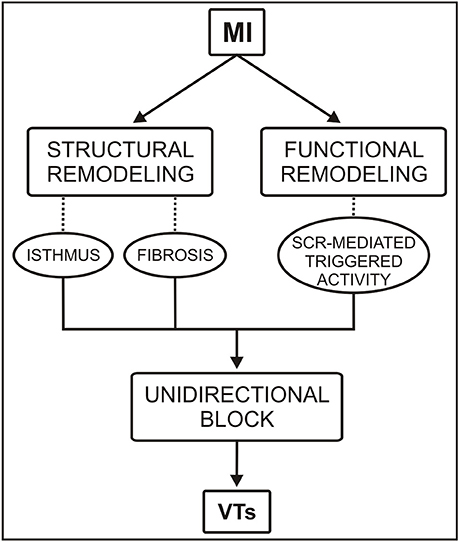
Figure 1. Conceptual diagram of the roles of functional and structural remodeling involved in a portion of ventricular tachycardias (VTs) following myocardial infarction (MI). SCR = spontaneous Ca2+ release.
2. Methods
2.1. Model of SCR and Ventricular AP
A stochastic phenomenological mathematical model of SCR events [22] was coupled to the Mahajan-Shiferaw (MSH) model [23] and used to simulate cellular dynamics in the myocardium as well as in the BZ. In this phenomenological model, a SCR event is represented as a Ca2+ wave that is nucleated in the cell and then propagating in a fire-diffuse-fire way [22]. The phenomenological model accounts for experimentally observed features of SCR events and has a dependence on SR Ca2+ load ensuring that SCR events are more likely to occur as the SR becomes overloaded [7]. Following our previous computational studies [16, 17], key parameters of the MSH model were modified to increase its propensity for Ca2+-mediated DADs. Specifically, Ca2+ overload was induced by increasing extracellular Ca2+ concentration from 1.8 to 4 mmol/L, the strength of the electrogenic sodium-calcium exchange current (INCX) was doubled and the maximum conductance of the inward rectifier potassium current (IK1) was decreased to 30% of its control value. If not stated otherwise, these values were used throughout the study.
2.2. Geometrical Models
Different geometrical finite element (FE) models were used throughout to simulate electrical activity in cardiac tissue: 2D sheets with idealized representations of infarct scars and BZ and an anatomically-detailed rabbit biventricular (BiV) model with a realistic representation of an intramural scar. The major components of the FE models are outlined below.
2.2.1. 2D Sheets With Idealized Scar
2D sheet models consisting of a square 4 × 4 cm with nodal spacing of 200 μm (40,000 quadrilateral FEs) were constructed to investigate the role of conducting isthmuses transcending the scar on the probability, timing and location of SCR-mediated triggered activity. Each model included an idealized infarct region representing a scar with an isthmus with different widths [24]. A transition region consisting of BZ myocytes surrounding the isthmus and scar region was also included in the models. A schematic of the 2D computational models is shown in Figure 2A. The radii of the scar and BZ were set to 15 and 17 mm, respectively, giving an isthmus length of 30 mm and a transition distance of 2 mm between the scar and healthy myocardium. The width of the isthmus wisth was varied between 0.2 and 8 mm to approximately represent microscopic tracts of surviving myocardium interspersed with fibrosis [19] as well as macroscopic channels within the scar [25, 26]. In addition, a 2D sheet with wisth progressively widening from 0.2 to 4 mm was built to study the effects of geometrical asymmetries on formation and conduction of PVCs. The scar tissue was represented as being necrotic, i.e., by imposing no-flux boundary condition at its interface [27]. Isotropic tissue conductivity was assigned to the tissue with a value of 0.14 S/m [28] to dissect out the role of the isthmus' width on PVC formation.
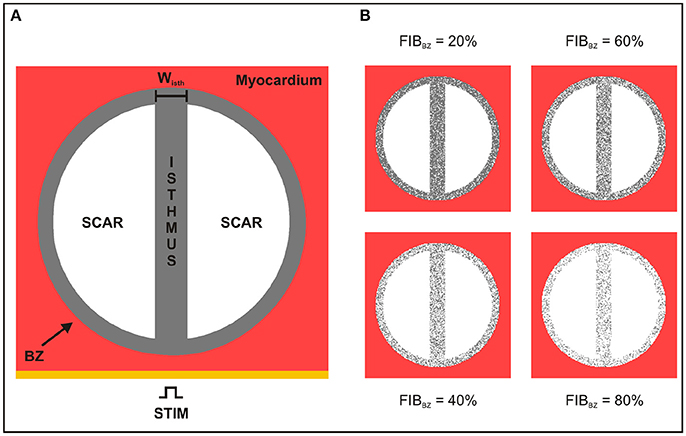
Figure 2. Schematic of the 2D sheet computational model. (A) The idealized infarct consisting of a circular region representing the BZ (gray), which contains two circular segments representing the scar (white), is surrounded by healthy myocardium (red). The BZ region contains an isthmus of width wisth separating the scars. (B) 2D sheet computational model with different degree of fibrosis in the BZ (FIBBZ).
2.2.2. Biventricular Scar Anatomy Model
The rabbit BiV model in this study is a tetrahedral FE model including realistic fiber architecture [29]. The model contains 547,680 myocardial nodes defining 3,073,529 tetrahedral elements with a mean discretization of 279 μm. Within this BiV model, an anatomically-detailed region of infarct scar and corresponding BZ was assigned according to a previous study from our group [30]. The scar anatomy in this study was defined representing approximate infarct regions created following occlusion of the left anterior descending (LAD) coronary artery (see Figure 3). The intracellular domain, comprising of both myocardium and BZ, was modeled with anisotropic conductivities values of 0.14 and 0.019 S/m along and transverse to the fiber direction, respectively [28]. This modeling choice allowed us to rule out any effects due to fiber disarray as well as to scrutinize the role of structural heterogeneities in the infarct BZ.
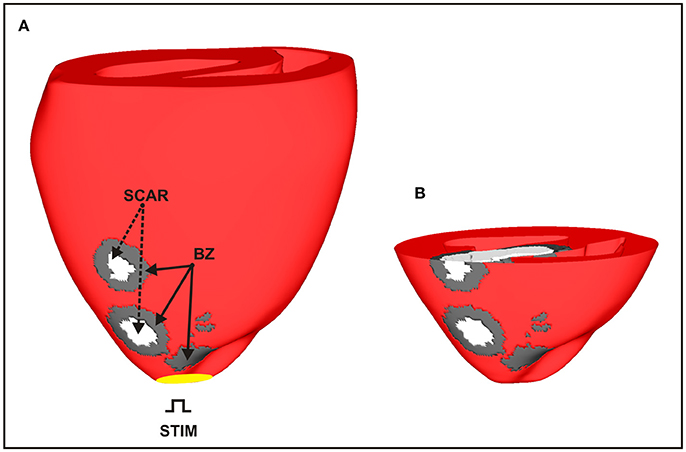
Figure 3. Anatomically-based representation of infarct scar and BZ within the BiV model based on infarct formation following occlusion of the LAD. (A) Healthy ventricular tissue is shown in red with necrotic scar in white and BZ tissue in gray. (B) Short-axis clipping plane view highlighting intramural scar anatomy.
2.3. Modeling Fibrosis in the BZ
Fibrosis in all geometrical models was modeled by including synthetic patterns of non-conducting tissue in the BZ [31–33] (see Figure 2B). Fibrosis patterns were generated by randomly transforming some of the BZ myocytes in fibrosis, i.e., non-conducting material. The amount of fibrosis in relation to myocardium in the BZ (FIBBZ) was varied from 0% (no fibrosis) to 100% in steps of 10%. Five fibrotic patterns were constructed for each FIBBZ. Fibrosis is modeled here in the same way as the scar, i.e., by imposing no-flux boundary conditions along the interface.
2.4. Governing Equations
Electrical activity within the geometrical models was simulated using the monodomain equations expressed as:
where σm = diag(σml, σmt, σmt) is the harmonic mean conductivity tensor or the effective bulk conductivity [34]; Vm is the transmembrane voltage; β is the surface to volume ratio; Im is the transmembrane current density; Cm is the membrane capacitance per unit area; Iion is the density of the total ionic current flowing through the membrane channels, pumps and exchangers; and Istim is the stimulus current density. Iion depends on Vm as well as on a set of state variables η which describes channel gating and ionic concentrations according to the vector-valued function f(Vm, η). Ionic dynamics Iion, η and f(Vm, η) were represented by the MSH rabbit ventricular cell model [23].
Solutions to the monodomain Equations (1–3) within the cardiac models were performed using the Cardiac Arrhythmia Research Package (CARP) [35].
2.5. Computational Protocols
2.5.1. Single-Cell Simulations
Similar to experimental protocols [7], extracellular Ca2+ in the DAD-prone MSH myocyte model was increased from 1.8 mmol/L to 4 mmol/L. The model was then paced at 2.0 Hz for 100 cycles to stabilize. At the end of the pacing protocol, the diastolic Ca2+ load in the SR increased from 1,200 μmol/L (control value) to 1,600 μmol/L (Ca2+ overload). Single-cell model states at the end of the pacing protocol were stored and used as initial conditions for the tissue models.
2.5.2. Tissue Simulations
Tissue models in this study were initialized with stabilized single-cell model states to avoid the computational burden associated with pacing tissue preparations. In the 2D sheet models, a stimulus current was applied in the lowermost portion of the tissue (Figure 2) while the BiV model was paced at the apex (see Figure 3). In both cases, the stimulus was followed by a 1,500-ms pause in order to see whether PVCs would emerge. Controlled stimuli followed by a halt in pacing is a widely used protocol as it allows for the correct characterization of triggered activity [7, 22]. SCR events were inhibited in the myocardium to investigate abnormal triggered activity only in cells in the infarct BZ. Moreover, due to the stochastic nature of the SCR events, N = 100 simulations for each set of experiments were performed. Further details on the in-silico simulation protocols used in this study have been provided in a recent publication [16].
2.6. Data Analysis
The number of simulations in which a PVC was observed, n, was recorded to compute the probability pPVC = n/N during the pacing pause. PVCs that did not activate more than 50% of the ventricles were not computed in pPVC. Furthermore, location as well as the waiting time until the onset of a PVC, tPVC, was determined as the time instant of a triggered AP crossing -10 mV.
3. Results
In accordance with the protocol described previously, 100 simulations were conducted for each experiment in order to compute statistics on probability, location and timing of SCR-mediated PVCs.
3.1. Ectopy in 2D Sheets With Idealized Scars
Figure 4 shows snapshots of the wave propagation pattern of a paced beat followed by a PVC in a 2D sheet with a 4-mm isthmus. The excitation wavefront resulting from the paced beat (t = 5 ms) can be seen to propagate quickly through both myocardium and isthmus (t = 75 ms). SCR events in myocytes from the BZ led to DADs that summated to trigger a PVC at time t = 850 ms within the isthmus. The PVC successfully propagated to both proximal and distal mouths (relative to the stimulus site) of the isthmus (870 ms ≤ t ≤ 880 ms) entering the myocardium where both wavefronts collide at about t = 920 ms.
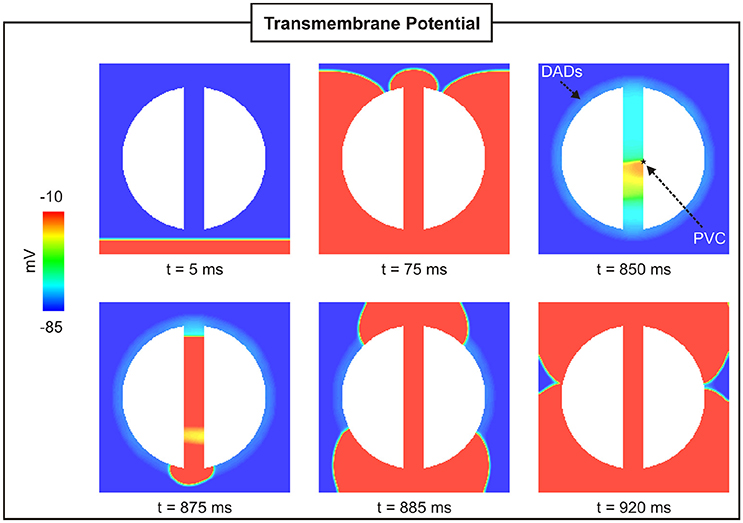
Figure 4. PVC formation in a 2D sheet with the isthmus width of 4 mm. Vm maps at different times showing a paced beat (t = 5 ms) followed by a PVC (t = 850 ms) in the isthmus.
3.1.1. 2D sheets With Different Isthmus Widths
Probability, timing and location of PVCs within the 2D models as a function of isthmus' width are shown in Figures 5, 6. pPVC decreases as the width of the isthmus increases dropping from 55% in the 2D sheet with a microscopic isthmus (wisth = 0.2 mm) to 0% in the sheet with a 8-mm macroscopic channel. In addition, PVCs arose earlier on average within cardiac tissues with thinner isthmuses. tPVC was 805 ± 30 ms in the sheet with 0.2 mm isthmus compared to 843 ± 33 ms in the 2D sheet with an isthmus 10x larger (wisth = 2 mm). Figure 6 shows the location of ectopic focal sources in the sheets with wisth = 0.2, 2, and 4 mm. Although all myocytes were undergoing SCR events in the BZ, PVCs only originated in the isthmus. Furthermore, foci were found throughout the isthmus and away from both mouths. The minimum focus-to-mouth distance was 2.61 and 14.14 mm for wisth = 0.2 mm and wisth = 4 mm, respectively. Only one PVC was detected in N = 100 experiments with the cardiac sheet with a 4-mm isthmus (focus as well as propagation pattern are shown in Figure 4).
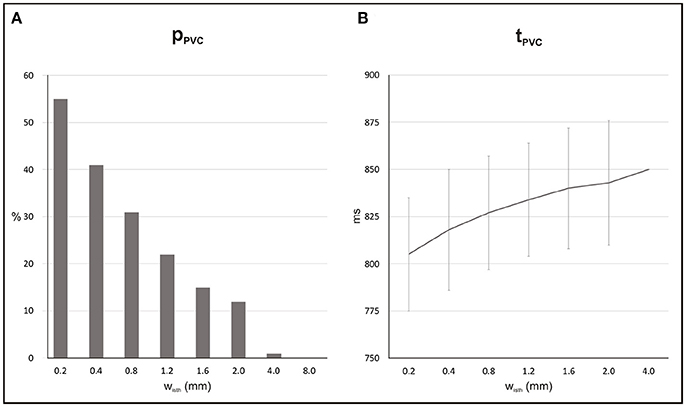
Figure 5. Statistics of SCR-mediated PVCs in 2D sheets with different isthmus widths (wisth). (A) Probability pPVC of SCR-mediated PVCs. (B) Average waiting time tPVC.
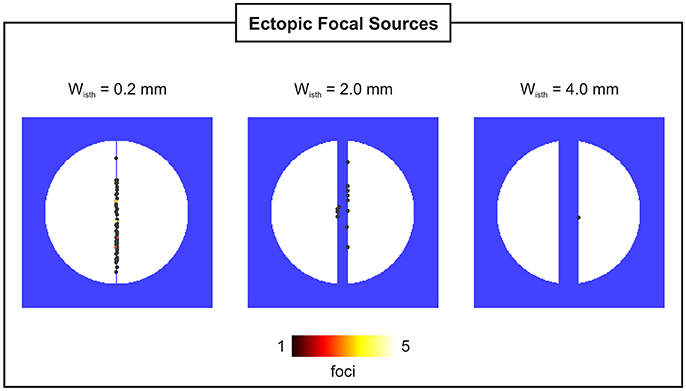
Figure 6. Location and incidence of PVCs in 2D sheets with isthmus widths of 0.2, 2, and 4 mm.
3.1.2. Effect of Fibrosis in the BZ
To assess the effect of fibrosis density on PVC formation, synthetic fibrosis patterns were added to the BZ of the 2D cardiac sheet with a 4-mm isthmus (see Figure 2B). Figure 7 shows the spatial distribution of Vm at different times in a 2D sheet with fibrotic density FIBBZ = 50%. Unlike in the control case, Figure 4, where the paced beat traveled with the same velocity throughout the myocardium and the isthmus, conduction was slower within the fibrotic model due to the more complex pathway the wavefront had to travel. The PVC in the fibrotic BZ model originated earlier, t = 772 ms, than in the control case (t = 850 ms), but took longer to exit at the proximal mouth of the isthmus (43 ms compared to 25 ms with no fibrosis). It can be seen at time t = 850 ms that clusters of cells in isthmus as well as in the BZ (areas enclosed by circles) are not activated by the wavefronts since they are separated from the rest of the conducting tissue by fibrosis.
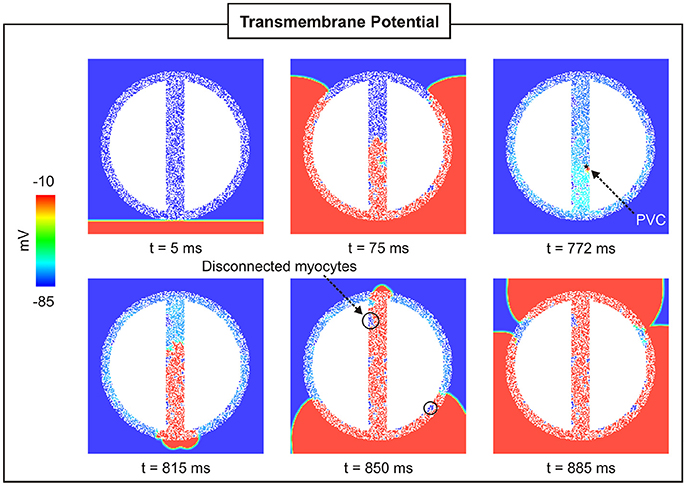
Figure 7. PVC formation in a 2D sheet with wisth = 4 mm and FIBBZ = 50%. Vm maps at different times showing a paced beat (t = 5 ms) followed by a PVC (t = 772 ms) in the isthmus.
Statistics and location of PVCs in the 2D sheet with different fibrotic patterns inserted in the BZ are presented in Figures 8, 9. For each FIBBZ, five fibrotic patterns were constructed and added to the BZ of the 2D sheet model resulting in a total of N = 5 × 100 simulations per FIBBZ. Note that, in Figure 8A, PVCs become more likely as the amount of fibrosis in the BZ increases with maximum pPVC = 25% for FIBBZ = 60%. Above this threshold, pPVC decreased and dropped to zero in 2D sheets with densely fibrotic BZs (FIBBZ ≥ 80%) due to the reduced number of cells available to trigger a PVC. pPVC also varied for the same FIBBZ because of differences in the randomness of the pattern (topology) of the fibrotic region. In the case of FIBBZ = 60%, for instance, pPVC was 9% (N = 100) and pPVC = 39% (N = 100) for the least and most arrhythmogenic fibrotic patterns, respectively.
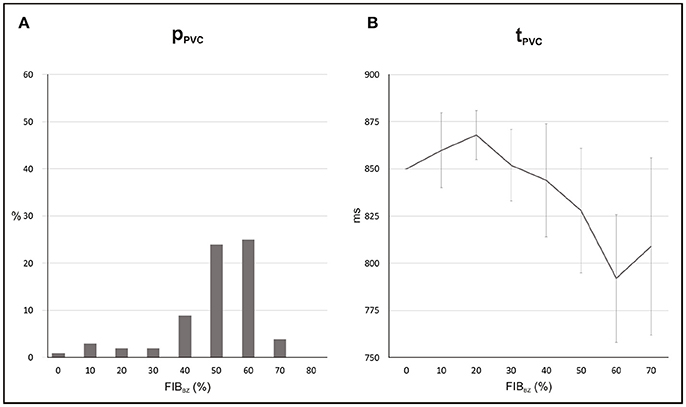
Figure 8. Statistics of PVCs in 2D sheets with different FIBBZ. (A) Probability pPVC of SCR-mediated PVCs. (B) Average waiting time tPVC.
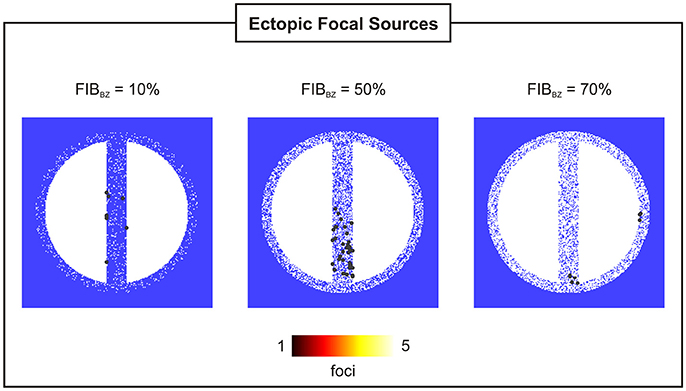
Figure 9. Location and incidence of PVCs in 2D sheets with wisth = 4 mm and FIBBZ = 10, 50, and 70%.
Figure 8B shows that reduced cell coupling caused by fibrosis facilitated triggered activity at the cellular level to form PVCs earlier than in the control 2D sheet: tPVC = 792 ms ± 34 ms for FIBBZ = 60% compared to tPVC = 850 ms for FIBBZ = 0%. As can be seen in Figure 9, most PVCs originated within the isthmus, but foci were also found in cells interspersed with fibrosis in the BZ (FIBBZ = 70%). Although triggered activity was observed in clusters of cells in 2D sheets with highly fibrotic BZs (FIBBZ ≥ 70%), they did not propagate to the myocardium as they were located in isolated regions confined by patches of fibrosis.
3.1.3. Unidirectional Conduction Block and Reentry
Unidirectional block was only observed in experiments with a particular topology of the 2D sheet with FIBBZ = 60% exhibiting regions of abrupt tissue expansion. However, no reentries were detected in any of the simulations performed above. In order to investigate whether reentry can occur resulting from the combination of unidirectional block of SCR-mediated PVCs and slow conduction, the experiment with the 2D sheet with FIBBZ = 60% was repeated but with tissue conductivity reduced by 50%. In addition, a 2D sheet with a thin isthmus that progressively widens from 0.2 mm (proximal mouth) to 4 mm (distal) was employed to further study effects of thin-to-thick tissue expansion on block and reentry of PVCs. Reentries induced by PVCs were observed in 41 and 71% of all simulations (N = 100) on the 2D sheet with a widening of wisth and the 2D sheet with FIBBZ = 60%, respectively. Figure 10 illustrates how heterogeneities in both wisth and FIBBZ can lead to unidirectional conduction block due to source-sink mismatch. In both cases, a PVC is initiated by suprathreshold DADs near the proximal mouth of the isthmus (indicated by a star). Both PVCs failed to propagate from the proximal exit site to the myocardium due to unfavorable loading conditions. The PVCs propagated along the isthmus toward the distal mouth, where they entered the myocardium. The PVCs then proceeded to propagate around the scar arriving at the proximal mouth and entered the isthmus at the proximal mouth, setting up a reentrant circuit (see also Supplemental Movies 1, 2).
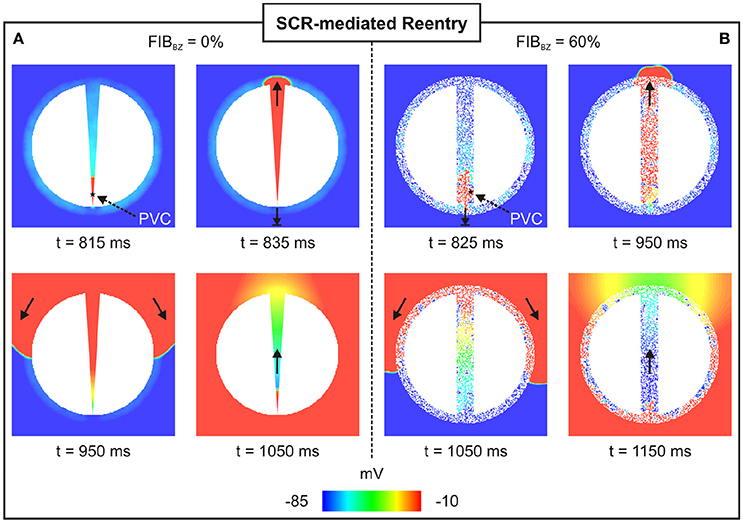
Figure 10. Arrhythmia induced by a SCR-mediated PVC. Reentry induced by a PVC in a (A) 2D sheet with wisth progressively widening from 0.2 mm (proximal to the stimulus) to 4 mm (distal mouth); and (B) 2D sheet with wisth = 4 mm and FIBBZ = 60%. Vm maps at different times showing PVCs triggered near the proximal mouth. Bold arrows depict successful propagation as well as unidirectional conduction block.
3.2. PVC Formation in the Biventricular Scar Anatomy Model
The BiV model was employed to investigate PVC formation in an anatomically-accurate infarct model of the rabbit ventricles (see Figure 3). Similar to the 2D sheet models, N = 100 simulations were performed to account for the stochastic properties of the phenomenological model of SCRs. SCR events were not capable of overcoming the ventricles source-sink mismatch to trigger a PVC in any of the simulations. In order to study whether fibrosis can disrupt this protective mechanism and promote PVCs, random synthetic fibrosis patterns were also added to the BZ of the BiV model. The activation sequence of a PVC computed in the BiV model with FIBBZ = 90% is illustrated in Figure 11. The PVC originated at t = 910 ms in surviving strands of myocardium within the macroscopic isthmus between two scars in the intraventricular septum (star), entered the healthy myocardium at about t = 945 ms and propagated throughout the ventricles.
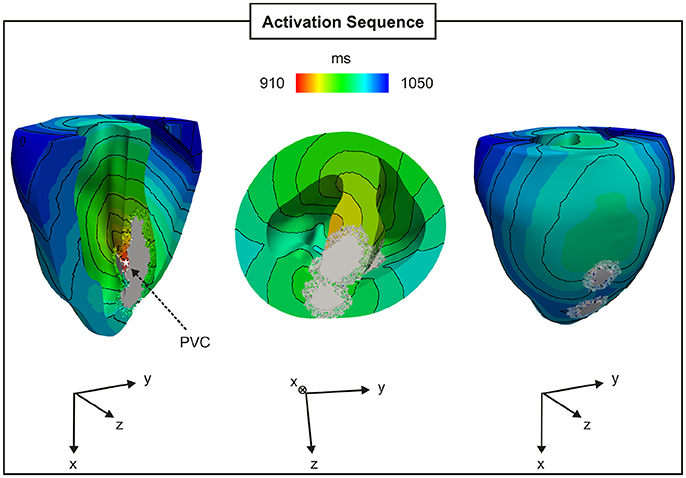
Figure 11. PVC formation in the rabbit BiV model with FIBBZ = 90%. Activation sequence on the endocardial and epicardial surfaces of a PVC originating between two scars in the intraventricular septum (star).
Probability and timing of SCR-mediated PVCs are shown in Figure 12. Results refer to N = 5 (topologies) × 100 simulations for each FIBBZ. pPVC increased from 1 to 52% while tPVC shortened from 856 ± 35 ms to 827 ± 43 ms in simulations with FIBBZ = 70 and 90%, respectively. Similar to the experiments with the idealized 2D infarct model, PVCs were most likely near a FIBBZ threshold which was shifted from FIBBZ = 60% in the 2D sheet to FIBBZ = 90% in the 3D BiV model. Differences in the synthetic patterns of fibrosis added to the BZ were also translated into increased or decreased propensity to PVC formation. In the BiV model with FIBBZ = 90%, 34 PVCs (N = 100 simulations) were observed in the least arrhythmogenic of the fibrotic topologies compared to pPVC = 70% in the most arrhythmogenic one. However, no reentrant episodes were observed in any of the experiments performed with the BiV model.
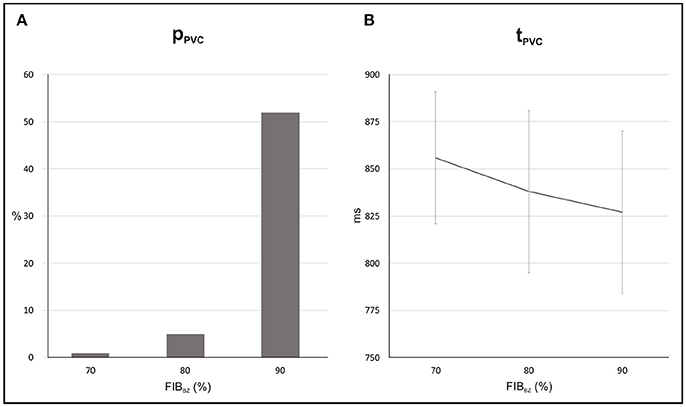
Figure 12. Statistics of PVCs in the BiV model with different degree of fibrosis in the BZ (FIBBZ). (A) Probability pPVC of SCR-mediated PVCs. (B) Average waiting time tPVC.
4. Discussion
In this study we made use of computer simulations to investigate the interplay between SCR-mediated triggered activity and structural remodeling in the infarct BZ upon arrhythmogenic PVC formation. An experimentally based model of SCR events at the subcellular scale was coupled to a model for the rabbit ventricular AP to simulate Ca2+-mediated triggered activity within cells in idealized 2D infarct tissue as well as in a BiV scar anatomy model. Simulation results showed that different anatomical properties of the BZ altered loading conditions which (1) increased the probability of SCR-mediated PVCs; and (2) facilitated unidirectional conduction block of PVCs. Regions of lower electrotonic load such as narrow isthmuses within the necrotic scar favored PVC formation. In addition, at the microscopic scale, the presence of fibrosis in the infarct BZ decoupled cells reducing the number of downstream coupled myocytes increasing pPVC. Finally, fibrosis also gave rise to regions of rapid tissue expansion from the BZ to the myocardium that enhanced source-sink mismatch facilitating unidirectional conduction block.
4.1. The Role of Electrotonic Load
Electrotonic modulation is a crucial factor preventing DADs from triggering propagating PVCs in tissue. Ectopy is only possible if errant cells undergoing DADs are capable of generate sufficient source current to bring the surrounding quiescent tissue, that acts as sink, to the activation threshold [12, 13]. Using computer simulations, [13] demonstrated that the source-sink mismatch was most severe in higher-dimensional cardiac tissue than in a 1D cable of coupled myocytes. However, PVCs in their models were evoked by synchronized DADs in a fixed number of cells rather than by stochastic SCRs and Ca2+ waves. In the present study, we made use of a stochastic phenomenological model [22] accounting for experimentally observed features of SCR events to investigate the electrotonic modulation of triggered activity in postinfarct tissue. Our findings (see Figure 5) suggest that PVCs are most likely to arise in thin conducting channels resembling 1D strands of cells. Simulations within 2D models with idealized infarct geometries demonstrated that pPVC was highest (55%) in the sheet model with the thinnest conducting isthmus (wisth = 0.2 mm) and gradually decreased as the size of the isthmus increased. This is because myocytes within the isthmus, which is enclosed on either side by scar, experience a lower electrotonic loading than the rest of the tissue. Such electrotonic effect can be seen in Figure 6. PVCs originated everywhere throughout the isthmus, but were found to lie away from both proximal and distal mouths (minimum focus-to-mouth distance was 2.61 mm for wisth = 0.2 mm) due to unfavored loading conditions in regions of abrupt tissue expansion [36, 37]. As the size of the isthmus increases, the electrotonic load on cells comes closer to that of a well-coupled 2D cardiac tissue. As a consequence, the number of cells that have to undergo sufficiently well synchronized DADs increases [13] making pPVC less likely as well as delaying tPVC [16].
In-silico experiments with the BiV scar anatomy model showed that the protective source-sink mismatch in the 3D ventricles prevented SCR-mediated DADs from triggering PVCs in the infarct BZ. This is in line with our previous findings in structurally normal ventricles, where we have shown that PVCs originate earlier and with overwhelming likelihood in the 1D HPS than in the 3D myocardium [16, 17]. Absence of PVCs in the BiV model is likely due to the geometry of the BZ used here. The 3D infarct morphology reflects tissue damage resulting from coronary artery occlusion, which can vary size and structure depending on individual variability in coronary anatomy and the extent of collaterals [38]. Different scar anatomy models with thinner isthmuses (<1 mm) could potentially result in PVCs.
Although triggered activity is more likely to form PVCs within thin isthmuses, successful propagation of these PVCs to the myocardium depends on local electrotonic conditions at the mouth of the isthmus. The cardiac safety factor for propagation has been shown to be minimum near regions of thin-to-thick tissue expansion [36], such as the mouth of the isthmus, where source current generated by the excited cells is insufficient to activate the downstream tissue [37]. Sink effects at the mouth of the isthmus can also be altered by elevations in Vm resulting from subthreshold DADs [17]. On one hand, depolarization of resting potential bring the cells closer to the threshold of the fast sodium current facilitating propagation [39]. On the other hand, long lasting DADs ultimately lead to inactivation of sodium channels promoting conduction block [17, 40]. Indeed, simulation results (see Supplementary Results, Figure S1 in supplementary materials) demonstrate that propagation of an AP initiated within the thinnest isthmus, wisth = 0.2 mm, to the myocardium depended on the amplitude of DADs at the exit site. Subthreshold DADs with lower amplitudes led to conduction block at isthmus' mouth, whereas DADs close to the activation threshold favored conduction of triggered APs to the myocardium. This finding is corroborated by our previous study [16], where SCR events happening in the whole ventricles, as a result of heart failure, gave rise to a global depolarization that gradually drove the tissue to the firing threshold.
4.2. Fibrosis and PVC Formation
Fibrosis plays an important role in the formation and persistence of a variety of cardiac arrhythmias [41]. As illustrated in Figure 7, fibrosis disrupts the intracellular matrix creating complex microscopic pathways through which the wavefront has to travel following zig-zag courses [42]. Such structural alterations lead to: (1) conduction slowing, a factor known to promote arrhythmias by shortening the wavelength [43]; and (2) electrogram fractionation [44] typically used in clinical practice to identify ablation targets [45]. Fibrosis has also been suggested to promote triggered activity by reducing the protective source-sink mismatch of tightly coupled tissue [15]. Xie et al. [13] have shown that the required number of contiguous myocytes exhibiting synchronized DADs decreases when tissue coupling is reduced by the presence of fibrosis. In their in-silico models, fibrosis was represented by fibroblasts randomly interposed either at the ends or sides of myocytes. The authors concluded that fibroblasts placed exclusively between the sides of myocytes had a major effect on PVC formation since they separate cells, turning a 2D tissue into a stack of longitudinal 1D fibers [13]. Fibrosis in all models employed in our study was modelled by randomly removing myocytes from the BZ [32]. Increased levels of fibrosis in the infarct BZ FIBBZ gave rise to complex arrangements between cells resembling 1D strands or 2D clusters. Consequently, PVC formation is favored (Figures 8–12) as the downstream loading on errant myocytes interspersed with fibrosis is lower due to the reduced number of cells coupled to each other.
A critical FIBBZ value above which pPVC decreases and becomes zero was observed in both geometrical models used in this work. Moreover, this threshold increased from FIBBZ = 60% in 2D sheet to FIBBZ = 90% in the 3D BiV model. Interestingly, recent studies have suggested a strong correlation between arrhythmogenesis and the percolation threshold [31–33]. This topological metric is a mathematical concept related to percolation theory, which describes the process of a moving substance passing through a medium with random structure. Although, quantitatively the critical FIBBZ values in this work differ from the percolation threshold [32], qualitatively our results showing that the FIBBZ threshold increases with tissue dimensionality are in line with the findings of Alonso et al. [32]. However, wavefronts in their work were initiated by pacing the tissue rather than by stochastic firing of errant cells. Here we demonstrated SCR-mediated PVCs are most likely in infarct models with FIBBZ close to a critical value. The decrease in pPVC in Figure 8A and Figure 12A above this FIBBZ threshold results from the combination of two factors. First, the replacement of myocytes by fibrosis reduced the amount of current sources contributing to the formation of an ectopic focus. Second, even though DADs could summate across cells to trigger an AP, propagation to the myocardium was not possible due to conduction block. Blocked PVCs in fibrotic BZs were either because the focal sources were disconnected from the rest of the tissue (see Figure 7) or due to unfavorable source-sink mismatch caused by thin-to-thick expansions from the BZ to the healthy myocardium (Figure 10).
Furthermore, not only the amount of fibrosis but also its texture may be a key arrhythmogenic factor [41]. Unlike in previous studies [13, 33], where percolation was used with different rules for myocyte removal to produce diffuse or interstitial fibrosis, the effects of different textures were investigated here simply by creating different random fibrotic BZs for a given FIBBZ. Propensity for PVC formation varied substantially from one topology (randomness of the pattern) to another in both geometrical models. In the 2D cardiac sheet with FIBBZ = 60%, pPVC varied between 9% and 39% whereas in the 3D BiV model (FIBBZ = 60%) pPVC was within the 34% ≤ pPVC ≤ 70% range.
4.3. Mechanism for SCR-Mediated Arrhythmogenesis
4.3.1. Unidirectional Conduction Block
Recently, Connolly et al. [24] have demonstrated that a premature stimulus capturing inside the isthmus may be blocked from propagating to the myocardium as the effective refractory period (ERP) was shown to be higher at the isthmus' proximal mouth. However, the induced PVC could still propagate further toward the distal end, where the tissue had recovered excitability, and reenter back around the scar [24]. In this work we have shown that conduction block can occur as a result of source-sink mismatch rather than heterogeneities in AP duration or in the ERP. This mechanism is illustrated in Figure 10 as well as in Supplemental Movies 1, 2, where SCR-mediated DADs achieved sufficient synchrony to trigger a PVC in the thinner end of the isthmus (Figure 10A) or in myocytes interspersed with fibrosis (Figure 10B). On one hand, myocytes located on these regions experienced a lower electrotonic load which favored PVC formation. On the other hand, unfavorable source-sink conditions at the proximal mouth caused by rapid tissue expansion led to unidirectional conduction block. This novel mechanism demonstrated here was theorized by Nguyen et al. [15]. The authors proposed that a PVC triggered in 1D-like tracts of myocytes separated by fibrosis in the infarct BZ may propagate both ways. They suggested that, outward propagation to the well-coupled healthy tissue may fail since the current source from the triggered AP in these strands of myocardium is suddenly diluted into a greater number of neighboring quiescent cells. However, inward propagation through the scar might encounter more favorable loading conditions caused by a progressive widening of the surviving myocardial bundles until the interface with normal myocardium [15]. The findings from our study show systematically how fibrosis in the infarct heart can alter local source-sink mismatch and directly facilitate unidirectional conduction block of PVCs induced by stochastic SCR events.
4.3.2. Wavelength and Reentrant Circuits
While a PVC can exit at the distal mouth and travel around the scar, it can only reenter back at the proximal site if the cells have regained excitability. Thus, electrophysiological changes promoting slow conduction or shortening of the ERP are key factors in the success of a reentrant circuit [43]. No reentrant episodes were observed in any of the experiments using tissue conductivities obtained from experiments with the healthy mammalian heart [28]. Additional simulations with geometrical models prone to unidirectional block were performed with tissue conductivities reduced by 50%, mimicking altered cell-to-cell known to happen in pathological settings such as heart failure [2], to investigate whether PVCs can form a reentrant wave. Examples of reentries induced by SCR-mediated PVCs on two different 2D infarct models are shown in Figure 10. The reduced tissue conductivity shortened the wavelength allowing the PVC to reenter at the proximal site as the tissue in that region had regained excitability. See Supplemental Movies 1, 2 for further details.
No reentries were detected in any of the experiments with the BiV model. As discussed previously, this is probably because of the geometry of the BZ. Other scar anatomies with different fibrotic patterns could give rise to arrhythmogenic 3D source-sink asymmetries at the boundaries with the healthy myocardium increasing the likelihood of unidirectional conduction block and reentry.
4.4. Clinical Implications
Reentrant VTs in the postinfarction heart have been associated with the presence of a critical conducting isthmus within the scar [25, 26]. The identification of such conducting channels is of great clinical significance as they provide an important target for catheter ablation therapy [26, 30]. Here we demonstrated that isthmuses also provide a substrate for PVC formation, the first initiating beats of a variety of VTs. Our results suggest that ablation of isthmuses therefore may not only interrupt a reentrant pathway, but also prevent the formation of ectopic focal sources. Moreover, advances have been made toward regeneration of cardiac tissue following MI [46], but knowledge of possible beneficial as well as adverse (proarrhythmic) outcomes is still limited. While the ultimate goal of regenerative therapy is to replace scar tissue by new contracting myocytes, an overactive tissue healing repair can lead to collagen accumulation in the BZ [46]. Our biophysically detailed simulations showed that increased levels of fibrosis in the BZ reduce local source-sink mismatch favoring PVC formation. Finally, reduced excitability due to blocking of sodium channels by antiarrhythmic drugs or sodium channelopathies associated with long Q-T and Brugada syndromes [47] have been shown to create a potent substrate for arrhythmia induction by PVCs [17, 40, 48]. In the infarcted heart, sodium current reduction can further enhance source-sink mismatches causing unidirectional block of PVCs at regions of abrupt tissue expansion.
4.5. Study Limitations
The SCR-mediated PVCs in this study were induced by increasing extracellular Ca2+ concentration. However, SCR events in cells that survive in the infarct BZ may occur as a result of sympathetic nerve remodeling [49] as well as increased levels of Ca2+/calmodulin-dependent protein kinase II (CaMKII) autophosphorylation [50]. Nevertheless, abnormal SCRs and Ca2+ wave activity has been shown to be the underlying cause of DADs in cells that survive in the BZ [10, 11] and are accounted for in our phenomenological model. Furthermore, while other remodeling processes are known to take place in ischemia and infarction [1, 39, 51], only modifications that increase propensity of the MSH model to DAD-triggered activity were implemented here [16, 17]. This modeling choice allowed us to precisely assess how stochastic triggered activity in cells that survive MI can form organ-scale PVCs. Collagen deposition is also one of the hallmarks of structural remodeling in the BZ [19]. Fibrosis is included in our models by randomly removing myocytes from the BZ. Although fibrosis distribution can be obtained from imaging data [33], the simplistic synthetic patterns of fibrosis used in this work allowed us to investigate how degree as well as texture of fibrosis influence PVC formation. Finally, fibrosis was modeled by removing FEs representing myocardium from the geometrical models. While more sophisticated techniques exist [27], overall behavior would be qualitatively similar since wave propagation would still have to travel tortuous pathways.
5. Conclusions
In this work, state-of-the-art computational models were employed to investigate whether Ca2+-mediated ectopy is facilitated by macroscopic as well as microscopic anatomical properties of the BZ of infarcted hearts. Our in-silico experiments have demonstrated that thin isthmuses transcending the non-conducting scar as well as strands of surviving myocytes interspersed with fibrosis are sources of PVCs initiated by abnormal SCR events. Triggered activity within thin strands of myocytes is more likely to summate and form PVCs due to the lesser electrotonic load on these cells. While the heart's antiarrhythmic source-sink mismatch prevented PVC formation in macroscopic isthmuses, fibrosis was shown to disrupt this protective mechanism favoring arrhythmogenic focal sources. Moreover, fibrosis contributed to unidirectional block of PVCs and when combined with slow conduction made the tissue vulnerable to reentry. Our simulation results suggest that catheter ablation of isthmuses as well as fibrotic BZ tissue can be highly effective against ectopy in postinfarct ventricles.
Author Contributions
FC, YS, RW, GP, and MB conceived and designed the experiments. FC performed the experiments. FC and MB analyzed the data. YS and GP contributed reagents, materials, analysis tools. FC and MB wrote the paper.
Funding
This research was supported by the National Institute for Health Research (NIHR) Clinical Research Facility at Guy's and St. Thomas' National Health Service (NHS) Foundation Trust and NIHR Biomedical Research Centre based at Guy's and St. Thomas' NHS Foundation Trust and King's College London. The views expressed are those of the authors and not necessarily those of the NHS, the NIHR or the Department of Health. Open access for this article was funded by King's College London. FC and MB acknowledge the support of the British Heart Foundation through Project Grant PG/16/81/32441. YS was supported by the National Heart, Lung, and Blood Institute (RO1-119095). FC and RW were supported by CNPq (Conselho Nacional de Desenvolvimento Científico e Tecnológico) - Brazil. RW was also supported by the National Council for the Improvement of Higher Education (CAPES), Minas Gerais State Foundation for Research Development (FAPEMIG) and Federal University of Juiz de Fora. GP acknowledges the support of the National Institutes of Health (grant number 1RO1 HL 10119601) and the Austrian Science Fund (FWF) within the SFB Mathematical Optimization and Applications in Biomedical Sciences (grant number F3210-N18). MB acknowledges the support of the UK Medical Research Council through a New Investigator Research Grant number MR/N011007/1.
Conflict of Interest Statement
The authors declare that the research was conducted in the absence of any commercial or financial relationships that could be construed as a potential conflict of interest.
The reviewer WM and handling editor declared their shared affiliation.
Supplementary Material
The Supplementary Material for this article can be found online at: https://www.frontiersin.org/articles/10.3389/fphy.2018.00057/full#supplementary-material
References
1. Janse MJ, Wit AL. Electrophysiological mechanisms of ventricular arrhythmias resulting from myocardial ischemia and infarction. Physiol Rev. (1989) 69:1049–169. doi: 10.1152/physrev.1989.69.4.1049
2. Nattel S, Maguy A, Bouter SL, Yeh YH. Arrhythmogenic ion-channel remodeling in the heart: heart failure, myocardial infarction, and atrial fibrillation. Physiol Rev. (2007) 87:425–56. doi: 10.1152/physrev.00014.2006
3. John RM, Tedrow UB, Koplan BA, Albert CM, Epstein LM, Sweeney MO, et al. Ventricular arrhythmias and sudden cardiac death. Lancet (2012) 380:1520–9. doi: 10.1016/S0140-6736(12)61413-5
4. Chou CC, Zhou S, Hayashi H, Nihei M, Liu YB, Wen MS, et al. Remodelling of action potential and intracellular calcium cycling dynamics during subacute myocardial infarction promotes ventricular arrhythmias in Langendorff-perfused rabbit hearts. J Physiol. (2007) 580(Pt.3):895–906. doi: 10.1113/jphysiol.2006.120659
5. Boyden PA, Pu J, Pinto J, Keurs HE. Ca2+ transients and Ca2+ waves in purkinje cells: role in action potential initiation. Circ Res. (2000) 86:448–55. doi: 10.1161/01.RES.86.4.448
6. Schlotthauer K, Bers DM. Sarcoplasmic reticulum Ca2+ release causes myocyte depolarization: underlying mechanism and threshold for triggered action potentials. Circ Res. (2000) 87:774–80. doi: 10.1161/01.RES.87.9.774
7. Wasserstrom JA, Shiferaw Y, Chen W, Ramakrishna S, Patel H, Kelly JE, et al. Variability in timing of spontaneous calcium release in the intact rat heart is determined by the time course of sarcoplasmic reticulum calcium load. Circ Res. (2010) 107:1117–26. doi: 10.1161/CIRCRESAHA.110.229294
8. Priori SG, Napolitano C, Tiso N, Memmi M, Vignati G, Bloise R, et al. Mutations in the cardiac ryanodine receptor gene (hRyR2) underlie catecholaminergic polymorphic ventricular tachycardia. Circulation (2001) 103:196–200. doi: 10.1161/01.CIR.103.2.196
9. Hoeker GS, Katra RP, Wilson LD, Plummer BN, Laurita KR. Spontaneous calcium release in tissue from the failing canine heart. Am J Physiol Heart Circ Physiol. (2009) 297:H1235–42. doi: 10.1152/ajpheart.01320.2008
10. Boyden PA, Barbhaiya C, Lee T, ter Keurs HEDJ. Nonuniform Ca2+ transients in arrhythmogenic Purkinje cells that survive in the infarcted canine heart. Cardiovasc Res. (2003) 57:681–93. doi: 10.1016/S0008-6363(02)00725-3
11. Hirose M, Stuyvers BD, Dun W, ter Keurs HE, Boyden PA. Function of Ca2+ release channels in Purkinje cells that survive in the infarcted canine heart: a mechanism for triggered Purkinje ectopy. Circ Arrhythm Electrophysiol. (2008) 1:387–95. doi: 10.1161/CIRCEP.107.758110
12. Fozzard HA, Schoenberg M. Strength-duration curves in cardiac Purkinje fibres: effects of liminal length and charge distribution. J Physiol. (1972) 226:593–618. doi: 10.1113/jphysiol.1972.sp009999
13. Xie Y, Sato D, Garfinkel A, Qu Z, Weiss JN. So little source, so much sink: requirements for afterdepolarizations to propagate in tissue. Biophys J. (2010) 99:1408–15. doi: 10.1016/j.bpj.2010.06.042
14. Cabo C, Yao J, Boyden PA, Chen S, Hussain W, Duffy HS, et al. Heterogeneous gap junction remodeling in reentrant circuits in the epicardial border zone of the healing canine infarct. Cardiovasc Res. (2006) 72:241–9. doi: 10.1016/j.cardiores.2006.07.005
15. Nguyen TP, Qu Z, Weiss JN. Cardiac fibrosis and arrhythmogenesis: the road to repair is paved with perils. J Mol Cell Cardiol. (2014) 70:83–91. doi: 10.1016/j.yjmcc.2013.10.018
16. Campos FO, Shiferaw Y, Prassl AJ, Boyle PM, Vigmond EJ, Plank G. Stochastic spontaneous calcium release events trigger premature ventricular complexes by overcoming electrotonic load. Cardiovasc Res. (2015) 107:175–83. doi: 10.1093/cvr/cvv149
17. Campos FO, Shiferaw Y, Vigmond EJ, Plank G. Stochastic spontaneous calcium release events and sodium channelopathies promote ventricular arrhythmias. Chaos (2017) 27:093910. doi: 10.1063/1.4999612
18. Vigmond EJ, Stuyvers BD. Modeling our understanding of the His-Purkinje system. Prog Biophys Mol Biol. (2016) 120:179–88. doi: 10.1016/j.pbiomolbio.2015.12.013
19. Rutherford SL, Trew ML, Sands GB, LeGrice IJ, Smaill BH. High-resolution 3-dimensional reconstruction of the infarct border zone: impact of structural remodeling on electrical activation. Circ Res. (2012) 111:301–11. doi: 10.1161/CIRCRESAHA.111.260943
20. Sosnovik DE, Wang R, Dai G, Wang T, Aikawa E, Novikov M, et al. Diffusion spectrum MRI tractography reveals the presence of a complex network of residual myofibers in infarcted myocardium. Circ Cardiovasc Imaging (2009) 2:206–12. doi: 10.1161/CIRCIMAGING.108.815050
21. Myles RC, Wang L, Kang C, Bers DM, Ripplinger CM. Local beta-adrenergic stimulation overcomes source-sink mismatch to generate focal arrhythmia. Circ Res. (2012) 110:1454–64. doi: 10.1161/CIRCRESAHA.111.262345
22. Chen W, Aistrup G, Wasserstrom JA, Shiferaw Y. A mathematical model of spontaneous calcium release in cardiac myocyte. Am J Physiol Heart Circ Physiol. (2011) 300:H1794–805. doi: 10.1152/ajpheart.01121.2010
23. Mahajan A, Shiferaw Y, Sato D, Baher A, Olcese R, Xie LH, et al. A rabbit ventricular action potential model replicating cardiac dynamics at rapid heart rates. Biophys J. (2008) 94:392–410. doi: 10.1529/biophysj.106.98160
24. Connolly AJ, Bishop MJ. Computational representations of myocardial infarct scars and implications for Arrhythmogenesis. Clin Med Insights Cardiol. (2016) 10(Suppl. 1):27–40. doi: 10.4137/CMC.S39708
25. Mountantonakis SE, Park RE, Frankel DS, Hutchinson MD, Dixit S, Cooper J, et al. Relationship between voltage map “channels” and the location of critical isthmus sites in patients with post-infarction cardiomyopathy and ventricular tachycardia. J Am Coll Cardiol. (2013) 61:2088–95. doi: 10.1016/j.jacc.2013.02.031
26. de Chillou C, Groben L, Magnin-Poull I,ronache M, MagdiAbbas M, Zhang N, et al. Localizing the critical isthmus of postinfarct ventricular tachycardia: the value of pace-mapping during sinus rhythm. Heart Rhythm. (2014) 11:175–81. doi: 10.1016/j.hrthm.2013.10.042
27. Costa CM, Campos FO, Prassl AJ, dos Santos RW, Sánchez-Quintana D, Hofer HAE, et al. An efficient finite element approach for modeling fibrotic clefts in the heart. IEEE Trans Biomed Eng. (2014) 61:900–10. doi: 10.1109/TBME.2013.2292320
28. Clerc L. Directional differences of impulse spread in trabecular muscle from mammalian heart. J Physiol. (1976) 255:335–46. doi: 10.1113/jphysiol.1976.sp011283
29. Vetter FJ, McCulloch AD. Three-dimensional analysis of regional cardiac function: a model of rabbit ventricular anatomy. Prog Biophys Mol Biol. (1998) 69:157–83. doi: 10.1016/S0079-6107(98)00006-6
30. Hill YR, Child N, Hanson B, Wallman M, Coronel R, Plank G, et al. Investigating a novel activation-repolarisation time metric to predict localised vulnerability to reentry using computational modelling. PLoS ONE (2016) 11:e0149342. doi: 10.1371/journal.pone.0149342
31. de Barros BG, dos Santos RW, Lobosco M, Alonso S. Simulation of ectopic pacemakers in the heart: multiple ectopic beats generated by reentry inside Fibrotic Regions. Biomed Res Int. (2015) 2015:713058. doi: 10.1155/2015/713058
32. Alonso S, dos Santos RW, Bär M. Reentry and ectopic pacemakers emerge in a three-dimensional model for a slab of cardiac tissue with diffuse microfibrosis near the percolation threshold. PLoS ONE (2016) 11:e0166972. doi: 10.1371/journal.pone.0166972
33. Vigmond E, Pashaei A, Amraoui S, Cochet H, Hassaguerre M. Percolation as a mechanism to explain atrial fractionated electrograms and reentry in a fibrosis model based on imaging data. Heart Rhythm. (2016) 13:1536–43. doi: 10.1016/j.hrthm.2016.03.019
34. Bishop MJ, Plank G. Representing cardiac bidomain bath-loading effects by an augmented monodomain approach: application to complex ventricular models. IEEE Trans Biomed Eng. (2011) 58:1066–75. doi: 10.1109/TBME.2010.2096425
35. Vigmond E, Hughes M, Plank G, Leon L. Computational tools for modeling electrical activity in cardiac tissue. J Electrocardiol. (2003) 36:69–74. doi: 10.1016/j.jelectrocard.2003.09.017
36. Boyle PM, Vigmond EJ. An intuitive safety factor for cardiac propagation. Biophys J. (2010) 98:L57–9. doi: 10.1016/j.bpj.2010.03.018
37. Connolly A, Trew ML, Smaill BH, Plank G, Bishop MJ. Local gradients in electrotonic loading modulate the local effective refractory period: implications for Arrhythmogenesis in the infarct border Zone. IEEE Trans Biomed Eng. (2015) 62:2251–9. doi: 10.1109/TBME.2015.2421296
38. Richardson WJ, Clarke SA, Quinn TA, Holmes JW. Physiological implications of myocardial scar structure. Compr Physiol. (2015) 5:1877–909. doi: 10.1002/cphy.c140067
39. Campos FO, Prassl AJ, Seemann G, dos Santos RW, Plank G, Hofer E. Influence of ischemic core muscle fibers on surface depolarization potentials in superfused cardiac tissue preparations: a simulation study. Med Biol Eng Comput. (2012) 50:461–72. doi: 10.1007/s11517-012-0880-1
40. Liu MB, de Lange E, Garfinkel A, Weiss JN, Qu Z. Delayed afterdepolarizations generate both triggers and a vulnerable substrate promoting reentry in cardiac tissue. Heart Rhythm. (2015) 12:2115–24. doi: 10.1016/j.hrthm.2015.06.019
41. de Jong S, van Veen TA, van Rijen HV, de Bakker JM. Fibrosis and cardiac arrhythmias. J Cardiovasc Pharmacol. (2011) 57:630–8. doi: 10.1097/FJC.0b013e318207a35f
42. de Bakker JM, van Capelle FJ, Janse MJ, Tasseron S, Vermeulen JT, de Jonge N, et al. Slow conduction in the infarcted human heart. “Zigzag” course of activation. Circulation (1993) 88:915–26.
43. Smeets JL, Allessie MA, Lammers WJ, Bonke FI, Hollen J. The wavelength of the cardiac impulse and reentrant arrhythmias in isolated rabbit atrium. The role of heart rate, autonomic transmitters, temperature, and potassium. Circ Res. (1986) 58:96–108.
44. Campos FO, Wiener T, Prassl AJ, dos Santos RW, Sánchez-Quintana D, Ahammer H, et al. Electroanatomical characterization of atrial microfibrosis in a histologically detailed computer model. IEEE Trans Biomed Eng. (2013) 60:2339–49. doi: 10.1109/TBME.2013.2256359
45. Lau DH, Zeemering S, Maesen B, Kuklik P, Verheule S, Schotten U. Catheter ablation targeting complex fractionated atrial electrogram in atrial fibrillation. J Atr Fibrill. (2013) 6:907. doi: 10.4022/jafib.907
46. Ongstad EL, Gourdie RG. Can heart function lost to disease be regenerated by therapeutic targeting of cardiac scar tissue? Semin Cell Dev Biol. (2016) 58:41–54. doi: 10.1016/j.semcdb.2016.05.020
47. Bezzina C, Veldkamp MW, van Den Berg MP, Postma AV, Rook MB, Viersma JW, et al. A single Na(+) channel mutation causing both long-QT and Brugada syndromes. Circ Res. (1999) 85:1206–13. doi: 10.1161/01.RES.85.12.1206
48. Boyle PM, Park CJ, Arevalo HJ, Vigmond EJ, Trayanova NA. Sodium current reduction unmasks a structure-dependent substrate for arrhythmogenesis in the normal ventricles. PLoS ONE (2014) 9:e86947. doi: 10.1371/journal.pone.0086947
49. Chen PS, Chen LS, Cao JM, Sharifi B, Karagueuzian HS, Fishbein MC. Sympathetic nerve sprouting, electrical remodeling and the mechanisms of sudden cardiac death. Cardiovasc Res. (2001) 50:409–16. doi: 10.1016/S0008-6363(00)00308-4
50. Hund TJ, Decker KF, Kanter E, Mohler PJ, Boyden PA, Schuessler RB, et al. Role of activated CaMKII in abnormal calcium homeostasis and INa remodeling after myocardial infarction: insights from mathematical modeling. J Mol Cell Cardiol. (2008) 45:420–8. doi: 10.1016/j.yjmcc.2008.06.007
Keywords: myocardial infarction, isthmus, fibrosis, arrhythmia, triggered activity, calcium, computer simulation
Citation: Campos FO, Shiferaw Y, Weber dos Santos R, Plank G and Bishop MJ (2018) Microscopic Isthmuses and Fibrosis Within the Border Zone of Infarcted Hearts Promote Calcium-Mediated Ectopy and Conduction Block. Front. Phys. 6:57. doi: 10.3389/fphy.2018.00057
Received: 15 December 2017; Accepted: 18 May 2018;
Published: 07 June 2018.
Edited by:
Ewald Moser, Medizinische Universität Wien, AustriaReviewed by:
Fei Geng, McMaster University, CanadaWinfried Mayr, Medizinische Universität Wien, Austria
Copyright © 2018 Campos, Shiferaw, Weber dos Santos, Plank and Bishop. This is an open-access article distributed under the terms of the Creative Commons Attribution License (CC BY). The use, distribution or reproduction in other forums is permitted, provided the original author(s) and the copyright owner are credited and that the original publication in this journal is cited, in accordance with accepted academic practice. No use, distribution or reproduction is permitted which does not comply with these terms.
*Correspondence: Gernot Plank, gernot.plank@medunigraz.at