 Morteza Esmaeili1*†
 Nassim Tayari2Tom Scheenen2
 Mattijs Elschot1Elise Sandsmark1Helena Bertilsson3,4
 Arend Heerschap2
 Kirsten M. Selnæs1,5‡
 Tone F. Bathen1‡
- 1Deparment of Circulation and Medical Imaging, Faculty of Medicine and Health Sciences, Norwegian University of Science and Technology, Trondheim, Norway
- 2Department of Radiology and Nuclear Medicine, Radboud University Medical Center, Nijmegen, Netherlands
- 3Department of Surgery, St. Olavs Hospital, Trondheim University Hospital, Trondheim, Norway
- 4Department of Clinical and Molecular Medicine, Faculty of Medicine and Health Sciences, Norwegian University of Science and Technology, Trondheim, Norway
- 5Department of Radiology and Nuclear Medicine, St. Olavs Hospital, Trondheim University Hospital, Trondheim, Norway
Purpose: To investigate the associations of metabolite levels derived from magnetic resonance spectroscopic imaging (MRSI) and 18F-fluciclovine positron emission tomography (PET) with prostate tissue characteristics.
Methods: In a cohort of 19 high-risk prostate cancer patients that underwent simultaneous PET/MRI, we evaluated the diagnostic performance of MRSI and PET for discrimination of aggressive cancer lesions from healthy tissue and benign lesions. Data analysis comprised calculations of correlations of mean standardized uptake values (SUVmean), maximum SUV (SUVmax), and the MRSI-derived ratio of (total choline + spermine + creatine) to citrate (CSC/C). Whole-mount histopathology was used as gold standard.
Results: The results showed a moderate significant correlation between both SUVmean and SUVmax with CSC/C ratio.
Conclusions: We demonstrated that the simultaneous acquisition of 18F-fluciclovine PET and MRSI with an integrated PET/MRI system is feasible and a combination of these imaging modalities has potential to improve the diagnostic sensitivity and specificity of prostate cancer lesions.
Introduction
Prostate cancer is one of the most commonly diagnosed cancers and among the leading causes of cancer-related deaths in men worldwide (1). The disease can be relatively indolent due to its slow growth, and there is a great need for reliable methods to identify cases of aggressive disease. Multi-parametric magnetic resonance imaging (mpMRI) has emerged as an important tool in the detection, localization, and characterization of prostate cancer (2–4). Guidelines recommend to include morphologic T2-weighted and functional imaging (such as diffusion-weighted MRI and dynamic contrast-enhanced MRI) in diagnostic mpMRI protocols for prostate cancer (5). In addition, MR offers possibilities to obtain information on tissue content of certain metabolites through proton magnetic resonance spectroscopic imaging (MRSI). This functional imaging technique can non-invasively detect and quantify metabolites in the prostate, such as choline-containing molecules (tCho), spermine, creatine, and citrate. Increased tCho and decreased citrate and spermine levels are associated with prostate cancer (6). Previous studies have demonstrated a significant correlation between prostate cancer aggressiveness, represented by the histopathological Gleason score (7), and decreased levels of citrate (a Krebs cycle and fatty acid synthesis intermediate, accumulating in luminal space) and spermine accompanied by an increased level of tCho which is involved in phospholipid metabolism (8–11). The metabolite ratio (tCho + spermine + creatine)/citrate is often used as an in vivo biomarker for prostate cancer (6, 8–10, 12). Interestingly, a recent in vivo MRSI study demonstrated that the number of voxels with undetectable levels of polyamines was associated with recurrence (13), which is in accordance with ex vivo measurements showing that low levels of spermine and citrate in prostate cancer tissue are associated with recurrence (14).
Functional information of prostate cancer can also be obtained by positron emission tomography (PET) with several tracers (15). High-resolution anatomical imaging provided by MRI combined with landmarks elucidated by PET can improve localization of prostate cancer lesions (16–18). The combination of PET imaging with the amino acid analog anti-1-amino-3-18F-perfluorocyclobutane-1-carboxylic acid (18F-fluciclovine) and anatomical MR imaging is promising for detection of prostate cancer lesions (19, 20). Despite significant differences in the 18F-fluciclovine uptake between prostate cancer and normal prostate tissue, there is an overlap of the uptake between cancer tissue and benign lesions, occurring, e.g., in benign prostatic hyperplasia (BPH) (19). Similarly, elevated choline levels detected by either 18F-flurocholine PET, 11C-choline PET, or MRSI can introduce ambiguity in the interpretation of lesion/BPH characteristics (15, 21) With an integrated PET/MR scanner, MRSI and PET images can be acquired simultaneously, which potentially provides complementary information on prostate cancer metabolism. This study aimed to simultaneously measure 18F-fluciclovine and MRSI-visible metabolites in patients with high-risk prostate cancer, examine the correlations between PET and MRSI and to assess their combined diagnostic performance for cancer lesion localization.
Materials and Methods
Patients
We selected 19 out of 28 patients from a previously reported study cohort (19, 20, 22), for whom MRSI data were acquired as part of an extensive PET/MRI protocol. Results from the MRSI data of this cohort have not been previously reported. These 19 patients [median (range) age of 66 (55–72) years] had biopsy-proven high-risk prostate cancer (Gleason score ≥ 8 and/or a prostate-specific antigen (PSA) ≥ 20 ng/mL, and/or clinical T-stage ≥ cT3). All patients were scheduled for robot-assisted radical prostatectomy (RARP) with extended pelvic lymph node dissection (ePLND). In the current study, we investigated the diagnostic power of combined 18F-fluciclovine PET/MRSI for loco-regional detection and localization of primary prostate cancer (ClinicalTrials.gov; identifier NCT02076503). The study was approved by our institution (St. Olavs Hospital, Trondheim University Hospital) and the Regional Committee for Medical and Health Research Ethics, central Norway (identifier 2013/1513). All patients provided written informed consent before participation in this study.
Imaging Protocol
Imaging was performed on an integrated 3.0T PET/MRI system (Magnetom Biograph mMR, Siemens Healthineers, Erlangen, Germany). The PET tracer 18F-fluciclovine was produced by the Norwegian Medical Cyclotron Center in Oslo by methods previously described (23). The PET/MRI protocol consisted of a full clinical mpMRI examination, combined with simultaneous PET imaging. The anatomical MR images were acquired in two-bed positions, covering from the ureteral crossing of the common iliac vessels to the pelvic floor (19). We acquired a total of 45 min of sequential list-mode PET data for analysis of the tracer dynamics in the prostate. In a recent study from the same patient cohort, we concluded that the (late)-window PET imaging protocol can easily be combined with the MR protocols (19). Therefore, we restricted the MRSI-combined PET evaluation to the PET-derived values from that time point. MRSI data was obtained, using spine coil elements and the MR body coil (Magnetom Biograph mMR, Siemens Healthineers, Erlangen, Germany) with a standard PRESS sequence with dual-frequency water and lipid suppression at TR/TE = 750/145 ms (24), FOV = 84 × 84 × 70 cm3, acquisition matrix size of 12 × 12 × 10 interpolated into 16 × 16 × 16, spectral bandwidth of 1,250 Hz, 512 complex points, 6 averages, weighted k-space sampling was used followed by post-acquisition k-space Hamming filtering, measurement time of 9 min 54 s, and outer volume suppression slices positioned around the prostate.
Image Analysis
MRSI Analysis
Spectral data were analyzed using the Java-based software jMRUI v5.2 (http://www.jmrui.eu/), and the spectral peaks were fitted with Lorentzian lines using AMARES (24). This software plots the original signal, the estimated fit, and the residuals (derived from subtracting the estimated spectrum fit from the original spectrum), which can be inspected visually by an expert. We determined the signal-to-noise ratio (SNR) by the peak intensity of the fitted signal integral for tCho, spermine, and creatine as the signal and the standard deviation of spectral region 8–9 ppm (without signal) for the noise. Spectra with a sufficient signal-to-noise ratio (SNR > 2), adequate phasing, and absence of baseline distortions were selected for analysis. The intensities of the overlapping signals of tCho, spermine and creatine correlated negatively with each other (r < −0.4), which is why only the sum of these intensities is reported. Hence, the total spectral intensity of the resonances from tCho, spermine, and creatine between 3.0 and 3.22 ppm was expressed as Choline+Spermine+Creatine (CSC). The citrate peaks were modeled as four single Lorentzian peaks with midpoint and difference in chemical shifts of 2.62 and 0.15 ppm, respectively. Equal line width for all peaks of citrate was determined. This prior knowledge led to the smallest residuals for all metabolite resonances (Figure 1). The metabolite ratio of CSC/Citrate (C) was generated voxel-wise.
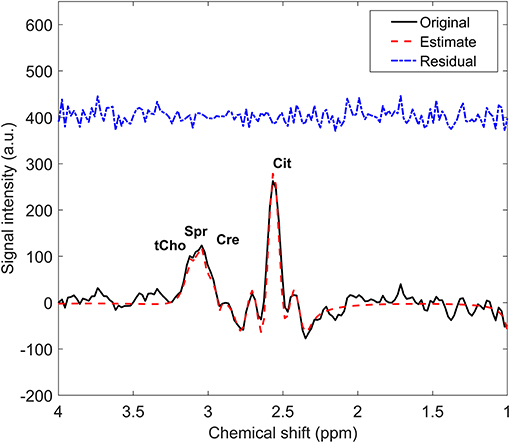
Figure 1. Example of a proton MR spectrum (solid line) of one voxel in healthy prostate tissue with the overlaid spectrum fit (red dash line) and the residuals (blue dash-dot line). tCho, total choline; Spr, spermine; Cre, creatine; Cit, citrate.
PET Analysis
PET images were reconstructed from the list-mode data acquired 33 to 38 min after tracer injection, as previously described (19). Standardized uptake values (SUV) were linearly interpolated to overlay on both the corresponding T2-weighted MR image and the MRSI voxel matrix. PET images were reconstructed on a 344 × 344 matrix with 2.1 × 2.1 mm in plane resolution and 2 mm slice thickness. The nominal MRSI voxels were larger than the nominal PET voxels, as obtained after reconstruction, so that 16 PET voxels fitted into 1 MRSI voxel. The mean and maximum SUV values of these 16 voxels were calculated, giving the SUVmean and SUVmax per MRSI voxel (Figure 2).
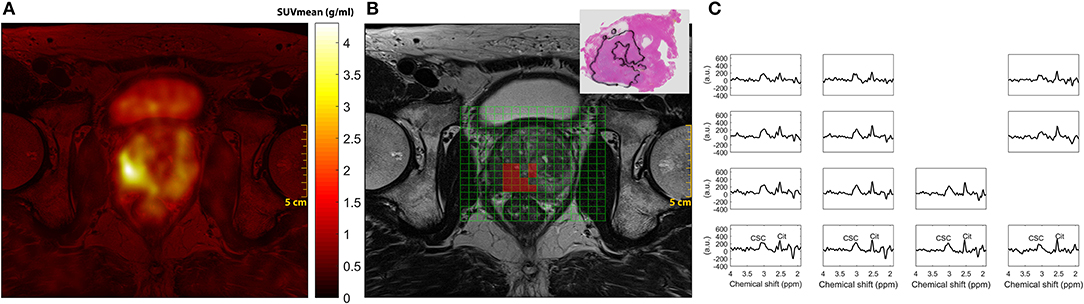
Figure 2. Representative PET, MRI, and MRSI in a 66-year-old patient with prostate specific antigen 3.7 ng/mL, clinical stage T3b and Gleason score 4+5 (Grade group 5). (A) 18F-fluciclovine image shows a focal uptake in the right lobe of the peripheral zone of the prostate; (B) Axial T2-weighted MR image, overlaid MRSI grid box and the matching whole-mount histology slice, demonstrating the lesion distribution in the selected slice. (C) MR spectra from the red color voxels in B- only voxels with sufficient spectral quality for analysis are displayed. PET, positron emission tomography; MRSI, Magnetic resonance spectroscopic imaging; CCS, total choline + creatine + spermine; Cit, citrate.
Surgery and Histopathology
RARP with ePLND was performed according to EAU guidelines (25). The resected prostate gland was serially sectioned from apex to base in 4 mm thick slices perpendicular to the urethra. The most inferior slice (apex) and most superior slice (base) were additionally sectioned in the longitudinal direction for optimal histopathological evaluation of extracapsular extension. All slices were embedded in paraffin before 3.5 μm thick sections were cut for staining with hematoxylin and eosin. A pathologist specialized in uropathology outlined cancer foci and regions of BPH and inflammation and described cancer Gleason grade scoring (7) on whole-mount histopathology slides. We used these slides to identify the underlying tissue content (cancer, BPH, or normal tissue) of the selected spectroscopy voxels by visually matching them with the corresponding slice of T2-weighted MR images.
Statistical Analysis
Statistical analyses were performed using SPSS (IBM SPSS Statistics 24.0). To investigate relationships between the results from PET and MRSI data, we performed a correlation analysis including linear mixed model (LMM) corrections. LMM was used to correct for multiple measures per subject which may introduce multiple intercepts when including data from all individuals. The threshold for statistical significance was defined as p ≤ 0.05. We also performed receiver operating characteristic (ROC) curve analysis to evaluate the performance of metabolite ratio CSC/C, SUVmean, SUVmax, and a combination of all covariates in discrimination between the voxels determined as either tumor or combined BPH and healthy tissue. The combined covariates were generated in SPSS, by estimating a logistic regression model of the variables to predict the probability from that model (26). The predicted probability served as input to ROC analysis. The area under the ROC curve (AUC) was calculated as a measure of performance. The ROC analysis was performed using MedCalc Statistical Software version 17.6 (MedCalc Software bvba, Ostend, Belgium; http://www.medcalc.org; 2017).
Results
The included patients (n = 19) had a median (range) PSA level of 15.4 (3.7–56.9) ng/mL, median (range) biopsy Gleason grade group of 5 (1–5) and their pathological T-stage ranged from cT2b to cT3b (Table 1). In total 196 (23%) spectroscopic voxels (from 859 available voxels) were eligible for analysis with sufficient signal-to-noise (on average 10 voxels per patient). MRSI voxels were categorized as representing either healthy, BPH, or tumor tissue (Table 1) based on histology examinations. The metabolic ratio (CSC/C) derived from MRSI was significantly correlated with both SUVmean (R = 0.42, p < 0.0001) and SUVmax (R = 0.44, p < 0.0001) (Figure 3). The results of ROC analysis showed that neither MRSI nor PET performed better than the other technique alone in distinguishing tumor voxels from other voxels (healthy and BPH). The AUC of the ROC curves for CSC/C, SUVmean, and SUVmax did not differ significantly but were significantly higher than unity (50%) line (Figure 4). Importantly, the combination of all imaging variables provided a higher AUC value than the AUC values derived from the individual ROCs (p < 0.05).
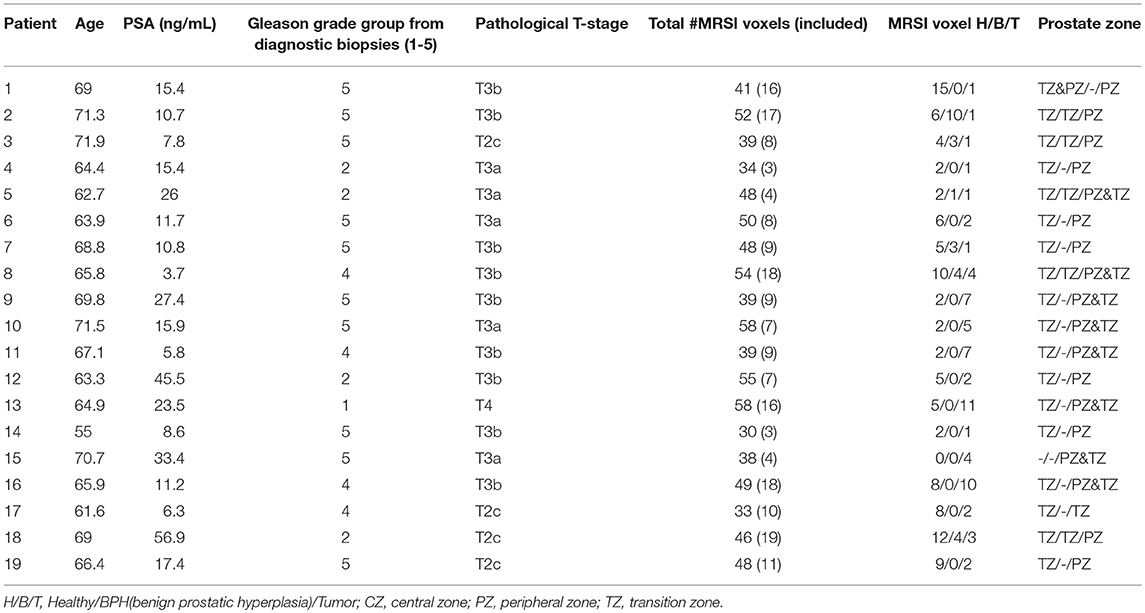
Table 1. Summary of the patients clinical variables and included MRSI voxels.
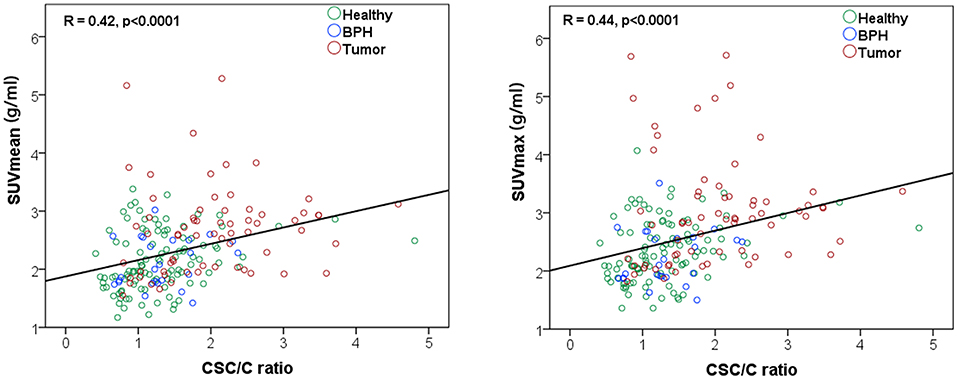
Figure 3. Correlation analysis between the metabolite ratio CSC/C [(total choline + spermine + creatine)/citrate] and SUVmean (left) and SUVmax (right).
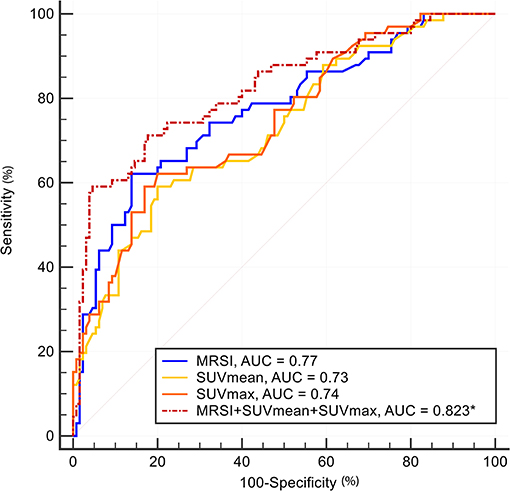
Figure 4. Receiver operating characteristic (ROC) curve analysis was performed as a measure for the performance of the metabolite ratio CSC/C, SUVmean, SUVmax, and a combination of all covariates in discrimination of tumors from the combined BPH and healthy tissues. The area under the ROC curve (AUC) was calculated as a measure of performance. MRSI and SUV parameters provide quite similar AUCs in separating voxels from tumor vs. all the other tissues. All AUCs were statistically significantly different from 50% threshold (p < 0.001). A combination of all imaging parameters (dashed line) provided a statistically significantly higher AUC than all the individual parameters (solid lines, p < 0.05).
Discussion
PET/MRI offers a powerful imaging tool for high-risk prostate patients, providing simultaneous high-resolution MRI and functional PET imaging (2). This pilot study is the first to present an initial evaluation of the diagnostic performance of combined metabolic imaging markers, uptake of PET tracer 18F-fluciclovine and CSC/C ratio, in high-risk prostate cancer. We demonstrate that the simultaneous acquisition of 18F-fluciclovine PET and MRSI with an integrated PET/MRI system in patients with prostate cancer is feasible. The results showed a moderate, yet significant correlation between PET tracer uptake (SUVmean and SUVmax) and the spectroscopic CSC/C ratio. A combination of the imaging outcomes derived from the integrated PET and MRSI modalities substantially improved the discrimination between cancer and non-cancer tissues in the prostate.
Amino acids are considered essential nutrients for growth and maintenance, as well as for cell signaling in tumor cells. F18-fluciclovine is a synthetic analog of leucine, an essential amino acid involved in the biosynthesis of proteins. Leucine promotes protein synthesis via the phosphorylation of the mechanistic target of rapamycin (mTOR), a protein kinase that regulates cell growth (27). Also, leucine plays a key role in cellular energy metabolism by promoting glucose uptake, mitochondrial biogenesis, and fatty acid oxidation (28, 29). The uptake of PET tracer 18F-fluciclovine in prostate cancer can thus be partly explained by the increased cancer cell demands and the cross-talk between protein synthesis and energy metabolism. 18F-fluciclovine biodistribution studies have demonstrated a relatively low renal excretion and bladder activity of this radiotracer, and it is therefore considered a suitable biomarker for prostate PET imaging (30, 31). Several studies have investigated the performance of 18F-fluciclovine PET in prostate cancer, demonstrating that the tracer uptake is significantly higher in prostate tumors than benign tissues (23, 32). In a study of 89 patients with biochemically recurrent prostate cancer, Nanni and colleagues demonstrated a superior diagnostic performance of 18F-fluciclovine to 11C-choline (33). However, the tracer has also showed a non-specific uptake related to BPH (34). This pitfall can hamper the primary tumor localization. Previous results have demonstrated a significant contribution of SUVmax in distinguishing between the tumor and normal prostate, while SUVmean was not significantly different from that of the tumor and BPH (35).
Choline metabolites are key precursors in the biosynthesis of phospholipids in cell membranes. The rapid proliferation of cancer cells induces an increased phospholipid demand, which is considered as an important reason for tCho elevation. Normal and non-cancerous prostate cells produce, and secrete a significant amount of citrate into the luminal space of the gland. It has been demonstrated that the decreased level of citrate is associated with prostate cancer (36, 37). The resonance of citrate is well-resolved from the other metabolite signals, but those of tCho, spermine, and creatine often overlap in 1H MR spectra of the prostate, in particular, if obtained by a common PRESS sequence (38, 39). Therefore, quantification of the individual metabolite signals can be challenging in this resonance region, and in quantitative evaluations the sum of the estimated peak fit integrals for the latter three metabolites is used instead.
In this study, we demonstrate that combined PET/MRSI may be meaningful in certain subgroups of patients such as high-risk prostate cancer patients. The application may facilitate the indication of a more aggressive region in the prostate tumor, determine target for guided biopsy, and localization of the most aggressive region for focal treatment. Challenges in the clinical use of the MRSI technique is the robustness of the acquisition methods and lack of proper software for automatic analysis of the MR spectra. Recently, we have demonstrated that by applying adiabatic pulses in the acquisition its robustness and spectral quality are substantially improved over the common PRESS acquisition method as applied in this study. The improved quality also facilitates a better spectral analysis (39, 40). The ability to acquire PET and MR data simultaneously can strengthen the diagnostic capability and clinical applicability of these imaging technologies. In this study, we used a long scan time due to the extensive research protocols included. In a clinical setting, the tracer can be manually injected before the patient enters the PET/MRI system, with a protocol tailored for a shorter scan time.
This study has some limitations. We did not examine the reproducibility of the imaging techniques, for example by performing MRSI and/or PET twice. The patient cohort consisted of only 19 patients, however, all with high-risk prostate cancer. The high-risk tumors are large and aggressive, thus it remains to evaluate the diagnostic performance of these imaging modalities in a larger patients cohort and lower grade cancers. We only included 23% of the available spectroscopic voxels based on quality criteria. This relatively low number illustrates limitations of the use of the current PRESS MRSI protocol. Spatial localization with conventional PRESS pulses can cause the presence of large residual lipid signals. Moreover, unsupervised automated shimming of the prostate can result in suboptimal linewidths of the signals and suboptimal water and lipid suppression in the spectra, which can be improved by better shimming algorithms or manual re-adjustment after the automated shim. More advanced prostate MRSI sequences (39) improves localization and increases the number of voxels with sufficient spectral quality. Quality control of the spectra, either automated or visual, remains essential. The neighboring voxels in both MRSI and PET data are not fully independent measurements, because of the post-acquisition interpolation. Although the number of MRSI voxels with sufficient SNR was relatively low, the distribution between healthy, BPH, and tumor was adequate enough to explore preliminary associations between MRSI visible metabolites and uptake of the amino acid analog 18F-fluciclovine, based on a simultaneous MRSI and PET examination. The results from ROC analysis show that neither MRSI nor PET performed better than the other technique alone in distinguishing tumor voxels from other voxels (healthy and BPH), but their combination performs significantly better than any modality alone.
Conclusion
Simultaneous acquisition of 18F-fluciclovine PET and MRSI is feasible in patients with prostate cancer, and showed a significant correlation between both SUVmean and SUVmax and the CSC/C ratio. A combination of the imaging outcomes derived from the integrated PET/MRSI modalities can improve the diagnostic accuracy of assessing prostate cancer lesions.
Author Contributions
MoE, MaE, TS, AH, KS, and TB: designed the study. MaE, ES, HB, KS, and TB: acquired the data. MoE, NT, MaE, and KS: performed the data analysis. MoE, KS, and TB: wrote the paper. All authors edited and approved the final version of the manuscript.
Funding
This work has been funded by the Norwegian Cancer Society (100792-2013), the Liaison Committee between the Central Norway Regional Health Authority (RHA) and the Norwegian University of Science and Technology (project number 46056808), and European Union's Seventh Program for research, Technological Development and Demonstration (ITN-GA-2013-316679), and South-Eastern Norway Regional Health Authority (Project number 2018047).
Conflict of Interest Statement
The authors declare that the research was conducted in the absence of any commercial or financial relationships that could be construed as a potential conflict of interest.
References
1. Torre LA, Bray F, Siegel RL, Ferlay J, Lortet-Tieulent J, Jemal A. Global cancer statistics, 2012. CA Cancer J Clin. (2015) 65:87–108. doi: 10.3322/caac.212622
2. Hoeks CM, Barentsz JO, Hambrock T, Yakar D, Somford DM, Heijmink SW, et al. Prostate cancer: multiparametric MR imaging for detection, localization, and staging. Radiology (2011) 261:46–66. doi: 10.1148/radiol.110918223
3. Alberts AR, Schoots IG, Bokhorst LP, van Leenders GJ, Bangma CH, Roobol MJ. Risk-based patient selection for magnetic resonance imaging-targeted prostate biopsy after negative transrectal ultrasound-guided random biopsy avoids unnecessary magnetic resonance imaging scans. Eur Urol. (2016) 69:1129–34. doi: 10.1016/j.eururo.2015.11.0184
4. Scheenen TW, Rosenkrantz AB, Haider MA, Futterer JJ. Multiparametric magnetic resonance imaging in prostate cancer management: current status and future perspectives. Invest Radiol. (2015) 50:594–600. doi: 10.1097/RLI.00000000000001635
5. Weinreb JC, Barentsz JO, Choyke PL, Cornud F, Haider MA, Macura KJ, et al. PI-RADS prostate imaging - reporting and data system: 2015, version 2. Eur Urol. (2016) 69:16–40. doi: 10.1016/j.eururo.2015.08.0526
6. Kurhanewicz J, Vigneron DB. Magnetic resonance spectroscopy of prostate cancer. In: Harris RK, Wasylishen RL, editors. eMagRes. (2016). p. 923–44. doi: 10.1002/9780470034590.emrstm1433
7. Epstein JI. Update on the Gleason grading system. Ann Pathol. (2011) 31(Suppl. 5):S20–6. doi: 10.1016/j.annpat.2011.08.0238
8. Kobus T, Wright AJ, Weiland E, Heerschap A, Scheenen TW. Metabolite ratios in 1H MR spectroscopic imaging of the prostate. Magn Reson Med. (2015) 73:1–12. doi: 10.1002/mrm.251229
9. Kobus T, van der Laak JAWM, Maas MC, Hambrock T, Bruggink CC, Hulsbergen-van de Kaa CA, et al. Contribution of histopathologic tissue composition to quantitative mr spectroscopy and diffusion-weighted imaging of the prostate. Radiology (2016) 278:801–11. doi: 10.1148/radiol.201514288910
10. Tayari N, Heerschap A, Scheenen TWJ, Kobus T. In vivo MR spectroscopic imaging of the prostate, from application to interpretation. Anal Biochem. (2017) 529:158–70. doi: 10.1016/j.ab.2017.02.00111
11. Selnaes KM, Gribbestad IS, Bertilsson H, Wright A, Angelsen A, Heerschap A, et al. Spatially matched in vivo and ex vivo MR metabolic profiles of prostate cancer – investigation of a correlation with Gleason score. NMR Biomed. (2013) 26:600–6. doi: 10.1002/nbm.290112
12. Kobus T, Wright AJ, Scheenen TW, Heerschap A. Mapping of prostate cancer by 1H MRSI. NMR Biomed. (2014) 27:39–52. doi: 10.1002/nbm.297313
13. Zakian KL, Hatfield W, Aras O, Cao K, Yakar D, Goldman DA, et al. Prostate MRSI predicts outcome in radical prostatectomy patients. Magn Reson Imag. (2016) 34:674–81. doi: 10.1016/j.mri.2016.01.00314
14. Braadland PR, Giskeodegard G, Sandsmark E, Bertilsson H, Euceda LR, Hansen AF, et al. Ex vivo metabolic fingerprinting identifies biomarkers predictive of prostate cancer recurrence following radical prostatectomy. Br J Cancer (2017) 117:1656–64. doi: 10.1038/bjc.2017.34615
15. Wallitt KL, Khan SR, Dubash S, Tam HH, Khan S, Barwick TD. Clinical PET imaging in prostate cancer. Radiographics (2017) 37:1512–36. doi: 10.1148/rg.201717003516
16. Freitag MT, Radtke JP, Afshar-Oromieh A, Roethke MC, Hadaschik BA, Gleave M, et al. Local recurrence of prostate cancer after radical prostatectomy is at risk to be missed in Ga-68-PSMA-11-PET of PET/CT and PET/MRI: comparison with mpMRI integrated in simultaneous PET/MRI. Eur J Nucl Med Mol. I (2017) 44:776–87. doi: 10.1007/s00259-016-3594-z17
17. Eiber M, Weirich G, Holzapfel K, Souvatzoglou M, Haller B, Rauscher I, et al. Simultaneous Ga-68-PSMA HBED-CC PET/MRI Improves the Localization of primary prostate cancer. Eur Urol. (2016) 70:829–36. doi: 10.1016/j.eururo.2015.12.05318
18. Afshar-Oromieh A, Haberkorn U, Schlemmer HP, Fenchel M, Eder M, Eisenhut M, et al. Comparison of PET/CT and PET/MRI hybrid systems using a Ga-68-labelled PSMA ligand for the diagnosis of recurrent prostate cancer: initial experience. Eur J Nucl Med Mol Imaging (2014) 41:887–97. doi: 10.1007/s00259–013-2660-z19
19. Elschot M, Selnaes KM, Sandsmark E, Kruger-Stokke B, Storkersen O, Tessem MB, et al. A PET/MRI study towards finding the optimal [18F]Fluciclovine PET protocol for detection and characterisation of primary prostate cancer. Eur J Nucl Med Mol Imaging (2017) 44:695–703. doi: 10.1007/s00259–016-3562–720
20. Elschot M, Selnaes KM, Sandsmark E, Kruger-Stokke B, Storkersen O, Giskeodegard GF, et al. Combined 18F-Fluciclovine PET/MRI shows potential for detection and characterization of high-risk prostate cancer. J Nucl Med. (2017). doi: 10.2967/jnumed.117.19859821
21. Bauman G, Belhocine T, Kovacs M, Ward A, Beheshti M, Rachinsky I. F-18-fluorocholine for prostate cancer imaging: a systematic review of the literature. Prostate Cancer Prostatic Dis. (2012) 15:45–55. doi: 10.1038/pcan.2011.3522
22. Selnaes KM, Kruger-Stokke B, Elschot M, Willoch F, Storkersen O, Sandsmark E, et al. 18F-Fluciclovine PET/MRI for preoperative lymph node staging in high-risk prostate cancer patients. Eur Radiol. (2018) 28:3151–9. doi: 10.1007/s00330-017-5213-123
23. Sorensen J, Owenius R, Lax M, Johansson S. Regional distribution and kinetics of [18F]fluciclovine (anti-[18F]FACBC), a tracer of amino acid transport, in subjects with primary prostate cancer. Eur J Nucl Med Mol Imaging (2013) 40:394–402. doi: 10.1007/s00259-012-2291-924
24. Vanhamme L, van den Boogaart A, Van Huffel S. Improved method for accurate and efficient quantification of MRS data with use of prior knowledge. J Magn Reson (1997) 129:35–4326.
25. Heidenreich A, Bastian PJ, Bellmunt J, Bolla M, Joniau S, van der Kwast T, et al. EAU guidelines on prostate cancer. part 1: screening, diagnosis, and local treatment with curative intent-update 2013. Eur Urol. (2014) 65:124–37. doi: 10.1016/j.eururo.2013.09.04627
26. Spyropoulos E, Kotsiris D, Spyropoulos K, Panagopoulos A, Galanakis I, Mavrikos S. Prostate cancer predictive simulation modelling, assessing the risk technique (PCP-SMART): introduction and initial clinical efficacy evaluation data presentation of a simple novel mathematical simulation modelling method, devised to predict the outcome of prostate biopsy on an individual basis. Clin Genitourin Cancer (2017) 15:129–38 e1. doi: 10.1016/j.clgc.2016.06.01828
27. Duan Y, Li F, Li Y, Tang Y, Kong X, Feng Z, et al. The role of leucine and its metabolites in protein and energy metabolism. Amino Acids (2016) 48:41–51. doi: 10.1007/s00726-015-2067-129
28. Liang C, Curry BJ, Brown PL, Zemel MB. Leucine Modulates Mitochondrial Biogenesis and SIRT1-AMPK Signaling in C2C12 Myotubes. J Nutr Metab. (2014) 2014:239750. doi: 10.1155/2014/23975030
29. Sun X, Zemel MB. Leucine and calcium regulate fat metabolism and energy partitioning in murine adipocytes and muscle cells. Lipids (2007) 42:297–305. doi: 10.1007/s11745-007-3029-531
30. Nye JA, Schuster DM, Yu W, Camp VM, Goodman MM, Votaw JR. Biodistribution and radiation dosimetry of the synthetic nonmetabolized amino acid analogue anti-18F-FACBC in humans. J Nucl Med. (2007) 48:1017–20. doi: 10.2967/jnumed.107.04009732
31. McParland BJ, Wall A, Johansson S, Sorensen J. The clinical safety, biodistribution and internal radiation dosimetry of [(18)F]fluciclovine in healthy adult volunteers. Eur J Nucl Med Mol Imaging (2013) 40:1256–64. doi: 10.1007/s00259-013-2403-133
32. Schuster DM, Votaw JR, Nieh PT, Yu W, Nye JA, Master V, et al. Initial experience with the radiotracer anti-1-amino-3-18F-fluorocyclobutane-1-carboxylic acid with PET/CT in prostate carcinoma. J Nucl Med. (2007) 48:56–6334.
33. Nanni C, Zanoni L, Pultrone C, Schiavina R, Brunocilla E, Lodi F, et al. (18)F-FACBC (anti1-amino-3-(18)F-fluorocyclobutane-1-carboxylic acid) versus (11)C-choline PET/CT in prostate cancer relapse: results of a prospective trial. Eur J Nucl Med Mol Imaging (2016) 43:1601–10. doi: 10.1007/s00259-016-3329-135
34. Schuster DM, Nanni C, Fanti S, Oka S, Okudaira H, Inoue Y, et al. Anti-1-amino-3-18F-fluorocyclobutane-1-carboxylic acid: physiologic uptake patterns, incidental findings, and variants that may simulate disease. J Nucl Med. (2014) 55:1986–92. doi: 10.2967/jnumed.114.14362836
35. Turkbey B, Mena E, Shih J, Pinto PA, Merino MJ, Lindenberg ML, et al. Localized prostate cancer detection with 18F FACBC PET/CT: comparison with MR imaging and histopathologic analysis. Radiology (2014) 270:849–56. doi: 10.1148/radiol.1313024037
36. Shukla-Dave A, Hricak H, Moskowitz C, Ishill N, Akin O, Kuroiwa K, et al. Detection of prostate cancer with MR spectroscopic imaging: an expanded paradigm incorporating polyamines. Radiology (2007) 245:499–506. doi: 10.1148/radiol.245206220138
37. Kline EE, Treat EG, Averna TA, Davis MS, Smith AY, Sillerud LO. Citrate concentrations in human seminal fluid and expressed prostatic fluid determined via 1H nuclear magnetic resonance spectroscopy outperform prostate specific antigen in prostate cancer detection. J Urol. (2006) 176:2274–9. doi: 10.1016/j.juro.2006.07.05439
38. Scheenen TW, Gambarota G, Weiland E, Klomp DW, Futterer JJ, Barentsz JO, et al. Optimal timing for in vivo 1H-MR spectroscopic imaging of the human prostate at 3T. Magn Reson Med. (2005) 53:1268–74. doi: 10.1002/mrm.2046825
39. Steinseifer IK, van Asten JJ, Weiland E, Scheenen TW, Maas MC, Heerschap A. Improved volume selective (1) H MR spectroscopic imaging of the prostate with gradient offset independent adiabaticity pulses at 3 Tesla. Magn Reson Med. (2015) 74:915–24. doi: 10.1002/mrm.2547640
Keywords: positron emission tomography, magnetic resonance spectroscopy, benign prostatic hyperplasia, chemical shift imaging, citrate, prostate cancer
Citation: Esmaeili M, Tayari N, Scheenen T, Elschot M, Sandsmark E, Bertilsson H, Heerschap A, Selnæs KM and Bathen TF (2018) Simultaneous 18F-fluciclovine Positron Emission Tomography and Magnetic Resonance Spectroscopic Imaging of Prostate Cancer. Front. Oncol. 8:516. doi: 10.3389/fonc.2018.00516
Received: 19 July 2018; Accepted: 22 October 2018;
Published: 15 November 2018.
Edited by:
Marie-France Penet, Johns Hopkins University School of Medicine, United StatesReviewed by:
Naranamangalam Raghunathan Jagannathan, All India Institute of Medical Sciences, IndiaEllen Ackerstaff, Memorial Sloan Kettering Cancer Center, United States
Copyright © 2018 Esmaeili, Tayari, Scheenen, Elschot, Sandsmark, Bertilsson, Heerschap, Selnæs and Bathen. This is an open-access article distributed under the terms of the Creative Commons Attribution License (CC BY). The use, distribution or reproduction in other forums is permitted, provided the original author(s) and the copyright owner(s) are credited and that the original publication in this journal is cited, in accordance with accepted academic practice. No use, distribution or reproduction is permitted which does not comply with these terms.
*Correspondence: Morteza Esmaeili, tone.f.bathen@ntnu.no
†Present Address: Morteza Esmaeili, Department of Radiology, Akershus University Hospital, Oslo, Norway
‡These authors have contributed equally to this work