Psychophysical properties of odor processing can be quantitatively described by relative action potential latency patterns in mitral and tufted cells
- 1Department of Neuroscience, Physiology and Pharmacology, University College London, UK
- 2Division of Neurophysiology, MRC National Institute for Medical Research, London, UK
- 3Behavioural Neurophysiology, Max-Planck-Institute for Medical Research, Heidelberg, Germany
- 4Department of Anatomy and Cell Biology, University Heidelberg, Heidelberg, Germany
Electrophysiological and population imaging data in rodents show that olfactory bulb (OB) activity is profoundly modulated by the odor sampling process while behavioral experiments indicate that odor discrimination can occur within a single sniff. This paper addresses the question of whether action potential (AP) latencies occurring across the mitral and tufted cell (M/TC) population within an individual sampling cycle could account for the psychophysical properties of odor processing. To determine this we created an OB model (50,000 M/TCs) exhibiting hallmarks of published in vivo properties and used a template-matching algorithm to assess stimulus separation. Such an AP latency-based scheme showed high reproducibility and sensitivity such that odor stimuli could be reliably separated independent of concentration. As in behavioral experiments we found that very dissimilar odors (“A vs. B”) were accurately and rapidly discerned while very similar odors (binary mixtures, 0.4A/0.6B vs. 0.6A/0.4B) required up to 90 ms longer. As in lesion studies we find that AP latency-based representation is rather insensitive to disruption of large regions of the OB. The AP latency-based scheme described here, therefore, captures both temporal and psychophysical properties of olfactory processing and suggests that the onset patterns of M/TC activity in the OB represent stimulus specific features of olfactory stimuli.
Introduction
In rodents the sense of smell is of critical importance. This combined with its somewhat simple functional architecture has made the olfactory system an ideal model system to examine the neural basis of sensory processing in mammals. Nevertheless, the detailed mechanisms of olfactory processing and the neural processes underlying it remain largely unknown. Behavioral approaches offer an excellent means of constraining models of olfactory processing (Linster and Cleland, 2004; Cleland and Linster, 2005). Studies in rodents using go/no go odor detection and discrimination tasks for example indicate that lesions that encompass large parts of the olfactory bulb (OB) do not produce a dramatic phenotype at least for simple tasks (Lu and Slotnick, 1998). Furthermore, generally in rodents odor discrimination is very rapid, occurring in less than 200–250 ms within a single sniffing bout (Uchida and Mainen, 2003; Abraham et al., 2004; Rinberg et al., 2006). There also exists a speed-accuracy trade-off such that discrimination between highly similar odorants requires additional time, in the range of 70–100 ms (Abraham et al., 2004; Rinberg et al., 2006). These overall discrimination times include both the sensory transduction, which might require several tens or even hundred milliseconds (Duchamp-Viret et al., 1999; Carey et al., 2009), and the motor and cognitive components of the discrimination task. It is thus likely that the processing time in the OB is actually substantially less than the time window defined by the behavioral discrimination task.
Voltage-sensitive dye and calcium imaging experiments indicate that odors activate not only a specific spatial pattern of glomerulus activity but that activation is strongly modulated by the sniff-cycle. Inputs to the OB are strongly shaped by the respiration cycle in anesthetized as well as awake animals (Spors et al., 2006; Verhagen et al., 2007; Wesson et al., 2008; Carey et al., 2009). Moreover, the sequence of glomerular activation is also odor specific and virtually concentration invariant (Spors and Grinvald, 2002; Spors et al., 2006). Many studies using extracellular recordings in anesthetized and awake animals found a strong coupling of bulb activity to the respiration cycle even as frequencies as high as 10 Hz (Adrian, 1950; Macrides and Chorover, 1972; Buonviso, 2006; Cury and Uchida, 2010; Carey and Wachowiak, 2011). Intracellular in vivo recordings have shown that individual mitral/tufted cells (M/TCs) display a prominent sub-threshold membrane potential oscillation synchronous with the sniff cycle (Charpak et al., 2001; Cang and Isaacson, 2003; Margrie and Schaefer, 2003). M/TC suprathreshold activity is thus structured across a single sampling cycle such that those cells firing more action potentials (APs) begin to fire consistently earlier than those discharging fewer APs (Margrie and Schaefer, 2003).
Many features of the psychophysics of odor discrimination and detection are exquisitely captured in simple models relying on a static pattern of all-or-none glomeruli (Koulakov et al., 2007). Since rhythmic odor sampling is phylogenetically highly conserved and defines activity early in the olfactory pathway it seems desirable that working models of olfactory processing should incorporate this active and dynamic process (Künsting and Spors, 2009). To examine whether the temporal structure of OB activity across a sampling cycle might contain information that could account for the known psychophysical properties of olfactory processing we built a large-scale model of the OB. We have constrained the discharge patterns of M/TCs, based on in vivo measurements of AP latencies, inter-spike intervals (ISIs) and AP distributions within a sniff cycle. Furthermore, we ensure that odor concentration dependence and the distribution of activity follow that measured for individual neurons and the OB network. As this scheme quantitatively reproduced both similarity-dependent discrimination times and robustness against lesioning, we suggest that in the OB, odor processing relies on the patterns of AP onset across the network of M/TCs.
Materials and Methods
Our explicit model for the OB was built with a focus on accurate reproduction of in vivo single M/TC discharge patterns with particular attention to the onset of AP activity. Since these data reflect contributions of both sensory and local OB activity we did not include any additional explicit sources of inhibition (see also Discussion). To facilitate quantitative comparison with behavioral data, we built an OB network of realistic size with 2400 glomeruli with 25 M/TCs each. Varying the number of M/TCs per glomerulus did not significantly alter the results (data not shown). To maintain computational feasibility it was thus necessary to keep the single-cell model simple and efficient. We proceeded in three steps: Firstly, based on whole-cell recordings in vivo we adjusted parameters of a leaky integrate-and-fire (InF) neuron to match the measured onset latencies, ISIs and other single-cell parameters. Secondly, using the measured distribution of AP firing for odor-evoked activity we determined the distribution of input currents corresponding to an odor stimulus. These currents were then related to binding affinities using simple sigmoid relations. Thirdly, we tested our model by comparing its concentration dependence with published electrophysiological and imaging measurements. All simulations were performed using Matlab 6.5 (The MathWorks, Natick, MA, USA) with InF neuron models in the csim_lifnet simulation environment (T. Natschläger, available at http://www.igi.tugraz.at/tnatschl/csim_lifnet/).
Constraining Single-Cell Parameters
M/TCs were modeled as Inf neurons to allow for networks of realistic size of spiking neurons. Gaussian noise was added resulting in a membrane potential variance of 0.20 ± 0.04 mV (mean ± SD, n = 10, Schaefer et al., 2006). Background synaptic input consisted of 100 Hz Poisson inputs with excitatory postsynaptic potential (EPSP) amplitude of 0.58 mV and a decay time constant of 10 ms. A 4 Hz oscillation with a peak-to-peak amplitude of 10 mV was mimicked by sinusoidal current injection (Schaefer et al., 2006). Varying oscillation frequency between 2 and 10 Hz did not significantly alter the findings (data not shown). AP discharge in M/TCs was measured for constant current injection between 0 and 0.18 nA resulting in 1.6 ± 3.3 APs (range 0–15) per cycle [second cycle, see (Lengyel and Erdi, 2004); n = 10,000] and the four parameters (membrane time constant, AP threshold, AP reset voltage, and refractory period) adjusted to fit ISI (Figures 1A,B) latency (Figures 1A,C) and the distributions of APs within an oscillation cycle (Figure 1A) as observed in vivo (Margrie and Schaefer, 2003). This resulted in an AP threshold of 15 mV, a refractory time constant of 4 ms, a membrane time constant of 30 ms, and a reset voltage of 10 mV.
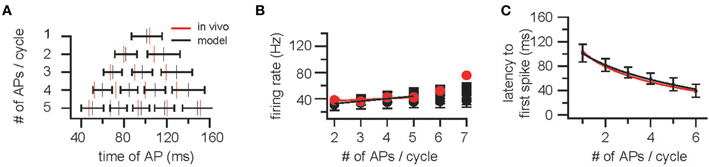
Figure 1. Construction and validation of an OB model based on parameters determined in vivo – cellular constraints. (A) Top: Example trace of the membrane potential of a mitral/tufted cell (M/TC) showing respiration synchronized sub-threshold oscillations in an awake mouse. Scale bar is 200 ms and 20 mV. The beginning of each respiration cycle is indicated by open circles. Below: A plot of action potential distribution in M/TCs for sniff cycles that evoke between 1 and 5 APs. (B) Instantaneous firing rate [inverse of the inter-spike interval (ISI)] and the latency to action potential (AP) onset (C) plotted against the number of APs evoked per sniff cycle. Red markers and lines indicate data obtained from M/TC whole-cell recordings in vivo [Margrie and Schaefer (2003)]. Black indicates the cellular responses for the integrate-and-fire (InF) neurons used.
Constraining Stimulus Parameters
In order to constrain odor stimulus parameters, the AP distribution in response to odors was analyzed. A distribution of input currents was determined that reproduced the measured cumulative AP discharge probability observed in vivo in cells that responded to an odor (Figure 2A, Margrie and Schaefer, 2003) resulting in a distribution of input currents of [(i × 0.53 + 0.3)4.9 + 0.3] × 0.18 nA with i distributed equally between 0 and 1. In Figure 2A, mean and SDs are plotted for 10 repetitions with different random seeds and 1000 cells each. As a first control, the resulting AP distribution was compared to the measured AP distribution (Figure 2B).
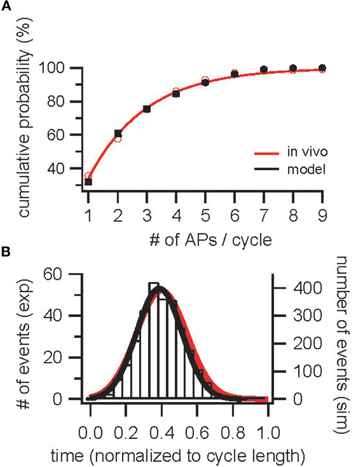
Figure 2. Construction and validation of an OB model based on parameters determined in vivo—population constraints. (A) Cumulative probability for the occurrence of 1–9 APs per sniff cycle during odor-evoked AP discharge in InF neurons (black) and in vivo [red; Margrie and Schaefer (2003)]. (B) Distribution of APs across a sniff cycle in simulation (black) and in vivo [red, Margrie and Schaefer (2003)].
To assess the correspondence of odor affinities and concentrations to the distribution of activity in ORNs, a simple sigmoid relation with glomerulus-independent parameters was assumed (Meister and Bonhoeffer, 2001): R = Rmax [C/(C+ki)] + b. “b” is the response threshold (current needed for 0.2 APs; b = 0.035 nA); Rmax + b equals the maximal current [current required to evoke 12 APs (Margrie and Schaefer, 2003); here 0.169 nA]. From this, we determined the binding coefficients, ki, resulting in the AP distribution of Figure 2.
Concentration-Dependence of Responses
As a next control, odors were presented at two concentrations (0.3 and 3 relative to Figure 2) and number of APs, ISI, and latency to the first spike were measured (Figure 3). Cang and Isaacson (2003) reported a two-fold increase in the number of APs per cycle (from 2.1 to 4), a 60 ms decrease in mean onset latency and a non-significant decrease in ISI. In the model, the number of APs increased from 1.51 ± 0.80 to 6.16 ± 2.21 APs; the latency to onset decreased from 95.4 ± 20.1 to 41.5 ± 19.9 ms (313/500 cells spiked at both concentrations), whereas the ISI did not change substantially (34.8 ± 11.0 vs. 20.2 ± 2.2 ms, 111/500 cells spiked with more than 1 AP at both concentrations; simulations were repeated 10 times with different random seeds). This is in excellent agreement with whole-cell recordings in vivo (Cang and Isaacson, 2003).
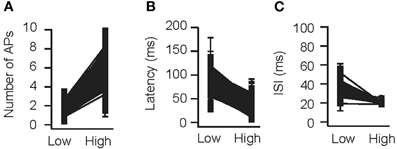
Figure 3. Concentration dependence in the model. Validation of the OB model for variable odor concentrations. An odor was presented to the OB model at concentrations of 0.3 (“low”) and 3 (“high”) times relative to the concentration used in B (see methods). The number of APs per cycle (A), latency to the first AP (B), and average ISI (C) were determined.
To obtain qualitative insight into population activity in the model, we created images of activity, corresponding to 200 glomeruli (the number of glomeruli that could be visualized using intrinsic imaging of the dorsal surface; Meister and Bonhoeffer, 2001). The largest number of glomeruli activated by an individual odor as measured by Ca2+ imaging of presynaptic activity was 60 out of the approximately 150 glomeruli visible in this study (Wachowiak and Cohen, 2001). Thus, an odor consisted of an activity pattern mapped onto 40% of the glomeruli, with the above described distribution of input currents. To qualitatively compare the model to imaging results at different concentrations, we varied concentrations over four orders of magnitude and converted the resulting M/TC activity (number of APs/cycle) in gray scale levels and mapped them on a scheme of an OB (Figure 4). Two hundred glomeruli were randomly distributed as dots in an ellipse with 50 and 30 pixels radius and Gaussian noise (σ = 0.1) was added to every data point. The resulting image was filtered by a 7 × 7 Gaussian filter with two passes, clipped to the ellipse and smoothened with a 3 × 3 Gaussian filter. In agreement with intrinsic imaging studies (Rubin and Katz, 1999) at low concentrations only few distinct glomeruli are activated; at higher concentrations widespread activity occurs.
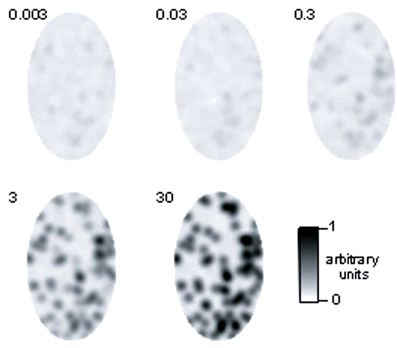
Figure 4. Population response to an odor at different concentrations in the model. The depicted region corresponds to the dorsal part of the OB that has been visualized using intrinsic imaging methods [Rubin and Katz (1999); Uchida et al. (2000); Meister and Bonhoeffer (2001)]. M/TC activity was converted to gray scale values as described in the methods.
Results
Sub-threshold oscillations in M/TCs are synchronized to sniffing and are a hallmark of the early olfactory system (Schaefer and Margrie, 2007; Wachowiak, 2011). Across an individual sampling or oscillation cycle instantaneous firing rate of M/TCs is barely affected by changes in input strength (Cang and Isaacson, 2003; Margrie and Schaefer, 2003). Overall activity of a given M/TC is, however, accurately reflected by its onset latency (Margrie and Schaefer, 2003; Kepecs et al., 2006) that are highly odor-specific and reproducible (Junek et al., 2010). Could these latencies account for the rapid but stimulus dependent discrimination times that are difficult to reconcile with a code relying on “counting” the number of APs discharged during a cycle (Margrie and Schaefer, 2003)? From a simple sketch of AP latencies across the M/TC population (Figure 5) it is apparent that—in the case where very dissimilar odorants evoke spatially non-overlapping activation patterns—odor discrimination based on the onset of activity could be very rapid (Figure 5, left column): For example, where odor A evokes AP discharge early in M/TC #1 and 4 (open arrowhead), odor B evokes APs only late or not at all. Conversely, odor B results in very short onset latencies in M/TC #3 (filled arrowhead) that is activated weakly and late in a cycle by odor A. Thus, for these very different stimuli only a brief period (gray bar and dotted line) would be needed to discriminate odor A from B based on the activity onset pattern.
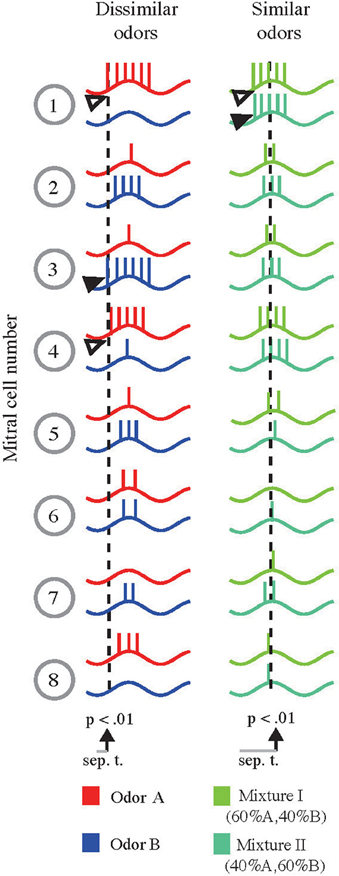
Figure 5. Schematic representation of the proposed AP latency-based scheme and emerging similarity-dependent separation times. Left column: Sketch of the membrane potential of eight M/TCs in response to two different odors (red and blue) with little spatial overlap. For dissimilar odors arrows indicate M/TCs that respond either weakly for odor A and strongly for odor B (solid arrow, M/TC #3) or vice versa (open arrows, M/TC #1 and #4). Based on AP latencies in the strongly activated M/TCs reliable stimulus separation may be achieved early during the evoked response (indicated by the dotted line). Right column: Same M/TCs in response to two similar odors (binary mixtures of A and B, Mixture I [60%A, 40%B], light green; Mixture II [40%A, 60%B], dark green). Due to the overall similarity of M/TC responses, information from many more cells (including those with delayed onsets e.g., M/TC #5 and #6) must be obtained to allow for stimulus separation (dotted lines).
If, however, the response to two similar odors (that evoke highly overlapping patterns; such as binary mixtures, 0.6A/0.4B [Mix 1] and 0.4A/0.6B [Mix 2]) is compared, M/TC #1 may discharge early for both odors (Figure 5 right column, open vs. filled arrowheads). Averaging over a large number of repetitions or alternatively a large number of cells, a very small difference in the initial onset latencies might become apparent. Thus, for “one-sniff” odor discrimination, many cells or glomeruli (including those with delayed onsets, e.g., #5, #6) would be needed to reliably separate very similar stimuli. Hence, while simple discriminations could be performed quickly, difficult separations would require the activity of many late firing M/TCs (Schaefer and Margrie, 2007).
To obtain quantitative evidence for this hypothesis, we built an OB model with 2400 glomeruli containing 25 M/TC each (described in detail in the methods). An activity onset vector for the M/TC network was generated for each odor (Figure 6A). Reproducibility and similarity was determined by correlating these onset vectors (Figures 6B,C). The analysis was then restricted to, for example, the first 200 ms of activity. That is only onset values for those M/TCs discharging within 200 ms were taken into account. For all other M/TCs, ceiling values (200 ms) were employed for the correlation. This time window was then varied and correlations of onset vectors re-calculated until the entire sampling period was encompassed. Using a template-matching scheme we find that within the first 30 ms of activity the latency patterns for repetitions of the same odor are already highly reproducible and that their correlation improves with time (Figure 7A; 1 way ANOVA F(8, 63)= 534, p < 10−5). In contrast, the overall M/TC onset pattern evoked by dissimilar odors revealed no significant correlation over the entire sampling period (Figure 7A; r = −0.008 ± 0.013).
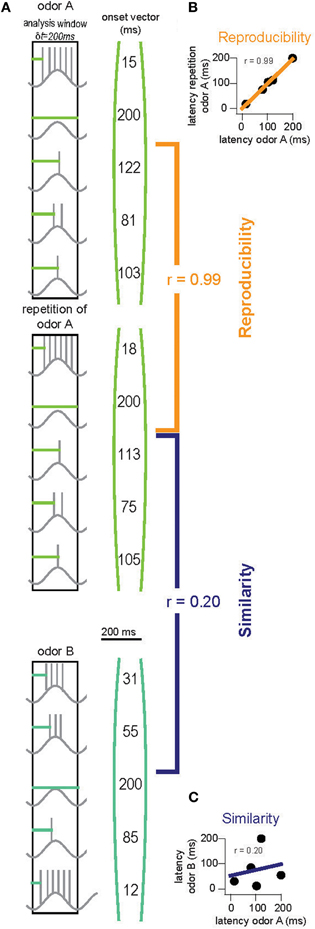
Figure 6. Quantifying stimulus separation in the OB. (A) Onsets of activity (horizontal light and dark green lines) of all M/TCs are collected into “onset vectors” (right). Each odor is presented twice with different random seeds for noise generation. “Reproducibility” is calculated by correlating onset vectors with a repetition of the same odor [orange, (B)]. “Similarity” is determined by correlating onset vectors for responses to two different odors [purple, (C)]. This is repeated eight times with different random seeds for odor and noise generation. Separation of two odors is ensured when the resultant reproducibility values are significantly higher than the similarity values (unpaired t-test).
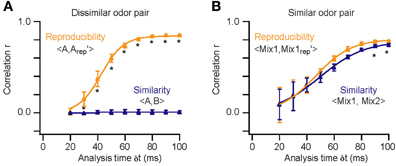
Figure 7. Stimulus reproducibility and similarity in the model. Similarity and reproducibility for repetitions of a dissimilar [A vs. B; (A)] and similar odor pair [Mix1:60A/40B vs. Mix2:40A/60B; (B)] as a function of the analysis time window (δ t). Asterisks (*) highlight times at which “reproducibility” was significantly higher than “similarity” (p < 10−4). Error bars indicate SD for the eight repetitions of each comparison. Thick lines are sigmoidal fits of the correlation scores.
To determine the time-course of AP latency-based stimulus separation we first presented dissimilar odor pairs (e.g., A vs. B). In this case we find that the reproducibility of the M/TC responses is sufficiently large to reliably separate stimuli very early in the evoked response (Figure 7A; p < 10−4 at 30 ms). In contrast, the time required to reliably differentiate the responses to very similar odors (binary mixtures; 0.4A/0.6B vs. 0.6A/0.4B) was substantially longer (Figure 7B; p > 0.1 for δ t < 90 ms). Quantifying stimulus separation times for pairs (n = 10) of both very dissimilar and similar odors shows that while less than 30 ms of OB activity can be enough for easy separation tasks (30 ± 1 ms; range 25–33 ms) up to 90 ms longer is needed to perform the more difficult separation of similar odors (Figure 8, 89 ± 2 ms; 82–118 ms). Both similarity dependence and absolute separation times (Figure 8B) are consistent with the behaviorally observed stimulus-dependent discrimination times in rodents. The stimulus-dependence of separation times was also largely independent of the absolute odor concentration (R2 = 0.12, p > 0.05). This is again consistent with concentration-independent discrimination times observed experimentally (Uchida and Mainen, 2003; Abraham et al., 2004).
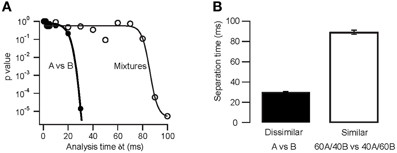
Figure 8. Separation times for dissimilar and similar odor pairs in the model. (A) Stimulus separation (p value of the comparison of reproducibility and similarity) as a function of analysis window time δt. Thick lines are sigmoidal fits. (B) Separation times (time at which reproducibility was significantly higher than similarity) for dissimilar and similar odor pairs. Error bars indicate s.e.m. from 10 odor pairs (eight repetitions each as in A).
A second observation for the olfactory system is that basic odor discrimination appears rather insensitive to partial deletions of the OB. Such studies indicate that disruption of large regions of the OB fail to produce a dramatic behavioral phenotype (Lu and Slotnick, 1998). In some animals, discrimination of very different odors was partially impaired only if lesions impacted on more than 80% of the OB. However, when more difficult discriminations were considered lesioning 50–90% of the OB was at least partially effective (Lu and Slotnick, 1998). To determine whether the AP latency-based coding scheme might also account for these observations we introduced virtual lesions that randomly removed between 50 and 99.7% of the OB. Firstly we find that AP latency-based discrimination is very robust against lesions of the OB. For very dissimilar odorants discrimination could still occur with less than 5% of the intact OB network. For more similar odors 50% of the OB was sufficient to achieve successful odor discrimination, in agreement with previous behavioral observations (Lu and Slotnick, 1998). In addition, we can make the prediction that separation times for discrimination tasks of both easy and intermediate difficulty depended critically on the size of the OB network (Figure 9).
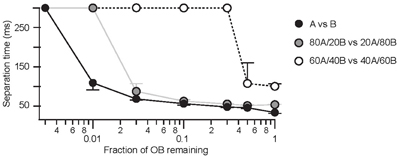
Figure 9. The AP-latency scheme predicts robustness against large OB lesions. Separation times as a function of the size of a “virtual OB lesion” for dissimilar (black), intermediate (gray), and similar (open) odor pairs. Medians and their respective quartiles are plotted.
Discussion
Here we propose a simple scheme of odor representation in the OB that relies on the onset latencies of APs in M/TCs across an individual sampling cycle. At the single-cell level, the model used to test this is based on whole-cell recordings from M/TCs in vivo. The patterns of activity in M/TCs in response to odor stimuli indicate that the overall level of excitation in an individual M/TC is accurately predicted by the onset of APs across each respiration cycle (Margrie and Schaefer, 2003). Our simulations here show that such an AP latency-based scheme can account for a number of temporal and psychophysical features of odor processing. Firstly, it is concentration invariant and mirrors the similarity-dependent discrimination times observed in rodents (Uchida and Mainen, 2003; Abraham et al., 2004; Rinberg et al., 2006). The latency-based scheme also reproduces the behaviorally observed robustness against extensive OB lesions (Lu and Slotnick, 1998) and predicts that the time required to discriminate odors will gradually increase with lesion size. Thus, our data not only account for existing behavioral observations but also predict that the overall odor discrimination time is sensitive to the size of the OB network, a prediction that could be tested in automatized behavioral assays (Schaefer and Claridge-Chang, 2011) where animals with differing lesion size would be systematically tested on a battery of odors with varying similarity.
We speculate that the relative onset latency of a glomerulus or M/TCs contained therein reflects the relative activation intensity of a given ORN channel or functional module (Cang and Isaacson, 2003; Margrie and Schaefer, 2003; Bhandawat et al., 2005; Spors et al., 2006). It has been suggested that lateral inhibition between such functional modules may provide a mechanism of enhancing subtle differences between the activity patterns evoked by different odor stimuli (Yokoi et al., 1995; Urban, 2002; Leon and Johnson, 2003; Cleland and Linster, 2005). Such inhibition either through direct GABAb modulation of the ORNs by juxtaglomerular cells (Aroniadou-Anderjaska et al., 2000) or via the granule cell mediated pathway (Urban, 2002) could be used to enhance differences between the onset latencies of glomerular units (Margrie and Schaefer, 2003). Indeed, alterations to the OB network through Cre-mediated excision of Glutamate receptors resulted in altered olfactory learning and discrimination (Shimshek et al., 2005). More targeted modifications, however, through virus-mediated, ablation of the AMPA receptor subunit GluA2 specifically in the granule cell layer resulted in increased Ca influx in granule cells, and increased inhibition. Odor discrimination learning, however, was left un-altered as were odor discrimination times for simple odor discrimination tasks. Ablating the NMDA receptor subunit NR1 and thus decreasing Ca influx and decreasing inhibition similarly left performance on simple tasks unaltered (Abraham et al., 2010). This indicates that indeed for simple odor discriminations, inhibition in the OB is not needed. For highly similar odor pairs, that require overall longer for accurate discrimination (Abraham et al., 2004), increasing and decreasing inhibition did indeed decrease and increase odor discrimination times (Abraham et al., 2010) indicating a role of inhibition in shaping late activity and thus potentially contributing to the exact latencies of M/TCs active later in a respiration cycle. Irrespective of the exact source of AP latency differences (Cang and Isaacson, 2003; Margrie and Schaefer, 2003; Bhandawat et al., 2005; Buonviso, 2006; Spors et al., 2006; Cury and Uchida, 2010; Carey and Wachowiak, 2011; Shusterman et al., 2011) we suggest that such activity in M/TCs is sufficient to explain several psychophysical properties of the mammalian olfactory system. The role of inhibition might become more prominent in situations where expectation as mediated by cortical inputs onto GCs begins to modulate odor representation (Koulakov and Rinberg, 2011).
A key feature structuring AP latencies and latency difference is the rhythmic sniff-coupled drive that results in sniff-coupled sub-threshold oscillations in M/TCs and consequently in sniff-coupled rhythmic AP discharge. While most electrophysiological recordings so far have been made in anesthetized rodents (e.g., Adrian, 1950; Macrides and Chorover, 1972; reviewed in Buonviso, 2006), recently data has also been acquired in awake animals. While initially it was suggested that the increased sniff frequency in the awake preparation might result in reduced sniff coupling, recent experimental data with careful alignment of unit recording data to sniff measurement again indicates that M/TCs can indeed tightly couple to the underlying sniff rhythm (Cury and Uchida, 2010; Carey and Wachowiak, 2011; Shusterman et al., 2011) consistent with the fact that mice can indeed be behaviorally trained to distinguish inputs at different phases of the sniff cycle (Smear et al., 2011). While these data indicate that AP discharge is indeed tightly coupled to sniffing in the awake animal as well, it remains to be seen whether mechanistically mitral and tufted cells (M/TCs) display similar sniff coupled sub-threshold oscillations in the awake animal that would further strengthen a robust latency encoding of input strength (Hopfield, 1995; Margrie and Schaefer, 2003; Schaefer and Margrie, 2007).
How might M/TC onset latencies be read out? A detailed understanding of the connectivity between OB and piriform cortex on a single-cell level is at present lacking (Miyamichi et al., 2010; Ghosh et al., 2011; Sosulski et al., 2011). Generally, tufted cells project to more anterior parts of olfactory cortex including anterior olfactory nucleus and olfactory tubercle, whereas mitral cells additionally innervate the entire piriform cortex including posterior parts as well as olfactory amygdala (Haberly and Price, 1977; Orona et al., 1984; Nagayama et al., 2010). While most studies indiscriminately investigate M/TC coding properties, these heterogeneous projection patterns might find functional correlates in odor encoding as well (Nagayama et al., 2004). Notably, evidence is mounting for strong direct excitatory drive onto tufted cells, whereas mitral cells seem to be activated either indirectly or with increasing threshold (Gire and Schoppa, 2009; Najac et al., 2011). This might suggest that tufted cells are particularly suited to relay a rapid snapshot of the olfactory environment.
However, implementing any realistic readout mechanism based on known anatomical and physiological properties is, at present, difficult. Recent work indicates that projections from the OB to PCx as well as the odor-evoked patterns in the PCX do not show any specific topography (Stettler and Axel, 2009; Choi et al., 2011; Sosulski et al., 2011). Minimal stimulation studies (Franks and Isaacson, 2006) and in vivo recordings (Wilson, 1998; Poo and Isaacson, 2009) show that many M/TCs as well as recruitment of recurrent excitation in PCx may be necessary to produce the observsed compound EPSPs observed in piriform cortex (Franks et al., 2011). This, together with electroencephalogram recordings, that suggest a substantial temporal heterogeneity of mono- and di-synaptic delays (Ketchum and Haberly, 1993), offers a potential substrate for coincidence-based readout (Hopfield, 1995; White et al., 1998; Margrie and Schaefer, 2003). Due to feed-forward inhibitory circuits, such detection mechanisms might be further sharpened (Perez-Orive et al., 2002; Stokes and Isaacson, 2010; Suzuki and Bekkers, 2010) thereby increasing the sparseness of M/TC readout. Thus, although an AP latency based code in M/TCs is sufficient to explain stimulus-dependent discrimination times, concentration invariance, and the olfactory systems robustness against lesioning, the mechanism underlying downstream readout of such activity is yet to be determined.
Conflict of Interest Statement
The authors declare that the research was conducted in the absence of any commercial or financial relationships that could be construed as a potential conflict of interest.
Acknowledgments
We thank Alexander Arenz, Diogo Pimentel, and Moritz Helmstaedter for discussion. This work was supported by the Max-Planck-Society, the BMBF, DFG SPP1392, the Gottschalk-Stiftung (Andreas T. Schaefer), the Wellcome Trust and the MRC (MC_U1175975156; Troy W. Margrie). Andreas T. Schaefer is a member of the ExcellenzCluster CellNetworks.
Abbreviations
AP, action potential; EPSP, excitatory postsynaptic potential; InF, integrate-and-fire; ISI, inter-spike interval; MC, mitral cell; M/TC, mitral/tufted cell collectively referring to projection neurons; OB, olfactory bulb; TC, tufted cell.
References
Abraham, N. M., Egger, V., Shimshek, D. R., Renden, R., Fukunaga, I., Sprengel, R., Seeburg, P. H., Klugmann, M., Margrie, T. W., Schaefer, A. T., and Kuner, T. (2010). Synaptic inhibition in the olfactory bulb accelerates odor discrimination in mice. Neuron 65, 399–411.
Abraham, N. M., Spors, H., Carleton, A., Margrie, T. W., Kuner, T., and Schaefer, A. T. (2004). Maintaining accuracy at the expense of speed: stimulus similarity defines odor discrimination time in mice. Neuron 44, 865–876.
Adrian, E. D. (1950). The electrical activity of the mammalian olfactory bulb. Electroenceph. Clin. Neurophysiol. 2, 377–388.
Aroniadou-Anderjaska, V., Zhou, F. M., Priest, C. A., Ennis, M., and Shipley, M. T. (2000). Tonic and synaptically evoked presynaptic inhibition of sensory input to the rat olfactory bulb via GABA(B) heteroreceptors. J. Neurophysiol. 84, 1194–1203.
Bhandawat, V., Reisert, J., and Yau, K.-W. (2005). Elementary response of olfactory receptor neurons to odorants. Science 308, 1931–1934.
Buonviso, N. (2006). Respiratory modulation of olfactory neurons in the rodent brain. Chem. Senses 31, 145–154.
Cang, J., and Isaacson, J. S. (2003). In vivo whole-cell recording of odor-evoked synaptic transmission in the rat olfactory bulb. J. Neurosci. 23, 4108–4116.
Carey, R. M., Verhagen, J. V., Wesson, D. W., Pirez, N., and Wachowiak, M. (2009). Temporal structure of receptor neuron input to the olfactory bulb imaged in behaving rats. J. Neurophysiol. 101, 1073–1088.
Carey, R. M., and Wachowiak, M. (2011). Effect of sniffing on the temporal structure of mitral/tufted cell output from the olfactory bulb. J. Neurosci. 31, 10615–10626.
Charpak, S., Mertz, J., Beaurepaire, E., Moreaux, L., and Delaney, K. (2001). Odor-evoked calcium signals in dendrites of rat mitral cells. Proc. Natl. Acad. Sci. U.S.A. 98, 1230–1234.
Choi, G. B., Stettler, D. D., Kallman, B. R., Bhaskar, S. T., Fleischmann, A., and Axel, R. (2011). Driving opposing behaviors with ensembles of piriform neurons. Cell 146, 1004–1015.
Cleland, T. A., and Linster, C. (2005). Computation in the olfactory system. Chem. Senses 30, 801–813.
Cury, K. M., and Uchida, N. (2010). Robust odor coding via inhalation-coupled transient activity in the mammalian olfactory bulb. Neuron 68, 570–585.
Duchamp-Viret, P., Chaput, M. A., and Duchamp, A. (1999). Odor response properties of rat olfactory receptor neurons. Science 284, 2171–2174.
Franks, K. M., and Isaacson, J. S. (2006). Strong single-fiber sensory inputs to olfactory cortex: implications for olfactory coding. Neuron 49, 357–363.
Franks, K. M., Russo, M. J., Sosulski, D. L., Mulligan, A. A., Siegelbaum, S. A., and Axel, R. (2011). Recurrent circuitry dynamically shapes the activation of piriform cortex. Neuron 72, 49–56.
Ghosh, S., Larson, S. D., Hefzi, H., Marnoy, Z., Cutforth, T., Dokka, K., and Baldwin, K. K. (2011). Sensory maps in the olfactory cortex defined by long-range viral tracing of single neurons. Nature 472, 217–220.
Gire, D. H., and Schoppa, N. E. (2009). Control of on/off glomerular signaling by a local GABAergic microcircuit in the olfactory bulb. J. Neurosci. 29, 13454–13464.
Haberly, L. B., and Price, J. L. (1977). The axonal projection patterns of the mitral and tufted cells of the olfactory bulb in the rat. Brain Res. 129, 152–157.
Hopfield, J. J. (1995). Pattern recognition computation using action potential timing for stimulus representation. Nature 376, 33–36.
Junek, S., Kludt, E., Wolf, F., and Schild, D. (2010). Olfactory coding with patterns of response latencies. Neuron 67, 872–884.
Kepecs, A., Uchida, N., and Mainen, Z. F. (2006). The sniff as a unit of olfactory processing. Chem. Senses 31, 167–179.
Ketchum, K. L., and Haberly, L. B. (1993). Membrane currents evoked by afferent fiber stimulation in rat piriform cortex. I: current source-density analysis. J. Neurophysiol. 69, 248–260.
Koulakov, A., Gelperin, A., and Rinberg, D. (2007). Olfactory coding with all-or-nothing glomeruli. J. Neurophysiol. 98, 3134–3142.
Koulakov, A. A., and Rinberg, D. (2011). Sparse incomplete representations: a potential role of olfactory granule cells. Neuron 72, 124–136.
Künsting, T., and Spors, H. (2009). Dynamics of input patterns modulate the behavior of a model of olfactory bulb function. J. Neurophysiol. 102, 100–109.
Lengyel, M., and Erdi, P. (2004). Theta-modulated feedforward network generates rate and phase coded firing in the entorhino-hippocampal system. IEEE Trans. Neural Netw. 15, 1092–1099.
Leon, M., and Johnson, B. A. (2003). Olfactory coding in the mammalian olfactory bulb. Brain Res. Rev. 42, 23–32.
Linster, C., and Cleland, T. A. (2004). Configurational and elemental odor mixture perception can arise from local inhibition. J. Comput. Neurosci. 16, 39–47.
Lu, X. C., and Slotnick, B. M. (1998). Olfaction in rats with extensive lesions of the olfactory bulbs: implications for odor coding. Neuroscience 84, 849–866.
Macrides, F., and Chorover, S. L. (1972). Olfactory bulb units: activity correlated with inhalation cycles and odor quality. Science 175, 84–87.
Margrie, T. W., and Schaefer, A. T. (2003). Theta oscillation coupled spike latencies yield computational vigour in a mammalian sensory system. J. Physiol. 546, 363–374.
Meister, M., and Bonhoeffer, T. (2001). Tuning and topography in an odor map on the rat olfactory bulb. J. Neurosci. 21, 1351–1360.
Miyamichi, K., Amat, F., Moussavi, F., Wang, C., Wickersham, I., Wall, N. R., Taniguchi, H., Tasic, B., Huang, Z. J., He, Z., Callaway, E. M., Horowitz, M. A., and Luo, L. (2010). Cortical representations of olfactory input by trans-synaptic tracing. Nature 472, 191–196.
Nagayama, S., Enerva, A., Fletcher, M. L., Masurkar, A. V., Igarashi, K. M., Mori, K., and Chen, W. R. (2010). Differential axonal projection of mitral and tufted cells in the mouse main olfactory system. Front. Neural Circuits 4:120. doi: 10.3389/fncir.2010.00120
Nagayama, S., Takahashi, Y. K., Yoshihara, Y., and Mori, K. (2004). Mitral and tufted cells differ in the decoding manner of odor maps in the rat olfactory bulb. J. Neurophysiol. 91, 2532–2540.
Najac, M. De Saint Jan, D., Reguero, L., Grandes, P., and Charpak, S. (2011). Monosynaptic and polysynaptic feed-forward inputs to mitral cells from olfactory sensory neurons. J. Neurosci. 31, 8722–8729.
Orona, E., Rainer, E. C., and Scott, J. W. (1984). Dendritic and axonal organization of mitral and tufted cells in the rat olfactory bulb. J. Comp. Neurol. 226, 346–356.
Perez-Orive, J., Mazor, O., Turner, G. C., Cassenaer, S., Wilson, R. I., and Laurent, G. (2002). Oscillations and sparsening of odor representations in the mushroom body. Science 297, 359–365.
Poo, C., and Isaacson, J. S. (2009). Odor representations in olfactory cortex: “sparse” coding, global inhibition, and oscillations. Neuron 62, 850–861.
Rinberg, D., Koulakov, A., and Gelperin, A. (2006). Speed-accuracy tradeoff in olfaction. Neuron 51, 351–358.
Rubin, B. D., and Katz, L. C. (1999). Optical imaging of odorant representations in the mammalian olfactory bulb. Neuron 23, 499–511.
Schaefer, A. T., Angelo, K., Spors, H., and Margrie, T. W. (2006). Neuronal oscillations enhance stimulus discrimination by ensuring action potential precision. PLoS Biol. 4:e163. doi: 10.1371/journal.pbio.0040163
Schaefer, A. T., and Claridge-Chang, A. (2011). The surveillance state of behavioral automation. Curr. Opin. Neurobiol. 22, 170–176.
Schaefer, A. T., and Margrie, T. W. (2007). Spatiotemporal representations in the olfactory system. Trends Neurosci. 30, 92–100.
Shimshek, D. R., Bus, T., Kim, J., Mihaljevic, A., Mack, V., Seeburg, P. H., Sprengel, R., and Schaefer, A. T. (2005). Enhanced odor discrimination and impaired olfactory memory by spatially controlled switch of AMPA receptors. PLoS Biol. 3:e354. doi: 10.1371/journal.pbio.0030354
Shusterman, R., Smear, M. C., Koulakov, A. A., and Rinberg, D. (2011). Precise olfactory responses tile the sniff cycle. Nat. Neurosci. 14, 1039–1044.
Smear, M., Shusterman, R., O'Connor, R., Bozza, T., and Rinberg, D. (2011). Perception of sniff phase in mouse olfaction. Nature 479, 397–400.
Sosulski, D. L. Lissitsyna Bloom, M., Cutforth, T., Axel, R., and Datta, S. R. (2011). Distinct representations of olfactory information in different cortical centres. Nature 472, 213–216.
Spors, H., and Grinvald, A. (2002). Spatio-temporal dynamics of odor representations in the mammalian olfactory bulb. Neuron 34, 301–315.
Spors, H., Wachowiak, M., Cohen, L. B., and Friedrich, R. W. (2006). Temporal dynamics and latency patterns of receptor neuron input to the olfactory bulb. J. Neurosci. 26, 1247–1259.
Stettler, D. D., and Axel, R. (2009). Representations of odor in the piriform cortex. Neuron 63, 854–864.
Stokes, C. C. A., and Isaacson, J. S. (2010). From dendrite to soma: dynamic routing of inhibition by complementary interneuron microcircuits in olfactory cortex. Neuron 67, 452–465.
Suzuki, N., and Bekkers, J. M. (2010). Distinctive classes of GABAergic interneurons provide layer-specific phasic inhibition in the anterior piriform cortex. Cereb. Cortex 20, 2971–2984.
Uchida, N., and Mainen, Z. F. (2003). Speed and accuracy of olfactory discrimination in the rat. Nat. Neurosci. 6, 1224–1229.
Uchida, N., Takahashi, Y. K., Tanifuji, M., and Mori, K. (2000). Odor maps in the mammalian olfactory bulb: domain organization and odorant structural features. Nat. Neurosci. 3, 1035–1043.
Urban, N. N. (2002). Lateral inhibition in the olfactory bulb and in olfaction. Physiol. Behav. 77, 607–612.
Verhagen, J. V., Wesson, D. W., Netoff, T. I., White, J. A., and Wachowiak, M. (2007). Sniffing controls an adaptive filter of sensory input to the olfactory bulb. Nat. Neurosci. 10, 631–639.
Wachowiak, M., and Cohen, L. B. (2001). Representation of odorants by receptor neuron input to the mouse olfactory bulb. Neuron 32, 723–735.
Wesson, D. W., Carey, R. M., Verhagen, J. V., and Wachowiak, M. (2008). Rapid encoding and perception of novel odors in the rat. PLoS Biol. 6:e82. doi: 10.1371/journal.pbio.0060082
White, J., Dickinson, T. A., Walt, D. R., and Kauer, J. S. (1998). An olfactory neuronal network for vapor recognition in an artificial nose. Biol. Cybern. 78, 245–251.
Wilson, D. A. (1998). Habituation of odor responses in the rat anterior piriform cortex. J. Neurophysiol. 79, 1425–1440.
Keywords: model, latency code, olfaction, discrimination times, in vivo, behavior
Citation: Schaefer AT and Margrie TW (2012) Psychophysical properties of odor processing can be quantitatively described by relative action potential latency patterns in mitral and tufted cells. Front. Syst. Neurosci. 6:30. doi: 10.3389/fnsys.2012.00030
Received: 03 January 2012; Accepted: 09 April 2012;
Published online: 09 May 2012.
Edited by:
Milagros Gallo, University of Granada, SpainReviewed by:
Milagros Gallo, University of Granada, SpainEdmund Rolls, Oxford Centre for Computational Neuroscience, UK
Copyright: © 2012 Schaefer and Margrie. This is an open-access article distributed under the terms of the Creative Commons Attribution Non Commercial License, which permits non-commercial use, distribution, and reproduction in other forums, provided the original authors and source are credited.
*Correspondence: Andreas T. Schaefer and Troy W. Margrie, Department of Neuroscience, Physiology and Pharmacology, University College London, Rockefeller Building, University Street, London WC1E 6JJ, UK. e-mail: schaefer@mpimf-heidelberg.mpg.de; tmargri@nimr.mrc.ac.uk