Amplitude of Sensorimotor Mu Rhythm Is Correlated with BOLD from Multiple Brain Regions: A Simultaneous EEG-fMRI Study
 Siyang Yin
 Yuelu Liu
 Mingzhou Ding
- 1J. Crayton Pruitt Family Department of Biomedical Engineering, University of Florida, Gainesville, FL, USA
- 2Center for Mind and Brain, University of California, Davis, Davis, CA, USA
The mu rhythm is a field oscillation in the ∼10Hz range over the sensorimotor cortex. For decades, the suppression of mu (event-related desynchronization) has been used to index movement planning, execution, and imagery. Recent work reports that non-motor processes, such as spatial attention and movement observation, also desynchronize mu, raising the possibility that the mu rhythm is associated with the activity of multiple brain regions and systems. In this study, we tested this hypothesis by recording simultaneous resting-state EEG-fMRI from healthy subjects. Independent component analysis (ICA) was applied to extract the mu components. The amplitude (power) fluctuations of mu were estimated as a time series using a moving-window approach, which, after convolving with a canonical hemodynamic response function (HRF), was correlated with blood-oxygen-level-dependent (BOLD) signals from the entire brain. Two main results were found. First, mu power was negatively correlated with BOLD from areas of the sensorimotor network, the attention control network, the putative mirror neuron system, and the network thought to support theory of mind. Second, mu power was positively correlated with BOLD from areas of the salience network, including anterior cingulate cortex and anterior insula. These results are consistent with the hypothesis that sensorimotor mu rhythm is associated with multiple brain regions and systems. They also suggest that caution should be exercised when attempting to interpret mu modulation in terms of a single brain network.
Introduction
The mu rhythm (8 to 12 Hz) is a field oscillation observed over central and central-parietal electrodes in humans. Since its discovery, the suppression or blocking of mu (desynchronization) has been associated with a variety of movement conditions, including passive movements, reflexive movements, voluntary movements, and commanded movements, as well as with tactile stimulation (Chatrian et al., 1959). Subsequent work demonstrates that motor planning or even motor imagery can desynchronize mu (Pfurtscheller and Neuper, 1997). The sensorimotor origin of mu modulation was further solidified in simultaneous EEG-fMRI studies where the power of mu was found to be negatively correlated with blood-oxygen-level-dependent (BOLD) signals from the pericentral cortex and supplementary motor cortex (Ritter et al., 2009; Mizuhara, 2012).
Association of mu with other brain regions and neural systems has also been suggested. First, observation of movements can suppress mu power (Cohen-Seat et al., 1954; Cochin et al., 1999; Pineda, 2005), suggesting a link between mu and the mirror neuron system (Pineda, 2005). In humans, areas implicated in mirror neuron activity include premotor cortex, considered as the homolog to area F5 of the macaque monkey where the mirror neurons were initially discovered (Rizzolatti et al., 1996; Buccino et al., 2001; Keysers and Gazzola, 2009), inferior parietal lobule (IPL) (Fogassi et al., 2005), inferior frontal gyrus (IFG) (Kilner et al., 2009), and posterior middle temporal gyrus (pMTG) (Gazzola et al., 2007). It is thus reasonable to expect that mu is associated with the activity of these brain regions by exhibiting negative correlation with their BOLD.
Second, theory of mind, a hypothesized mechanism to comprehend the mental states of others, can be thought of as an extension of the mirror neuron concept to the cognitive and affective domains. Brain regions that are frequently implicated in theory of mind include medial prefrontal cortex (mPFC), superior temporal sulcus/ superior temporal gyrus (STS/STG), temporoparietal junction (TPJ), and temporal poles (TP) (Schulte-Rüther et al., 2007; Mar, 2011). Although no prior studies have reported a relationship between these regions and the mu rhythm, in light of the resemblance between the mirror neuron mechanism and theory of mind, it is reasonable to expect that the BOLD signal from theory of mind regions and the power of mu may be inversely correlated.
Third, mu rhythm has been shown to be somatotopically modulated by spatial somatosensory attention (Jones et al., 2010; Anderson and Ding, 2011), analogous to the modulation of visual alpha rhythm by spatial visual attention (Vanni et al., 1997; Worden et al., 2000; Capotosto et al., 2009; Rajagovindan and Ding, 2011). This raises the possibility that attention control regions including intraparietal sulcus (IPS) and frontal eye field (FEF) are inversely coupled with the mu rhythm.
In this paper we tested these hypotheses by recording simultaneous EEG-fMRI from healthy subjects at rest. Mu components were isolated using the independent component analysis (ICA) method. The power of mu fluctuations was extracted from these ICA components using short-time Fourier transforms and convolved with a canonical hemodynamic response function (HRF). The HRF-convolved mu power time series were then correlated with the concurrently recorded BOLD activity to assess both negative and positive couplings between mu and neural activity in different brain regions.
Materials and Methods
Experimental Procedure
The experimental protocol and data acquisition procedure were approved by the Institutional Review Board of the University of Florida. Thirty-six healthy, right-handed college students (19 females; mean age: 20.45 ± 3.66) gave informed consent and participated in the study in exchange for course credits. During resting-state recording (7 min) subjects were instructed to lie still in the scanner with eyes closed and refrain from falling asleep or focusing on any specific thoughts.
EEG Data Acquisition
EEG data were recorded using a 32-channel MR-compatible EEG system (Brain Products GmbH, Germany). Thirty one sintered Ag/AgCl electrodes were placed according to the 10–20 system and one additional electrode was placed on the participant’s upper back to monitor electrocardiogram (ECG). Electrocardiogram was used subsequently to aid the removal of the cardioballistic artifacts. The impedance from all scalp channels was kept below 10 kΩ during the entire recording session as recommended by the manufacturer.
The online band-pass filter had cutoff frequencies at 0.1 and 250 Hz. The filtered EEG signal was sampled at 5 kHz, digitized to 16-bit, and transferred to the recording computer via a fiber-optic cable. The EEG recording system was synchronized with the scanner’s internal clock, which, along with the high sampling rate, was essential to ensure the successful removal of the gradient artifacts.
FMRI Data Acquisition
Functional MRI images were acquired on a 3-Tesla Philips Achieva whole-body MRI system (Philips Medical Systems, the Netherlands) using a T2*-weighted echoplanar imaging (EPI) sequence (echo time (TE) = 30 ms; repetition time (TR) = 1980 ms; flip angle = 80°). Two hundred and twelve (212) volumes of functional resting state images were acquired, with each whole-brain volume consisting of 36 axial slices aligned with the anterior and posterior commissures (field of view: 224 mm; matrix size: 64 × 64; slice thickness: 3.50 mm; voxel size: 3.5 mm × 3.5 mm × 3.5 mm). A T1-weighted high resolution structural image was also obtained from each subject.
EEG Preprocessing
There were two major sources of MRI-related artifacts in EEG recorded simultaneously with fMRI: the gradient artifacts and the cardioballistic artifacts. The gradient artifacts were removed by subtracting an average artifact template from the data set as implemented in Brain Vision Analyzer 2.0 (Brain Products GmbH, Germany). The artifact template was constructed by using a sliding-window approach which involved averaging the EEG signal across the nearest 41 consecutive volumes. The cardioballistic artifacts were also removed by an average artifact subtraction method (Allen et al., 1998). In this method, the R peaks were first detected in the ECG recordings by the algorithm in Brain Vision Analyzer, and then visually inspected to ensure accuracy. The appropriately detected R peaks were utilized to construct a delayed average artifact template over 21 consecutive heartbeat events. The cardioballistic artifacts were then removed by subtracting the average artifact templates from the EEG data. After these two steps, the EEG data were band-pass filtered between 0.5 and 50 Hz, down-sampled to 250 Hz, re-referenced to the average reference (Nunez et al., 1997), and exported to EEGLAB (Delorme and Makeig, 2004) for analysis.
FMRI Preprocessing
Functional MRI data was preprocessed in SPM51. The first 5 scans of the resting state session were discarded in order to eliminate the transient effects. The preprocessing steps included motion correction, slice timing correction, co-registration, normalization to the Montreal Neurological Institute (MNI) template, re-sampling of the functional images into a voxel size of 3 mm × 3 mm × 3 mm (Friston et al., 1995), and spatial smoothing by a Gaussian kernel with 7 mm FWHM (Full Width at Half Maximum). Global scaling was applied to remove the global signal from the BOLD time series (Desjardins et al., 2001). The BOLD time series was then band-pass filtered between 0.01 and 0.1 Hz.
SOBI ICA Estimation of Mu Components
The amplitude of mu oscillations is typically much smaller than that of the more dominant posterior alpha oscillations (Benbadis, 2015). Because the two rhythms share similar frequency characteristics, sensorimotor mu activity estimated at the sensor level is likely to be contaminated by visual alpha activity due to volume conduction. To overcome this problem, artifacts-corrected EEG data was decomposed into independent components by the Second Order Blind Identification (SOBI) method (Belouchrani et al., 1997; Tang et al., 2005a,b; Moore et al., 2012) implemented in EEGLAB. An ICA component was selected for further examination if (1) the time series had a power spectrum with a well-defined peak within the 8–12 Hz range, (2) the spatial topographic map suggested a sensorimotor origin, and (3) the time series was not contaminated by large movement artifacts for the entire 7 min of recording and analysis. See Figures 1A–C for an example. To further confirm the component’s sensorimotor origin its dipole source was obtained using the DIPFIT function implemented in EEGLAB. The locations of the fitted dipoles, with one dipole for each component, were subject to visual inspection. A total of 22 independent mu components were selected from 15 subjects. For the subjects (n = 7) who contributed two components, we tested the dependence of the two components, and found that the correlation between the two components was small (mean R2 = 0.06). In Figure 1D the dipole sources of the 22 components (11 in the left hemisphere and 11 in the right hemisphere) were displayed. The sensorimotor origin of these dipoles were apparent. For the remaining 21 subjects whose ICA components did not meet the above stringent inclusion criteria their data were not considered further.
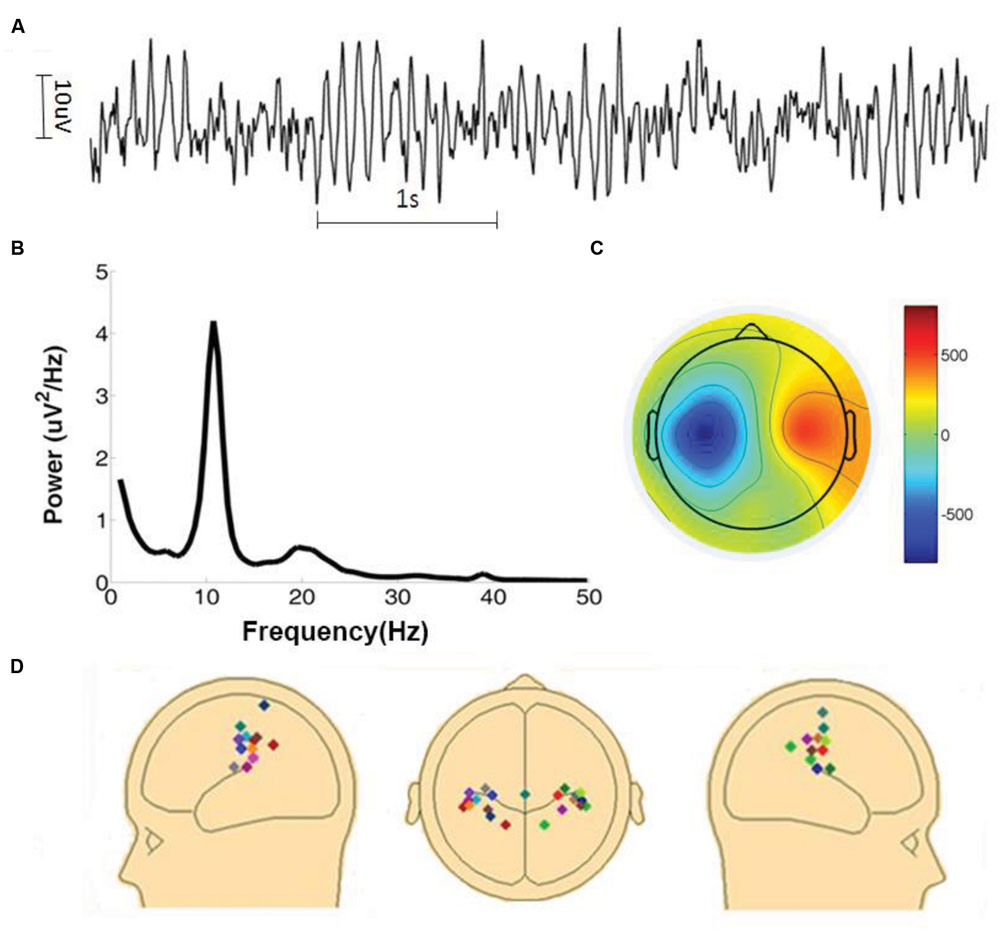
FIGURE 1. Identification of mu components. (A) Time series of a typical mu component. (B) Power spectrum of the mu component shown in (A). (C) Topographic map of the mu component shown in (A). Color bar on the right side represents the inversed weights of ICA components. (D) Dipole sources of all 22 mu components.
Estimation of Mu Power Time Series
For each of the 22 components the mu power time series was estimated by the following steps. First, the EEG signal was segmented into 500 ms non-overlapping epochs. Second, the EEG signal within each epoch was zero–padded to 4 times its original length (500 points after padding) to enhance spectral resolution from 2 to 0.5 Hz. Third, the EEG power spectrum for each epoch was calculated using a non-parametric multitaper approach with 3 tapers (Mitra and Pesaran, 1999), and the mu power of each epoch was estimated by averaging the power spectrum between 8 and 12 Hz. Fourth, for epochs with abnormal log power values (>3 SD), ∼3% of the data, their power was replaced by the average power of the epochs on either sides of them. Fifth, the mu power time series so-obtained was convolved with the canonical HRF. Finally, the HRF-convolved mu power time series was down-sampled to the same sampling frequency as the BOLD signal for correlation analysis.
Correlation between Mu Power and BOLD Activity
Zero-lag cross correlation between HRF-convolved mu power time series and BOLD time series from all voxels was computed for each mu component and Fisher transformed (Fox et al., 2005; Mantini et al., 2007; Mo et al., 2013). Brain regions showing significant mu-BOLD correlation at the group level (p < 0.05, FDR) were identified by a voxel-wise one-sample t-test.
Correlation between Beta and Delta Power and BOLD Activity
To ensure that the mu-BOLD correlation is not due to non-physiological factors such as motion and noise, HRF-convolved beta (18 to 30 Hz) power time series and HRF-convolved delta (1 to 4 Hz) power time series were similarly estimated from the same 22 components, and correlated with the BOLD. Brain regions showing significant beta-BOLD and delta-BOLD correlation at the group level (p < 0.05, FDR) were identified by a voxel-wise one-sample t-test.
Results
The time series from a typical mu component is shown in Figure 1A where rhythmic activity is clearly seen. In Figure 1B, the power spectrum of the component time series confirms the presence of ∼10 Hz oscillation. The sensorimotor origin of this component is suggested by the component’s topographic map in Figure 1C. To further verify the origin of a mu component, its topographic map was subject to a source localization procedure. The dipole sources of the 22 components analyzed here were plotted in three different views in Figure 1D. These dipole sources were seen to be located in the vicinity of the central sulcus.
As can be seen in Figure 1A, the power (amplitude) of the time series fluctuates over time, and this fluctuation can be used to discover the brain regions whose activities co-vary with it. For each mu component, its mu power time series, which was used to track the fluctuation of the mu amplitude profile (Figure 2A), was estimated using a short-time Fourier approach. The HRF-convolved mu power time series, plotted together with BOLD signals from two different brain regions (Figures 2B,C) reveal that mu power was negatively correlated with BOLD from SMA but positively correlated with BOLD from thalamus.
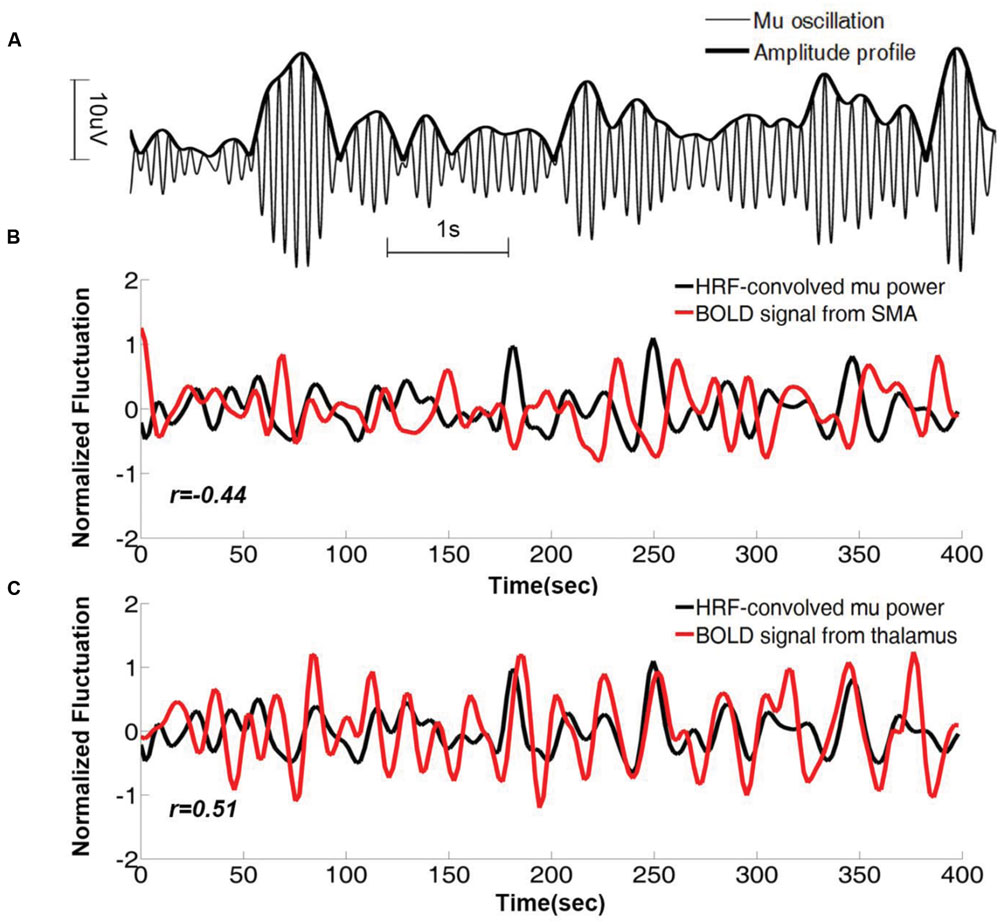
FIGURE 2. Mu time series and its correlation with BOLD from a representative subject. (A) Mu oscillations and its amplitude profile. (B) HRF-convolved mu power time series plotted together with the simultaneously acquired BOLD time series from right SMA. Correlation coefficient between the two time series is r = -0.43 (p < 0.01). (C) The same HRF-convolved mu power time series plotted together with the simultaneously acquired BOLD time series from right thalamus. Correlation coefficient r = 0.51 (p < 0.01). SMA: supplementary motor cortex.
Figure 3 shows that, at the group level, mu power was negatively correlated with BOLD in a number of brain regions, including (1) SMA, pre- and post-central gyrus, which are major areas in the sensorimotor system, (2) FEF, IPS, and superior parietal lobule (SPL), which are major areas in the attention control system, and (3) IPL, IFG, pMTG, and STG, which are areas variously associated with the mirror neuron system and theory of mind. Table 1 summarizes the regions, in Automated Anatomical Labeling (AAL) nomenclature, that are negatively correlated with mu power (coordinates of most correlated voxels are listed). The putative membership of each region in major functional brain systems is also given.
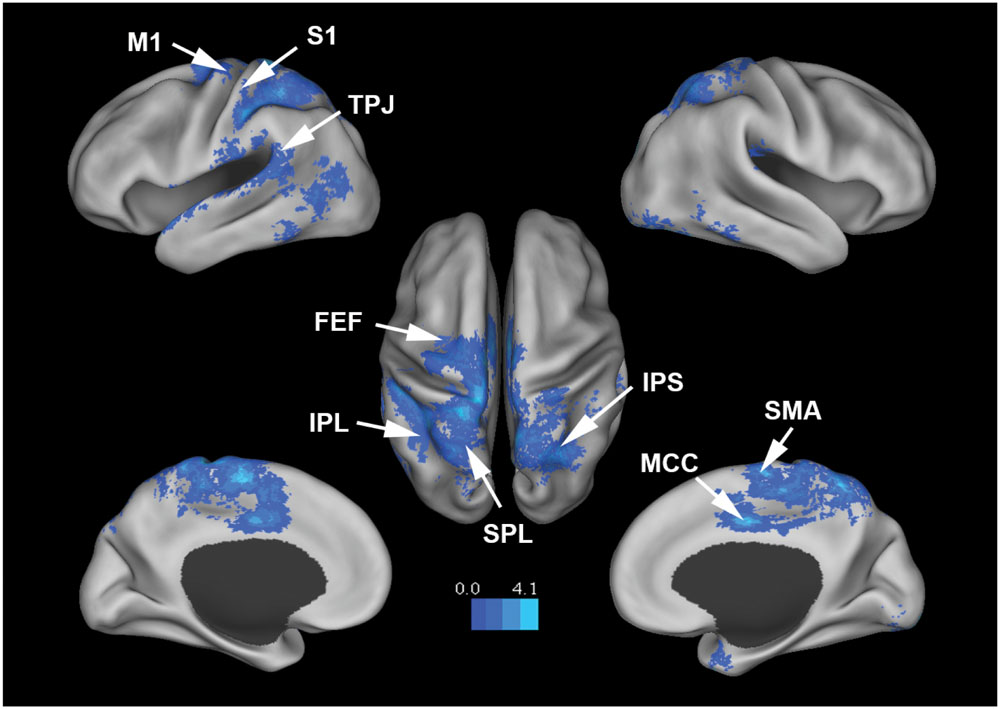
FIGURE 3. Brain regions whose BOLD signals are negatively correlated with EEG mu power (p < 0.05, FDR corrected). T-values were color-coded. SMA, supplementary motor cortex; MCC, middle cingulate cortex; FEF, frontal eye field; SPL, superior parietal lobule; IPS, intraparietal sulcus; IPL, inferior parietal lobule; M1, primary motor cortex; S1, primary somatosensory cortex; TPJ, temporoparietal junction.
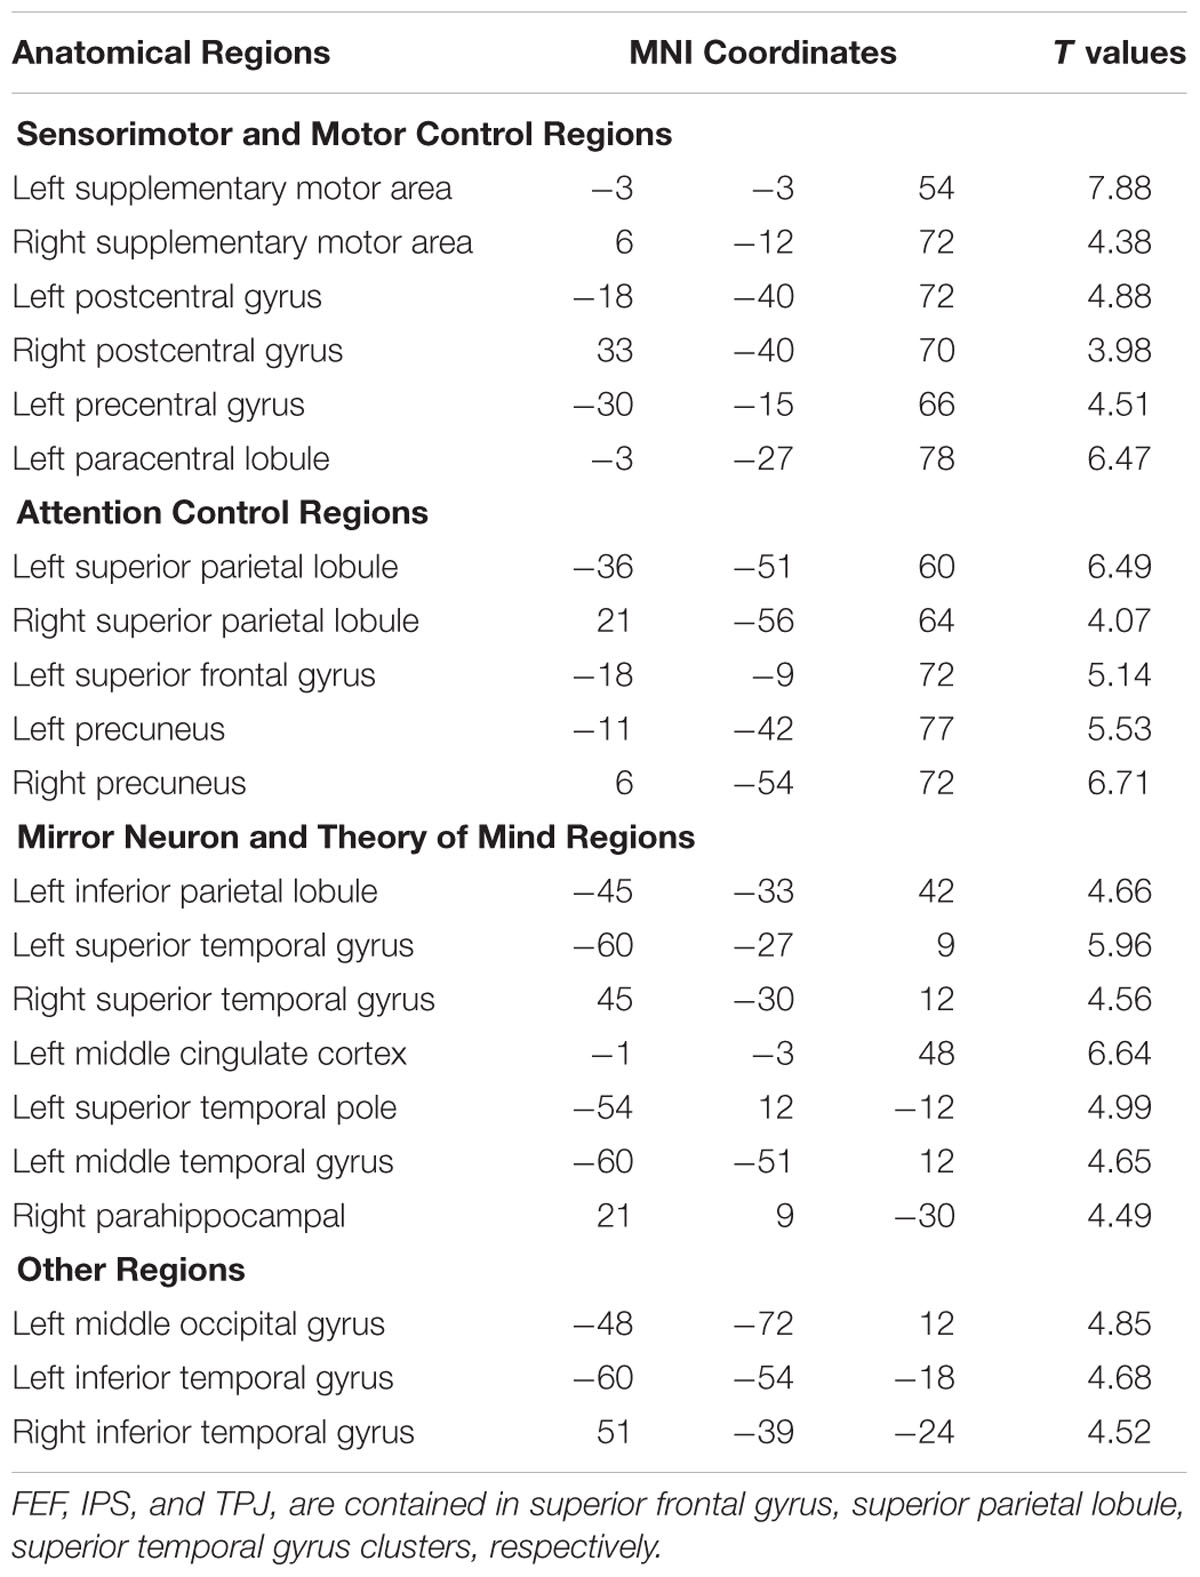
TABLE 1. Brain regions (in AAL nomenclature) whose BOLD signals are negatively correlated with EEG mu power (p < 0.05, FDR corrected).
Figure 4 shows that, at the group level, mu power was positively correlated with BOLD signals from anterior cingulate cortex (ACC), insula, and orbital frontal cortex. Table 2 lists these regions and additional cortical and subcortical areas including thalamus, putamen, and hippocampus whose BOLD was also positively correlated with mu power. Many of these structures lie within the salience network (Seeley et al., 2007), which is thought to play a crucial role in the detection of salient stimuli such as error, threat, faces of loved ones, and social rejection (Eisenberger et al., 2003; Bartels and Zeki, 2004; Holroyd et al., 2004). Other subcortical structures in the salience network are variously associated with such diverse functions as reward, emotion, and homeostasis.
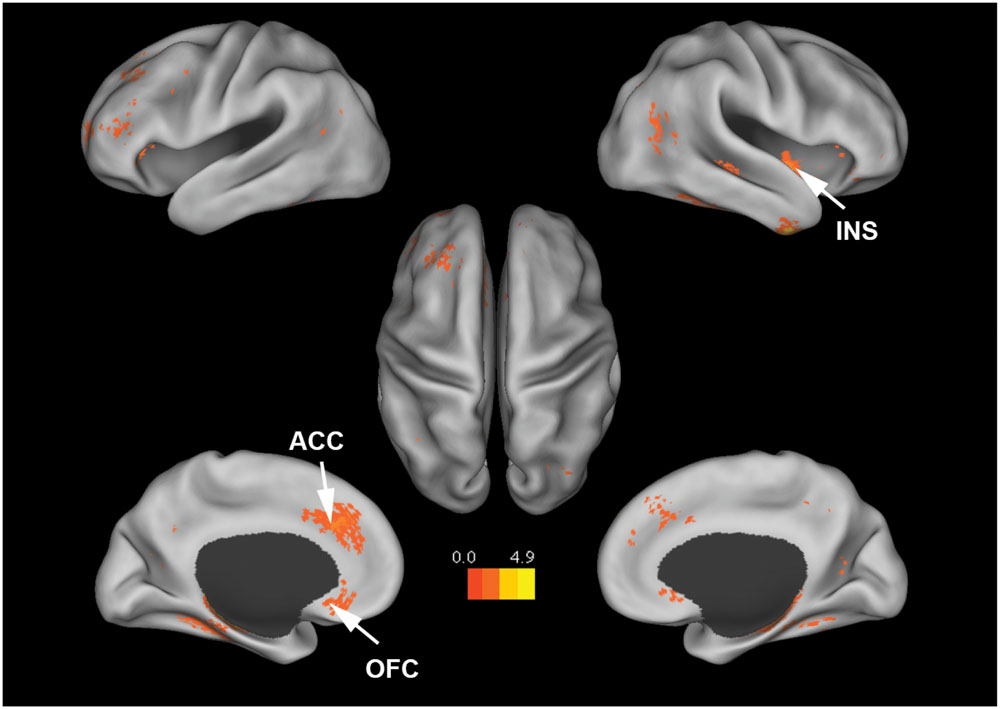
FIGURE 4. Brain regions whose BOLD signals are positively correlated with EEG mu power (p < 0.05, FDR corrected). T-values were color-coded. INS, insula; ACC, anterior cingulate cortex; OFC, orbital frontal cortex.
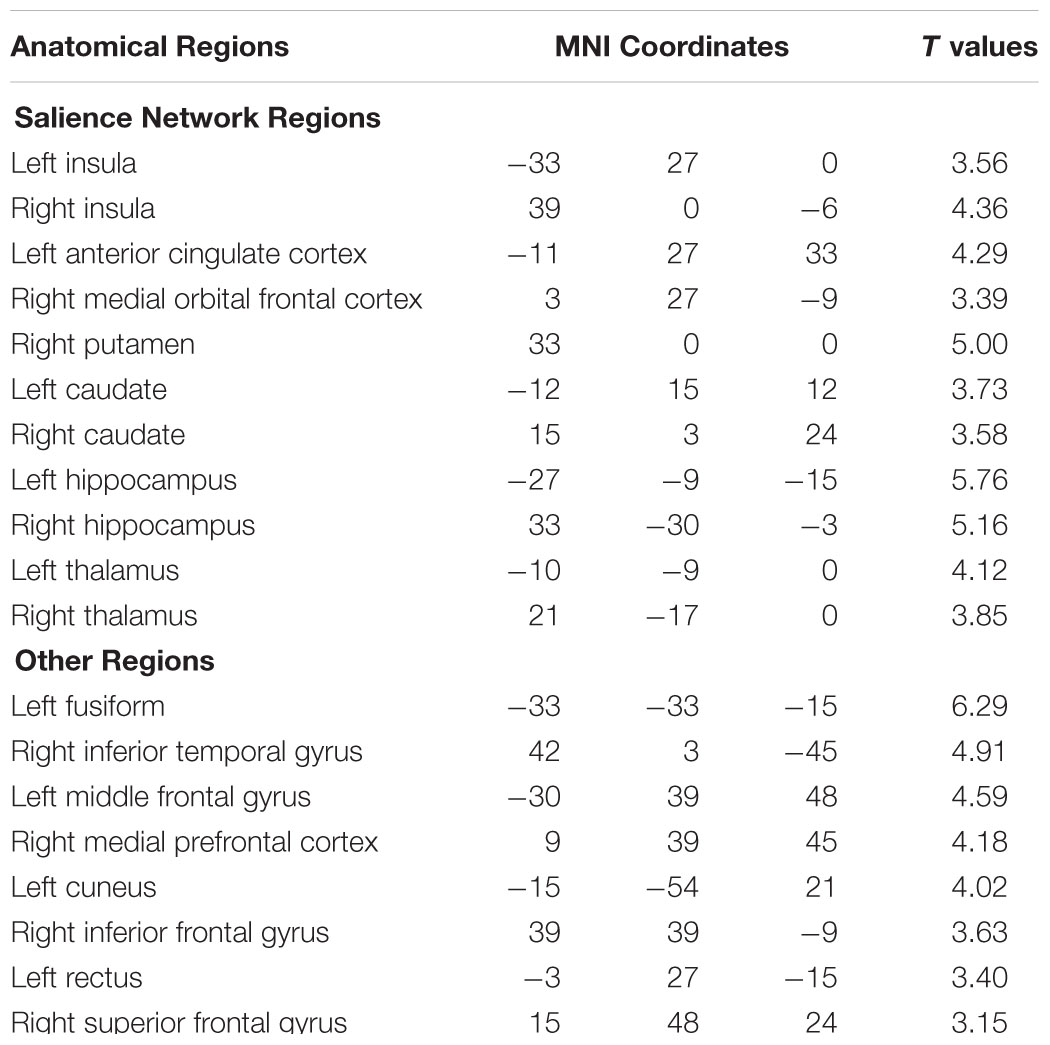
TABLE 2. Brain regions whose BOLD signals are significantly positively correlated with EEG mu power (p < 0.05, FDR corrected).
In additional analysis, HRF-convolved beta (18 to 30 Hz) power time series and HRF-convolved delta (1 to 4 Hz) power time series were similarly estimated from the same 22 components, and correlated with the BOLD. As shown in Figure 5; Table 3, beta power was negatively correlated with BOLD from SMA, M1, FEF, IPS, and other motor and attention control regions. No areas were positively correlated with beta power under p < 0.05, FDR. Delta (1∼4 Hz) power was not correlated with any brain regions under p < 0.05, FDR.
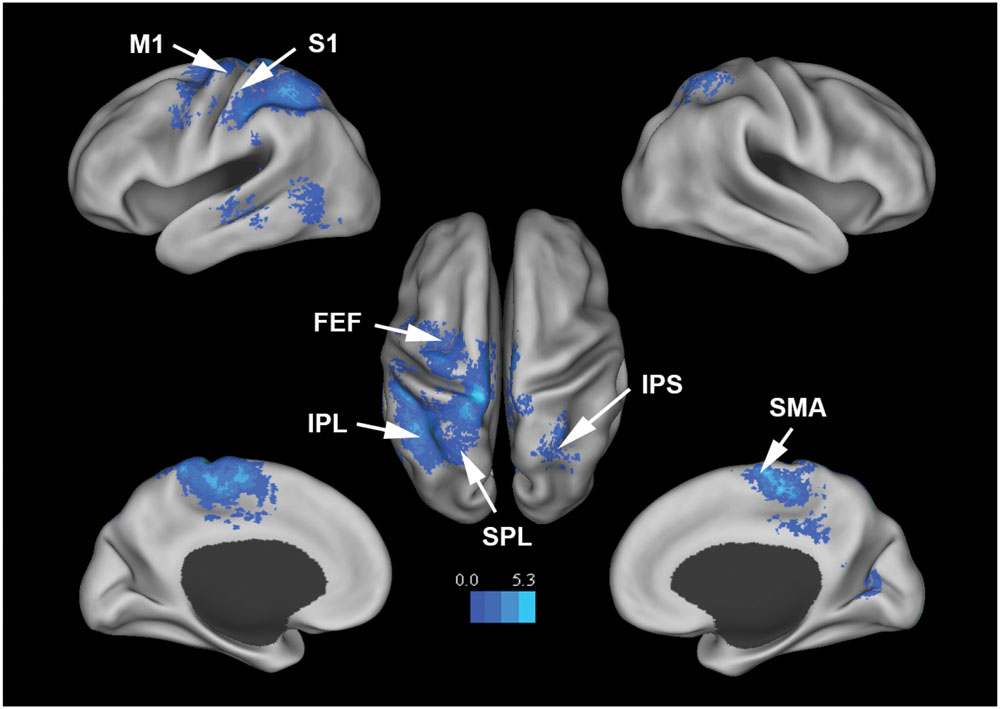
FIGURE 5. Brain regions whose BOLD signals are negatively correlated with EEG beta power from the 22 mu components (p < 0.05, FDR corrected). T-values were color-coded.
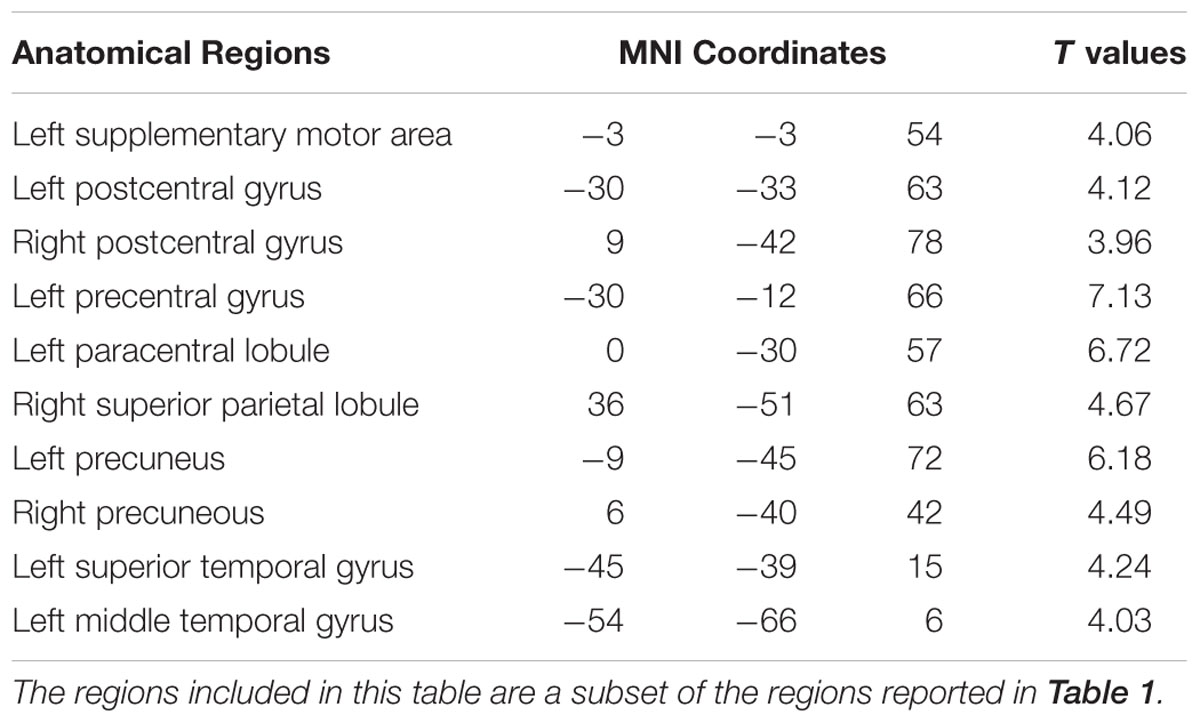
TABLE 3. Brain regions (in AAL nomenclature) whose BOLD signals are negatively correlated with EEG beta power (p < 0.05, FDR corrected).
Discussion
Event-related modulation of the mu rhythm has been variously interpreted as reflecting the activation of the motor system, the attention control system, or the mirror neuron system (McFarland et al., 2000; Oberman et al., 2005; Pineda and Hecht, 2009; Anderson and Ding, 2011). We examined the physiological foundation of such interpretations by recording simultaneous EEG-fMRI during resting-state. Correlating mu power fluctuations with BOLD, our results showed that the mu rhythm was negatively correlated with BOLD in (1) SMA and pericentral cortex of the sensorimotor system, (2) FEF, IPS, and SPL of the attention control system, (3) STG, TPJ and TP of theory of mind related regions, as well as (4) IFG and IPL of the putative mirror neuron system. In addition, mu power was also found to be positively correlated with BOLD in ACC, orbital frontal cortex, insula, thalamus, and putamen, areas of the salience network (Murta et al., 2015).
Mu Rhythm and Motor Control
Observation of event-related desynchronization (ERD) of mu with motor preparation and execution dates back to the 1950s (Chatrian et al., 1959). Pfurtscheller and Neuper (1997) later reported that motor imagery could also lead to the ERD or suppression of mu rhythm. Recent neural stimulation studies provide additional physiological insight into mu modulation. After anodal transcranial direct current stimulation (tDCS) of the primary motor cortex, mu ERD was found to be significantly enhanced during motor imagery, whereas cathodal stimulation of the same area reduced mu ERD (Matsumoto et al., 2010), suggesting that the power of mu is inversely related to the excitability of the sensorimotor cortex. These findings are in accord with our result that BOLD in sensorimotor cortex and higher order motor control areas such as SMA is negatively correlated with mu power.
Mu Rhythm and Attention Control
Mu rhythm is reported to be modulated by spatial somatosensory attention in recent studies (Jones et al., 2010; Anderson and Ding, 2011; Haegens et al., 2011). Specifically, mu power is decreased with increased attention, signifying increased excitability of the somatosensory cortex to enhance the processing of attended information. Our finding that mu power is negatively correlated with BOLD from attention control areas including SPL, IPS, and FEF is consistent with this observation. In addition, given the prominent role played by SPL, IPS, and FEF in visual attention control, our result lends support to the proposal that there exists a “supramodal” attention control network, encompassing frontoparietal regions SPL, IPS, and FEF, that mediates goal-directed attention in multiple sensory modalities (Macaluso and Driver, 2001; Eimer and Van Velzen, 2002).
Mu Rhythm and the Mirror Neuron System
Mirror neurons are a class of neurons that modulate their activity both when an individual executes a specific motor act and when they observe the same or similar act performed by another individual (Kilner and Lemon, 2013). Mirror neurons are thought to play an important role in transforming sensory information into motor acts (Rizzolatti and Fogassi, 2014). Intriguingly, observing actions can also induce the suppression of mu, leading to the notion that mu suppression could also reflect the activation of the mirror neuron system (Pineda, 2005; Oberman et al., 2005). This notion has found clinical applications in the study of the autism spectrum disorder (Oberman et al., 2005). While the exact locations of the mirror neuron system in humans are debated (Le Bel et al., 2009), regions such as premotor cortex, IPL, pMTG and even somatosensory cortex are hypothesized to be the components of the mirror neuron system in humans (Gazzola et al., 2006; Pineda, 2008). Our finding that BOLD from these areas is negatively correlated with mu power supports the notion that mu rhythm can index the activity of the mirror neuron system.
Mu Rhythm and Theory of Mind
Comprehending the mental state of others through expressed experience and behavior is an area of social cognition called theory of mind. Theory of mind may engage the mirror neuron system as well as other processes (Frith, 2001; Uddin et al., 2007; Pineda and Hecht, 2009). Functional imaging studies have found theory of mind related activities in TP, TPJ, and STS (Gallagher and Frith, 2003; Saxe and Kanwisher, 2003). Our data showing that the BOLD activity in these regions is negatively correlated with mu power suggests for the first time that theory of mind related regions are associated with mu rhythm. Furthermore, the middle cingulate cortex (MCC), known to play a role in mentalizing (Chiu et al., 2008; Lombardo et al., 2010; Lombardo and Baron-Cohen, 2011), is one of the regions strongly negatively correlated with mu rhythm in our data.
Mu Rhythm and the Salience Network
Blood-oxygen-level-dependent from areas of the salience network including ACC, orbital frontal cortex, insula, putamen, and thalamus is positively correlated with mu power. It has been proposed that the salience network serves to detect salient events, both external and internal (Palaniyappan and Liddle, 2012), and facilitate access to attention, working memory and motor resources (Menon and Uddin, 2010). Our results appear to suggest that during initial stages of salience detection and perceptual decision-making, when the salience network is activated (Lamichhane and Dhamala, 2015), the motor system is immobilized. Recent behavioral and stimulation studies have identified a freezing-type of response when human subjects are exposed to salient input such as sexually explicit stimuli (Mouras et al., 2015), emotionally engaging pictures (Azevedo et al., 2005), or even fearful body language (Borgomaneri et al., 2015). Using TMS, Borgomaneri et al. (2015) found an early reduction of excitability in the motor system when subjects were exposed to fearful body language. More directly, in a resting-state fMRI study, anterior insula, a core component of the salience network, is found to be negatively correlated with the somatosensory cortex (Cauda et al., 2011), suggesting that BOLD from the salience network may be positively correlated with mu power. Although a direct link between the salience network activation and mu rhythm has not been suggested before, past work demonstrates the plausibility of such a link.
Mu Rhythm and Thalamocortical Activity
It is a long-held notion that brain oscillations involve recurrent thalamocortical activity (Steriade et al., 1990; Llinás et al., 2005). While the cortex provides feedback to the thalamus through corticothalamic projections to modulate thalamic responses, or to synchronize oscillations on a large scale (Golshani et al., 2001), the thalamus often initiates its rhythmic activity before, and terminates after, the cortex, with the reverse pattern never occurring (Bouyer et al., 1982). In addition, thalamic mu oscillatory activity was found to lead cortical mu activity by several hundred milliseconds (Buzsaki, 1991), whereas cortical mu activity was not observed in the absence of thalamic mu activity (Semba et al., 1980). Our result that the activity of the thalamus is positively coupled with mu power agrees with the notion that sensorimotor EEG rhythm has an origin in the thalamus (Andersen and Andersson, 1968). Examining the temporal relation between the cortex and the thalamus within mu rhythm range, however, is beyond the temporal resolution of BOLD.
Comparison with Visual Alpha Rhythm
Alpha-BOLD coupling has been extensively studied using the simultaneous EEG-fMRI method (Goldman et al., 2002; Gonçalves et al., 2006; Mo et al., 2013). One feature common to the alpha-BOLD correlation map and the mu-BOLD correlation map is that both contain the areas in dorsal attention network (DAN) such as FEF and IPS. The fact that BOLD from these regions is negatively correlated with both alpha and mu suggests the importance of alpha and mu as sensory indicators of attentional influences as well as provides support to the supramodal control of attention theory. Another common feature is that both mu and alpha are positively correlated with the thalamic BOLD signal (Goldman et al., 2002; Martínez-Montes et al., 2004; de Munck et al., 2007; Liu et al., 2012). This is in agreement with the idea that the thalamus plays a central role in the generation and modulation of cortical rhythms (da Silva et al., 1973). One obvious difference between the two maps is that the alpha-BOLD correlation map is associated with visual cortex whereas the mu-BOLD correlation map is associated with sensorimotor cortex. In addition, mu appears to be more involved in social cognition and perception by the virtue of its negative coupling with the mirror neuron system and theory of mind areas; alpha is not linked to these systems. The difference also exists in the positive correlations as alpha is positively correlated with the default mode network (Mo et al., 2013) whereas mu is shown here to be positively correlated with the salience network.
Methodological Considerations
First, the foregoing demonstrates that visual alpha and sensorimotor mu are different neural constructs. The small correlation of their temporal fluctuations is consistent with this idea (R2= 0.037 ± 0.001). These suggest that deriving a single 10 Hz power from the entire brain is not advisable because doing so will mix the sources that generate and modulate the two different brain rhythms. Second, mu estimated on the scalp is likely to be contaminated by visual alpha, and this could be the reason why previous resting-state EEG-fMRI studies did not find any difference in EEG-BOLD correlation maps between 10 Hz EEG activity derived from occipital channels (O1/O2) and from central-parietal channels (C3/C4) (Laufs et al., 2003). Subsequent studies using scalp-estimated-mu found coupling between mu and sensorimotor activity but not between mu and activities from other higher order cognitive brain regions (Ritter et al., 2009; Braadbaart et al., 2013). We overcame this problem here by applying ICA to isolate the mu components. Third, it has been demonstrated that motion artifacts could impact task EEG data even after stringent cleaning (Jansen et al., 2012). Although resting state recording generally contains less motion artifacts than task state recording, we nevertheless tested whether our findings were significantly impacted by such artifacts. Beta-band and delta-band power were derived from the mu components and correlated with BOLD. Beta-BOLD and mu-BOLD negative correlation maps both contained motor control areas and attention control areas, as expected (McFarland et al., 2000; de Munck et al., 2009; Meirovitch et al., 2015), but the delta-BOLD correlations were not significant, and there is no significant positive beta-BOLD correlations. These analyses suggest that the reported findings on mu-BOLD relationships are unlikely to be dominated by a global factor such as motion. Fourth, classification of brain regions into different functional brain systems (Tables 1 and 2) can only be considered approximate. Some regions are known to have multiple functions. For example, TPJ is a theory of mind region, but it is also part of the ventral attention network.
Comparison with Resting-state Networks
It is instructive to compare regions in Tables 1 and 2 with frequently reported resting-state networks. For example, the coordinates of left SPL, right SPL, and left superior frontal gyrus, which were reported as attention control regions in Table 1, are contained within the DAN (Duan et al., 2012; Lee et al., 2012), whereas the coordinates of left insula, right insula, and left anterior cingulate, which were reported as salience network regions in Table 2, are contained within the salience network (van den Heuvel et al., 2008; Orliac et al., 2013). This observation suggests an alternative method to uncover the brain networks underlying the generation and modulation of rhythmic brain activity. In future studies one may attempt to first use ICA to identify resting-state networks and then correlate the rhythmic brain activity with BOLD from these networks to assess their relationship.
Author Contributions
SY analyzed the data, interpreted the result, and wrote the paper with MD, YL collected the data and made very useful suggestions to the project. MD designed the study, developed the methodology, and offered interpretation to the results.
Conflict of Interest Statement
The authors declare that the research was conducted in the absence of any commercial or financial relationships that could be construed as a potential conflict of interest.
Acknowledgments
This work was supported by NIH grant MH097320 and NSF grant BCS-1439188. We thank Andreas Keil for useful discussions.
Footnotes
References
Allen, P. J., Polizzi, G., Krakow, K., Fish, D. R., and Lemieux, L. (1998). Identification of EEG events in the MR scanner: the problem of pulse artifact and a method for its subtraction. Neuroimage 8, 229–239. doi: 10.1006/nimg.1998.0361
Andersen, P., and Andersson, S. A. (1968). Physiological Basis of the Alpha Rhythm. New York, NY: Appleton-Century-Crofts.
Anderson, K. L., and Ding, M. (2011). Attentional modulation of the somatosensory mu rhythm. Neuroscience 180, 165–180. doi: 10.1016/j.neuroscience.2011.02.004
Azevedo, T. M., Volchan, E., Imbiriba, L. A., Rodrigues, E. C., Oliveira, J. M., Oliveira, L. F., et al. (2005). A freezing-like posture to pictures of mutilation. Psychophysiology 42, 255–260. doi: 10.1111/j.1469-8986.2005.00287.x
Bartels, A., and Zeki, S. (2004). The neural correlates of maternal and romantic love. Neuroimage 21, 1155–1166. doi: 10.1016/j.neuroimage.2003.11.003
Belouchrani, A., Abed-Meraim, K., Cardoso, J. F., and Moulines, E. (1997). A blind source separation technique using second-order statistics. IEEE Trans. Signal Process. 45, 434–444. doi: 10.1109/78.554307
Benbadis, S. R. (2015). “Medscape,” in Normal Awake EEG, ed. H. L. Lutsep (New York, NY: Medscape). Available at: http://emedicine.medscape.com/article/1140143-overview#a2
Borgomaneri, S., Vitale, F., Gazzola, V., and Avenanti, A. (2015). Seeing fearful body language rapidly freezes the observer’s motor cortex. Cortex 65, 232–245. doi: 10.1016/j.cortex.2015.01.014
Bouyer, J. J., Rougeul, A., and Buser, P. (1982). Somatosensory rhythms in the awake cat: a single unit exploration of their thalamic concomitant in nucleus ventralis posterior and vicinity. Arch. Ital. Biol. 120, 95–110.
Braadbaart, L., Williams, J. H., and Waiter, G. D. (2013). Do mirror neuron areas mediate mu rhythm suppression during imitation and action observation? Int. J. Psychophysiol. 89, 99–105. doi: 10.1016/j.ijpsycho.2013.05.019
Buccino, G., Binkofski, F., Fink, G. R., Fadiga, L., Fogassi, L., Gallese, V., et al. (2001). Action observation activates premotor and parietal areas in a somatotopic manner: an fMRI study. Eur. J. Neurosci. 13, 400–404. doi: 10.1046/j.1460-9568.2001.01385.x
Buzsaki, G. (1991). The thalamic clock: emergent network properties. Neuroscience 41, 351–364. doi: 10.1016/0306-4522(91)90332-I
Capotosto, P., Babiloni, C., Romani, G. L., and Corbetta, M. (2009). Frontoparietal cortex controls spatial attention through modulation of anticipatory alpha rhythms. J. Neurosci. 29, 5863–5872. doi: 10.1523/JNEUROSCI.0539-09.2009
Cauda, F., D’Agata, F., Sacco, K., Duca, S., Geminiani, G., and Vercelli, A. (2011). Functional connectivity of the insula in the resting brain. Neuroimage 55, 8–23. doi: 10.1016/j.neuroimage.2010.11.049
Chatrian, G. E., Petersen, M. C., and Lazarte, J. A. (1959). The blocking of the rolandic wicket rhythm and some central changes related to movement. Electroencephalogr. Clin. Neurophysiol. 11, 497–510. doi: 10.1016/0013-4694(59)90048-3
Chiu, P. H., Kayali, M. A., Kishida, K. T., Tomlin, D., Klinger, L. G., Klinger, M. R., et al. (2008). Self responses along cingulate cortex reveal quantitative neural phenotype for high-functioning autism. Neuron 57, 463–473. doi: 10.1016/j.neuron.2007.12.020
Cochin, S., Barthelemy, C., Roux, S., and Martineau, J. (1999). Observation and execution of movement: similarities demonstrated by quantified electroencephalography. Eur. J. Neurosci. 11, 1839–1842. doi: 10.1046/j.1460-9568.1999.00598.x
Cohen-Seat, G., Gastaut, H., Faure, J., and Heuyer, G. (1954). Etudes expérimentales de l’activité nerveuse pendant la projection cinématographique. Rev. Int. Filmol. 5, 7–64.
da Silva, F. H., van Lierop, T. H., Schrijer, C. F., and van Leeuwen, W. S. (1973). Organization of thalamic and cortical alpha rhythms: spectra and coherences. Electroencephalogr. Clin. Neurophysiol. 35, 627–639. doi: 10.1016/0013-4694(73)90216-2
de Munck, J. C., Gonçalves, S. I., Huijboom, L., Kuijer, J. P., Pouwels, P. J., Heethaar, R. M., et al. (2007). The hemodynamic response of the alpha rhythm: an EEG/fMRI study. Neuroimage 35, 1142–1151. doi: 10.1016/j.neuroimage.2007.01.022
de Munck, J. C., Gonçalves, S. I., Mammoliti, R., Heethaar, R. M., and Lopes da Silva, F. H. (2009). Interactions between different EEG frequency bands and their effect on alpha-fMRI correlations. Neuroimage 47, 69–76. doi: 10.1016/j.neuroimage.2009.04.029
Delorme, A., and Makeig, S. (2004). EEGLAB: an open source toolbox for analysis of single-trial EEG dynamics including independent component analysis. J. Neurosci. Methods 134, 9–21. doi: 10.1016/j.jneumeth.2003.10.009
Desjardins, A. E., Kiehl, K. A., and Liddle, P. F. (2001). Removal of confounding effects of global signal in functional MRI analyses. Neuroimage 13, 751–758. doi: 10.1006/nimg.2000.0719
Duan, X., Liao, W., Liang, D., Qiu, L., Gao, Q., Liu, C., et al. (2012). Large-scale brain networks in board game experts: insights from a domain-related task and task-free resting state. PLoS ONE 7:e32532. doi: 10.1371/journal.pone.0032532
Eimer, M., and Van Velzen, J. (2002). Crossmodal links in spatial attention are mediated by supramodal control processes: evidence from event-related potentials. Psychophysiology 39, 437–449. doi: 10.1111/1469-8986.3940437
Eisenberger, N. I., Lieberman, M. D., and Williams, K. D. (2003). Does rejection hurt? An FMRI study of social exclusion. Science 302, 290–292. doi: 10.1126/science.1089134
Fogassi, L., Ferrari, P. F., Gesierich, B., Rozzi, S., Chersi, F., and Rizzolatti, G. (2005). Parietal lobe: from action organization to intention understanding. Science 308, 662–667. doi: 10.1126/science.1106138
Fox, M. D., Snyder, A. Z., Vincent, J. L., Corbetta, M., Van Essen, D. C., and Raichle, M. E. (2005). The human brain is intrinsically organized into dynamic, anticorrelated functional networks. Proc. Natl. Acad. Sci. U.S.A. 102, 9673–9678. doi: 10.1073/pnas.0504136102
Friston, K. J., Holmes, A. P., Poline, J. B., Grasby, P. J., Williams, S. C., Frackowiak, R. S., et al. (1995). Analysis of fMRI time-series revisited. Neuroimage 2, 45–53. doi: 10.1006/nimg.1995.1007
Frith, U. (2001). Mind blindness and the brain in autism. Neuron 32, 969–979. doi: 10.1016/S0896-6273(01)00552-9
Gallagher, H. L., and Frith, C. D. (2003). Functional imaging of ‘theory of mind’. Trends Cogn. Sci. 7, 77–83. doi: 10.1016/S1364-6613(02)00025-6
Gazzola, V., Aziz-Zadeh, L., and Keysers, C. (2006). Empathy and the somatotopic auditory mirror system in humans. Curr. Biol. 16, 1824–1829. doi: 10.1016/j.cub.2006.07.072
Gazzola, V., Rizzolatti, G., Wicker, B., and Keysers, C. (2007). The anthropomorphic brain: the mirror neuron system responds to human and robotic actions. Neuroimage 35, 1674–1684. doi: 10.1016/j.neuroimage.2007.02.003
Goldman, R. I., Stern, J. M., Engel, J., and Cohen, M. S. (2002). Simultaneous EEG and fMRI of the alpha rhythm. Neuroreport 13, 2487–2492. doi: 10.1097/01.wnr.0000047685.08940.d0
Golshani, P., Liu, X.-B., and Jones, E. G. (2001). Differences in quantal amplitude reflect GluR4- subunit number at corticothalamic synapses on two populations of thalamic neurons. Proc. Natl. Acad. Sci. U.S.A. 98, 4172–4177. doi: 10.1073/pnas.061013698
Gonçalves, S. I., de Munck, J. C., Pouwels, P. J., Schoonhoven, R., Kuijer, J. P., Maurits, N. M., et al. (2006). Correlating the alpha rhythm to BOLD using simultaneous EEG/fMRI: inter-subject variability. Neuroimage 30, 203–213. doi: 10.1016/j.neuroimage.2005.09.062
Haegens, S., Händel, B. F., and Jensen, O. (2011). Top-down controlled alpha band activity in somatosensory areas determines behavioral performance in a discrimination task. J. Neurosci. 31, 5197–5204. doi: 10.1523/JNEUROSCI.5199-10.2011
Holroyd, C. B., Nieuwenhuis, S., Yeung, N., Nystrom, L., Mars, R. B., Coles, M. G., et al. (2004). Dorsal anterior cingulate cortex shows fMRI response to internal and external error signals. Nat. Neurosci. 7, 497–498. doi: 10.1038/nn1238
Jansen, M., White, T. P., Mullinger, K. J., Liddle, E. B., Gowland, P. A., Francis, S. T., et al. (2012). Motion-related artefacts in EEG predict neuronally plausible patterns of activation in fMRI data. Neuroimage 59, 261–270. doi: 10.1016/j.neuroimage.2011.06.094
Jones, S. R., Kerr, C. E., Wan, Q., Pritchett, D. L., Hämäläinen, M., and Moore, C. I. (2010). Cued spatial attention drives functionally relevant modulation of the mu rhythm in primary somatosensory cortex. J. Neurosci. 30, 13760–13765. doi: 10.1523/JNEUROSCI.2969-10.2010
Keysers, C., and Gazzola, V. (2009). Expanding the mirror: vicarious activity for actions, emotions, and sensations. Curr. Opin. Neurobiol. 19, 666–671. doi: 10.1016/j.conb.2009.10.006
Kilner, J. M., and Lemon, R. N. (2013). What we know currently about mirror neurons. Curr. Biol. 23, R1057–R1062. doi: 10.1016/j.cub.2013.10.051
Kilner, J. M., Neal, A., Weiskopf, N., Friston, K. J., and Frith, C. D. (2009). Evidence of mirror neurons in human inferior frontal gyrus. J. Neurosci. 29, 10153–10159. doi: 10.1523/JNEUROSCI.2668-09.2009
Lamichhane, B., and Dhamala, M. (2015). The salience network and its functional architecture in a perceptual decision: an effective connectivity study. Brain Connect. 5, 362–370. doi: 10.1089/brain.2014.0282
Laufs, H., Kleinschmidt, A., Beyerle, A., Eger, E., Salek-Haddadi, A., Preibisch, C., et al. (2003). EEG-correlated fMRI of human alpha activity. Neuroimage 19, 1463–1476. doi: 10.1016/S1053-8119(03)00286-6
Le Bel, R. M., Pineda, J. A., and Sharma, A. (2009). Motor-auditory-visual integration: the role of the human mirror neuron system in communication and communication disorders. J. Commun. Disord. 42, 299–304. doi: 10.1016/j.jcomdis.2009.03.011
Lee, M. H., Hacker, C. D., Snyder, A. Z., Corbetta, M., Zhang, D., Leuthardt, E. C., et al. (2012). Clustering of resting state networks. PLoS ONE 7:e40370. doi: 10.1371/journal.pone.0040370
Liu, Z., de Zwart, J. A., Yao, B., van Gelderen, P., Kuo, L. W., and Duyn, J. H. (2012). Finding thalamic BOLD correlates to posterior alpha EEG. Neuroimage 63, 1060–1069. doi: 10.1016/j.neuroimage.2012.08.025
Llinás, R., Urbano, F. J., Leznik, E., Ramírez, R. R., and van Marle, H. J. (2005). Rhythmic and dysrhythmic thalamocortical dynamics: GABA systems and the edge effect. Trends Neurosci. 28, 325–333. doi: 10.1016/j.tins.2005.04.006
Lombardo, M. V., and Baron-Cohen, S. (2011). The role of the self in mindblindness in autism. Conscious. Cogn. 20, 130–140. doi: 10.1016/j.concog.2010.09.006
Lombardo, M. V., Chakrabarti, B., Bullmore, E. T., Sadek, S. A., Pasco, G., Wheelwright, S. J., et al. (2010). Atypical neural self-representation in autism. Brain 133(Pt 2), 611–624. doi: 10.1093/brain/awp306
Macaluso, E., and Driver, J. (2001). Spatial attention and crossmodal interactions between vision and touch. Neuropsychologia 39, 1304–1316. doi: 10.1016/S0028-3932(01)00119-1
Mantini, D., Perrucci, M. G., Del Gratta, C., Romani, G. L., and Corbetta, M. (2007). Electrophysiological signatures of resting state networks in the human brain. Proc. Natl. Acad. Sci. U.S.A. 104, 13170–13175. doi: 10.1073/pnas.0700668104
Mar, R. A. (2011). The neural bases of social cognition and story comprehension. Annu. Rev. Psychol. 62, 103–134. doi: 10.1146/annurev-psych-120709-145406
Martínez-Montes, E., Valdés-Sosa, P. A., Miwakeichi, F., Goldman, R. I., and Cohen, M. S. (2004). Concurrent EEG/fMRI analysis by multiway partial least squares. Neuroimage 22, 1023–1034. doi: 10.1016/j.neuroimage.2004.03.038
Matsumoto, J., Fujiwara, T., Takahashi, O., Liu, M., Kimura, A., and Ushiba, J. (2010). Modulation of mu rhythm desynchronization during motor imagery by transcranial direct current stimulation. J Neuroeng. Rehabil. 7, 27. doi: 10.1186/1743-0003-7-27
McFarland, D. J., Miner, L. A., Vaughan, T. M., and Wolpaw, J. R. (2000). Mu and beta rhythm topographies during motor imagery and actual movements. Brain Topogr. 12, 177–186. doi: 10.1023/A:1023437823106
Meirovitch, Y., Harris, H., Dayan, E., Arieli, A., and Flash, T. (2015). Alpha and beta band event-related desynchronization reflects kinematic regularities. J. Neurosci. 35, 1627–1637. doi: 10.1523/JNEUROSCI.5371-13.2015
Menon, V., and Uddin, L. Q. (2010). Saliency, switching, attention and control: a network model of insula function. Brain Struct. Funct. 214, 655–667. doi: 10.1007/s00429-010-0262-0
Mitra, P. P., and Pesaran, B. (1999). Analysis of dynamic brain imaging data. Biophys. J. 76, 691–708. doi: 10.1016/S0006-3495(99)77236-X
Mizuhara, H. (2012). Cortical dynamics of human scalp EEG origins in a visually guided motor execution. Neuroimage 62, 1884–1895. doi: 10.1016/j.neuroimage.2012.05.072
Mo, J., Liu, Y., Huang, H., and Ding, M. (2013). Coupling between visual alpha oscillations and default mode activity. Neuroimage 68, 112–118. doi: 10.1016/j.neuroimage.2012.11.058
Moore, A., Gorodnitsky, I., and Pineda, J. (2012). EEG mu component responses to viewing emotional faces. Behav. Brain Res. 226, 309–316. doi: 10.1016/j.bbr.2011.07.048
Mouras, H., Lelard, T., Ahmaidi, S., Godefroy, O., and Krystkowiak, P. (2015). Freezing behavior as a response to sexual visual stimuli as demonstrated by posturography. PLoS ONE 10:e0127097. doi: 10.1371/journal.pone.0127097
Murta, T., Leite, M., Carmichael, D. W., Figueiredo, P., and Lemieux, L. (2015). Electrophysiological correlates of the BOLD signal for EEG-informed fMRI. Hum. Brain Mapp. 36, 391–414. doi: 10.1002/hbm.22623
Nunez, P. L., Srinivasan, R., Westdorp, A. F., Wijesinghe, R. S., Tucker, D. M., Silberstein, R. B., et al. (1997). EEG coherency. I: Statistics, reference electrode, volume conduction, Laplacians, cortical imaging, and interpretation at multiple scales. Electroencephalogr. Clin. Neurophysiol. 103, 499–515.
Oberman, L. M., Hubbard, E. M., McCleery, J. P., Altschuler, E. L., Ramachandran, V. S., and Pineda, J. A. (2005). EEG evidence for mirror neuron dysfunction in autism spectrum disorders. Brain Res. Cogn. Brain Res. 24, 190–198. doi: 10.1016/j.cogbrainres.2005.01.014
Orliac, F., Naveau, M., Joliot, M., Delcroix, N., Razafimandimby, A., Brazo, P., et al. (2013). Links among resting-state default-mode network, salience network, and symptomatology in schizophrenia. Schizophr. Res. 148, 74–80. doi: 10.1016/j.schres.2013.05.007
Palaniyappan, L., and Liddle, P. F. (2012). Does the salience network play a cardinal role in psychosis? An emerging hypothesis of insular dysfunction. J. Psychiatry Neurosci. 37, 17–27. doi: 10.1503/jpn.100176
Pfurtscheller, G., and Neuper, C. (1997). Motor imagery activates primary sensorimotor area in humans. Neurosci. Lett. 239, 65–68. doi: 10.1016/S0304-3940(97)00889-6
Pineda, J. A. (2005). The functional significance of mu rhythms: translating “seeing” and “hearing” into “doing”. Brain Res. Brain Res. Rev. 50, 57–68. doi: 10.1016/j.brainresrev.2005.04.005
Pineda, J. A. (2008). Sensorimotor cortex as a critical component of an ‘extended’ mirror neuron system: does it solve the development, correspondence, and control problems in mirroring? Behav. Brain Funct. 4, 47. doi: 10.1186/1744-9081-4-47
Pineda, J. A., and Hecht, E. (2009). Mirroring and mu rhythm involvement in social cognition: are there dissociable subcomponents of theory of mind? Biol. Psychol. 80, 306–314. doi: 10.1016/j.biopsycho.2008.11.003
Rajagovindan, R., and Ding, M. (2011). From prestimulus alpha oscillation to visual-evoked response: an inverted-U function and its attentional modulation. J. Cogn. Neurosci. 23, 1379–1394. doi: 10.1162/jocn.2010.21478
Ritter, P., Moosmann, M., and Villringer, A. (2009). Rolandic alpha and beta EEG rhythms’ strengths are inversely related to fMRI-BOLD signal in primary somatosensory and motor cortex. Hum. Brain Mapp. 30, 1168–1187. doi: 10.1002/hbm.20585
Rizzolatti, G., Fadiga, L., Gallese, V., and Fogassi, L. (1996). Premotor cortex and the recognition of motor actions. Brain Res. Cogn. Brain Res. 3, 131–141. doi: 10.1016/0926-6410(95)00038-0
Rizzolatti, G., and Fogassi, L. (2014). The mirror mechanism: recent findings and perspectives. Philos. Trans. R. Soc. Lond. B Biol. Sci. 369, 20130420. doi: 10.1098/rstb.2013.0420
Saxe, R., and Kanwisher, N. (2003). People thinking about thinking people. The role of the temporo-parietal junction in “theory of mind”. Neuroimage 19, 1835–1842.
Schulte-Rüther, M., Markowitsch, H. J., Fink, G. R., and Piefke, M. (2007). Mirror neuron and theory of mind mechanisms involved in face-to-face interactions: a functional magnetic resonance imaging approach to empathy. J. Cogn. Neurosci. 19, 1354–1372. doi: 10.1162/jocn.2007.19.8.1354
Seeley, W. W., Menon, V., Schatzberg, A. F., Keller, J., Glover, G. H., Kenna, H., et al. (2007). Dissociable intrinsic connectivity networks for salience processing and executive control. J. Neurosci. 27, 2349–2356. doi: 10.1523/JNEUROSCI.5587-06.2007
Semba, K., Szechtman, H., and Komisaruk, B. R. (1980). Synchrony among rhythmical facial tremor, neocortical ‘alpha’ waves, and thalamic non-sensory neuronal bursts in intact awake rats. Brain Res. 195, 281–298. doi: 10.1016/0006-8993(80)90065-7
Steriade, M., Gloor, P., Llinás, R. R., Lopes de Silva, F. H., and Mesulam, M. M. (1990). Report of IFCN committee on basic mechanisms. Basic mechanisms of cerebral rhythmic activities. Electroencephalogr. Clin. Neurophysiol. 76, 481–508. doi: 10.1016/0013-4694(90)90001-Z
Tang, A. C., Liu, J. Y., and Sutherland, M. T. (2005a). Recovery of correlated neuronal sources from EEG: the good and bad ways of using SOBI. Neuroimage 28, 507–519. doi: 10.1016/j.neuroimage.2005.06.062
Tang, A. C., Sutherland, M. T., and McKinney, C. J. (2005b). Validation of SOBI components from high-density EEG. Neuroimage 25, 539–553. doi: 10.1016/j.neuroimage.2004.11.027
Uddin, L. Q., Iacoboni, M., Lange, C., and Keenan, J. P. (2007). The self and social cognition: the role of cortical midline structures and mirror neurons. Trends Cogn. Sci. 11, 153–157. doi: 10.1016/j.tics.2007.01.001
van den Heuvel, M., Mandl, R., and Hulshoff Pol, H. (2008). Normalized cut group clustering of resting-state FMRI data. PLoS ONE 3:e2001. doi: 10.1371/journal.pone.0002001
Vanni, S., Revonsuo, A., and Hari, R. (1997). Modulation of the parieto-occipital alpha rhythm during object detection. J. Neurosci. 17, 7141–7147.
Keywords: simultaneous EEG-fMRI, mu rhythm, SOBI, resting-state, motor control, attention control, mirror neurons, salience network
Citation: Yin S, Liu Y and Ding M (2016) Amplitude of Sensorimotor Mu Rhythm Is Correlated with BOLD from Multiple Brain Regions: A Simultaneous EEG-fMRI Study. Front. Hum. Neurosci. 10:364. doi: 10.3389/fnhum.2016.00364
Received: 04 February 2016; Accepted: 06 July 2016;
Published: 22 July 2016.
Edited by:
Srikantan S. Nagarajan, University of California, San Francisco, USACopyright © 2016 Yin, Liu and Ding. This is an open-access article distributed under the terms of the Creative Commons Attribution License (CC BY). The use, distribution or reproduction in other forums is permitted, provided the original author(s) or licensor are credited and that the original publication in this journal is cited, in accordance with accepted academic practice. No use, distribution or reproduction is permitted which does not comply with these terms.
*Correspondence: Mingzhou Ding, mding@bme.ufl.edu