 Norelle C. Wildburger1*
 Frank Gyngard2Christelle Guillermier3,4,5
 Bruce W. Patterson6Donald Elbert7Kwasi G. Mawuenyega1Theresa Schneider1Karen Green8
 Robyn Roth9,10Robert E. Schmidt8Nigel J. Cairns1,8,11,12Tammie L. S. Benzinger11,13,14Matthew L. Steinhauser3,4,5
 Randall J. Bateman1,11,12*
- 1Department of Neurology, Washington University School of Medicine, St. Louis, MO, United States
- 2Department of Physics, Washington University in St. Louis, St. Louis, MO, United States
- 3NanoImaging Center, Division of Genetics, Brigham and Women’s Hospital, Cambridge, MA, United States
- 4Brigham and Women’s Hospital, Boston, MA, United States
- 5Harvard Medical School, Boston, MA, United States
- 6Department of Medicine, Washington University School of Medicine, St. Louis, MO, United States
- 7Department of Neurology, The University of Texas at Austin Dell Medical School, Austin, TX, United States
- 8Department of Pathology and Immunology, Washington University School of Medicine, St. Louis, MO, United States
- 9Department of Cell Biology and Physiology, Washington University School of Medicine, St. Louis, MO, United States
- 10Washington University Center for Cellular Imaging, Washington University School of Medicine, St. Louis, MO, United States
- 11Knight Alzheimer’s Disease Research Center, Department of Neurology, Washington University School of Medicine, St Louis, MO, United States
- 12Hope Center for Neurological Disorders, Department of Neurology, Washington University School of Medicine, St. Louis, MO, United States
- 13Department of Radiology, Washington University School of Medicine, St. Louis, MO, United States
- 14Department of Neurological Surgery, Washington University School of Medicine, St. Louis, MO, United States
Alzheimer’s disease (AD) is a neurodegenerative disorder with clinical manifestations of progressive memory decline and loss of executive function and language. AD affects an estimated 5.3 million Americans alone and is the most common form of age-related dementia with a rapidly growing prevalence among the aging population—those 65 years of age or older. AD is characterized by accumulation of aggregated amyloid-beta (Aβ) in the brain, which leads to one of the pathological hallmarks of AD—Aβ plaques. As a result, Aβ plaques have been extensively studied after being first described over a century ago. Advances in brain imaging and quantitative measures of Aβ in biological fluids have yielded insight into the time course of plaque development decades before and after AD symptom onset. However, despite the fundamental role of Aβ plaques in AD, in vivo measures of individual plaque growth, growth distribution, and dynamics are still lacking. To address this question, we combined stable isotope labeling kinetics (SILK) and nanoscale secondary ion mass spectrometry (NanoSIMS) imaging in an approach termed SILK–SIMS to resolve plaque dynamics in three human AD brains. In human AD brain, plaques exhibit incorporation of a stable isotope tracer. Tracer enrichment was highly variable between plaques and the spatial distribution asymmetric with both quiescent and active nanometer sub-regions of tracer incorporation. These data reveal that Aβ plaques are dynamic structures with deposition rates over days indicating a highly active process. Here, we report the first, direct quantitative measures of in vivo deposition into plaques in human AD brain. Our SILK–SIMS studies will provide invaluable information on plaque dynamics in the normal and diseased brain and offer many new avenues for investigation into pathological mechanisms of the disease, with implications for therapeutic development.
Introduction
Alzheimer’s disease (AD) is a devastating neurodegenerative disorder characterized by progressive cognitive and functional decline and is the most common form of age-related dementia (1, 2). The incidence of AD-related death and disability is rapidly growing in persons 65 years of age or older whose risk of developing the disease doubles every 5 years (3); currently, an estimated 5.3 million Americans are affected (4). Amyloid-beta (Aβ), a 38–43 amino acid peptide derived from the proteolytic cleavage of the amyloid precursor protein, is implicated as a pathogenic species in AD (5–10). Abnormal accumulation and aggregation of Aβ in the cerebral extracellular space result in one of the pathological hallmarks of AD—amyloid plaques. As a result, the onset and rate of amyloidosis has been intensively studied over the past several decades. Although older individuals may have extensive Aβ deposition without clinical signs of dementia (11–14), there is a strong association of amyloid plaques with AD dementia. Longitudinal measures of amyloid pathology have shown increases in amyloid deposition 15–20 years prior to dementia onset (15) in early onset, familial AD and predict future cognitive decline (16–20).
As amyloid pathology increases in vivo, a concomitant decline in cerebrospinal fluid (CSF) Aβ42 occurs (21). More recent studies in the production and clearance of Aβ in CSF (22) demonstrate that the clearance of Aβ42 is decreased in AD. Intriguingly, with the onset of amyloidosis, only the Aβ42 proteoform (23, 24) demonstrated faster turnover kinetics attributed to rapid deposition into plaques—for ~50% of all Aβ42 produced (22). Further, there was a positive correlation between increased Aβ42 turnover kinetics and rate of amyloidosis measured by PET (22). In plasma, the altered Aβ42 turnover kinetics and lower Aβ42/40 ratio with amyloidosis is also present albeit to a lesser extent (25). These data suggest that alterations in Aβ concentrations and kinetics are strongly associated with amyloidosis reflecting deposition of Aβ into plaques.
Longitudinal PET studies demonstrate that amyloid plaque pathology increases slowly and plateaus with the clinical presentation of dementia (15, 20, 26–29). The slow accumulation of amyloid tracer binding over decades before clinical presentation of dementia has been suggestive of stability in plaque accumulation. The plateau of amyloid tracer binding may indicate that amyloid pathology reaches dynamic equilibrium or quiescence globally at the clinical stage of dementia. Similarly, several animal model studies of plaques have demonstrated that plaques grow, typically at earlier ages (30–32), to a stable size (32–34), but that plaques may be in equilibrium with their environment if continual deposition is assumed (33).
However, despite the relevance of amyloid plaques in AD, measures of in vivo growth and distribution of human plaques are lacking due to analytical challenges and limitations. Previous human in vivo studies (22, 25, 35) relied on CSF and plasma, which are indirect measures of the brain compartment and do not directly measure plaques. PET imaging of human brain is an average measure of amyloid pathology over ~1 cm, which does not measure individual amyloid plaques, and amyloid tracers bind only a subset of aggregated Aβ (36). Interpretation of PET results is limited because amyloid binding agents measure binding sites and not necessarily the true amount of amyloid plaques. Fluorescence-based assessments using multi-photon imaging of over-expression models, which do not fully replicate the human disease (37–39), encounter limitations resulting from specificity of dyes, decreased sensitivity due to tissue autofluorescence, and the inability to distinguish new versus previously existing Aβ or other proteins found deposited into plaques (40). As individual plaque dynamics have not been directly measured in humans, we therefore sought to measure the in vivo incorporation of protein into amyloid plaques to resolve whether plaques are stable or dynamic structures in the human AD brain.
Stable isotope labeling kinetics (SILK) was developed to determine protein production and clearance by administering a stable isotope labeled precursor in vivo and sampling during and after labeling (41). The development of SILK allowed quantitation of protein turnover in humans, providing a direct readout of changes underlying pathophysiology of disease and pharmacodynamics of therapeutics (22, 24, 42). However, SILK performed from CSF or plasma does not convey localization of labeled biomolecules in tissue. Nanoscale secondary ion mass spectrometry (NanoSIMS) allows both imaging and measurement of stable isotopes at high spatial resolution (50–100 nm or <1 μm3) (43, 44). While NanoSIMS has been applied to the study of AD (45, 46), it has not been used in combination with SILK for the measurement of in vivo protein translation in cells or deposition into plaques in normal or diseased brain. Here, we coupled SILK to NanoSIMS in a method termed SILK–SIMS to directly measure and image the distribution and rate of protein deposition (a proxy for growth taking into account area) into individual plaques at the nanometer level (44, 47–49). Our aim was to measure the stability or growth of individual amyloid plaques in AD animal models and in the human brain.
Initial SILK–SIMS experiments in a mouse model of AD demonstrated in vivo detection of the stable isotope tracer 13C6-leucine in native Aβ plaques. Further, plaques incorporated more of the tracer via protein deposition compared to protein translation in the surrounding brain parenchyma, but less than neurons. In human AD brain, we found 13C enrichment in multiple diffuse and dense-core plaques in both the frontal lobe and precuneus. 13C enrichment was highly variable and asymmetric between plaques with both quiescent and active nanometer sub-regions of tracer incorporation. These data reveal that human Aβ plaques are dynamic structures and suggest that they have growth or turnover rates that can be directly quantified in AD brain. Our results provide the first, direct measures of in vivo plaque dynamics in human AD brain. We predict that SILK–SIMS will provide a precise understanding of protein deposition into amyloid plaques in human AD brain and other CNS disturbances characterized by protein aggregation.
Materials and Methods
Cell Culture
B-cell hybridoma line (produced in-house by Holtzman Lab, Washington University) was grown for 5 days in leucine-free media that was supplemented with either 12C6-leucine or 13C6-leucine at 26 mg/L and mixed at the appropriate percentage of heavy isotope-containing media with 2% FBS. Cells were harvested and spun at 1,000 rpm for 5 min at room temperature (RT). Cell pellets were resuspended in 4°C Ringers wash solution for 5 min, spun, and then fixed with 4% paraformaldehyde in 100 mM NaCl, 30 mM HEPES, 2 mM CaCl2, pH 7.2 (NaHCa) for 2 h. This was followed by three rinses of NaHCa at RT and overnight incubation at 4°C in NaHCa. Centrifugation was used throughout the following steps in order to re-concentrate the cells to a pellet. The following morning, pellets were placed into ddH2O and then infiltrated with LR White Embedding Media (Catalog #14383, EMS, Hatfield, PA) using the manufacturer’s published protocol with minor modification. Partial dehydration was accomplished by using 20% EtOH 15 min, 40% EtOH 15 min, 50% EtOH 15 min, 70% EtOH 15 min, 85% EtOH 10 min, followed by 1 h in a 2:1 LR White to 85% EtOH. Sections of LR White embedded samples were cut on a Leica UC7 Ultramicrotome using a diamond knife. 200 nm and 400 nm sections were picked up with a perfect loop, placed on top of a polished silicon (Si) wafer (Catalog #534, University Wafer Inc., South Boston, MA, USA), and let air dry on a 35°C hot plate.
Animals
All animal procedures were conducted in accordance with the animal protocol approved by the Washington University Animal Studies Committee and are consistent with the National Institutes of Health (NIH) guidelines for the care and use of animals. Two male double transgenic mice expressing chimeric mouse/human amyloid precursor protein (Mo/HuAPP695swe) and a mutant human presenilin 1 (PS1-dE9) both directed to CNS neurons (stock 34832-JAX) (50) were kindly provided by Dr. Timothy Miller. Animals were given leucine-free chow (Catalog #1831936, Test Diet, St. Louis, MO, USA) with 5 mg/mL 12C6-leucine added to 2% sucrose-containing drinking water to control leucine intake for a one-week acclimation period. After the 1-week acclimation period, animals were given 5 mg/mL 13C6- or 12C6-leucine orally via 2% sucrose drinking water, averaging 36 mL of H2O/week. Animals were 4 months old at the time of labeling (pre-plaque pathology) and 6.5 months old at the end of labeling (onset of plaque pathology). Following the end of the labeling paradigm, animals were anesthetized with 65 mg/kg pentobarbital sodium and sacrificed by decapitation. Brains were removed and placed in 10% neutral-buffer formalin (Catalog #15740-01, EMS, Hatfield, PA, USA). Pieces of mouse brain were washed into NaHCa and incubated overnight at 4°C. The following morning, samples were stained with 1% osmium/NaHCa for 1 h, washed four times over 1 h, and then en bloc stained with 1% uranyl acetate/H2O for 1 h in the dark. Samples were rinsed with three exchanges of water, 10 min each, and then processed for LR White embedding as described above with the addition of being gold-coated once on the Si wafer. Serial adjacent sections were placed on glass microscope slides for toluidine blue staining for light microscopy.
APP/PS1 Plasma Leucine
Mouse whole blood was spun at 1,000 × g for 10 min, and the plasma (supernatant) was removed. Plasma proteins were precipitated with ice-cold acetone followed by de-lipidation with hexane, and the aqueous fraction was dried in vacuo (51). 1:1N-Methyl-N-tert-butyldimethylsilyltrifluoroacetamide/acetonitrile was added, and samples were incubated at 70°C for 30 min. Duplicate 1 µL injections were made into an Agilent 5973 MSD mass spectrometer using a 30 µm × 0.25 mm DB-5MS column (Agilent Technologies). Electron impact ionization and selected ion monitoring were used to measure endogenous unlabeled leucine at m/z 200 (molecular ion minus C-1 as CO2-tert-butyldimethylsilyl; CO2-tBDMS), and 13C6-leucine (tracer) was measured at m/z 205 as an m + 5 ion. The tracer-to-tracee ratio (TTR) was taken as the m + 5/m + 0 peak area ratio of the biological sample minus the m + 5/m + 0 ratio of a natural abundance leucine sample. The molar fraction of labeled leucine was calculated as: MFL = TTR/(1 + TTR).
Human Tissue
Clinically and neuropathologically well-characterized human brain tissue samples were obtained from the Charles F. and Joanne Knight Alzheimer’s Disease Research Center (Knight ADRC), Washington University School of Medicine, Saint Louis, Missouri. At the time of death, written informed consent in accordance with the Declaration of Helsinki was obtained from the next-of-kin in accordance with the protocol approved by the Washington University Human Studies Committee and the General Clinical Research Center Advisory Committee. Cognitive status at expiration was determined using a validated retrospective post-mortem interview with an informant to establish the clinical dementia rating (CDR) (52). We used frozen tissue from the frontal lobe (Brodmann areas 8/9) of Pt2 with mild AD dementia (CDR 1, age at death = 88 years; post-mortem interval = 15 h; post-labeling interval (delta) = 8 days; Table 1). The right cerebral hemisphere was coronally sliced at 1 cm intervals and snap frozen by contact with pre-cooled Teflon®-coated aluminum plates, and temperature equilibrated by immersion into liquid nitrogen vapor in a cryo-vessel. Following freezing, tissues were placed in Ziploc® storage bags and stored in freezer at −80°C. Participants 2 and 3 were given the stable isotope tracer 13C6-leucine as part of previous SILK studies (22, 35). These AD participants had made previous arrangements for brain donation to Washington University.
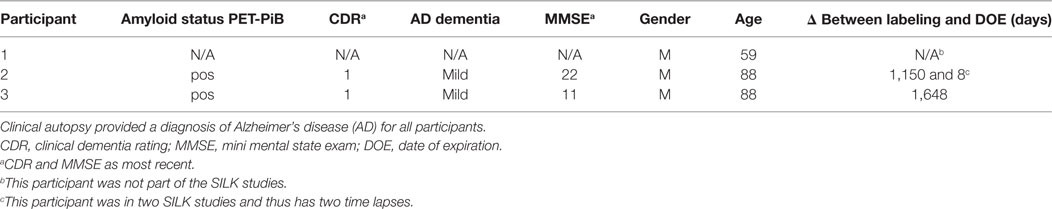
Table 1. Patient demographics for SILK-SIMS imaging of Aβ plaques.
Formalin-fixed tissue from the frontal lobe, including the cortical ribbon, of Pt1 (negative control, no labeling), Pt2 (delta = 8 days), and Pt3 (delta = 4.5 years) were post-fixed in 2% osmium tetroxide in 0.1 M sodium cacodylate buffer for 1 h, en bloc stained with 3% aqueous uranyl acetate for 1 h, dehydrated in graded ethanols, and embeded in PolyBed 812 catalog #08792-1 (Polysciences, Hatfield, PA, USA). Blocks were polymerized at 80°C for 72 h. Tissue blocks were sectioned using a diamond ultrathin section knife on a Reichert Ultra-Cut E ultramicrotome at 300–500 nm. Sections were transferred to a single polished Si wafer for SILK–SIMS analysis. Serial adjacent sections were placed on glass microscope slides for toluidine blue staining for light microscopy. The precuneus of Pt2 was prepared and embedded in LR White as described above for animal tissue along with samples from the 10-week labeled APP/PS1 mouse (positive control) and Pt1 (negative control). Serial adjacent sections were placed on glass microscope slides for toluidine blue staining for light microscopy.
Light Microscopy
Toluidine blue stained sections were imaged with a Hamamatsu NanoZoomer 2.0-HT System. Imaging was done to guide feature identification and location for electron microscopy.
Electron Microscopy
Images of the tissue and reference points were taken with a field emission scanning electron microscope (FE-SEM; QuantaTM 3D FEG, FEI, Hillsboro, OR, USA) in order to document plaque locations and provide an absolute coordinate system for the tissue. In-house coordinate transformation software was used to translate tissue regions-of-interest (ROIs) and reference points found in the FE-SEM to the NanoSIMS instrument stage coordinate plane for relocation of the same ROIs. Additional sections were cut at 70–90 nm for transmission electron microscopy (JEOL JEM-1400Plus) to image selected plaques to define ultrastructure. Anti-Aβ antibody 82E1 (1:50; Aβ N-terminal epitope (1-16); IBL-America, Minneapolis, MN, USA) was used with goat anti-mouse secondary antibody conjugated to 10 nm gold particles (1:15).
Magnetic Resonance Imaging (MRI) and PET-PiB Imaging
Participants were labeled with the radiotracer N-methyl-2-(4-methylaminophenyl)-6-hydroxybenzothiazole (Pittsburgh compound B, PiB) for human brain PET imaging of amyloid deposition. PiB was prepared as previously described (53). PET and MRI were performed as previously described (54).
NanoSIMS
Data were acquired on either a Cameca NanoSIMS 50 at Washington University (cells and human tissue) or NanoSIMS 50 L at Brigham and Women’s Hospital (mouse tissue). Images of the B-cell hybridoma used to calculate the 13C6-leucine standard curve were acquired with a 50 µm primary beam raster for 15 min at 1 ms/px and 65.5 s/plane (dwell time) for a total of 10 planes (i.e., cycles) per mass (256 × 256 px). APP/PS1 mouse brain tissue was acquired at a 17–60 µm raster for 11–87 min at 2 ms/px and 131 s/plane (dwell time) for a total of 5–40 cycles (i.e., planes) per mass (256 × 256 px). For all APP/PS1 measurements, the non-labeled cells (0%) were measured prior to the SILK–SIMS data acquisition. The unlabeled cells and the natural abundance of carbon-13 (55) were used for quantitation of normalized ratios for mouse plaques and neuron. Plaque ROI outlines were drawn based on plaque morphology and areas around the plaque defined such they do not overlap or intersect with the predefined plaque ROIs.
The human tissue was analyzed in three sets. In the first set (frontal lobe), Pt1 (negative control) and Pt2 frontal lobe were embedded in PolyBed 812 and pre-sputtered using the D1-1 aperture for 10 min followed by data acquisition at a raster size between 35 and 50 µm raster with a D1-2 aperture. Data acquisition was 4 h at 5 ms/px and 327.68 s/plane (dwell time) for a total of 40 planes (i.e., cycles) per mass (256 × 256 px). In the second set (precuneus), Pt2 precuneus samples (embedded in LR White; Figures S9 and S11 in Supplementary Material) were pre-sputtered at 30 µm raster with a D1-1 aperture for 10 min followed by data acquisition at 25 µm raster with the D1-2 aperture. Data acquisition was 2.5 h at 5 ms/px and 327.68 s/plane (dwell time) for a total of 25 planes (i.e., cycles) per mass (256 × 256 px). Pt1, also embedded in LR White, was used as the negative control in this experimental set. Finally, unlabeled AD tissue (Pt1; in Supplementary Material) embedded in PolyBed812 was acquired with a 45 µm raster for 11.6 h at 4 ms/px and 1,048.576 s/plane (dwell time) for a total of 40 planes (i.e., cycles) per mass (512 × 512 px). Pt3’s (in Supplementary Material) brain tissue was acquired with a 55 µm raster for 18 h at 5 ms/px and 1,310 s/plane (dwell time) for a total of 40 planes (i.e., cycles) per mass (512 × 512 px). For all measurements, the non-labeled material (Pt1) was measured prior to the SILK–SIMS data acquisition. In this way, the negative control data were acquired first before SILK data acquisition, and the electron multipliers were no longer adjusted after negative control data were acquired.
NanoSIMS Data Analysis
Each analysis was performed in 24-h blocks with measurements on a SiC standard of known isotopic composition to assess instrument stability followed by measurements on an unlabeled control prior to SILK–SIMS data acquisition. Raw image data were imported into the L’Image image processing software (Larry Nittler, Carnegie Institution of Washington) to produce quantitative ratio images of heavy and light isotopes and determine where isotopic anomalies were located. Images were automatically segmented into 10 × 10 pixel ROIs using L’image, and the heavy/light isotopic ratios were calculated from the summed ion counts within each ROI. The fractional uncertainty, ƒ, of each ROI ratio heavy/light isotope ratios in each region-of-interest (ROI) was calculated in Excel as the sum in quadrature of the standard deviation of the average ratios measured for non-labeled material, σStd, and the Poisson errors, σROI, of the ROI itself, as given by the equation
where RStd is the average ratio of repeated measurements on unlabeled tissue, and RROI is the ratio calculated from summing the counts of every pixel contained within the individually defined ROI. This uncertainty represents the entire experimental precision and accuracy, including: counting statistics, matrix effects, systematic error, instrumental tuning, and differences between standards and samples. From this uncertainty, the amount, significance, and location of heavy isotopic labeling can be quantitatively determined. Those ROIs with heavy/light isotope ratios greater than or equal to the μ + 2σ value of the unlabeled sample were analyzed by a one-sample t-test. Two SDs from the mean (2σ) was chosen to ensure high confidence in isotope enrichment (i.e., 95%) prior to the one-sample t-test; by analogy in the field of Physics, a minimum 5σ effect is required for statistical confidence. Each t-value of the resulting t-tests was corrected for multiple testing with a FDR of 0.01 using the Benjamini-Hochberg method (56). Those ROIs which remained significant after correcting for multiple comparisons remain outlined in the images.
Aβ Extraction
1 g of frontal lobe tissue was homogenized in ice-cold 1X PBS with 0.05% CHAPS and centrifuged at 17,000 × g for 30 min at 4°C as previously described (57). The supernatant was spun for 1 h at 100,000 × g at 4°C, and the resulting pellet was solubilized in 5 M guanidine overnight at 4°C with rotation. Next, samples were spun for 20 min at 17,000 × g at 4°C, and the supernatant was diluted 1:10 in 1X PBS in BSA-block tubes as previously described (57). Samples were immunoprecipitated (IP) with 50 μL of HJ5.1 anti-Aβ antibody [mid-domain epitope (17–28)] coupled Dynabeads (Catalog #14311D, Invitrogen, Carlsbad, CA, USA) made following the manufacturer’s instructions. After overnight incubation at 4°C, IPs were eluted in neat formic acid and dried in vacuo. Samples were resuspended in 50 mM TEABC (Catalog #17902, Sigma, St. Louis, MO, USA), spiked with 15N-Aβ internal standard, and digested overnight with 0.25 ng/µL Lys-N (Catalog #100965-1, Seikagaku Biobusiness Corp., Tokyo, Japan) at 4°C.
Mass Spectrometry
Samples were resuspended in 1% FA/10% ACN (v/v) with 20 nM BSA digest (Catalog #1863078, Pierce, Rockford, IL, USA). Samples were analyzed in triplicate by nanoLC-MS/MS on an LTQ-Orbitrap Fusion (Thermo Fisher Scientific) in positive ion mode. Separations were performed using an online NanoAcquity UPLC (Waters, Milford, MA, USA) using an ACQUITY UPLC HSS T3 (360 µm OD × 75 µm ID) column packed with 10 cm C18 (1.8 µm, 100 Å, Waters) at 300 nL/min and heated to 65°C. Mobile phases were 0.1% FA in water (A) and 0.1% FA in ACN (B). Samples were eluted from the column with the gradient starting at 12% B, which was ramped to 32% B over 10 min and further increased to 90% B over 5 min and held for 1 min, before re-equilibration to 12% B over 2 min. Total run time, including column equilibration, sample loading, and analysis, was 30 min. The mass spectrometer was operated in targeted MS2 mode. MS2 spectra were acquired in the Orbitrap (30,000 at m/z 400) in centroid mode using XCalibur, version 4.0 (Thermo Fisher Scientific). Ion injection times for the targeted MS2 scans for labeled and unlabeled samples, respectively (in ms) were: Aβ mid-domain (54, 1080), Aβ40 (54, 540), and Aβ42 (54, 1080). The Orbitrap automatic gain control targets were set to 5 × 10⁵ for all proteoforms except Aβ42, which was set to 1 × 10⁶. The targeted precursor ions were sequentially isolated in the quadrupole and fragmented in the Orbitrap using HCD (isolation width 1.6 Da, normalized collision energy 25%, activation Q 0.250, and activation time 10 ms). The general mass spectrometric conditions were as follows: spray voltage 2.2 kV, 60% S-lens, and ion transfer tube temperature 275°C.
Mass Spectrometry Data Analysis
Data (.raw files) were imported into a Skyline template containing the Lys-N C-terminal peptides of Aβ38, 40, 42, and the mid-domain. Retention time alignment was based on the 15N internal standard. The sum of all transitions (b ions monitored for each parent peptide) for unlabeled and 13C6-leucine labeled Aβ peptides were exported from Skyline to Excel. The ratios of labeled/unlabeled of each replicate (triplicate injections) for Pt2 sample were taken followed by isotopic background subtraction of the mean ratio of an unlabeled participant to give the TTR minus background for each replicate injection. Next, the background subtracted TTRs were used to calculate the mean and SD (i.e., the mean of the area ratios) of enrichment for each Aβ peptide.
Data Availability Statement
NanoSIMS image files (.im) and L’Image saved session (.sav) files are available upon request from corresponding authors. Excel data analysis files for human NanoSIMS images can be found in the Supplementary Material.
Results
Quantification of 13C and In Vivo Labeling
To quantify carbon isotopes in biological material, we measured carbon as negative ions of 12C, 13C, 12C14N, and 13C14N. Using a B-cell hybridoma grown in leucine-free media supplemented with increasing percentages of 13C6-leucine, we characterized the signal response for 13C enrichment. Figure 1 demonstrates the linearity of response of SILK–SIMS measurements to increasing isotopic enrichment of 13C6-leucine in culture measured as the ratio of 13C14N/12C14N, which produced improved image quality and more accurate quantification (Figure S1–3 in Supplementary Material). To determine whether 13C6-leucine enrichment could be detected in vivo in native Aβ plaques, two individual APP/PS1 mice (3.5 months of age) were administered 13C6-leucine tracer for 10 and 5 weeks (Figure 2A). The mouse labeled for 10 weeks (Figure 2B) reached a 13C14N/12C14N ratio of 2.4% ± 0.03% in plaque (expected unlabeled at 1.1% due to 13C natural abundance) compared to brain parenchyma (2.2% ± 0.03%) in both Area 1 and Area 2 (Figure 2B; Figure S4 in Supplementary Material). A plaque from the APP/PS1 mouse labeled for 5 weeks, followed by a 5-week washout, remained enriched at 1.6% ± 0.02% relative to natural abundance (Figure 2C), and compared to adjacent areas (1.4% ± 0.02%). Despite being labeled for half the amount of time with an additional 5 weeks of tracer washout, the plaque enrichment was approximately two-thirds of that measured in the 10-week labeled animal (1.6% ± 0.02% vs. 2.4% ± 0.03%). The enrichment of plasma leucine measurements taken at the time of collection was fourfold lower (72 vs. 16% isotopically labeled leucine in the 10-week vs. 5-week labeled mouse, Table 1). A neuron incorporated substantially more tracer than the surrounding parenchyma (neuron = 3.3% ± 0.05% vs. area 1 = 2.4% ± 0.03% vs. area 2 = 2.4% ± 0.03%) and the plaque (Figure S5 in Supplementary Material) in the 10-week labeled mouse. These results demonstrate that 13C6-leucine incorporation into Aβ plaques and other features could be measured and is localized to protein deposition (i.e., plaques) and protein translation (i.e., cells).
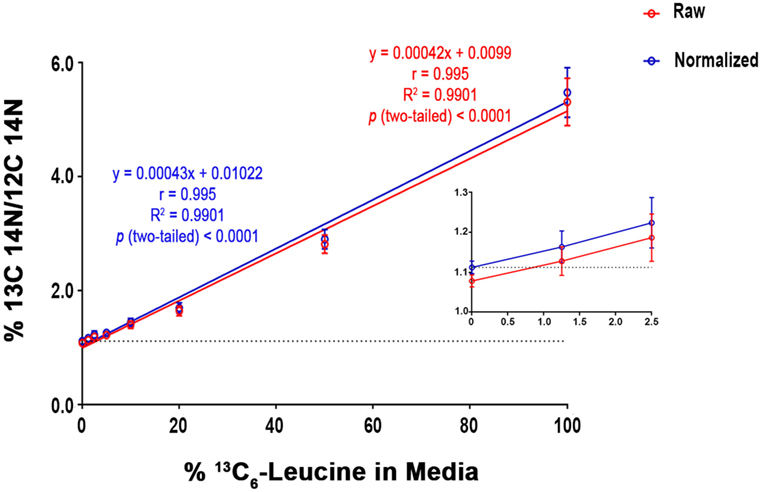
Figure 1. SILK-SIMS dose response curve for 13C6-leucine enrichment. B-cell hybridoma cells were labeled with increasing percentages of 13C6-leucine. The standard curve demonstrates a monotonic relationship between detected 13C14N/12C14N and the percent 13C6-leucine enrichment in cell media. Red line represents the mean of 13C14N/12C14N ± SD of the regions-of-interest outlined in (Figure S3 in Supplementary Material). The blue line represents the normalized mean 13C14N/12C14N ± SD. Each standard curve point was normalized (Equation 4 in Supplementary Material) to the ratio of natural abundance 13C and unlabeled cells (0%). The normalized SD was calculated as the sum in quadrature of the SD of the average ratios measured for non-labeled cells (0%) and the Poisson errors of the feature itself (Equation 5 in Supplementary Material). Note the expected intercept at ~1.1%. Inset: enlarged view of the three lowest points on the dose-response curve. Enrichments as low as 1.25% were detectible above background. Dashed horizontal line represents natural abundance of 13C (1.1%).
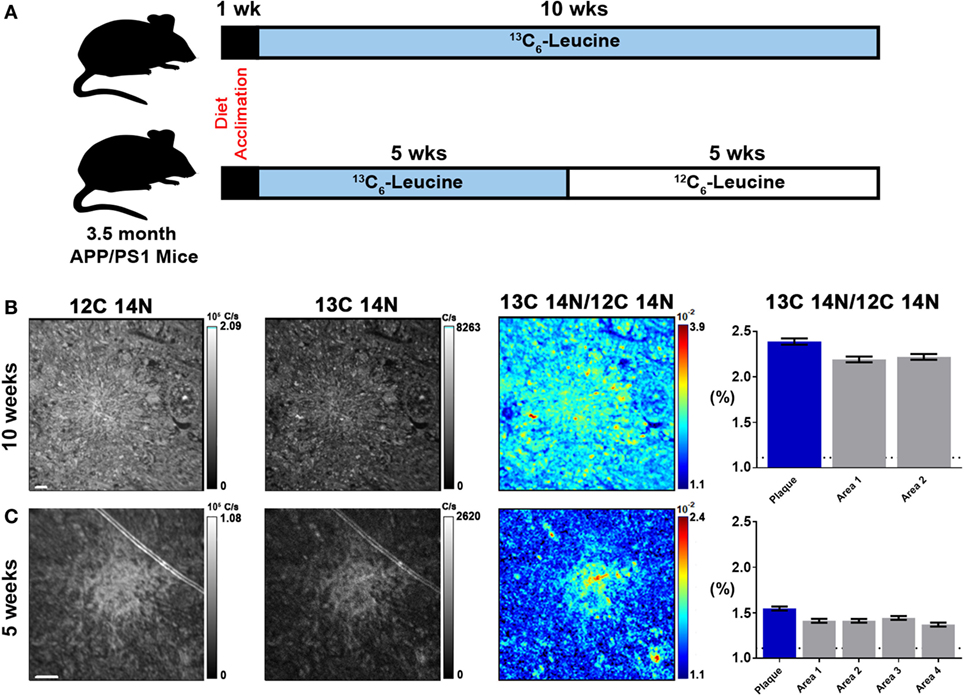
Figure 2. Stable isotope incorporation within plaques of APP/PS1 mouse model of Alzheimer’s disease. (A) Labeling scheme to determine the feasibility of detecting in vivo incorporation of stable isotope 13C in native Aβ plaques. (B,C) From left to right, 12C14N ion map, 13C14N ion map, 13C14N/12C14N ion map, and normalized 13C14N/12C14N ratios of 10-week and 5-week labeled APP/PS1 mice, respectively (35 × 35 μm images; see, Figure S4 in Supplementary Material, for region-of-interest (ROI) outlines based on plaque morphology and areas around the plaque defined such they do not overlap with plaque ROIs). Error bars indicate ± SD in quadrature of the SD of the average ratios measured for non-labeled cells (0%) and the Poisson errors of the feature itself (Equation 5 in Supplementary Material). Dashed horizontal line represents natural abundance of 13C (1.1%). Scale bar, 2 µm.
In Vivo Labeling and Quantification of Human AD Plaques
The APP/PS1 mouse model (50) is an over-expression model of APP mutations typically found in early onset, familial disease, which accounts for <1% of AD cases (58) and does not replicate all aspects of the human disease or human amyloid-plaques (37–39). Further, despite intensive study of plaque dynamics in animal models (30–34), little is known about individual plaque dynamics in human AD brain. The demonstrated feasibility of measuring 13C6-leucine incorporation in native Aβ plaques from mouse brain (Figure 2) prompted us to investigate post-mortem tissue from previous SILK study participants (22, 35). Plaques from unlabeled AD participant tissue (Table 2; Figure S6 in Supplementary Material) were similar to the natural abundance of 13C as expected. In a previous SILK participant (Pt3) (22), who had a post-labeling interval of 4.5 years (Figure S7 in Supplementary Material), we were also unable to detect 13C enrichment in the examined areas. In contrast, post-mortem tissue from Pt2, who was labeled (35) and passed away 8 days later due to an unrelated cause, had significant 13C enrichment in amyloid plaques (Figure 3). Four diffuse plaques in the frontal lobe displayed puncta of 13C labeling intercalated in the periphery and fibrillar interior (Figure 3C). Notably, not all plaques demonstrated equivalent amounts of 13C incorporation or the same number of enriched regions (max 13C = 1.26, 1.34, 1.49, and 1.20%, for plaques 1–4, respectively). Among plaques with an equivalent number of enriched regions (e.g., plaques 2 and 3) 13C enrichment varied, suggesting differing rates of 13C incorporation among “dynamic” plaques (Figures 3C,D). Additionally, the number of areas with significant enrichment drastically differed, indicating that plaque incorporation of 13C is highly asymmetric and can be constrained to specific regions or sub-regions; in the case of plaque 4, it is confined to a 3.0 µm2 area (Figures 3C,D; Figure S8 in Supplementary Material). To confirm this result was not restricted to a single brain region, we examined plaques in the precuneus (Figure S9 in Supplementary Material). Of the two dense-core plaques imaged by SILK–SIMS and verified by immunoelectron microscopy (Figure S10 in Supplementary Material), only plaque 5 had 13C enrichment within the plaque, the peri-plaque region (Figures S9A–F in Supplementary Material), and up to 50 µm away (Figure S11 in Supplementary Material). In contrast, plaque 6 had a low number of enriched regions, which appear part of the surrounding brain parenchyma (Figures S9G–L in Supplementary Material) rather than the plaque itself, suggesting a quiescent plaque. To provide orthogonal validation of the presence of 13C6-leucine Aβ proteoforms (23) in Pt2 brain, we used targeted nLC-MS/MS. In Aβ from insoluble aggregates (57), we quantified 13C6-leucine labeled Aβx-40, 42, and mid-domain peptides, which were enriched at relative abundances of 0.112, 0.022, and 0.053% above natural abundance, respectively, while Aβx-38 was not detected as expected (Figure 4).
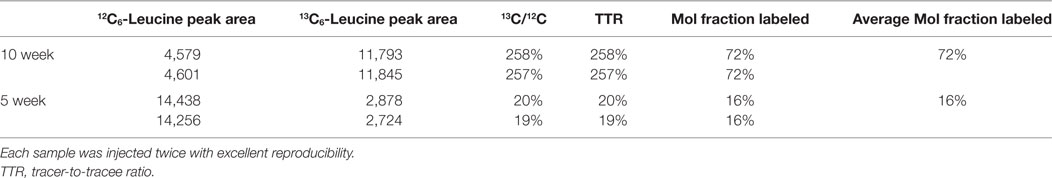
Table 2. Plasma leucine in labeled APP/PS1 mice.
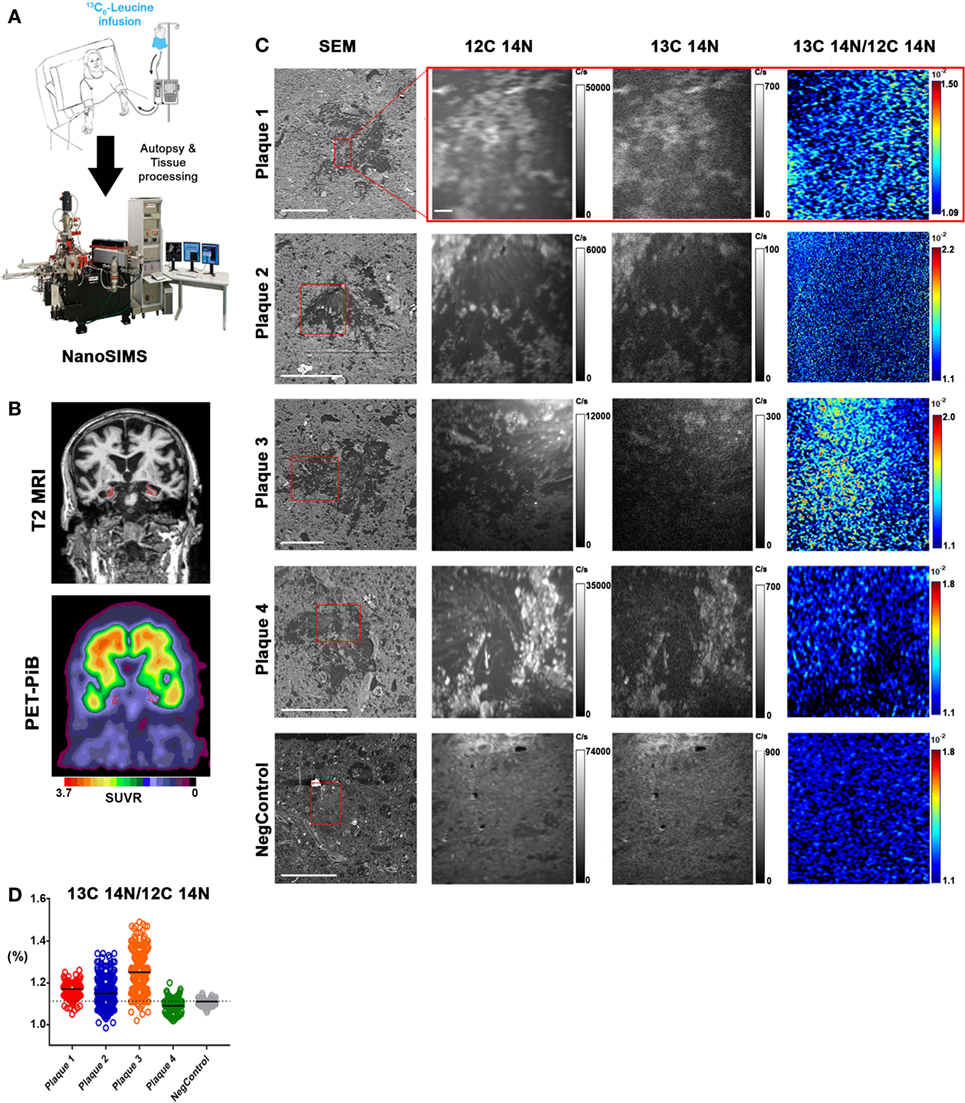
Figure 3. In vivo stable isotope incorporation of 13C within plaques in the frontal lobe of clinically and pathologically confirmed Alzheimer’s disease brain. (A) Primary question: are amyloid-β plaques dynamic structures able to incorporate the stable isotope tracer 13C6-leucine and can this be directly measured in the human brain? (B) Traditional imaging of SILK Pt2 by T2-weighted magnetic resonance imaging (MRI) (upper) and by PET-PiB (lower) in a coronal view. Hippocampal atrophy (red) in the MRI image is apparent along with prominent PiB binding in the PET image. SUVR, standardized uptake value ratio. (C) Four diffuse plaques in the frontal lobe of SILK Pt2 and a dense core plaque from the frontal lobe of non-SILK Pt1 (Table 2). From left to right, scanning electron microscope (SEM) image of the plaque (red box defines area imaged by SILK–SIMS), 12C14N ion map, 13C14N ion map, and 13C14N/12C14N ion map. (D) Summary scatter plot of all plaque region-of-interest normalized ratios shown below. Horizontal bars represent plaque 13C14N/12C14N medians, and dashed horizontal line represents natural abundance of 13C (1.1%). Scale bar for all SEM images, 40 µm. Scale bar for all SILK–SIMS images, 5 µm. SEM magnification and SILK–SIMS image raster, respectively: Plaque 1: 636X and 25 × 25 μm; Plaque 2: 1,024 and 35 × 35 μm; Plaque 3: 628X and 50 × 50 μm; Plaque 4: 628X and 45 × 45 μm; NegControl: 600X and 45 × 45 μm.
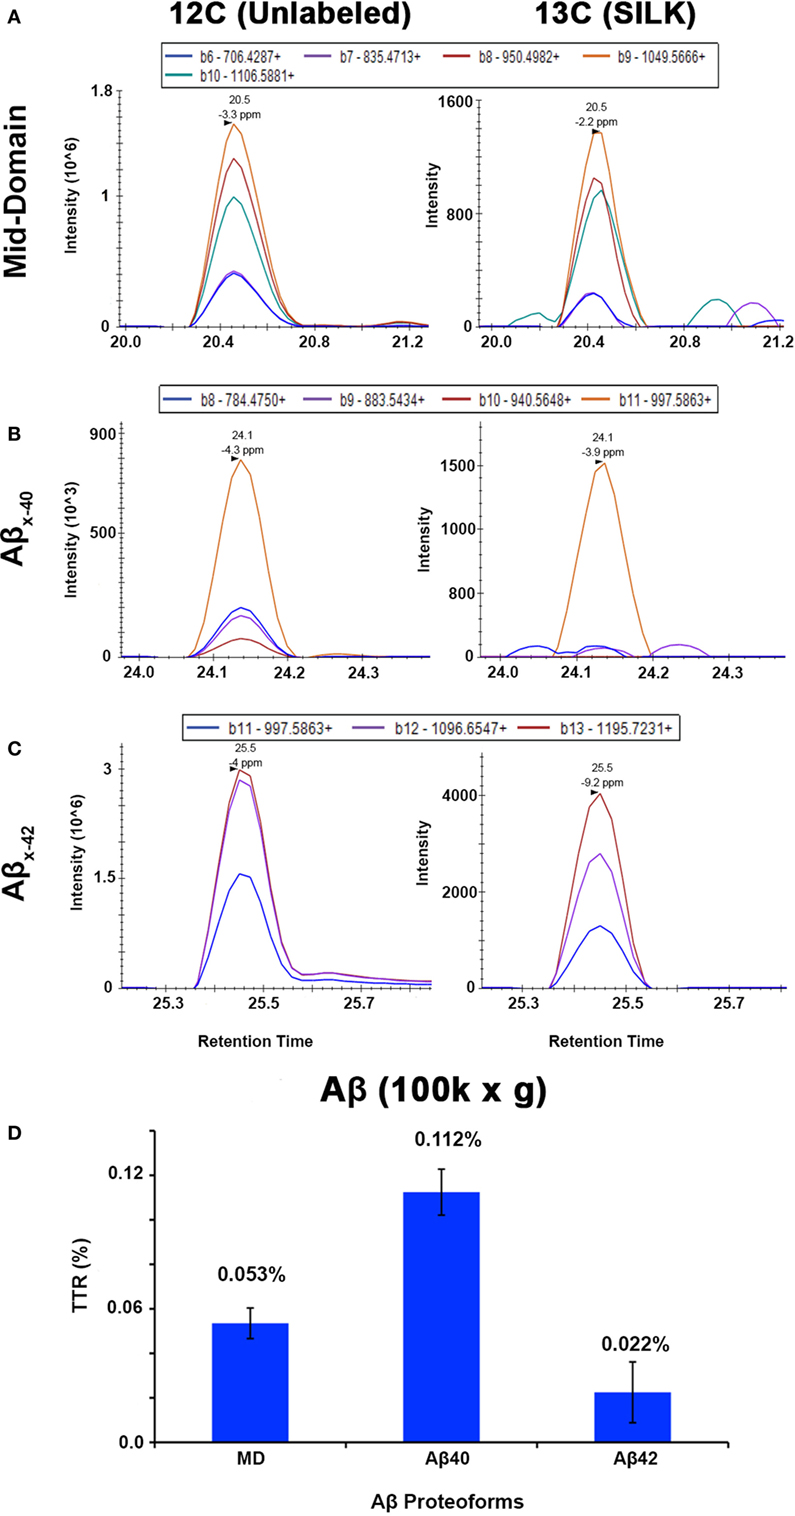
Figure 4. Targeted nLC-MS/MS of Aβ proteoforms from an insoluble fraction of SILK Pt2. Extracted ion chromatograms (XIC) are shown for (A) Aβ mid-domain, (B) Aβx-40, and (C) Aβx-42 in Pt2 (8 day delta between labeling and expiration) of unlabeled Aβ and 13C6-leucine labeled (SILK), respectively. (D) The average of each tracer-to-tracee ratio (TTR) from triplicate injections using targeted nLC-MS/MS after background subtraction from an unlabeled participant sample. The relative quantitation of Aβ mid-domain, Aβx-40, and Aβx-42 provides additional evidence of 13C6-leucine present in the brain even after supposed label washout. Error bars represent ± SD.
Discussion
In the current study, we utilized brain tissue from participants enrolled in previous SILK studies (22, 35) for NanoSIMS imaging. During the in vivo stable isotope labeling procedure (41) newly synthesized proteins are labeled simultaneously. As a result, many different features (e.g., plaques, parenchyma, and neurons) and kinetic processes (e.g., protein translation, transport, deposition, and clearance) in the brain can be imaged directly without the reliance of analytical intermediaries or modifications such as fluorescence. In the previous SILK studies, 13C6-leucine was used as the tracer (41, 59). However, in SILK-SIMS, 13C is isotopically diluted, decreasing sensitivity, due to the abundance of carbon in mammalian tissues and the carbon-based embedding media. As a result, we were only able to successfully detect 13C enrichment in one participant who had a post-labeling interval of eight days. Yet, to the best of our knowledge, this represents the first report of imaging of individual human amyloid plaques in vivo dynamics at the nanometer scale not appreciable by previous methods.
Human Aβ Plaques Are Dynamic Structures
The incorporation of 13C6-leucine into plaques (i.e., protein deposition) in a participant with clinical stage AD dementia suggests that plaques can be dynamic with activity over days even in later stages of the disease. Notably, we were able to demonstrate dynamic activity in both diffuse and dense-core plaques in contrast to previous animal model studies (30–34), which were restricted to imaging dense-core plaques due to the use of fluorescent plaque binding reagents Thioflavin S and Methoxy-04. The “activity” of individual plaques can be highly variable as demonstrated by varying isotope enrichment, suggesting differing rates of protein incorporation even among individual plaques in the same brain region. A single plaque could simultaneously demonstrate nanometer scale regions of dynamic incorporation of the tracer as well as quiescence—highly asymmetric tracer incorporation.
Plaque asymmetry was previously suggested (33) in a mouse model of AD but was attributed to asymmetrical clearance. The quiescence regions and sub-regions of individual plaques could be interpreted as either asymmetric clearance or differential nanometer scale deposition. However, not all plaques incorporated the tracer indicating a lack of protein deposition during the same timeframe. Together, these results demonstrate that plaques can be at both dynamic equilibrium and quiescence within a single participant even with dementia, at both the individual plaque level and plaque nanometer sub-region level, despite PET studies suggesting no net change (20, 26–29).
Relationship to Previous Studies and Limitations
Previous visualizations of plaque formation examined by multi-photon imaging have arrived at differing conclusions (30–34). This may be due to a potential significant impact on plaque response with surgical intervention and the use of over-expression models versus direct human pathophysiology. Multi-photon imaging has the advantages of visualization of individual plaques over time in the same animal non-destructively albeit at lower resolution limit compared to SILK–SIMS. In contrast, SILK–SIMS is a destructive technique where the isotope profiles are obtained at the expense of the molecular identities of the newly synthesized and deposited biomolecules. This is particularly relevant as plaques are heterogeneous structures containing other proteins, cellular debris, and lipids (40), which may contribute to the 13C signal seen in the SILK-SIMS images. As Aβ is the main constituent of plaques, we validated 13C enrichment by nLC-MS/MS from the same sample in an orthogonal manner. This orthogonal measure can be applied to other proteins of interest (e.g., alpha-synuclein, tau, and prion protein), or MALDI imaging (60, 61) may be used in parallel to obtain molecular identities of plaque constituents in situ, though at micrometer resolution.
Conclusion and Outlook
The application of SILK–SIMS to future studies will allow estimates of the rate and distribution of plaque deposition at the nanometer level across human AD cohorts. The results will provide a better understanding of the rate of AD pathophysiology and may have a significant impact on the development of therapeutic strategies; for example, drugs targeting amyloid plaque growth and resorption through a variety of mechanisms. However, SILK–SIMS, unlike PET imaging, is currently limited to post-mortem tissue. Biopsies are an alternative but are invasive and only feasible with surgery to relieve other conditions such as normal pressure hydrocephalus. Nonetheless, SILK–SIMS may also be applied to measuring other proteinaceous deposits such as Lewy bodies (alpha-synuclein), neurofibrillary tangles (tau), and prion protein, which are characteristic of Parkinson’s disease, frontotemporal dementia and AD, and Creutzfeldt–Jakob disease, respectively. In general, the SILK–SIMS approach can be used to visualize incorporation of new biomolecules at the nanometer scale to measure growth and turnover to better understand physiology and pathophysiology of many disease states, neurological and non-neurological.
Ethics Statement
All animal procedures were conducted in accordance with the animal protocol approved by the Washington University Animal Studies Committee and are consistent with the National Institutes of Health (NIH) guidelines for the care and use of animals. Clinically and neuropathologically well-characterized human brain tissue samples were obtained from the Charles F. and Joanne Knight Alzheimer’s Disease Research Center (Knight ADRC), Washington University School of Medicine, Saint Louis, Missouri. At the time of death, written informed consent in accordance with the Declaration of Helsinki was obtained from the next-of-kin in accordance with the protocol approved by the Washington University Human Studies Committee and the General Clinical Research Center Advisory Committee.
Author Contributions
NW, DE, FG, and RB designed the experiments. NW, FG, and CG operated the NanoSIMS instrument for SILK–SIMS data acquisition. NW performed all animal experiments and biochemical fractionation of SILK AD tissue. BP contributed APP/PS1 and human plasma leucine measurements, data analysis, and critical discussions regarding relevance of NanoSIMS to Aβ peptide SILK studies. KM assisted with mass spectrometry data acquisition and analysis. TS performed sample digestion and preparation for mass spectrometry analysis. KG and RR performed histology and EM sample preparation. RS provided unlabeled tissue, supervised the EM preparation, and confirmed plaque pathology. NC provided SILK tissue and advised about plaque location in tissue and sample processing. TB provided PET-PiB and MRI images and analysis. MS and RB supervised analyses and provided critical feedback at all junctures. NW made the figures. NW, FG, and RB wrote the manuscript. All authors approved the manuscript.
Conflict of Interest Statement
RB and Dr. Holtzman (Chair of the Department of Neurology) and Washington University in St. Louis have equity ownership interest in C2N Diagnostics and may receive royalty income based on technology licensed by Washington University to C2N Diagnostics. In addition, RB and Dr. Holtzman receive income from C2N Diagnostics for serving on the Scientific Advisory Board. Washington University, with RB and Dr. Holtzman as co-inventors, has also submitted the U.S. non-provisional patent application “Methods for measuring the metabolism of CNS derived biomolecules in vivo,” serial #12/267,974. Washington University, with NW, RB, FG, and DE, has also submitted the U.S. provisional patent application “Methods and systems for measuring, detecting, and determining the location of a biomolecule or drug,” #62523811.
Acknowledgments
We thank Dr. Timothy Miller for the generous donation of the APP/PS1 mice. Drs. David L. Brody, Samuel E. Senyo, Susan Carlton, and Larry R. Nittler for helpful discussions and advice. We also thank Larry Nittler for providing L’image and Dr. Terrance Kummer for critical review of the manuscript. This study acknowledges the contributions of research participants, including Andrew Jackson Bateman, for his belief in “whatever the human mind can conceive and believe, it will achieve.”
Funding
This work was supported by the Jeane B. Kempner Post-Doctoral Fellowship (NCW), Washington University Center for Cellular Imaging Micro-grant (NCW), the BJH-ICTS pilot grant (NCW & RJB), the Hope Center Alafi Neuroimaging Lab and a NIH Shared Instrumentation Grant (S10 RR027552), Washington University Nutrition Obesity Research Center (NIH P30 DK056341; BWP), Metlife Award (RJB), Washington University School of Medicine (RJB), and the Charles F. and Joanne Knight Distinguished Professorship (RJB). Human brain samples were provided by the Washington University Knight Alzheimer’s Disease Research Center (P50 AG05681 and P01 AG3991). Human brain PiB-PET and MRI imaging was funded through the Barnes-Jewish Hospital Foundation, Knight Alzheimer’s Disease Research Center (P50 AG05681), The Charles and Joanne Knight Alzheimer Disease Research Center Support Fund, The David and Betty Farrell Medical Research Fund, The Daniel J Brennan Alzheimer Research Fund, The Thomas E. Brew Foundation Fund, The Fred Simmons and Olga Mohan Alzheimer Research Support Fund, Washington University Center for Clinical Imaging and Research (UL1TR000448), and the Central Neuroimaging Data Archive (1P30NS098577 and R01EB009352). Immuno-gold transmission electron microscopy (TEM) experiments and ultrathin sectioning of cell and mouse samples were performed in part through the use of Washington University Center for Cellular Imaging (WUCCI) supported by Washington University School of Medicine, The Children’s Discovery Institute of Washington University and St. Louis Children’s Hospital (CDI-CORE-2015-505) and the National Institute for Neurological Disorders and Stroke (NS086741).
Supplementary Material
The Supplementary Material for this article can be found online at https://www.frontiersin.org/articles/10.3389/fneur.2018.00169/full#supplementary-material.
References
1. Kawas C, Gray S, Brookmeyer R, Fozard J, Zonderman A. Age-specific incidence rates of Alzheimer’s disease: the Baltimore longitudinal study of aging. Neurology (2000) 54:2072–7. doi:10.1212/WNL.54.11.2072
2. Bachman DL, Wolf PA, Linn RT, Knoefel JE, Cobb JL, Belanger AJ, et al. Incidence of dementia and probable Alzheimer’s disease in a general population: the Framingham study. Neurology (1993) 43:515–9. doi:10.1212/WNL.43.3_Part_1.515
3. Di Carlo A, Baldereschi M, Amaducci L, Lepore V, Bracco L, Maggi S, et al. Incidence of dementia, Alzheimer’s disease, and vascular dementia in Italy. The ILSA Study. J Am Geriatr Soc (2002) 50:41–8. doi:10.1046/j.1532-5415.2002.50006.x
4. Alzheimer’s Association. 2017 Alzheimer’s disease facts and figures. Alzheimers Dement (2017) 13:325–73. doi:10.1016/j.jalz.2017.02.001
5. Golde TE, Eckman CB, Younkin SG. Biochemical detection of Abeta isoforms: implications for pathogenesis, diagnosis, and treatment of Alzheimer’s disease. Biochim Biophys Acta (2000) 1502:172–87. doi:10.1016/S0925-4439(00)00043-0
6. Selkoe DJ. Alzheimer’s disease: genes, proteins, and therapy. Physiol Rev (2001) 81:741–66. doi:10.1152/physrev.2001.81.2.741
7. Glenner GG, Wong CW. Alzheimer’s disease and Down’s syndrome: sharing of a unique cerebrovascular amyloid fibril protein. Biochem Biophys Res Commun (1984) 122:1131–5. doi:10.1016/0006-291X(84)91209-9
8. Masters CL, Simms G, Weinman NA, Multhaup G, Mcdonald BL, Beyreuther K. Amyloid plaque core protein in Alzheimer disease and Down syndrome. Proc Natl Acad Sci U S A (1985) 82:4245–9. doi:10.1073/pnas.82.12.4245
9. Wong CW, Quaranta V, Glenner GG. Neuritic plaques and cerebrovascular amyloid in Alzheimer disease are antigenically related. Proc Natl Acad Sci U S A (1985) 82:8729–32. doi:10.1073/pnas.82.24.8729
10. Hardy JA, Higgins GA. Alzheimer’s disease: the amyloid cascade hypothesis. Science (1992) 256:184–5. doi:10.1126/science.1566067
11. Katzman R, Terry R, Deteresa R, Brown T, Davies P, Fuld P, et al. Clinical, pathological, and neurochemical changes in dementia: a subgroup with preserved mental status and numerous neocortical plaques. Ann Neurol (1988) 23:138–44. doi:10.1002/ana.410230206
12. Delaere P, He Y, Fayet G, Duyckaerts C, Hauw JJ. Beta A4 deposits are constant in the brain of the oldest old: an immunocytochemical study of 20 French centenarians. Neurobiol Aging (1993) 14:191–4. doi:10.1016/0197-4580(93)90096-T
13. Price JL, Morris JC. Tangles and plaques in nondemented aging and “preclinical” Alzheimer’s disease. Ann Neurol (1999) 45:358–68. doi:10.1002/1531-8249(199903)45:3<358::AID-ANA12>3.0.CO;2-X
14. Aizenstein HJ, Nebes RD, Saxton JA, Price JC, Mathis CA, Tsopelas ND, et al. Frequent amyloid deposition without significant cognitive impairment among the elderly. Arch Neurol (2008) 65:1509–17. doi:10.1001/archneur.65.11.1509
15. Bateman RJ, Xiong C, Benzinger TL, Fagan AM, Goate A, Fox NC, et al. Clinical and biomarker changes in dominantly inherited Alzheimer’s disease. N Engl J Med (2012) 367:795–804. doi:10.1056/NEJMoa1202753
16. Jack CR Jr, Wiste HJ, Vemuri P, Weigand SD, Senjem ML, Zeng G, et al. Brain beta-amyloid measures and magnetic resonance imaging atrophy both predict time-to-progression from mild cognitive impairment to Alzheimer’s disease. Brain (2010) 133:3336–48. doi:10.1093/brain/awq277
17. Ewers M, Insel P, Jagust WJ, Shaw L, Trojanowski JQ, Aisen P, et al. CSF biomarker and PIB-PET-derived beta-amyloid signature predicts metabolic, gray matter, and cognitive changes in nondemented subjects. Cereb Cortex (2012) 22:1993–2004. doi:10.1093/cercor/bhr271
18. Landau SM, Mintun MA, Joshi AD, Koeppe RA, Petersen RC, Aisen PS, et al. Amyloid deposition, hypometabolism, and longitudinal cognitive decline. Ann Neurol (2012) 72:578–86. doi:10.1002/ana.23650
19. Lim YY, Pietrzak RH, Ellis KA, Jaeger J, Harrington K, Ashwood T, et al. Rapid decline in episodic memory in healthy older adults with high amyloid-beta. J Alzheimers Dis (2013) 33:675–9. doi:10.3233/JAD-2012-121516
20. Villemagne VL, Pike KE, Chetelat G, Ellis KA, Mulligan RS, Bourgeat P, et al. Longitudinal assessment of Abeta and cognition in aging and Alzheimer disease. Ann Neurol (2011) 69:181–92. doi:10.1002/ana.22248
21. Fagan AM, Mintun MA, Mach RH, Lee SY, Dence CS, Shah AR, et al. Inverse relation between in vivo amyloid imaging load and cerebrospinal fluid Abeta42 in humans. Ann Neurol (2006) 59:512–9. doi:10.1002/ana.20730
22. Patterson BW, Elbert DL, Mawuenyega KG, Kasten T, Ovod V, Ma S, et al. Age and amyloid effects on human central nervous system amyloid-beta kinetics. Ann Neurol (2015) 78(3):439–53. doi:10.1002/ana.24454
23. Smith LM, Kelleher NL, Proteomics CFTD. Proteoform: a single term describing protein complexity. Nat Methods (2013) 10:186–7. doi:10.1038/nmeth.2369
24. Potter R, Patterson BW, Elbert DL, Ovod V, Kasten T, Sigurdson W, et al. Increased in vivo amyloid-β42 production, exchange, and loss in presenilin mutation carriers. Sci Transl Med (2013) 5:189ra177. doi:10.1126/scitranslmed.3005615
25. Ovod V, Ramsey KN, Mawuenyega KG, Bollinger JG, Hicks T, Schneider T, et al. Amyloid beta concentrations and stable isotope labeling kinetics of human plasma specific to central nervous system amyloidosis. Alzheimers Dement (2017) 13:841–9. doi:10.1016/j.jalz.2017.06.2266
26. Engler H, Forsberg A, Almkvist O, Blomquist G, Larsson E, Savitcheva I, et al. Two-year follow-up of amyloid deposition in patients with Alzheimer’s disease. Brain (2006) 129:2856–66. doi:10.1093/brain/awl178
27. Scheinin NM, Aalto S, Koikkalainen J, Lotjonen J, Karrasch M, Kemppainen N, et al. Follow-up of [11C]PIB uptake and brain volume in patients with Alzheimer disease and controls. Neurology (2009) 73:1186–92. doi:10.1212/WNL.0b013e3181bacf1b
28. Kadir A, Almkvist O, Forsberg A, Wall A, Engler H, Langstrom B, et al. Dynamic changes in PET amyloid and FDG imaging at different stages of Alzheimer’s disease. Neurobiol Aging (2012) 33(198):e191–114. doi:10.1016/j.neurobiolaging.2010.06.015
29. Jack CR Jr, Knopman DS, Jagust WJ, Shaw LM, Aisen PS, Weiner MW, et al. Hypothetical model of dynamic biomarkers of the Alzheimer’s pathological cascade. Lancet Neurol (2010) 9:119–28. doi:10.1016/S1474-4422(09)70299-6
30. Burgold S, Bittner T, Dorostkar MM, Kieser D, Fuhrmann M, Mitteregger G, et al. In vivo multiphoton imaging reveals gradual growth of newborn amyloid plaques over weeks. Acta Neuropathol (2011) 121:327–35. doi:10.1007/s00401-010-0787-6
31. Hefendehl JK, Wegenast-Braun BM, Liebig C, Eicke D, Milford D, Calhoun ME, et al. Long-term in vivo imaging of beta-amyloid plaque appearance and growth in a mouse model of cerebral beta-amyloidosis. J Neurosci (2011) 31:624–9. doi:10.1523/JNEUROSCI.5147-10.2011
32. Yan P, Bero AW, Cirrito JR, Xiao Q, Hu X, Wang Y, et al. Characterizing the appearance and growth of amyloid plaques in APP/PS1 mice. J Neurosci (2009) 29:10706–14. doi:10.1523/JNEUROSCI.2637-09.2009
33. Christie RH, Bacskai BJ, Zipfel WR, Williams RM, Kajdasz ST, Webb WW, et al. Growth arrest of individual senile plaques in a model of Alzheimer’s disease observed by in vivo multiphoton microscopy. J Neurosci (2001) 21:858–64.
34. Burgold S, Filser S, Dorostkar MM, Schmidt B, Herms J. In vivo imaging reveals sigmoidal growth kinetic of beta-amyloid plaques. Acta Neuropathol Commun (2014) 2:30. doi:10.1186/2051-5960-2-30
35. Mawuenyega KG, Sigurdson W, Ovod V, Munsell L, Kasten T, Morris JC, et al. Decreased clearance of CNS beta-amyloid in Alzheimer’s disease. Science (2010) 330:1774. doi:10.1126/science.1197623
36. Matveev SV, Spielmann HP, Metts BM, Chen J, Onono F, Zhu H, et al. A distinct subfraction of Aβ is responsible for the high-affinity Pittsburgh compound B-binding site in Alzheimer’s disease brain. J Neurochem (2014) 131:356–68. doi:10.1111/jnc.12815
37. Franco R, Cedazo-Minguez A. Successful therapies for Alzheimer’s disease: why so many in animal models and none in humans? Front Pharmacol (2014) 5:146. doi:10.3389/fphar.2014.00146
38. Cuadrado-Tejedor M, Garcia-Osta A. Current animal models of Alzheimer’s disease: challenges in translational research. Front Neurol (2014) 5:182. doi:10.3389/fneur.2014.00182
39. Medina M, Avila J. The need for better AD animal models. Front Pharmacol (2014) 5:227. doi:10.3389/fphar.2014.00227
40. Atwood CS, Martins RN, Smith MA, Perry G. Senile plaque composition and posttranslational modification of amyloid-beta peptide and associated proteins. Peptides (2002) 23:1343–50. doi:10.1016/S0196-9781(02)00070-0
41. Bateman RJ, Munsell LY, Morris JC, Swarm R, Yarasheski KE, Holtzman DM. Human amyloid-beta synthesis and clearance rates as measured in cerebrospinal fluid in vivo. Nat Med (2006) 12:856–61. doi:10.1038/nm1438
42. Bateman RJ, Siemers ER, Mawuenyega KG, Wen G, Browning KR, Sigurdson WC, et al. A gamma-secretase inhibitor decreases amyloid-beta production in the central nervous system. Ann Neurol (2009) 66:48–54. doi:10.1002/ana.21623
43. Steinhauser ML, Lechene CP. Quantitative imaging of subcellular metabolism with stable isotopes and multi-isotope imaging mass spectrometry. Semin Cell Dev Biol (2013) 24:661–7. doi:10.1016/j.semcdb.2013.05.001
44. Steinhauser ML, Bailey AP, Senyo SE, Guillermier C, Perlstein TS, Gould AP, et al. Multi-isotope imaging mass spectrometry quantifies stem cell division and metabolism. Nature (2012) 481:516–9. doi:10.1038/nature10734
45. Quintana C, Bellefqih S, Laval JY, Guerquin-Kern JL, Wu TD, Avila J, et al. Study of the localization of iron, ferritin, and hemosiderin in Alzheimer’s disease hippocampus by analytical microscopy at the subcellular level. J Struct Biol (2006) 153:42–54. doi:10.1016/j.jsb.2005.11.001
46. Quintana C, Wu TD, Delatour B, Dhenain M, Guerquin-Kern JL, Croisy A. Morphological and chemical studies of pathological human and mice brain at the subcellular level: correlation between light, electron, and nanosims microscopies. Microsc Res Tech (2007) 70:281–95. doi:10.1002/jemt.20403
47. Lechene C, Hillion F, Mcmahon G, Benson D, Kleinfeld AM, Kampf JP, et al. High-resolution quantitative imaging of mammalian and bacterial cells using stable isotope mass spectrometry. J Biol (2006) 5:20. doi:10.1186/jbiol42
48. Zhang DS, Piazza V, Perrin BJ, Rzadzinska AK, Poczatek JC, Wang M, et al. Multi-isotope imaging mass spectrometry reveals slow protein turnover in hair-cell stereocilia. Nature (2012) 481:520–4. doi:10.1038/nature10745
49. Guillermier C, Fazeli PK, Kim S, Lun M, Zuflacht JP, Milian J, et al. Imaging mass spectrometry demonstrates age-related decline in human adipose plasticity. JCI Insight (2017) 2:e90349. doi:10.1172/jci.insight.90349
50. Jankowsky JL, Slunt HH, Ratovitski T, Jenkins NA, Copeland NG, Borchelt DR. Co-expression of multiple transgenes in mouse CNS: a comparison of strategies. Biomol Eng (2001) 17:157–65. doi:10.1016/S1389-0344(01)00067-3
51. Mittendorfer B, Patterson BW, Klein S. Effect of weight loss on VLDL-triglyceride and apoB-100 kinetics in women with abdominal obesity. Am J Physiol Endocrinol Metab (2003) 284:E549–56. doi:10.1152/ajpendo.00379.2002
53. Mathis CA, Wang Y, Holt DP, Huang GF, Debnath ML, Klunk WE. Synthesis and evaluation of 11C-labeled 6-substituted 2-arylbenzothiazoles as amyloid imaging agents. J Med Chem (2003) 46:2740–54. doi:10.1021/jm030026b
54. Su Y, D’angelo GM, Vlassenko AG, Zhou G, Snyder AZ, Marcus DS, et al. Quantitative analysis of PiB-PET with FreeSurfer ROIs. PLoS One (2013) 8:e73377. doi:10.1371/journal.pone.0073377
55. Kendall C, Sklash MG, Bullen TD. Isotope tracers of water and solute sources in catchments. In: Trudgill ST, editor. Solute Modelling in Catchment Systems. New York: John Wiley and Sons Ltd. (1995). p. 261–303.
56. Benjamini Y, Hochberg Y. Controlling the false discovery rate: a practical and powerful approach to multiple testing. J R Stat Soc B (1995) 57:289–300.
57. Esparza TJ, Wildburger NC, Jiang H, Gangolli M, Cairns NJ, Bateman RJ, et al. Purification and Quantitative Characterization of Soluble HMW Amyloid-beta from Alzheimer’s disease Brain Lysates. Sci Rep (2016) 6:38187. doi:10.1038/srep38187
58. Bateman RJ, Aisen PS, De Strooper B, Fox NC, Lemere CA, Ringman JM, et al. Autosomal-dominant Alzheimer’s disease: a review and proposal for the prevention of Alzheimer’s disease. Alzheimers Res Ther (2011) 3:1. doi:10.1186/alzrt59
59. Mawuenyega KG, Kasten T, Sigurdson W, Bateman RJ. Amyloid-beta isoform metabolism quantitation by stable isotope-labeled kinetics. Anal Biochem (2013) 440:56–62. doi:10.1016/j.ab.2013.04.031
60. Wildburger NC, Wood PL, Gumin J, Lichti CF, Emmett MR, Lang FF, et al. ESI-MS/MS and MALDI-IMS localization reveal alterations in phosphatidic acid, diacylglycerol, and DHA in glioma stem cell xenografts. J Proteome Res (2015) 14:2511–9. doi:10.1021/acs.jproteome.5b00076
Keywords: Alzheimer’s disease, Aβ plaques, plaque dynamics, stable isotope tracer, SILK–SIMS
Citation: Wildburger NC, Gyngard F, Guillermier C, Patterson BW, Elbert D, Mawuenyega KG, Schneider T, Green K, Roth R, Schmidt RE, Cairns NJ, Benzinger TLS, Steinhauser ML and Bateman RJ (2018) Amyloid-β Plaques in Clinical Alzheimer’s Disease Brain Incorporate Stable Isotope Tracer In Vivo and Exhibit Nanoscale Heterogeneity. Front. Neurol. 9:169. doi: 10.3389/fneur.2018.00169
Received: 21 January 2018; Accepted: 06 March 2018;
Published: 22 March 2018
Edited by:
Kempuraj Duraisamy, University of Missouri, United StatesReviewed by:
Krishnan Prabhakaran, Norfolk State University, United StatesClaire J. Garwood, University of Sheffield, United Kingdom
Copyright: © 2018 Wildburger, Gyngard, Guillermier, Patterson, Elbert, Mawuenyega, Schneider, Green, Roth, Schmidt, Cairns, Benzinger, Steinhauser and Bateman. This is an open-access article distributed under the terms of the Creative Commons Attribution License (CC BY). The use, distribution or reproduction in other forums is permitted, provided the original author(s) and the copyright owner are credited and that the original publication in this journal is cited, in accordance with accepted academic practice. No use, distribution or reproduction is permitted which does not comply with these terms.
*Correspondence: Norelle C. Wildburger, n.wildburger@wustl.edu;
Randall J. Bateman, batemanr@wustl.edu