Delta protocadherin 10 is regulated by activity in the mouse main olfactory system
- Department of Biomedical Sciences, Cornell University, Ithaca, NY, USA
Olfactory sensory neurons (OSNs) are thought to use activity-dependent and independent mechanisms to regulate the expression of axon guidance genes. However, defining the molecular mechanisms that underlie activity-dependent OSN guidance has remained elusive. Only a handful of genes have been identified whose expression is regulated by activity. Interestingly, all of these genes have been shown to play a role in OSN axon guidance, underscoring the importance of identifying other genes regulated by activity. Furthermore, studies suggest that more than one downstream mechanism regulates target gene expression. Thus, both the number of genes regulated by activity and how many total mechanisms control this expression are not well understood. Here we identify delta protocadherin 10 (pcdh10) as a gene regulated by activity. Delta protocadherins are members of the cadherin superfamily, and pcdh10 is known to be important for axon guidance during development. We show pcdh10 is expressed in the nasal epithelium and olfactory bulb in patterns consistent with providing guidance information to OSNs. We use naris occlusion, genetic manipulations, and pharmacological assays to show pcdh10 can be regulated by activity, consistent with activation via the cyclic nucleotide-gated channel. Transgenic analysis confirms a potential role for pcdh10 in OSN axon guidance.
Introduction
During development, each olfactory sensory neuron (OSN) must extend an axon from the nasal epithelium to the olfactory bulb. Within the bulb, each axon will terminate in structures of neuropil called glomeruli. Although there are ∼1800 glomeruli, each OSN will terminate within just one glomerulus. Remarkably, this pattern appears highly stereotyped. OSNs expressing a given odorant receptor will reproducibly converge upon glomeruli located at apparently defined positions within the olfactory bulb (Sakano, 2010).
Recent studies suggest that activity may be a critical component of OSN guidance. Loss of spontaneous neuronal activity can delay glomerular formation (Yu et al., 2004). Similarly, mutations in the hyperpolarization-activated cyclic nucleotide-gated (HCN) channel can also affect later stages of OSN outgrowth and glomerular morphology (Mobley et al., 2010). However, loss of the cyclic nucleotide-gated (CNG) channel, the primary mediator of electrical signaling in OSNs, has apparently minimal effects on the glomerular map (Lin et al., 2000). Why some mutations that affect electrical activity can have a strong effect on OSN guidance while others are more subtle is still unclear.
Perhaps the most significant insight regarding activity and OSN guidance has been gained from studies manipulating cAMP signaling. It has long been known the specific odorant receptor expressed by an OSN plays a part in guidance (Mombaerts et al., 1996). Transgenic and knockout studies showed altering production of cAMP levels downstream of the receptor can affect OSN targeting (Imai et al., 2006; Zou et al., 2007). These studies implicated two different receptor-dependent mechanisms. At early stages of neuronal outgrowth, alterations in levels of PKA can affect expression of genes such as semaphorin3A. At later stages of development, activity mediated via the CNG channel appears to regulate genes such as kirrel2/3. These studies have led to a two-stage model where the initial phase of OSN guidance is mediated in part by genes regulated by PKA while terminal stages of guidance are determined in part by genes regulated via the CNG channel (Imai and Sakano, 2008). Thus, changes in activity, broadly defined to include electrical signaling as well as second messengers (Zou et al., 2009), can affect OSN axon guidance.
But since these initial studies, only one other gene (BIG2) has been functionally proven to be affected by changes in activity (Kaneko-Goto et al., 2008). In total, less than 10 genes are known to be regulated by either pathway (Sakano, 2010). Furthermore, studies on BIG2 suggest more than one mechanism exists to regulate target gene expression by the CNG channel (Imai and Sakano, 2008; Kaneko-Goto et al., 2008). In order to better understand the role of activity in OSN guidance, and to determine how many pathways exist to regulate the expression of genes by activity, it is critical to first identify additional candidate genes.
Here we show protocadherin 10 (pcdh10) is regulated by activity in the mouse olfactory epithelium. Pcdh10 is a member of the delta protocadherin subfamily, which in turn is part of the cadherin superfamily (Redies et al., 2005). Although there are some 50 different protocadherins, mutant analysis has proven loss of pcdh10 alone can influence different aspects of development and postnatal life. Deletion analysis of pcdh10 in mice revealed significant defects in axon guidance within the cortex (Uemura et al., 2007). In pcdh10 mutants, striatal neuron outgrowth was affected. Loss of striatal neuron pathways in turn appears to produce defects in corticothalamic and thalamocortical projections. Furthermore, genome wide association studies have implicated pcdh10 in autism (Morrow et al., 2008), consistent with a role in nervous system development. In this same study, pcdh10 was described as being up-regulated in hippocampal cultures under conditions that increase neuronal activity. These data collectively argue that pcdh10 is important for neural development and can be regulated by activity.
Here we examine the regulation of pcdh10 expression in the mouse olfactory system. We show pcdh10 is expressed in a mosaic pattern within the epithelium, consistent with a role in axon guidance or synaptogenesis in OSNs. We use naris occlusion and a knockout mutation in the cyclic nucleotide-gated channel subunit A2 (CNGA2) channel to show reductions in odorant-evoked activity can negatively affect pcdh10 expression. We further demonstrate using epithelial explants that addition of forskolin can increase pcdh10 expression. Finally, we show in a transgenic model that misexpression of pcdh10 in OSNs has an effect on late-stage axonal phenotypes.
Materials and Methods
Animal Use
All protocols for treatment and breeding of animals were approved by the Cornell IACUC. Swiss-Webster and C57Bl/6 mice were used for expression studies and naris occlusion assays. The day a vaginal plug was observed was considered day P0.5.
Naris Occlusion
Occlusion was accomplished by cauterizing one nostril of P0 pups briefly with a soldering iron set to 350°C. Closure was monitored daily and animals re-cauterized as needed. Animals were sacrificed 12–15 days after occlusion.
Generation of Transgenic Mice
About 5.4 kb of the rat olfactory marker protein (OMP) promoter upstream of the ATG was fused to a pcdh10 isoform (NM011043.2). An internal ribosome entry site was inserted at the 3′ end followed by eGFP and a bovine growth hormone polyA sequence. Transgenic animals were produced by the Cornell Transgenic Mouse Facility. Four independent inserts were obtained and two were used for analysis.
Single and double-Label in situ Hybridization
In situ hybridization was done as previously described (Rodriguez et al., 2008). In brief, 20 μm fresh-frozen cryosections were fixed in 4% paraformaldehyde, washed with PBS, and acetylated with 0.25% acetic anhydride in 0.1 M triethanolamine, pH 8.0. Slides were washed again and blocked for 2 h. Slides were hybridized with digoxigenin and/or biotin-labeled antisense RNA probes for 48 h at 60°C. Slides were washed at 60°C with 5× SSC and then with 0.2× SSC, cooled to room temperature and blocked with TNB reagent (Perkin Elmer). Alkaline phosphatase conjugated anti-digoxigenin antibody was applied to slides (Roche) in block overnight at 4°C. For single color in situ hybridizations, slides were washed with B1 buffer (100 mM Tris pH 7.4, 150 mM NaCl), followed by B3 buffer (100 mM Tris pH 9.5, 50 mM MgCl2, 100 mM NaCl) and reacted in NBT/BCIP (Promega).
For double-label fluorescence in situ hybridization, bound biotinylated probe was detected using the tyramide signal amplification (TSA) kit as per manufacturer’s instructions (Perkin Elmer). Digoxigenin-bound probe was detected with the HNPP kit as per manufacturer’s instructions (Roche). To detect both probes, slides were first reacted with the TSA kit, washed in fast red buffer (100 mM Tris pH 8.0, 50 mM MgCl2, 100 mM NaCl), and incubated in Texas Red/HNPP solution at room temperature. The HNPP step was repeated, and slides were rinsed in running tap water for 5 min, mounted in 70% glycerol with DAPI, and analyzed using a Leica LSM 510 Meta confocal microscope. To analyze co-expression, five optical slices (each 3 μm thick) of a given visual field were combined into a z-stack, and all five images assessed for colocalization.
Probe sequences: pcdh10 (NM_001098170 – nt 856–3000, 3070–3276, 3487–3976), kirrel2 (NM_172898 – nt 242–1077), kirrel3 (NM_001190911 – nt 500–1506, 500–2457), neuropilin-1 (NM_008737 – nt 1203–1787, 1787–2751), plexinA1 (NM_008881 – nt 485–1371, 752–1788), MOR28 NM_001170918 (1520–1605), SR1 (NM_147062 – nt 1027–1122), OR78 (NM_130866 – nt 1219–2190), OMP (IMAGE clone IRAKp961I03127Q).
Antibodies and Immunohistochemistry
Cyclic nucleotide-gated channel subunit A2 antibody was purchased from Abcam (ab79261). Olfactory bulbs from CNGA2 heterozygous mice were fixed in 10% neutral buffered formalin overnight and embedded in paraffin. 5μm sections were collected and dried at 37°C overnight. Sections were deparaffinized and microwaved in antigen retrieval buffer (10 mM Tris pH 9.0, 1 mM EDTA, 0.05% Tween 20) 5 × 10 min on low power. Slides were cooled to room temperature and washed in PBST (PBS, 0.05% Tween20). Slides were blocked in TNB before incubation with primary antibody overnight at 4°C. Slides were washed in PBST and incubated with biotinylated goat anti-rabbit antibody (Vector Labs) in TNB at room temperature. Slides were washed in PBST and incubated in streptavidin–HRP (Invitrogen) for 30 min. Signal was visualized with AEC substrate as per manufacturer’s instructions (Invitrogen). Antibodies directed against phosphocreb were obtained from Millipore (06-519).
Pcdh10 antibody was produced by Biogenes GmBH (Berlin, Germany). Rabbits were injected with adjuvant and the peptide CSPSRSTDAEHN. Pcdh10 immunohistochemistry was performed on 20 μm thick fixed or fresh-frozen cryosections. Sections were postfixed in 4% phosphate-buffered paraformaldehyde, washed with PBS, and endogenous peroxidase quenched by incubation in 3% hydrogen peroxide. Slides were washed and antigen retrieval accomplished by heating slides in 10 mM sodium citrate (pH 9.0) for 1 h at 80°C. Slides were washed and blocked in 10% non-fat dried milk containing 10% heat inactivated goat serum. Antibody was incubated overnight at 4°C, and then subsequently at 37°C for an additional 2 h. Secondary and tertiary reactions were performed as described above for the CNGA2 antibody.
Glomerular Map
Coronal sections from P0 olfactory bulbs immunostained with pcdh10 antibody were photographed. The glomerular layer of each image was cropped, inverted, and imported into DeltaViewer 2.11. Sections were manually aligned and reconstructed into three-dimensional images.
Beta-Galactosidase Activity
Whole mount lacZ staining was performed on olfactory bulbs as follows: tissue was dissected and fixed in 2% paraformaldehyde/phosphate buffer for 5 min. Olfactory bulbs were washed in PBS and incubated in staining buffer without X-Gal (10 mM PO4 buffer pH 7.4, 150 mM NaCl, 1 mM MgCl2, 3 mM ferrous cyanide, 3 mM ferric cyanide, and 0.3% Triton X-100) heated to 37°C. This buffer was then replaced with staining buffer containing 0.2% X-Gal and incubated at 37°C. To quantitate interglomerular distance, olfactory bulbs were fixed in 4% paraformaldehyde and 20 μm cryosections processed for beta-galactosidase activity. The interglomerular distance was calculated by counting the number of sections collected between lacZ positive glomeruli and multiplying by 20.
Explant Cultures
P3–P5 epithelia were dissected in ice-cold Modified Eagles Media (Invitrogen) and the cartilage removed. Epithelia were finely minced with a razor blade and digested for 10 min in MEM containing 5 mg/ml dispase, 1mg/ml collagenase IV, 1 mg/ml hyaluronidase, and 50 μg/ml DNAase I, as described (Ronnett et al., 1991). Digests were neutralized with media containing serum (1× MEM, 10% dialyzed FBS, 5% Nu-serum, 1× anti–anti), and strained through a 40-μm cell-strainer (Becton Dickson). Explants were recovered by rinsing with 1× MEM and plated in serum-containing media in a humidified incubator at 37°C with 6% CO2.
Pharmacological Treatments
To determine phosphocreb induction patterns, explant cultures were incubated with forskolin (Sigma) 16–24 h after plating. To inhibit PKA, RpcAMPs (40 μM, Enzo Life Sciences) was added immediately after plating explants for 16–24 h prior to addition of forskolin (20 μM) for 1 h.
Quantitative RT-PCR
Quantitative RT-PCR was performed using an ABI7500 system. To generate substrate for the qRT-PCR reaction, total RNA was isolated from explant cultures (1–2 μg total per culture) and reverse transcribed using oligo-dT and Superscript III (Invitrogen) as per manufacturer’s instructions. Primers for qRT-PCR were designed with primerbank2. The endogenous control was ribosomal protein like 19 (rpl19). 2× master mix containing low Rox was purchased from Quanta Biosystems, and the reaction performed according to manufacturer’s instruction. Relative expression levels were determined using the 2−ddCt approach. SE was calculated from the technical replicates for each gene. Primer sequences used are as follows:
Kirrel2 CACCAGCCTTTCTGAGGGG GGCTTCCACTAGGAACCTGC
Kirrel3 AGAACACCATTCAACTCCAACC CTCCCGCTCACAAAGCTCAA
OMP TCCGTCTACCGCCTCGATTT CGTCTGCCTCATTCCAATCCA
GAP43 TGGTGTCAAGCCGGAAGATAA GCTGGTGCATCACCCTTCT
Pcdh10 GGTTCCCATCACCACAATCAG CAGCCTTACCTCGTTGGACAA
Rpl19 ATGAGTATGCTCAGGCTACAGA GCATTGGCGATTTCATTGGTC
Pixel Intensity
JPEG images of sections were imported into ImageJ3, converted to 8-bit grayscale, and thresholded. Thresholds were defined manually, but were performed blind. Areas of interest were manually determined, and the number of positive pixels determined using the “measure” function. For the naris occlusion analysis, pixel intensity on the occluded side was normalized per section by dividing by the intensity on the open side. Sixteen to 24 sections from three to four separate occlusion experiments were analyzed for each gene. The ratios were then averaged. Because the ratios included values less than and greater than 1, SE was calculated by first log-transforming the data. Student’s t-test (two-tailed) was then performed on the transformed data, and a p-value calculated. For the CNGA2 pixel analysis, 35–61 sections were analyzed per gene from three separate CNGA2 mutants and controls. This analysis was performed blind. Intensity values for any given gene were averaged for each animal, which was then normalized to a littermate matched control. Each pair (mutant and control) were processed simultaneously, and reacted for the same amount of time prior to the analysis. The three ratios for any given gene were then averaged. SE and p-values were calculated as described above for the naris occlusion.
Results
Pcdh10 is Expressed in Subsets of OSNs in the Epithelium and in Spatially Defined Locations within the Olfactory Bulb
We previously found two other delta protocadherins (pcdh7 and pcdh17) are expressed by subsets of OSNs, consistent with a role in guidance and/or synaptogenesis (Williams et al., 2007). As pcdh10, another delta family member, has been functionally proven to mediate axon guidance in the brain (Uemura et al., 2007), we examined the expression of pcdh10 in the nasal epithelium and olfactory bulb.
Within the epithelium, pcdh10 is not detectably expressed by in situ hybridization prior to ∼E15. At E17.5, pcdh10 is expressed by subsets of OSNs (Figures 1A,B; compare with expression of OMP, Figure 1C). This distribution is not even throughout the epithelium, but appears more intense along the medial aspect. Expression is also noticeably variable, with strong expression in some OSNs and weaker, more diffuse signal in others. As the animal matures, the bulk of pcdh10 expression begins to shift more laterally. In the adult, pcdh10 is expressed most strongly along the ventrolateral epithelium, although the original expression pattern along the dorsomedial aspect can still be identified (Figure 1D).
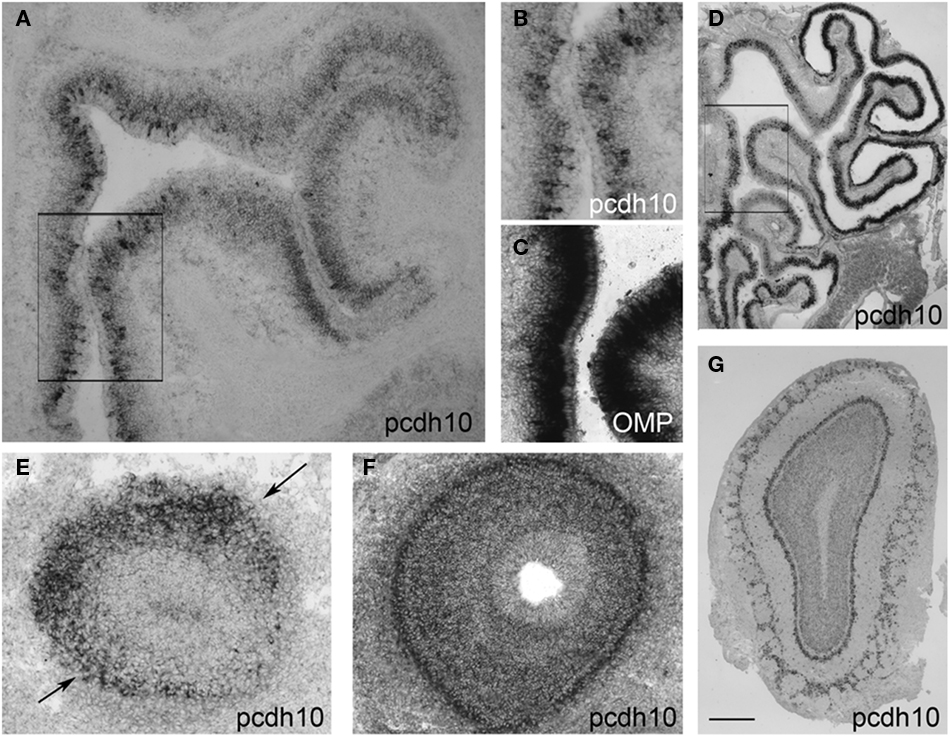
Figure 1. Pcdh10 expression in the olfactory system. (A) Pcdh10 is expressed most strongly in the medial epithelium at E17.5. (B) Boxed area shown in (A) at higher magnification. Pcdh10 expression is clearly punctate in some OSNs and diffuse in others. Expression levels of pcdh10 within each OSN also varies. (C) OMP labels mature OSNs. (D) In contrast to embryonic and early postnatal expression, pcdh10 expression in adulthood is highest in the ventrolateral epithelium. However, the original pattern observed at E17.5 can still be seen in adulthood [compare boxed areas in (A) and (D)]. In all bulbar images, medial is to the right. (E) Pcdh10 expression in E14.5 olfactory bulb labels a broad domain in the dorsolateral bulb (black arrows), but is weak or absent in the medial bulb. (F,G) Pcdh10 expression in E17.5 (F) and adult (G) bulbs appears uniformly distributed. Scale bar = 90 μm (A), 30 μm (B,C), 250 μm (D), 50 μm (E,F), 125 μm (G).
Within the olfactory bulb, pcdh10 labels a specific subdomain along the dorsolateral surface at E14.5 (Figure 1E). This expression pattern is reminiscent of that observed for pcdh7 and pcdh17, which label complementary domains in the olfactory bulb (Williams et al., 2007). Unlike these other delta family members, however, pcdh10 expression within the bulb becomes more uniform at E17.5 (Figure 1F), and is essentially distributed throughout the bulb at postnatal and adult stages (Figure 1G).
Next we raised an antibody against pcdh10. Expression was clearly detectable in glomeruli, consistent with axonal OSN expression. However, we could not reliably detect axonal expression. Because of this, it is possible that some of our signal within glomeruli is due to mitral or periglomerular expression. In keeping with the mosaic expression of pcdh10 RNA within the epithelium (Figure 1), a subset of glomeruli are pcdh10-positive at P0 (Figure 2A). Interestingly, among pcdh10-positive glomeruli, expression appears variable. Some pcdh10-positive glomeruli are clearly more intensely stained than others (Figures 2A,C). This is reminiscent of the pattern observed in the epithelium, where some OSNs express higher levels of pcdh10 RNA than others (Figures 1A,B). As postnatal stages progresses, the glomerular signal became stronger (P12; Figure 2B). Variation in glomerular intensity among pcdh10-positive glomeruli is still present, but less obvious than at P0 (Figure 2D). A prior report on pcdh10 expression in the olfactory system (Aoki et al., 2003) showed clear axonal expression and pcdh10-positive glomeruli at P7. Unlike this prior study, we were unable to consistently obtain axonal signal. This may be due to differences in antibodies and reaction conditions. However, variable glomerular signal within the bulb was also seen in this prior study.
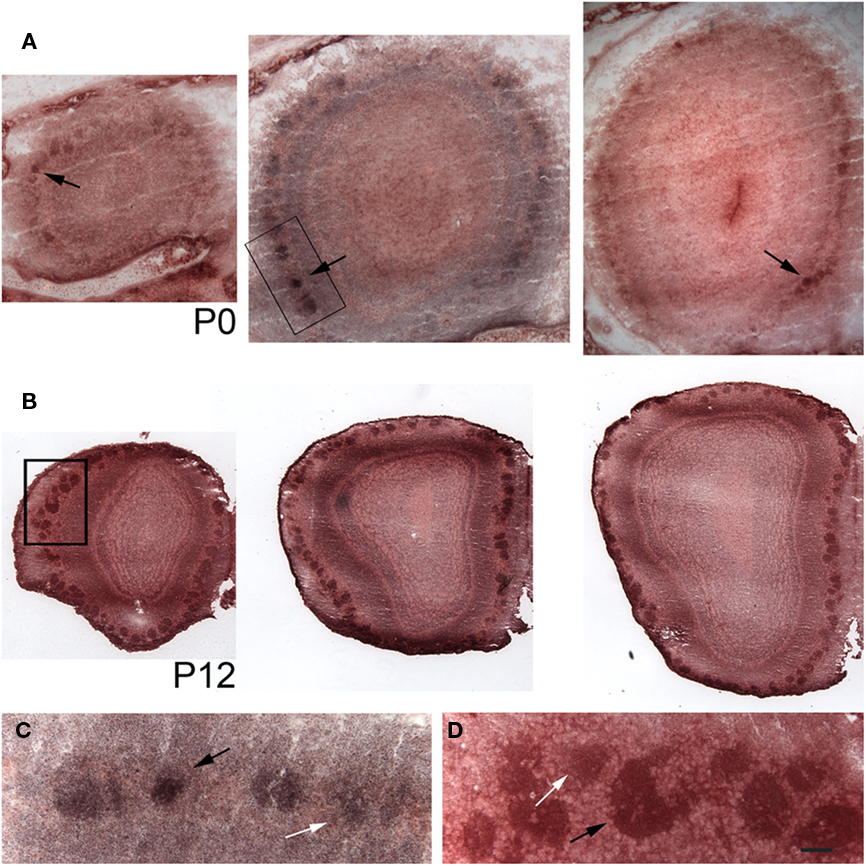
Figure 2. Pcdh10 is expressed in glomeruli. Cryosections from olfactory bulb immunostained with an antibody directed against pcdh10. In all images, medial is to the right. (A) Representative sections from the anterior, middle, and posterior olfactory bulb at P0. Glomerular signal at this stage is clearly variable, with some glomeruli (black arrows) showing increased expression relative to others. (B) Sections from the anterior, middle, and posterior olfactory bulb at P12. Glomerular signal is in general higher at this age than at P0. (C) Higher magnification of boxed area shown in (A). White and black arrows indicate glomeruli with different levels of pcdh10 expression. (D) Higher magnification of boxed area shown in (B). White and black arrows indicate glomeruli with different levels of pcdh10 expression. Scale bar = 100 μm (A), 200 μm (B), 33 μm (C,D).
To determine the pattern of pcdh10 expression in glomeruli during development, we generated a glomerular map from P0 animals (Figure 3; Movie S1 in Supplementary Material). The map revealed bilateral glomerular expression of pcdh10 (Figures 3A,C). Pcdh10 was expressed most strongly in the anterior bulb along the lateral aspect, with a slight dorsal bias. In the posterior bulb, however, pcdh10 was expressed primarily along the medial aspect, with a slight ventral bias. This symmetric expression is highly intriguing, and is reminiscent of the medial–lateral symmetry observed in convergence by OSNs expressing specific odorant receptors.
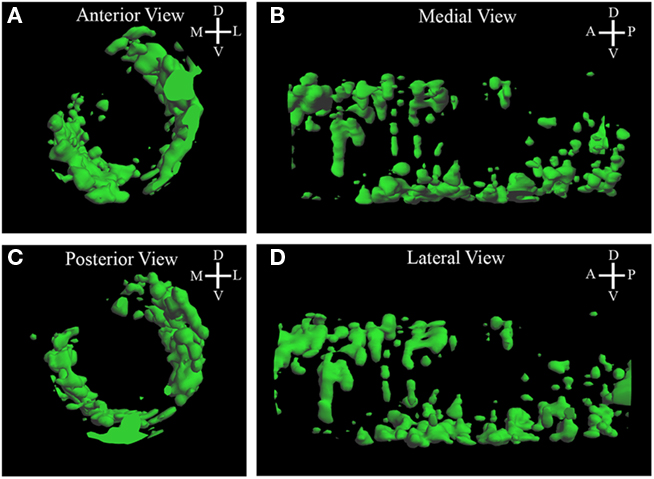
Figure 3. Three-dimensional reconstruction of Pcdh10 glomerular expression in P0 bulb. (A,D) In the anterior bulb pcdh10 is detected primarily in lateral glomeruli. (B,C) In the posterior olfactory bulb, pcdh10 is detected primarily in ventral glomeruli.
Pcdh10 Expression is Affected by Naris Occlusion
We next looked to determine whether activity affects pcdh10 expression. We performed naris occlusion to reduce odorant-evoked activity (Kaneko-Goto et al., 2008). In this approach, one naris is surgically closed while the open naris serves as a control. Occlusion presumably reduces access of odors to the epithelium, lowering odorant receptor activity. Naris occlusion was performed at P0, and the animals sacrificed at P12–P15.
We found that pcdh10 expression was consistently down-regulated in the closed naris as compared to the open naris (Figures 4A,C; n = 10), suggesting that odorant-evoked activity can regulate pcdh10 at the transcriptional level. This striking result was highly reminiscent of the phenotype observed for kirrel2 in a similar naris occlusion paradigm (Kaneko-Goto et al., 2008). In those experiments, expression of kirrel2 is down-regulated in the occluded naris relative to the open naris. Kirrel3, on the other hand, is up-regulated on the occluded side. We therefore also examined kirrel2, kirrel3, and OMP for changes in expression under these conditions. We confirmed kirrel2 (n = 13) is down-regulated in the epithelium of the occluded naris (Figure 4D), while kirrel3 is up-regulated (n = 10; Figure 4E). Kirrel3 was not always obviously up-regulated in all animals (n = 3). However, we noted that animals with longer closure times generally showed stronger and more obvious changes in kirrel3 expression (data not shown). Finally, OMP (n = 11) expression was apparently unaffected by occlusion (Figure 4B). OMP is not thought to be regulated by activity.
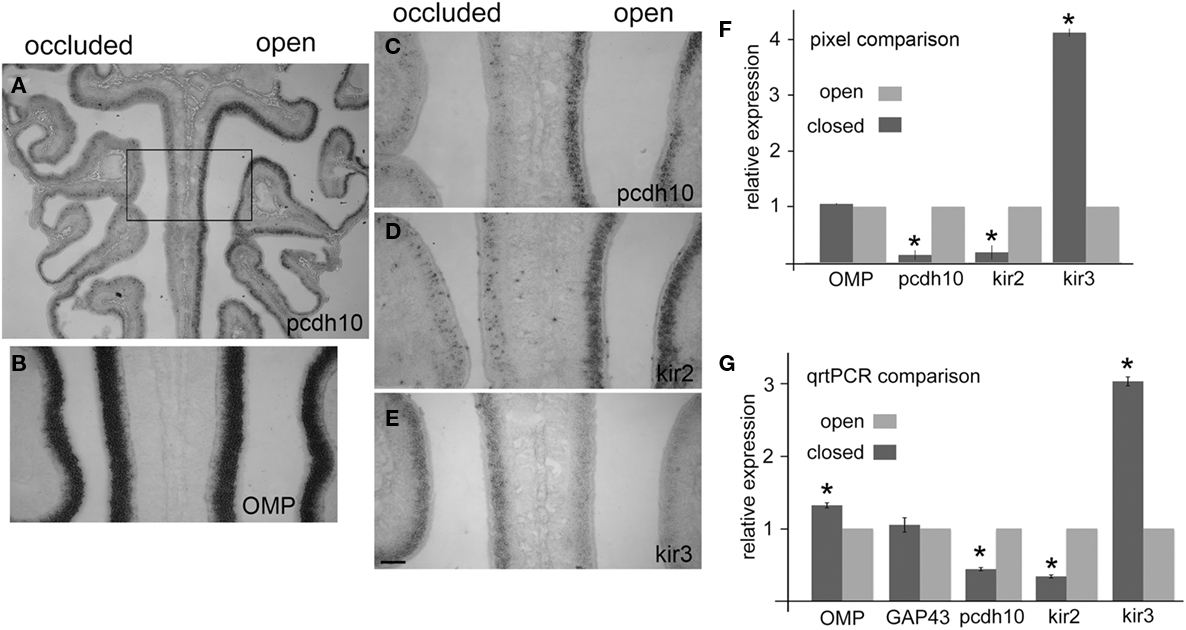
Figure 4. Pcdh10 epithelial expression is reduced after naris occlusion. In all images, the occluded side is on the left. (A) Expression of pcdh10 on the occluded side is highly reduced relative to the open side. (B) OMP expression is apparently unaffected by occlusion. (C) Higher magnification of boxed area shown in (A) shows strong reduction in pcdh10 expression on the occluded side. (D) Kirrel2 is down-regulated in expression on the occluded side. (E) Kirrel3 expression shows the opposite expression pattern, and is up-regulated on the occluded side. (F) Pixel analysis comparing signal intensities on the occluded and open side showed significant reductions in expression for pcdh10 and kirrel2, while kirrel3 was significantly up-regulated. OMP expression was unaffected. OMP (p = 0.08); pcdh10, kirrel2, kirrel3 (p < 0.005), (G) Epithelia from six occluded animals were split in half. Quantitative RT-PCR was performed to compare expression of each half-epithelium from the occluded naris against the corresponding half-epithelium from the open naris. Expression of OMP was slightly (1.3×) higher in the occluded side relative to the open side (p < 0.005). GAP43 was unchanged (p = 0.98). Pcdh10 expression on the occluded side was ∼50% of the open side (p < 0.005), similar to kirrel2 (35% of open side; p < 0.005). Kirrel3 was increased three-fold on the occluded relative to the open side (p < 0.005). Scale bar = 250 μm (A) 100 μm (B–E).
We quantitated changes in pcdh10, kirrel2, kirrel3, and OMP by comparing pixel intensity values on the occluded side to the open side in each section (Figure 4F). The open side for each section serves as an internal control for each comparison, controlling for variation in reaction times between replicate experiments. Sixteen to 24 sections from four separate experiments were compared for any one gene. Consistent with our qualitative observations, pcdh10 expression was decreased on the occluded side approximately seven-fold (p < 0.005). Kirrel2 was also reduced to a similar extent (p < 0.005). In contrast, kirrel3 was up-regulated four-fold on the occluded side (p < 0.005). OMP was essentially unchanged (1.06-fold; p = 0.08).
We next performed quantitative RT-PCR on epithelia isolated from occluded animals (Figure 4G). Six epithelia were collected and divided in half. Gene expression in the half-epithelium corresponding to the occluded side was compared against that in the open side. Analysis of gene expression in all six epithelia found kirrel2 and pcdh10 expression on the occluded side was reduced on average to ∼50% of the open side (p < 0.005). Kirrel3 was up-regulated three-fold (p < 0.005). Expression of OMP was somewhat elevated on the occluded side (1.3-fold, p < 0.005). OMP expression has been reported to be increased in animals that have been nasally occluded for 3 weeks or more. GAP43 expression appeared unchanged (1.05-fold, p = 0.98). Although the exact fold-changes vary, these results parallel our pixel analysis (Figure 4F), and show reduction of odorant-evoked activity reduces pcdh10 expression.
Co-Expression of Pcdh10 and Genes Regulated by Activity
The behavior of pcdh10 in our nasal occlusion experiments is consistent with regulation of pcdh10 expression by activity. We next asked whether or not pcdh10 is co-expressed in OSNs with other genes regulated by activity. Kirrel2 and kirrel3 expression is influenced by the CNG channel, while neuropilin-1 and plexinA1 are thought to be affected by changes in PKA (Imai et al., 2006; Serizawa et al., 2006; Imai and Sakano, 2008). We performed double-label in situ hybridization and tested cells for co-expression by confocal microscopy. We found that 20% of pcdh10-positive cells express neuropilin-1 and 36% express PlexinA1 (Table 1). In contrast, most (96%) pcdh10-positive cells express kirrel2 at E17.5 (Figures 5A–C; Table 1). The converse, however, is not true. Only 39% (Figures 5A–C; n = 366) of kirrel2-positive OSNs express pcdh10. Kirrel2 is therefore expressed in a larger percentage of OSNs as compared with pcdh10. Finally, we found that most (90%) pcdh10-positive cells express OMP at E17.5 (Figures 5D–F; Table 1), indicating pcdh10 is primarily expressed in mature OSNs. This is consistent with the relatively late onset of expression of pcdh10 (after E15; Figure 1), as well as the gradual increase in pcdh10 expression in glomeruli at postnatal stages (Figure 2B).
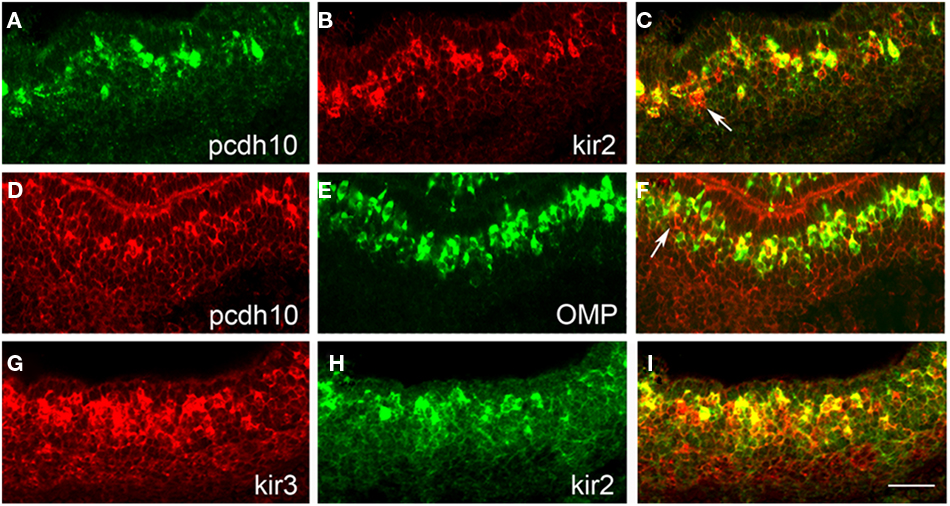
Figure 5. Pcdh10 is co-expressed with kirrel2/kirrel3. (A–C) Double-label in situ hybridization with pcdh10 [(A); green] and kirrel2 [(B); red]. Not all kirrel2-positive cells express pcdh10 [(C); white arrow]. (D–F) Double-label in situ hybridization with pcdh10 [(D); red] and OMP [(E); green]. Pcdh10 is expressed primarily in mature OSNs, although ∼10% appear to be present in immature OSNs [white arrow (F) indicates pcdh10-positive, OMP-negative cell]. (G–I) Double-label in situ hybridization with kirrel3 [(G); red] and kirrel2 [(H); green] at P0 shows significant overlapping expression. Scale bar = 50 μm.
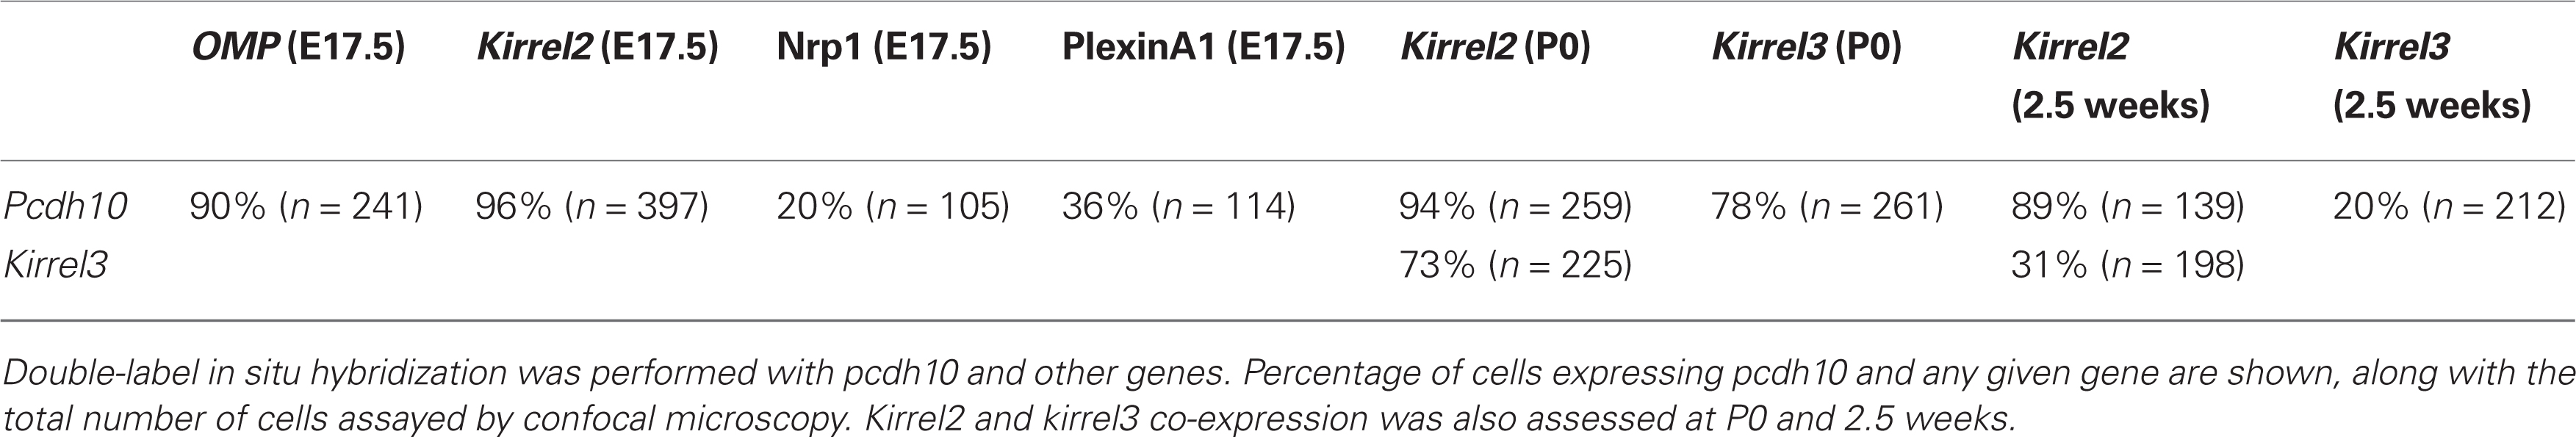
Table 1. Double-label in situ hybridization with pcdh10 and other activity-regulated genes.
Kirrel3 is also regulated by activity but in a manner opposite to that of kirrel2. Interestingly, we found that pcdh10 and kirrel3 also overlap significantly (78%) at P0 (Table 1). We therefore asked whether or not OSNs typically express both kirrels early in development. At P0, 73% of kirrel3-positive OSNs also express kirrel2 (Figures 5G–I; Table 1). Glomerular refinement is known to occur during postnatal life, and is dependent upon activity (Zhao and Reed, 2001). As kirrels are oppositely regulated by activity, we asked whether or not the proportion of OSNs expressing both kirrels changes over time. We found by 2.5 weeks the percentage of OSNs co-expressing kirrels drops to 31% (Table 1). This change in overlap is also reflected in double-label studies with pcdh10. At P0, kirrel3 is expressed in 78% of pcdh10-positive OSNs (Table 1). At 2.5 weeks, however, only 20% of these cells express kirrel3 (Table 1). These studies show that regulation of pcdh10 expression appears to parallel that of kirrel2.
Pcdh10 Expression is Regulated by the CNG Channel
Our naris occlusion studies argue that odorant-evoked activity can regulate pcdh10 expression. To further examine activity and pcdh10 expression, we next used a mutant defective in the CNGA2 gene (Lin et al., 2000). The CNGA2 gene resides on the X chromosome. As a result of random X-inactivation, OSNs will either be CNGA2-positive or CNGA2-negative in heterozygous mutant females. These OSNs segregate from one another, and can be detected in the bulb as CNGA2-positive and -negative glomeruli. Kirrel2 expression is associated with CNGA2-positive glomeruli (Serizawa et al., 2006). To determine if pcdh10 is similarly co-expressed, we examined serial, 5 μm thick olfactory bulb sections in CNGA2 heterozygotes for CNGA2 and pcdh10 expression (Figure 6). We found that pcdh10-positive glomeruli co-localized with CNGA2-positive glomeruli, consistent with regulation of pcdh10 expression by activity.
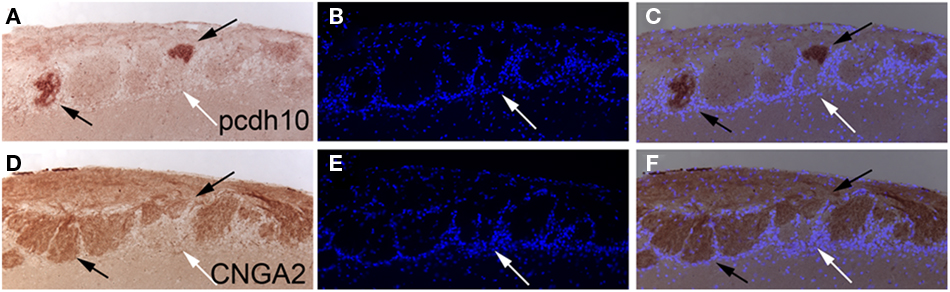
Figure 6. Pcdh10 expression colocalizes with CNGA2 in glomeruli. (A–C) Pcdh10 can be detected in glomeruli within the olfactory bulb (black arrows) in adult CNGA2 heterozygous animals. DAPI-stained cells are shown in blue. (D–F) Alternating section stained with an anti-CNGA2 antibody demonstrating overlap with pcdh10-positive glomeruli. Some glomeruli do not express pcdh10 or CNGA2 (white arrows).
We next asked whether or not CNGA2 mutants had lower levels of pcdh10 expression within the epithelium relative to littermate controls. Despite extensive efforts, we were unable to generate many postnatal CNGA2−/− animals due to severe perinatal lethality (Lin et al., 2000). Some studies implicate odorant activity in utero (Todrank et al., 2011). We therefore examined CNGA2 animals at E16.5 for changes in pcdh10 and kirrel2/3 expression. We found significant reduction in expression of both kirrel2 and pcdh10 (Figures 7A–D; n = 3), with fewer cells expressing either gene relative to control. Only subtle differences were seen for kirrel3 at this age (data not shown).
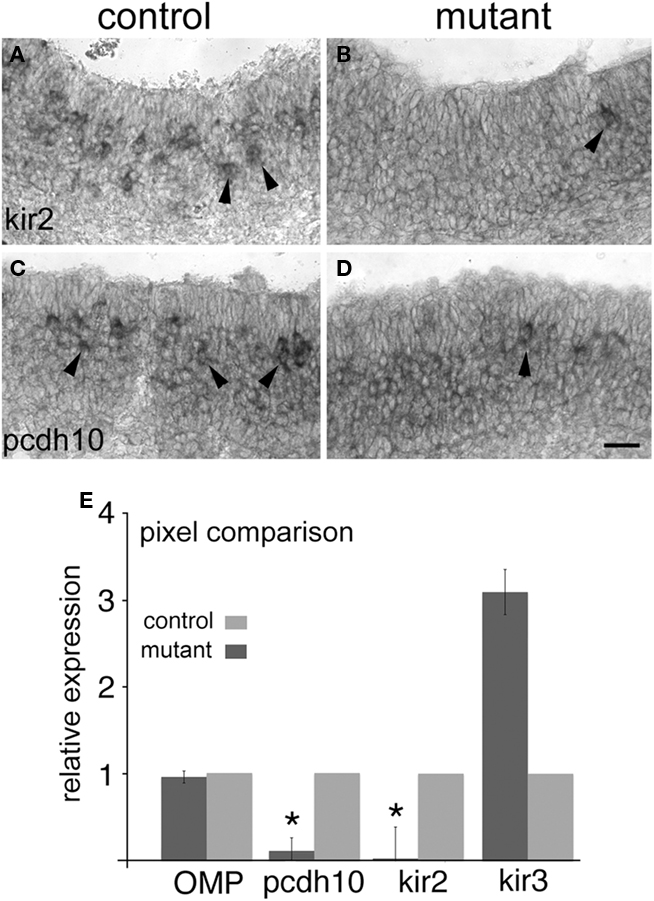
Figure 7. Pcdh10 is reduced in expression in CNGA2 mutants. (A) Expression of kirrel2 in epithelia (arrowheads) of control CNGA2+/+ littermate at E16.5. (B) Expression of kirrel2 in a CNGA2−/− mutant animal (arrowhead) is reduced relative to control. (C) Expression of pcdh10 in control littermate at E16.5. (D) Expression of pcdh10 in a CNGA2−/− mutant. (E) Pixel intensity comparison between epithelia derived from mutant and control animals. Data from three mutant/control pairs (E16.5) were examined for differences in signal intensity. OMP showed no significant difference in expression between mutants and controls (p = 0.69). Pcdh10 expression in CNGA2 mutants was 10% that of control (p < 0.05) while kirrel2 expression was just 2% of control (p < 0.05). Kirrel3 expression was approximately three times that of control, but this difference was not significant (p = 0.31). Scale bar = 50 μm.
To confirm our qualitative impressions, we performed pixel analysis to compare signal strength for these genes in CNGA2 and control epithelia (Figure 7E). This quantification was performed blind to eliminate potential selection bias. We found pcdh10 and kirrel2 were significantly reduced in expression in CNGA2 mutants. Pcdh10 expression was approximately 10% that of control embryos (p < 0.05), while kirrel2 was approximately 2% that of controls (p < 0.05). Kirrel3 was variably increased among the three animals although not in a statistically significant manner (p = 0.31). OMP expression was essentially equal between mutants and controls (95% of control expression in mutants; p = 0.69). These results confirm prior studies on kirrel2/3, Eph/ephrin A5, and BIG2, and extend them by identifying pcdh10 as a gene whose expression can also be regulated by the CNG channel.
Pcdh10 Expression Can be Induced by cAMP
The influence of second messenger systems on gene expression has been previously studied. These studies indicated kirrel2/3 are regulated by cAMP in a non-PKA dependent manner. We tested whether or not pcdh10 is similarly regulated using explant cultures derived from P0 epithelia. Explant cultures were treated with increasing concentrations of forskolin (0, 20, 40, 80 μM) for 1.5 h to drive elevated levels of cAMP. Quantitative RT-PCR showed that expression of pcdh10 can be induced with forskolin (n = 3). Although the levels of induction varied from culture to culture, expression of pcdh10 in general appeared maximal at 20 μM (representative qRT-PCR shown in Figure 8C). We treated explant cultures with 20 μM forskolin for 30–90 min. Western blot analysis showed a rise and fall in phosphocreb expression over this time period, indicating 1 h is likely to be optimal for exposure (Figure 8A).
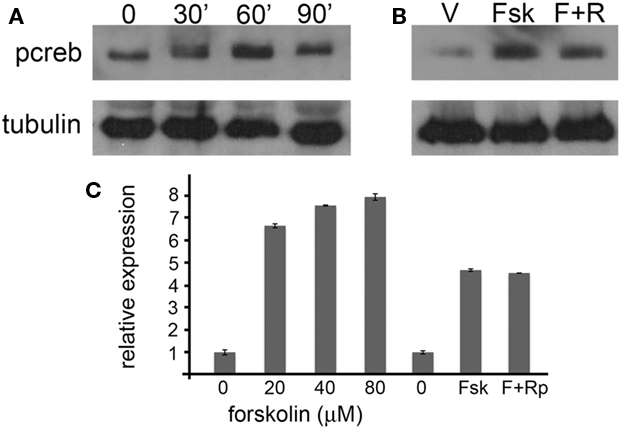
Figure 8. Pcdh10 expression is regulated by cAMP in explants. (A) Ex vivo culture of explants treated with 20 μM forskolin for 0, 30, 60, and 90 min results in a transient increase in phosphocreb signal. (B) Pretreatment of explants with 40 μM RpcAMPs overnight prior to addition of forskolin (20 μM; 1 h) reduces phosphocreb. (C) Representative qRT-PCR showing forskolin (20–80 μM) can induce the expression of pcdh10 in explants relative to vehicle (DMSO) alone. Induction of pcdh10 expression is not blocked by pretreatment with RpcAMPs.
To determine if pcdh10 regulation by forskolin is mediated in part by PKA, we next pre-treated explants overnight with 40 μM RpcAMPs, an inhibitor of PKA. Pre-treated and control explants were then incubated with 20 μM forskolin for 1 h. Addition of RpcAMPs prior to forskolin resulted in a decrease in phosphocreb signal, consistent with inhibition of PKA (Figure 8B). However, qRT-PCR showed no change in pcdh10 expression as a result of RpcAMPs pretreatment (n = 3; representative qRT-PCR shown in Figure 8C). These results are consistent with regulation of pcdh10 by cAMP, but in a manner that is not dependent upon PKA. Furthermore, the observed increases in pcdh10 expression upon addition of forskolin complement our occlusion and CNGA2 mutant assays, which show decreases in pcdh10 expression.
Transgenic Analysis of Pcdh10 Function Shows an Effect on OSN Axons
Our studies in the epithelium are consistent with regulation of pcdh10 by activity. We next asked whether or not this regulation might affect OSN axon guidance. Pcdh10 is clearly expressed within a mosaic population of OSNs, and its expression can be increased by cAMP or decreased by a change in activity. Pcdh10 is a member of the cadherin superfamily, which are cell–cell adhesion molecules. If either the presence of pcdh10 within a given OSN or the level of pcdh10 expression is important for OSN axon–axon interactions, any alteration in pcdh10 expression can potentially affect OSN guidance.
To test if the mosaic nature of pcdh10 expression is important, we generated a transgenic mouse where pcdh10 expression is under control of the OMP promoter (Figure 9A). Four independent inserts were obtained, but only two showed misexpression of pcdh10. Despite the use of the OMP promoter, we were unable to obtain general expression of pcdh10 throughout the epithelium in either of these two inserts. Unexpectedly, both inserts had very similar expression patterns, but differed primarily by intensity of expression. While pcdh10 misexpression does occur, it is most apparent in areas that express pcdh10 weakly in control animals (compare Figures 9B,C). Areas that normally have pcdh10 expression do not obviously over-express pcdh10 in transgenic animals. We also performed immunohistochemistry with antibodies against pcdh10 (Figures 9D,E) and eGFP (data not shown). Identical patterns were observed for both antibodies. Expression of pcdh10 in the transgenic animal is significantly higher in the bulb compared controls. Strong expression of pcdh10 could be detected in axons of P0 transgenic animals within the bulb. However, this pattern was strikingly enriched in some areas of the bulb relative to others. More expression was detected in the dorsomedial and ventral bulb than at other locations, although expression could be seen at different levels throughout the bulb. Higher magnification images showed this expression could be detected within glomeruli (Figure 9E).
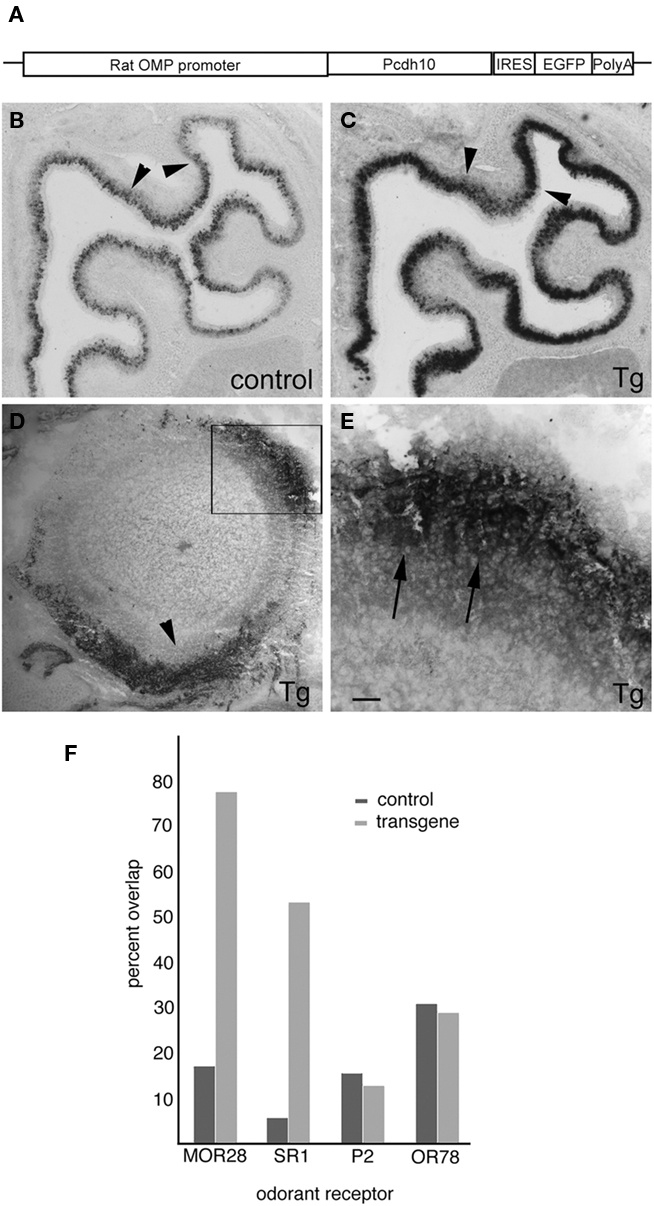
Figure 9. Expression of pcdh10 in OMP-pcdh10 transgenic animals. (A) Schematic of the plasmid used to generate the OMP-pcdh10 transgenic mutant. (B) In situ hybridization to detect pcdh10 expression in control (B) and transgenic (C) animals. Note that misexpression is not uniform throughout the epithelium. Misexpression of pcdh10 is patchy in areas where strong pcdh10 expression is present in control animals [compare arrowheads in (B) and (C)]. (D) Immunohistochemical detection of pcdh10 protein in olfactory bulbs of transgenic animals. Medial is to the right. Strong axonal and glomerular signal can be detected, but this expression is not uniform. Expression is highest along the dorsomedial and ventral aspects of the bulb (arrowhead). (E) Higher magnification of boxed area shown in (D) demonstrating protocadherin expression in glomeruli (arrowheads). Image has been rotated to better illustrate glomerular signal. (F) Quantitation of double-label in situ hybridization with pcdh10 and MOR28 [45/58 (Tg), 4/23 (control)], SR1 [8/15 (Tg), 1/17 (control)], OR78 [7/24 (Tg), 9/15 (control)], and P2 (odorant receptors in control and transgenic animals). Scale bar = 200 μm (B,C), 100 μm (D), 32 μm (E).
Because of this unusual expression, we asked whether or not misexpression of pcdh10 in these transgenic animals occurs in a differential manner across OSN populations. Using one of the two inserts with the highest level of expression, we performed double-label in situ hybridization with pcdh10 and four different odorant receptors (Figure 9F). The percentage of OSNs expressing the P2 or OR78 odorant receptors and pcdh10 is unchanged between control and transgenic animals. However, pcdh10 is now expressed in a higher percentage of OSNs expressing the MOR28 or SR1 receptors. We therefore asked whether or not this misexpression influences the behavior of these OSN populations.
We crossed our transgenic line with the highest level of expression to two reporter strains. The SR1-ires-tau-lacZ and P2-ires-tau-lacZ reporters are used to study convergence of OSNs expressing the SR1 and P2 odorant receptors (Mombaerts et al., 1996; Cutforth et al., 2003). Our double-label experiments indicate only a small percentage of cells in either control or transgenic animals co-express the P2 odorant receptor and pcdh10, consistent with pcdh10 having no impact on these OSNs. As expected, we saw no effects on the behavior of P2-lacZ OSNs in transgenic animals (n = 16; data not shown). Littermate controls reacted simultaneously and for identical lengths of time were compared for phenotypes with each transgenic animal. SR1-expressing OSNs rarely co-express pcdh10 in control animals. However, in the mutant, a significant percentage of SR1-positive neurons now express pcdh10. The effect of this expression could clearly be seen at both E16.5 and at E17.5. In control animals at E16.5, the earliest SR1-expressing OSNs can clearly be seen to form small glomeruli (Figure 10A). However, in mutants, neurons appear to have difficulty converging (n = 5). Weak glomerular-like structures can be seen, but most neurons have not yet converged upon these locations (Figure 10B). At E17.5, the positions of target glomeruli of SR1-positive OSNs in mutants (Figure 10D; n = 12) appear shifted from those in controls (Figure 10C).
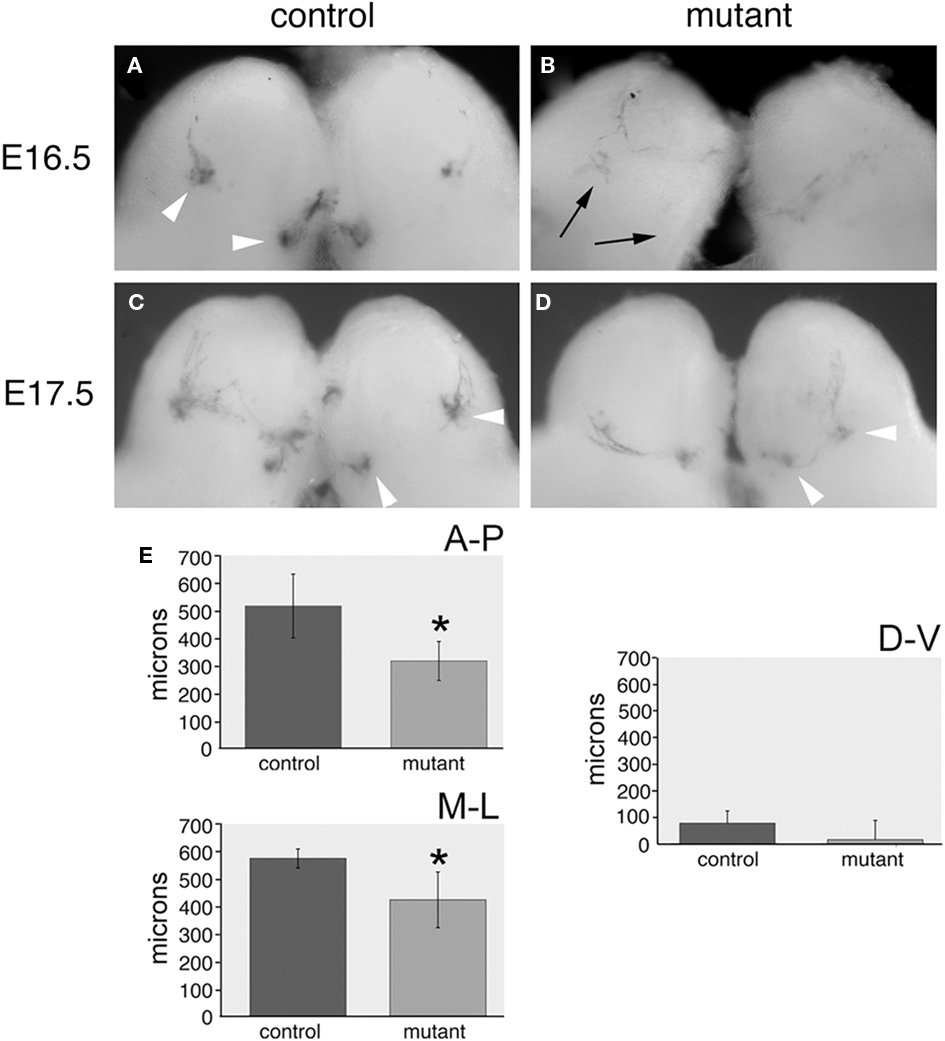
Figure 10. Glomeruli of SR1-expressing OSNs in OMP-pcdh10 mice are shifted relative to control. (A,B) E16.5 bulbs from control (A) and transgenic (B) littermates crossed with the SR1-ires-tau-lacZ reporter strain. Note glomerular formation (arrowheads) by SR1-expressing OSNs can clearly be detected in control animals while lacZ staining appears more diffuse in transgenic animals (black arrows point to expected location of SR1 glomeruli). Weak glomerular-like structures can sometimes be observed near these locations. (C) E17.5 bulbs from control littermates show glomerular convergence to typical locations targeted by SR1-expressing OSNs (arrowheads). (D) SR1-positive OSNs also converge in transgenic animals, but these glomeruli appear physically closer to one another relative to control animals. (E) Quantitation of the convergence phenotype shows mutant glomeruli are significantly closer to one another in the anterior–posterior (p < 0.005) and medial–lateral dimensions (p < 0.05), but their relative separation is essentially unchanged along the dorsal–ventral axis.
To quantify this shift, we sectioned mutant and control animals along the anterior–posterior (n = 6), medial–lateral (n = 5), and dorsal–ventral (n = 6) axes (Figure 10E). We determined the relative distance between glomeruli along all three axes in mutant and control strains. Clear differences in the relative anterior–posterior [320 ± 70 μm (Tg) vs. 520 ± 115 μm (control); p < 0.005] and medial–lateral [430 ± 101 μm (Tg) and 580 ± 34 μm (control); p < 0.05] positioning of the two glomeruli. Variable but insignificant differences in dorsal–ventral interglomerular distance are also seen [15 ± 72μm (Tg) vs. 77 ± 46 μm (control); p = 0.09]. Because we could not ascertain the original position of SR1 glomeruli in the transgene, we cannot determine whether one or both glomeruli are shifted along the AP and ML axes. We repeated this analysis with the second transgenic insert. As noted previously, the overall expression pattern in the epithelium for this second insert mirrored that of our highest expressing line, but has a lower level of pcdh10 misexpression. Although the shifts were not as dramatic as for the initial insert, statistically significant differences in anterior–posterior and medial–lateral positioning were also seen for this second insert (data not shown; p < 0.05).
The closer apposition of glomeruli in the transgenic animal may be due to the fact that bulb sizes in the mutant are smaller than that of controls. We sectioned bulbs from two pairs of littermates from the medial bulbar surface to the lateral-most edge. We found no differences in the total number of sections between mutant and control [56(Tg)/57(control), and 60(Tg)/59(control)]. Slight differences were found in the number of sections along the anterior/posterior extent of the bulb between mutant and control [56(Tg)/57(control), 63(Tg)/65(control), 61(Tg)/64(control)]. We cannot exclude these differences are within the realm of normal variation. We conclude pcdh10, like ephrin/EphA5, kirrel2/3, and BIG2, can affect OSN axon behavior.
Discussion
How activity affects OSN guidance has long been a subject of much debate. Reduction in spontaneous OSN activity or loss-of-function mutations in the HCN channel both affect OSN axon guidance (Yu et al., 2004; Mobley et al., 2010). But despite disruptions in OSN behavior, the specific molecular mechanisms that underlie these phenotypes remain unknown.
In contrast, loss-of-function studies in the CNGA2 gene showed minimal effects on OSN convergence (Lin et al., 2000), although these effects may be variable among OSN populations (Zheng et al., 2000). But unlike experiments where spontaneous or HCN-mediated activity was affected, a small number of genes have been identified whose expression appears to be dependent in part on the CNG channel. Kirrel2/3, ephrinA5/EphA5, and BIG2 have been functionally demonstrated to be affected by loss of the CNG channel (Serizawa et al., 2006; Kaneko-Goto et al., 2008). Importantly, all of these genes have been shown by gain and loss-of-function studies to affect OSN terminal guidance stages. The effects of each mutation vary amongst one another. Manipulating kirrel2/3 expression, for example, can produce shifts of just one glomerulus within the olfactory bulb. As a result, the CNG channel has been proposed to be important for terminal stages of OSN guidance (Sakano, 2010). How activation of the CNG channel affects gene expression is still unknown. In one model, OSNs that express a common odorant receptor would respond similarly when exposed to a cognate odorant. This would lead to coordinated gene expression changes, possibly as a result of calcium entry through the channel.
Activity in the olfactory system has been proposed to also include activation of second messenger systems (Zou et al., 2009). Loss- and gain-of-function studies show altering levels of cAMP can lead to changes in OSN guidance. Early events in axonogenesis are thought to be regulated by PKA via phosphocreb, while later targeting events are thought to be regulated by activation of the CNG channel (Sakano, 2010). How this process occurs and how presumably subtle differences in second messenger levels are distinguished among different OSN populations is still unclear. How many genes are regulated in this manner is also unclear.
Understanding the principles that underlie this process requires identifying a sufficient cohort of genes regulated by activity. Despite the fact that only a few such genes have been shown to be affected by loss of the CNG channel, there are indications that multiple mechanisms may occur within this branch to regulate downstream expression. Both BIG2 and ephrinA5 respond similarly to loss of odorant-evoked activity. However, OSNs that express BIG2 may or may not also express ephrinA5. Thus, despite the fact that both genes are similarly regulated by activity, OSNs that express BIG2 do not necessarily express ephrinA5 (Kaneko-Goto et al., 2008). This suggests more than one mechanism exists to regulate expression downstream of the channel to generate BIG2-positive/ephrinA5-positive or BIG2-positive/ephrinA5-negative OSNs (Imai and Sakano, 2008).
Our results show pcdh10 is also regulated by activity. Reducing odorant-evoked activity, either by naris occlusion or by a mutation in the CNGA2 channel, leads to reduced pcdh10 expression. Ex vivo manipulation of cAMP levels in explants can lead to elevated pcdh10 expression, and this increase is not dependent upon PKA. The identification of pcdh10 complements and extends prior studies identifying kirrels, ephrin/EphA5, and BIG2 as regulators of OSN axon guidance. Like kirrel2, pcdh10-positive axons correlate with those expressing CNGA2, and both pcdh10 and kirrel2 are similarly affected by changes in activity. However, there are suggestions that, like BIG2, more than one mechanism regulates gene expression downstream of the CNG channel. We found that essentially all OSNs that express pcdh10 also express kirrel2. However, the converse is not true, as only a subset of kirrel2-positive OSNs express pcdh10. This demonstrates the presence of two distinct kirrel2 populations (kirrel2-positive/pcdh10-positive and kirrel2-positive/pcdh10-negative OSNs). This argues that, much as there are two populations of BIG2-positive OSNs, more than one mechanism may exist to regulate pcdh10 expression within these OSNs.
How do these two kirrel2 populations arise, if both pcdh10 and kirrel2 are similarly regulated by activity? During tumorigenesis, pcdh10 expression is known to be affected by methylation (Lin et al., 2010). It is possible that an epigenetic mechanism may initially regulate the presence or absence of pcdh10 in a given OSN. Regulation of expression by activity would therefore be a secondary event that could only occur in OSNs that express pcdh10. Alternatively, activity-regulated expression of pcdh10 may require some minimum level of activity to be effective, and this threshold may be higher than that of kirrel2. In this scenario, kirrel2 can be widely expressed by many OSN populations. However, pcdh10 expression in these populations would be more dependent upon prolonged or elevated levels of activity.
What is the purpose of this regulation of pcdh10 expression by activity? The mosaic nature of pcdh10 expression suggests a possible role in OSN axon guidance. The absence of pcdh10 expression by in situ hybridization prior to E15.5 indicates pcdh10 is not involved in early stages of OSN outgrowth. Moreover, the presence of pcdh10 expression in axons and within glomeruli increases as postnatal development proceeds. These expression patterns are consistent with a role in later stages of OSN guidance, possibly during glomerular refinement and/or synaptogenesis. Kirrel2/3 are also theorized to be involved in terminal stages of axon guidance. It is clear, however, given the sheer number of glomeruli, that multiple guidance cues must be involved at this stage. The differing expression of pcdh10 among kirrel2-positive neurons may enable these neurons to further discriminate among terminal glomerular positions within the bulb.
Consistent with a model where activity-dependent mechanisms mediate terminal targeting and refinement of glomerular positioning, we found that kirrel2, kirrel3, and pcdh10 overlapped significantly in expression among OSNs at birth. This overlap was gradually reduced over the first 2.5 weeks of life, in keeping with the glomerular refinement known to occur during postnatal stages. Somewhat unexpectedly, we also saw changes in both kirrel2 and pcdh10 at E16.5 in CNGA2 mutants. At this stage, glomerular convergence has just begun for OSNs expressing SR1 (e.g., Figure 9). These results suggest that activity via the CNG channel may occur earlier than expected to regulate gene expression.
At E17.5, OSN terminal targeting in our transgenic mutant appeared to be shifted along the anterior–posterior and medial–lateral axes. Although subtle, these shifts are similar to those observed for kirrel2/3, where bulbar positioning is shifted by a single glomerulus. We note that pcdh10, like other protocadherins, exhibits only weak adhesive properties in vitro (Hirano et al., 1999). It seems unlikely that homophilic interactions among OSNs expressing pcdh10 can explain these observed phenotypes. However, pcdh10 has been shown to negatively regulate other guidance cues, such as N-cadherin (Nakao et al., 2008). In these studies, co-expression of pcdh10 and N-cadherin in a tissue culture model led to down-regulation of N-cadherin expression at the surface. Thus, our experiments mis-expressing pcdh10 are likely to impact the expression of other guidance cues, and suggest that regulation of one gene by activity can in fact influence others that are not similarly regulated.
Finally, we note that pcdh10 has been implicated as being regulated by activity in the hippocampus (Morrow et al., 2008). The CNG channel is also expressed in hippocampal neurons (Bradley et al., 1997). It is possible regulation of pcdh10 expression in these two structures may operate through similar mechanisms. Other members of the delta protocadherin family are thought to be regulated by activity. Arcadlin, an ortholog of pcdh8, is up-regulated in the hippocampus in response to electroshock treatment (Yasuda et al., 2007) while pcdh9 is up-regulated in response to creb (Zhang et al., 2009). These studies indicate that understanding regulation of protocadherin expression by activity in the olfactory system may have broader implications for understanding this regulation elsewhere in the nervous system.
Conflict of Interest Statement
The authors declare that the research was conducted in the absence of any commercial or financial relationships that could be construed as a potential conflict of interest.
Acknowledgments
We thank Mark Roberson for guidance on the pharmacology assays. This work was funded by the NIH (DC007489) and the Cornell Nanobiotechnology Center.
Supplementary Material
The Supplementary Material for this article can be found online at http://www.frontiersin.org/Neural_Circuits/10.3389/fncir.2011.00009/abstract/
Movie S1|Three-dimensional reconstruction of pcdh10 glomerular map. The movie begins with the anterior view displayed in Figure 3A. Dorsal is up, medial to the left, ventral is down, and lateral to the right. As the movie progresses the glomerular map rotates in the medioventral direction, displaying medial, posterior, and finally lateral views of pcdh10-positive glomeruli.
Footnotes
References
Aoki, E., Kimura, R., Suzuki, S. T., and Hirano, S. (2003). Distribution of OL-protocadherin protein in correlation with specific neural compartments and local circuits in the postnatal mouse brain. Neuroscience 117, 593–614.
Bradley, J., Zhang, Y., Bakin, R., Lester, H. A., Ronnett, G. V., and Zinn, K. (1997). Functional expression of the heteromeric “olfactory” cyclic nucleotide-gated channel in the hippocampus: a potential effector of synaptic plasticity in brain neurons. J. Neurosci. 17, 1993–2005.
Cutforth, T., Moring, L., Mendelsohn, M., Nemes, A., Shah, N. M., Kim, M. M., Frisen, J., and Axel, R. (2003). Axonal ephrin-As and odorant receptors: coordinate determination of the olfactory sensory map. Cell 114, 311–322.
Hirano, S., Yan, Q., and Suzuki, S. T. (1999). Expression of a novel protocadherin, OL-protocadherin, in a subset of functional systems of the developing mouse brain. J. Neurosci. 19, 995–1005.
Imai, T., and Sakano, H. (2008). Odorant receptor-mediated signaling in the mouse. Curr. Opin. Neurobiol. 18, 251–260.
Imai, T., Suzuki, M., and Sakano, H. (2006). Odorant receptor-derived cAMP signals direct axonal targeting. Science 314, 657–661.
Kaneko-Goto, T., Yoshihara, S., Miyazaki, H., and Yoshihara, Y. (2008). BIG-2 mediates olfactory axon convergence to target glomeruli. Neuron 57, 834–846.
Lin, C. J., Lai, H. C., Wang, K. H., Hsiung, C. A., Liu, H. W., Ding, D. C., Hsieh, C. Y., and Chu, T. Y. (2010). Testing for methylated PCDH10 or WT1 is superior to the HPV test in detecting severe neoplasms (CIN3 or greater) in the triage of ASC-US smear results. Am. J. Obstet. Gynecol. 204, 21.
Lin, D. M., Wang, F., Lowe, G., Gold, G. H., Axel, R., Ngai, J., and Brunet, L. (2000). Formation of precise connections in the olfactory bulb occurs in the absence of odorant-evoked neuronal activity. Neuron 26, 69–80.
Mobley, A. S., Miller, A. M., Araneda, R. C., Maurer, L. R., Muller, F., and Greer, C. A. (2010). Hyperpolarization-activated cyclic nucleotide-gated channels in olfactory sensory neurons regulate axon extension and glomerular formation. J. Neurosci. 30, 16498–16508.
Mombaerts, P., Wang, F., Dulac, C., Chao, S. K., Nemes, A., Mendelsohn, M., Edmondson, J., and Axel, R. (1996). Visualizing an olfactory sensory map. Cell 87, 675–686.
Morrow, E. M., Yoo, S. Y., Flavell, S. W., Kim, T. K., Lin, Y., Hill, R. S., Mukaddes, N. M., Balkhy, S., Gascon, G., Hashmi, A., Al-Saad, S., Ware, J., Joseph, R. M., Greenblatt, R., Gleason, D., Ertelt, J. A., Apse, K. A., Bodell, A., Partlow, J. N., Barry, B., Yao, H., Markianos, K., Ferland, R. J., Greenberg, M. E., and Walsh, C. A. (2008). Identifying autism loci and genes by tracing recent shared ancestry. Science 321, 218–223.
Nakao, S., Platek, A., Hirano, S., and Takeichi, M. (2008). Contact-dependent promotion of cell migration by the OL-protocadherin-Nap1 interaction. J. Cell Biol. 182, 395–410.
Redies, C., Vanhalst, K., and Roy, F. (2005). Delta-protocadherins: unique structures and functions. Cell. Mol. Life Sci. 62, 2840–2852.
Rodriguez, S., Sickles, H. M., Deleonardis, C., Alcaraz, A., Gridley, T., and Lin, D. M. (2008). Notch2 is required for maintaining sustentacular cell function in the adult mouse main olfactory epithelium. Dev. Biol. 314, 40–58.
Ronnett, G. V., Hester, L. D., and Snyder, S. H. (1991). Primary culture of neonatal rat olfactory neurons. J. Neurosci. 11, 1243–1255.
Serizawa, S., Miyamichi, K., Takeuchi, H., Yamagishi, Y., Suzuki, M., and Sakano, H. (2006). A neuronal identity code for the odorant receptor-specific and activity-dependent axon sorting. Cell 127, 1057–1069.
Todrank, J., Heth, G., and Restrepo, D. (2011). Effects of in utero odorant exposure on neuroanatomical development of the olfactory bulb and odour preferences. Proc. Biol. Sci. 278, 1949–1955.
Uemura, M., Nakao, S., Suzuki, S. T., Takeichi, M., and Hirano, S. (2007). OL-protocadherin is essential for growth of striatal axons and thalamocortical projections. Nat. Neurosci. 10, 1151–1159.
Williams, E. O., Xiao, Y., Sickles, H. M., Shafer, P., Yona, G., Yang, J. Y., and Lin, D. M. (2007). Novel subdomains of the mouse olfactory bulb defined by molecular heterogeneity in the nascent external plexiform and glomerular layers. BMC Dev. Biol. 7, 48.
Yasuda, S., Tanaka, H., Sugiura, H., Okamura, K., Sakaguchi, T., Tran, U., Takemiya, T., Mizoguchi, A., Yagita, Y., Sakurai, T., De Robertis, E. M., and Yamagata, K. (2007). Activity-induced protocadherin arcadlin regulates dendritic spine number by triggering N-cadherin endocytosis via TAO2beta and p38 MAP kinases. Neuron 56, 456–471.
Yu, C. R., Power, J., Barnea, G., O’donnell, S., Brown, H. E., Osborne, J., Axel, R., and Gogos, J. A. (2004). Spontaneous neural activity is required for the establishment and maintenance of the olfactory sensory map. Neuron 42, 553–566.
Zhang, S. J., Zou, M., Lu, L., Lau, D., Ditzel, D. A., Delucinge-Vivier, C., Aso, Y., Descombes, P., and Bading, H. (2009). Nuclear calcium signaling controls expression of a large gene pool: identification of a gene program for acquired neuroprotection induced by synaptic activity. PLoS Genet. 5, e1000604.
Zhao, H., and Reed, R. R. (2001). X inactivation of the OCNC1 channel gene reveals a role for activity-dependent competition in the olfactory system. Cell 104, 651–660.
Zheng, C., Feinstein, P., Bozza, T., Rodriguez, I., and Mombaerts, P. (2000). Peripheral olfactory projections are differentially affected in mice deficient in a cyclic nucleotide-gated channel subunit. Neuron 26, 81–91.
Zou, D. J., Chesler, A., and Firestein, S. (2009). How the olfactory bulb got its glomeruli: a just so story? Nat. Rev. Neurosci. 10, 611–618.
Keywords: olfactory, activity, axon guidance, delta protocadherin, pcdh10, CNGA2
Citation: Williams EO, Sickles HM, Dooley AL, Palumbos S, Bisogni AJ and Lin DM (2011) Delta protocadherin 10 is regulated by activity in the mouse main olfactory system. Front. Neural Circuits 5:9. doi: 10.3389/fncir.2011.00009
Received: 02 April 2011; Accepted: 26 July 2011;
Published online: 23 August 2011.
Edited by:
Leslie B. Vosshall, Rockefeller University, USAReviewed by:
Brian Key, The University of Queensland, AustraliaLeonardo Belluscio, National Institutes of Health, USA
Copyright: © 2011 Williams, Sickles, Dooley, Palumbos, Bisogni and Lin. This is an open-access article subject to a non-exclusive license between the authors and Frontiers Media SA, which permits use, distribution and reproduction in other forums, provided the original authors and source are credited and other Frontiers conditions are complied with.
*Correspondence: David M. Lin, Department of Biomedical Sciences, Cornell University, T2 006A VRT, Tower Road, Ithaca, NY 14853, USA. e-mail: dml45@cornell.edu