 Shilpa Soni1 Robert K. Ernst2 Artur Muszyński3 Nrusingh P. Mohapatra1 Malcolm B. Perry4 Evgeny Vinogradov4 Russell W. Carlson3 John S. Gunn1*
- 1 Center for Microbial Interface Biology, Department of Molecular Virology, Immunology and Medical Genetics, and Department of Internal Medicine, Division of Infectious Diseases, The Ohio State University, Columbus, OH, USA
- 2 Department of Microbial Pathogenesis, School of Dentistry, University of Maryland-Baltimore, Baltimore, MD, USA
- 3 Complex Carbohydrate Research Center, University of Georgia, Athens, GA, USA
- 4 Institute for Biological Sciences, National Research Council, Ottawa, ON, Canada
Francisella tularensis is a CDC Category A biological agent and a potential bioterrorist threat. There is no licensed vaccine against tularemia in the United States. A long-standing issue with potential Francisella vaccines is strain phase variation to a gray form that lacks protective capability in animal models. Comparisons of the parental strain (LVS) and a gray variant (LVSG) have identified lipopolysaccharide (LPS) alterations as a primary change. The LPS of the F. tularensis variant strain gains reactivity to F. novicida anti-LPS antibodies, suggesting structural alterations to the O-antigen. However, biochemical and structural analysis of the F. tularensis LVSG and LVS LPS demonstrated that LVSG has less O-antigen but no major O-antigen structural alterations. Additionally, LVSG possesses structural differences in both the core and lipid A regions, the latter being decreased galactosamine modification. Recent work has identified two genes important in adding galactosamine (flmF2 and flmK) to the lipid A. Quantitative real-time PCR showed reduced transcripts of both of these genes in the gray variant when compared to LVS. Loss of flmF2 or flmK caused less frequent phase conversion but did not alter intramacrophage survival or colony morphology. The LVSG strain demonstrated an intramacrophage survival defect in human and rat but not mouse macrophages. Consistent with this result, the LVSG variant demonstrated little change in LD50 in the mouse model of infection. Furthermore, the LVSG strain lacks the protective capacity of F. tularensis LVS against virulent Type A challenge. These data suggest that the LPS of the F. tularensis LVSG phase variant is dramatically altered. Understanding the mechanism of blue to gray phase variation may lead to a way to inhibit this variation, thus making future F. tularensis vaccines more stable and efficacious.
Introduction
Francisella tularensis is a gram-negative, facultative intracellular pathogen that causes tularemia in humans and animals (Oyston et al., 2004; Keim et al., 2007; Sjostedt, 2007). The host can be infected by several routes including the lungs (inhalational), skin, or mucous membranes (cutaneous) or by ingestion of contaminated food or water (gastrointestinal) (Keim et al., 2007; Sjostedt, 2007). F. tularensis has been characterized as a category A bio-defense organism by the Centers for Disease Control and Prevention because of its high lethality and infectivity, particularly by the aerosol route. There are two major human virulent subspecies of F. tularensis: F. tularensis subspecies tularensis (Type A strain) found in North America and F. tularensis subspecies holarctica (Type B strain) found in Europe, Asia as well as North America (Ellis et al., 2002). The Type A strain is highly infectious and when inhaled, even low doses (<10 bacteria) can cause life-threatening disease in humans (Sjostedt, 2007). Type B strains are considered less virulent but can still effectively cause diseases in humans. F. tularensis subspecies novicida (F. novicida) and F. tularensis subspecies mediasiatica are other known subspecies of Francisella that are considered relatively avirulent for immunocompetent humans but are capable of causing systemic infection in other mammals (Ellis et al., 2002; Keim et al., 2007).
There are no approved vaccines available to prevent or treat tularemia in the United States (Oyston, 2009). An attenuated live vaccine strain, F. tularensis LVS (Ft LVS), was derived from a Type B isolate of the pathogen (Oyston, 2009) and is used as a vaccine in Europe and is in clinical trials for potential approval in the US. It elicits diverse protection in humans, monkeys, guinea pigs, and mice depending on the route of vaccination against systemic challenge with virulent Type A F. tularensis (Eigelsbach and Downs, 1961). The molecular basis for the attenuation of Ft LVS still remains unknown, though candidate factors have been identified (Rohmer et al., 2006). Eigelsbach (Eigelsbach et al., 1951; Eigelsbach and Downs, 1961) first reported colony variants of the prototypical virulent Type A SchuS4 strain and Ft LVS, which were identified on the basis of colony morphology (rough colonies and smooth colonies) and their appearance under a field microscope viewed with oblique light, where Ft LVS/SchuS4 appears blue and the variant as gray. Gray variants were reported to be less virulent with a lethal dose of >107 colony forming units (CFU) and were less immunogenic/protective in challenge studies, where they afforded minimal protection to Type A challenge (Eigelsbach et al., 1951). These variants also differentially reacted to acriflavine agglutination, and demonstrated variable stability of colony morphology upon sub-culturing (Eigelsbach et al., 1951). The observation of gray variants depended on growth conditions including culture media, size of inoculum, pH, and duration of culture growth. Hartley et al. (2006) also identified the spontaneous gray variants of three F. tularensis strains (LVS, SchuS4, and HN63), further suggesting that blue to gray variation is a frequent and perhaps common occurrence in wildtype strains in the environment.
Gray variants were first examined at the molecular level by Cowley et al. (1996). This variant (LVSG; Ft LVSG) demonstrated differential survival in certain macrophage types and the lipopolysaccharide (LPS) of this variant, which possessed a LPS O-antigen, was found to possess altered anti-LPS monoclonal antibody reactivity and stimulated increased nitric oxide (NO) production in macrophages. A rough gray variant (lacking an LPS O-antigen) was also recently characterized (Hartley et al., 2006). This variant was identified on the basis of size and opacity, grew slower, had reduced intramacrophage survival, and poorly protected against Type A F. tularensis challenge. These studies suggested that LPS played an important role in this phase variation phenomenon.
In the present study, we confirmed and extended the phenotypic characterization of the gray variants and further analyzed the LPS of one of these strains. Multiple LPS alterations were noted, including those in O-antigen, core and lipid A. The gray variant primarily characterized in this study, Ft LVSG, possessed a full length O-antigen (as opposed to previously characterized rough gray variants), survived less well in human and rat but not mouse macrophages and poorly protected against F. tularensis SchuS4 challenge in the mouse model. It is hoped that a greater understanding of the mechanism(s) behind phase variation will lead to phase locked strains that no longer vary, thus allowing the construction of safer, more immunogenic tularemia vaccines.
Materials and Methods
Strains and Media
Francisella tularensis subsp. holarctica LVS (ATCC 29684) was obtained from Karen Elkins (Center for Biologics Research and Evaluation, U.S. Food and Drug Administration, Bethesda, MD, USA). F. novicida (U112) was obtained from ATCC, LVSG (a spontaneous gray phase variant) was provided by F. Nano (University of Victoria, Victoria, BC, Canada). Ft LVSGD (another spontaneous gray variant we found to lack O-antigen) was obtained from lot number 703-0102-080 produced at Cambrex BioSciences in Baltimore, MD, USA. The cell bank was produced from a lyophilized vial of Ft LVS lot NDBR-101, lot 4 (Salk produced). F. tularensis subsp. tularensis strain SchuS4, a Centers for Disease Control and Prevention clinical isolate, was provided by Rick Lyons (University of New Mexico, Albuquerque, NM, USA). For most experiments, bacteria were grown overnight (∼24 h) on Choc II agar (BD Biosciences, San Jose, CA, USA) at 37°C as the frequency of phase variation was minimal in these conditions. Liquid cultures were grown overnight (∼16 h) in tryptic soy broth (TSB; Difco Laboratories, Detroit, MI, USA) containing 0.1% cysteine HCl (Sigma-Aldrich, St. Louis, MO, USA) for specified times as described in the results or Figure legends.
Genetic Manipulation
Constructs for the deletion of FTL1611 (flmF2) and FTL1609 (flmK) were made in pJC84 (Wehrly et al., 2009). The ∼1 kb upstream region of flmF2 was amplified using forward primer JG1823 (5′-aaacgagctcgGGGTTATGGTGACTTCTGCATC-3′) with SacI restriction site at the 5′ end and reverse primer JG1824 (5′-cgcggatccCACAAATACAAAATATATTAACCTTAATTAATGCTATTATAACC-3′) with a 5′ BamHI restriction site. The ∼1 kb downstream region was amplified using forward primer JG1825 (5′-cgcggatccAATATTGTTTTAAGCTAATGAAT CAATACTTATTAAATTCTTAG-3′) and reverse primer JG1826 (5′-acgcgtcgacGTATTATATTTTTAGTAGCAGCTGTTGCTGTTAT-3′) with BamHI and SalI 5′ flanking restriction sites, respectively. Similarly, the flmK upstream region was amplified by JG2290 (5′-aaacgagctcgGATCTAATAC TGGATACCACTCATTATC-3′) forward primer with a 5′ SacI site and JG2291 (5′-cgcggatccCTTCTTTACCCTCAAATAGAAACTTATAC-3′) reverse primer with a 5′ BamHI site, and the downstream region using the JG2292 (5′-cgcggatccGATTTATCAGCATTAATTACTTTGATAAGCTAAG-3′) forward primer with a 5′ BamHI site and JG2293 (5′-acgcgtcgacCATAGATAA GCGTACAGTTGTTTCATG-3′) reverse primer with a 5′ SalI site. Fragments were cloned in pJC84 sequentially and the construct was transformed into Ft LVS followed by chromosomal recombination using the procedure described by Wehrly et al. (2009). Mutants were confirmed by PCR amplification and sequencing of the deleted region.
Microscopy
Choc II plates containing bacteria were visualized under oblique light settings as suggested by Robert Miller at Dynport Vaccine Company LLC, Frederick, MD, USA and as described by Eigelsbach (Eigelsbach et al., 1951). Briefly, a focused light source, concave mirror and dissecting microscope with 10× objective magnification and a transparent stage were used to visualize blue and gray variants. The concave mirror was placed horizontally tilted upward so that the light beam would hit the upper concave region and the distance between mirror and the microscope is adjusted so that the light beam would reflect on the plate sitting on the stage of the microscope. Blue and gray colonies were observed and counted using these conditions. Samples were prepared for electron microscopy from overnight (∼16 h) grown cultures of Ft LVS or Ft LVSG in TSB containing 0.1% cysteine HCl using methods as described previously (Mohapatra et al., 2008). In brief, cells were pelleted by centrifugation, washed in PBS, and fixed with 2.5% warm glutaraldehyde for 15 min. followed by fixing with a combination of 2.5% glutaraldehyde and 1% osmium tetroxide in 0.1 M sodium cacodylate (pH 7.3) for 15 min at 4°C. Staining of the cells was accomplished by using 0.25% uranyl acetate in 0.1 M sodium acetate buffer (pH 6.3) for 45 min, and viewed after further processing by transmission electron microscopy using an FEI Technai G2 Spirit microscope at 60 kV. Multiple fields (>50) were examined to determine the average size (diameter and length) and shape of bacteria.
Silver Staining and Western Blotting
Overnight (∼24 h) grown bacteria from Choc II agar plates were suspended in PBS at a concentration of 3 × 10¹⁰ CFU/ml as determined previously by the optical density (OD600) of diluted cultures and subsequent colony counts on solid agar. Bacteria equalized by optical density (OD600) were then pelleted, frozen, and lyophilized overnight to obtain ∼20 mg of dry cells. LPS was purified using hot phenol/water method using the standard protocol as described by Apicella et al. (1994).
Lipopolysaccharide was separated by 15% SDS-PAGE and silver stained as described (Clay et al., 2008). Briefly, after fixing overnight in 40% ethanol and 5% acetic acid, gels were incubated in 0.7% periodic acid in fixing solution for 7 min and subsequently washed with multiple exchanges of water. The staining solution (0.013% concentrated ammonium hydroxide, 0.02 N sodium hydroxide, and 0.67% silver nitrate (w/v) was applied with vigorous agitation for 10 min, followed by three washes (each 10 min) in water. Gels were developed using a solution containing 0.275% monohydrous citric acid (w/v) and 0.0025% formaldehyde. Upon completion, 5% acetic acid was used to stop the development.
Purified LPS samples (10 μg/well) were electrophoresed on a 15% SDS-PAGE gel and transferred on nitrocellulose membrane using the Bio-Rad semi-dry transfer system. Immunoblotting was performed using either anti-F. tularensis LVS or F. novicida polyclonal sera (from infected mice) or monoclonal sera specific to the LPS of Ft LVS or F. novicida. Polyclonal sera to Ft LVS or F. novicida (1:1000 dilution), commercial F. tularensis FB-11 (1:1000, Abcam, Cambridge, MA, USA), F. tularensis LPS specific monoclonal (1:10), or F. novicida LPS specific monoclonal (1:10) were used as primary antibodies with alkaline phosphatase conjugated goat anti-mouse IgG (1:4000) as the secondary antibody. The F. tularensis-specific and F. novicida-specific anti-LPS monoclonal antibodies were obtained from monoclonal hybridoma cell lines (ImmunoPrecise, Victoria, BC, Canada). Blots were developed using 5-bromo-4-chloro-3-indolyl phosphate/NBT (Sigma-Aldrich) as the substrate.
O-Antigen and Core Analysis
Lipopolysaccharide was isolated using the hot phenol/water method (Apicella et al., 1994). Crude LPS was enzymatically treated to remove contaminating nucleic acids and proteins and ultracentrifuged for 18 h. The LPS pellet was collected and the carbohydrate portion of LPS was released from lipid A via 2 h mild hydrolysis with 1% acetic acid at 100°C followed by centrifugation of the lipid A at 3500×g. The carbohydrate fraction in the supernatant was extracted threefold with chloroform to remove any contaminating lipid A, lyophilized, re-suspended in water, filtered through nylon filter 0.2 μm prior the HPLC separation, and lyophilized again. Carbohydrates from Ft LVS and Ft LVSG of were resolved on a Superdex Peptide HPLC column with ammonium acetate used as an eluent. The eluting fractions were pooled and salts removed by repeated evaporations from de-ionized water on a rotary evaporator. The elution profiles for the Ft LVS and Ft LVSG carbohydrates were examined and Fraction 1 contained the O-polysaccharide (OPS), Fraction 2 contained slightly lower molecular weight OPS, and Fraction 3 contained the core oligosaccharides (OSs) with some possibly low molecular weight OPS repeat units. Fractions 1 and 3 were analyzed by NMR spectroscopy. Fraction 1 from both LVS and LVSG were compared to each other using 2D NMR. OSs found in Fraction 3 from LVS and LVSG were analyzed by 1D proton NMR spectroscopy.
Lipid a Analysis
LPS purification and lipid A isolation
Lipopolysaccharide was isolated using the rapid small-scale isolation method for mass spectrometry analysis as described (Yi and Hackett, 2000). Briefly, 1.0 ml of Tri-Reagent (Molecular Research Center, Cincinnati, OH, USA) was added to a cell culture pellet (2–5 ml of an overnight culture), re-suspended, and incubated at room temperature for 15 min. Chloroform (200 μl) was added, vortexed, and incubated at room temperature for 15 min. Samples were centrifuged for 10 min at 12,000 rpm and the aqueous layer was removed. An aliquot of water (500 μl) was added to the lower layer and vortexed well. After 15–30 min, the sample was spun down and the aqueous layers were combined. The process was repeated two more times. The combined aqueous layers were lyophilized overnight. Lipid A was isolated after hydrolysis in 1% SDS at pH 4.5 (Caroff et al., 1988). Briefly, 500 μl of 1% SDS in 10 mM Na-acetate, pH 4.5 was added to a lyophilized sample. Samples were incubated at 100°C for 1 h and lyophilized. The dried pellets were resuspended in 100 μl of water and 1 ml of acidified ethanol (100 μl 4 N hydrochloric acid in 20 ml 95% ethanol). Samples were centrifuged at 5,000 rpm for 5 min. The lipid A pellet was further washed three times in 1 ml of 95% ethanol. The entire series of washes was repeated thrice. Finally, samples were re-suspended in 500 μl of water, frozen on dry ice, and lyophilized. Alternatively for harsher lipid A cleavage conditions, LPS samples were dissolved in water, and mixed with the same volume of 10% acetic acid to give final 5% acetic acid concentration. Samples were hydrolyzed with 5% acetic acid (100°C, 2 h, with constant stirring- the precipitate appeared after 1 h). The precipitate was collected by centrifugation at 14,000 rpm for 6 min, then re-suspended in water and lyophilized. The supernatant was stored for future chemical analyses.
MALDI-TOF mass spectrometry
MALDI-TOF mass spectrometry analysis of lipid A was performed on a Voyager spectrometer. The samples were dissolved in CH3Cl–CH3OH mixture (3:1) and 1 μl of each mixed with 1 μl of 0.5 M 2,5 dihydroxybenzoic acid in methanol matrix solution. Other MALDI-TOF experiments were performed using a Bruker Autoflex II MALDI-TOF mass spectrometer (Bruker Daltonics, Inc., Billerica, MA, USA). Each spectrum was an average of 200 shots. Calibration was performed with ES Tuning Mix (Agi-lent, Palo Alto, CA, USA). Spectra were recorded in both the negative-ion and positive-ion modes.
GC–MS fatty acid analysis
Fatty acids were analyzed as methyl esters. The lipid-containing fraction was dissolved in 0.5 ml of 2 M MeOH–HCl and the mixture was kept at 80°C for 18 h. After cooling down, the hydrolyzate was mixed with 0.5 ml 50% NaCl solution and extracted with 1 ml of chloroform. The organic layer was collected and aqueous layer extracted two times more with chloroform. Combined organic layers were extracted again three times with water. Water traces were removed from collected chloroform phase by addition of anhydrous Na2SO4. The organic phase was then filtered through cotton filters prewashed with chloroform, concentrated under the stream of nitrogen and applied to GC–MS analyses.
Dephosphorylation of lipid A
To remove phosphate groups from lipid A, samples were treated with HF for 48 h at 4°C with constant stirring. HF was evaporated from samples under vacuum in a desiccator attached to NaOH trap for 1 h then removed with nitrogen.
Trimethylsilyl analysis of fatty acid methyl esters
To show the presence of hydroxyl groups in fatty acids of lipid A, the fatty acid methyl esters were treated with TriSil reagent for 30 min at 80°C. The samples were cooled and dried under a nitrogen stream. Derivatized samples were suspended in hexane and filtered through cotton filters. Filtrates were condensed under a nitrogen stream and analyzed by GC–MS.
Galactosamine quantification
Standards and samples were prepared using the established protocol (Kalhorn et al., 2009). Stock solutions of carbohydrate and internal standards were prepared in deionized water to a final concentration of 100 ng/ml. Serial dilution of carbohydrate standards were prepared to 0.125–25 ng/ml. Internal standards were prepared to a final concentration of 5 ng/ml. Individual samples containing a cocktail of carbohydrate standards ranging from 0.125 to 25 ng/ml in addition to the 5 ng/ml internal standard were prepared and lyophilized in glass screw top vials. After lyophilization, 100 ml water was added followed by 100 ml 2 M TFA. The standard samples were sealed with polytetrafluoroethylene (PTFE)-lined caps, vortexed briefly and heated at 90°C for 30 min for analysis, flash frozen and lyophilized. TFA-treated samples were reconstituted in 50 μl 0.2 M borate buffer, pH 8.8, and 50 μl 1.0 mg/ml derivatizing/labeling reagent (AccQ-Tag) in dry acetonitrile. The samples were vortexed and incubated at room temperature for 15–30 min after which they were dried under nitrogen stream at room temperature. Derivatized samples were reconstituted in 100 μl of distilled water, vortexed, and transferred to injection vials for analysis by GC–MS.
For analysis of lipid A samples, 10 mg of lipid A isolated from individual preparations was used. The vial was incubated at 90°C for 24 h for analysis of galactosamine. Aliquots were then frozen and lyophilized to dryness. They were then derivatized by the same procedure as the standards as described above (Kalhorn et al., 2009).
Real-Time PCR
RNA from log phase (0.4–0.5 optical density at 600 nm) cultures of Ft LVS and Ft LVSG was extracted using the RNeasy kit (Qiagen, Valencia, CA, USA). The quality and quantity of RNA was determined using the Experion automated electrophoresis system (Bio-Rad, Hercules, CA, USA). One microgram of total RNA was reverse transcribed to cDNA using Superscript II RNase H− reverse transcriptase (Invitrogen, Carlsbad, CA, USA). cDNA was then normalized according to the concentration and 2 ng of the converted cDNA was used for quantitative PCR with the SYBR green PCR master mixture in the Bio-Rad iCycler apparatus (Bio-Rad, Hercules, CA, USA). All primers were designed to give 200- to 220-nucleotide amplicons with melting temperatures of 48–52°C. Relative copy numbers and expression ratios of selected genes were normalized to the expression of the housekeeping gene (dnaK) and calculated as described by Mohapatra et al. (2007).
Intramacrophage Survival Assays
Human monocyte-derived macrophages (MDMs) were isolated using standard procedure as described elsewhere (Mohapatra et al., 2010) and obtained with informed consent from healthy donors by an OSU IRB approved protocol. Intramacrophage survival assays in human MDMs were performed using following procedure; 2 × 10⁶ PBMCs/well (MDMs plus lymphocytes) were plated in a 24-well plate resulting in 2 × 10⁵ MDMs/monolayer after adherence of MDMs and washing. Francisella spp. were opsonized with 0.1% serum for 30 min at 37°C. Macrophages were infected with Ft LVS, Ft LVSG and F. novicida at an MOI of 50 and incubated at 37°C in a CO2 (5%) incubator for 2 h. Cells were washed and 50 μg/ml gentamicin was added to each well and incubated for 30 min. Cells were washed and replenished with fresh media containing 10 μg/ml gentamicin. At various time points cells were washed and lysed with 0.1% SDS and plated on Choc II plates to enumerate the colony forming units.
Mice Virulence Assays
Bacteria grown overnight (∼24 h) on Choc II plates were scraped and suspended, washed twice and diluted in PBS. Four- to six-week-old BALB/c mice were anesthetized and infected with ∼1000 bacteria in a 20-μl volume by the intranasal route and dilutions were plated on Choc II plates to enumerate the inoculum. Mice were anesthetized and challenged with 1000 CFU of overnight (∼24 h) grown F. tularensis subsp. tularensis SchuS4 intranasally 4 weeks post vaccination and observed daily for survival. These procedures were performed as described in an OSU IACUC approved protocol in an inspected and approved biosafety level 3 laboratory.
Results
Blue–Gray Phenotypic Variation
Francisella tularensis LVS phase has been observed to vary from a blue (wild-type) colony to a gray colony variant (Eigelsbach et al., 1951; Cowley et al., 1996). Such gray variants have been both characterized with an extended LPS O-antigen (Cowley et al., 1996) as well as a truncated O-antigen (Hartley et al., 2006). Our work described here is with the Ft LVSG isolate (a variant with an extended O-antigen), but at times comparisons are made to Ft LVSGD (a variant with no O-antigen). We examined various media conditions and growth phases to determine the conditions that affected the degree of phase variation. We found that Ft LVSG grows slower than Ft LVS, forms smaller colonies on agar surfaces, and appeared gray by eye on Choc II agar plates under oblique lighting (Figures 1A,B). The frequency of blue to gray phase variation was higher (27–31%) in liquid cultures (TSB + 0.1% cysteine HCL) grown to stationary phase (typically 30–48 h) and plated on solid agar. The frequency of phase variation was minimal (2–5%) for bacteria grown on plates 1–2 days and in log phase liquid cultures. We also observed that the frequency of blue to gray phase variation dramatically increased when Ft LVS was passed through macrophages (23–27%) or recovered from organs of infected animals (31–36%). We also observed that the frequency of forward phase variation in broth grown bacteria (blue to gray) was always higher (∼30%) than frequency of reverse (gray to blue) phase variation (5–7%).
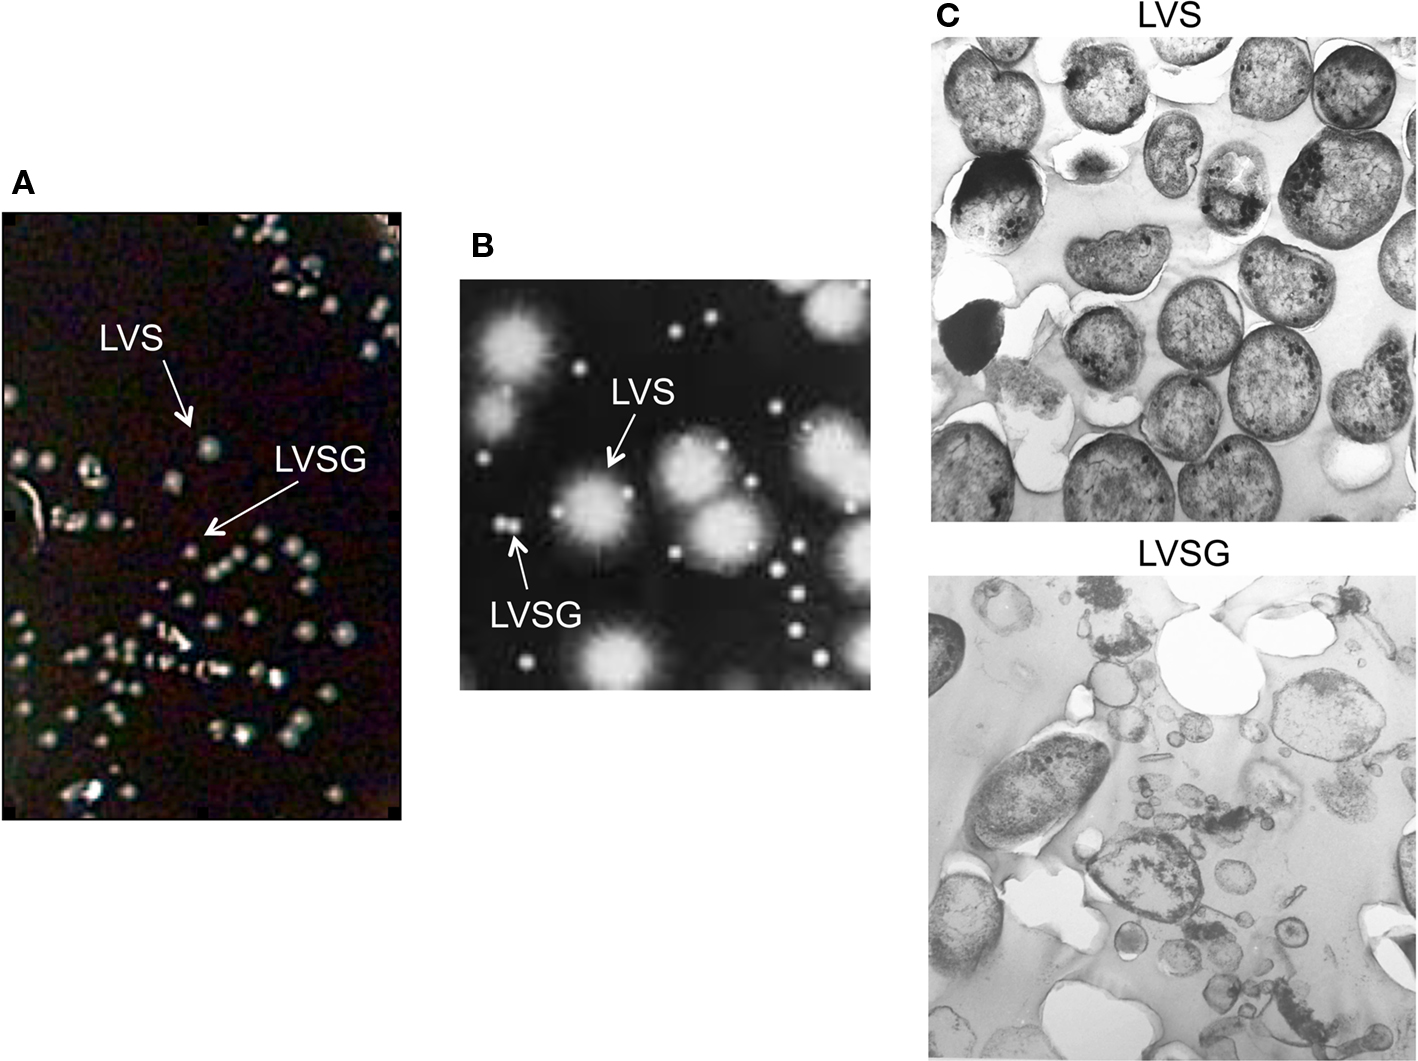
Figure 1. Ft LVS blue–gray colony and bacterial morphology. (A) Mixed cultures of Ft LVS and phase variant (Ft LVSG) viewed on the surface of a Choc II agar plate. Note that Ft LVSG forms smaller colonies that Ft LVS. (B) Blue (LVS) and Gray (LVSG) colonies viewed under a compound light microscope by oblique lighting. The smaller colonies appeared gray. (C) Transmission electron microscopy of Ft LVS and Ft LVSG. While the bacterial dimensions were similar between these two strains from measuring >50 fields, the Ft LVSG strain formed a large amount of membrane vesicles.
To more clearly compare Ft LVS to Ft LVSG bacteria, log phase cultures were examined by scanning electron microscopy. Comparisons of average cell size were not significantly different, but more membrane vesicles were observed in Ft LVSG cultures (Figure 1C). It is not clear what impact this increased vesiculation has on the subsequent phenotypes described for Ft LVSG.
Ft LVSG LPS Possesses Less O-Antigen
It was shown previously that the LPS of Ft LVS and Ft LVSG had differential reactivity to monoclonal antibodies stated to be O-antigen specific (Cowley et al., 1996), suggesting an O-antigen antigenic switch. To further examine the LPS O-antigen and its antigenic properties, we purified LPS from Ft LVS, Ft LVSG, F. novicida, Ft LVSGD, F. tularensis SchuS4 and a F. tularensis SchuS4 small colony gray variant and performed silver staining on SDS-PAGE separated samples. Consistent with previously published results, the gray variant (Ft LVSG) possessed an O-antigen but Ft LVSGD was rough (lacked O-antigen) (Figure 2A). The F. tularensis SchuS4 small colony gray variant also appeared to produce an LPS with a repeating O-antigen.

Figure 2. Lipopolysaccharide analysis by Silver staining and Western blotting. (A) Silver stained gel of LPS purified from various strains listed above the lanes. (B) Immunoblotting of purified LPS of Francisella spp. with the anti-LPS O-antigen F. tularensis FB-11 antibody. F. tularensis FB-11 (1:1000) and secondary goat anti-mouse IgG (1:4000) were used. (C) Immunoblotting of purified LPS of Francisella spp. with F. tularensis anti-LPS specific monoclonal antibodies. F. tularensis IgG (1:10) and secondary goat anti-mouse IgG (1:4000) were used. (D) Immunoblotting of purified LPS of Francisella spp. with F. novicida anti-LPS specific monoclonal antibodies. F. novicida #5 IgG (1:10) and secondary goat anti-mouse IgG (1:4000) were used. (E) Immunoblotting of LPS with polyclonal sera specific to Ft LVS or to F. novicida. Polyclonal sera (1:1000) and secondary goat anti-mouse IgG (1:4000) were used. Lane assignments; M (Molecular weight marker), LVS (blue colonies), LVSG (gray variant), Fn (F. novicida), LVSGD (rough gray variant), Ft4 (F. tularensis SchuS4), Ft4v (F. tularensis SchuS4 gray variant).
Glycosyl composition analysis of the OSs released from the purified LPS preparations show that the Ft LVS and Ft LVSG OSs contain the same glycosyl residues, but there is a large quantitative difference, in that the Ft LVS OS contains much larger amounts of QuiN and Gal than what is found in the OS from the Ft LVSG strain (Table 1). The QuiN could be due to QuiNFo as NMR analysis (data not shown) shows a significant resonance at around 8 ppm, which is consistent with a formyl proton. During the preparation of trimethylsilyl (TMS) methyl glycoside, which is accompanied by N-acetylation, this formyl group would have been replaced by an acetyl group. The large difference in these components between the LPS of Ft LVS and Ft LVSG would indicate that the Ft LVS LPS contains much more of the QuiN/Gal-containing O-antigen chain polysaccharide than Ft LVSG. Thus, these data suggest that the Ft LVSG LPS has an O-antigen but the O-antigen contains fewer repeating units than seen in Ft LVS LPS or that LVSG lipid A-core is capped less frequently with O-antigen. Interestingly, even though the two variants (Ft LVSG and Ft LVSGD) have distinct LPS regarding the amount of O-antigen present (albeit both with amounts less than that of wildtype), they give rise to morphologically similar gray variants.
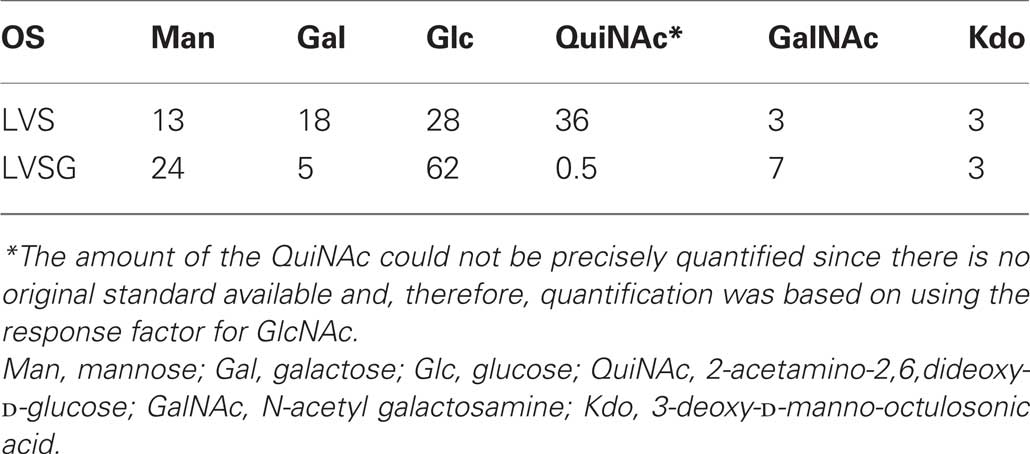
Table 1. Trimethylsilyl methyl glycoside analysis of OSs purified from the LPS of Ft LVS LPS and the gray variant Ft LVSG LPS.
Monoclonal and Polyclonal Antibody Reactivity and LPS Structural Analysis Suggests Blue/Gray Strain LPS Core Alterations
Western blot analysis was performed on LPS samples using commercially available anti-F. tularensis FB-11 (Figure 2B) antibodies stated to be specific to the O-antigen, as well as anti-F. tularensis (Figure 2C) and anti-F. novicida LPS monoclonal antibodies (Figure 2D). The results showed that Ft LVS LPS reacted with both the F. tularensis monoclonal and FB-11 antibodies showing the typical LPS laddering, and while the laddering was not observed on Ft LVS LPS Western blots with the F. novicida specific antibodies, reactivity was observed to a low molecular weight species that is typically lipid A plus core (Figures 2B–D). F. novicida LPS did not react at all to the anti-F. tularensis LPS or FB-11 antibody, but strongly to a low molecular weight species (plus typical laddering) with the F. novicida specific monoclonal antibody. Ft LVSG reacted with both F. tularensis and the F. novicida anti-LPS monoclonal antibodies. These results are consistent with those of Cowley et al. (1996) with regard to O-antigen ladder reactivity, but the lipid A core region is not clearly visible on their gels. As expected, LVSGD did not demonstrate the typical O-antigen ladder due to its the lack of O-antigen (Figures 2B–D). The F. tularensis SchuS4 gray variant reacted with both anti-F. tularensis monoclonal antibodies and clearly possesses an O-antigen based on the observed laddering. However, the modal chain length or capping frequency of this O-antigen, like that of Ft LVSG, appears reduced versus F. tularensis SchuS4 (Figures 2B–D).
These LPS samples were reacted in a Western blot with anti-F. tularensis or anti-F. novicida polyclonal sera generated from infected mice (Figure 2E). Ft LVS LPS and F. novicida LPS only reacted with their respective antisera while Ft LVSG now reacted only with F. tularensis polyclonal sera. These results suggest that changes in the Ft LVSG LPS are specifically recognized by monoclonal but not polyclonal antibodies.
We next isolated and performed extensive NMR analyses on the Ft LVS and Ft LVSG OPSs to determine if any structural differences could be detected between these molecules. Crude LPS was enzymatically treated to remove contaminating nucleic acids and proteins and ultracentrifuged. The LPS pellet was collected and the carbohydrate portion of LPS was released from lipid A via mild hydrolysis. The carbohydrate fractions from Ft LVS and Ft LVSG of were resolved by HPLC. The carbohydrates eluted in three primary fractions. Fraction 1 contained the OPS, Fraction 2 contained slightly lower molecular weight OPS, and Fraction 3 contained the core OSs with some possibly low molecular weight OPS repeat units. From these results, the Fraction 1/3 ratio for Ft LVS LPS is 17, while it is 4.6 for LVSG (Table 2). These results are consistent with the above data showing that the Ft LVSG strain contains less OPS as reflected by the lower QuiN level during composition analysis. Fractions 1 and 3 were analyzed by NMR spectrometry. Fraction 1 from both Ft LVS and Ft LVSG were compared to each other using 2D NMR experiments – COSY, TOCSY, NOESY, and HSQC (data not shown). These results indicate that the OPS from Ft LVS and Ft LVSG have the same structures. In addition, the data are completely consistent with the structure reported for F. tularensis strain 15, strain SchuS4, and OSU10 (Vinogradov et al., 2002; Prior et al., 2003; Thirumalapura et al., 2005). The results clearly support the conclusion that Ft LVS and Ft LVSG have the following OPS structure as previously reported for the above F. tularensis strains:
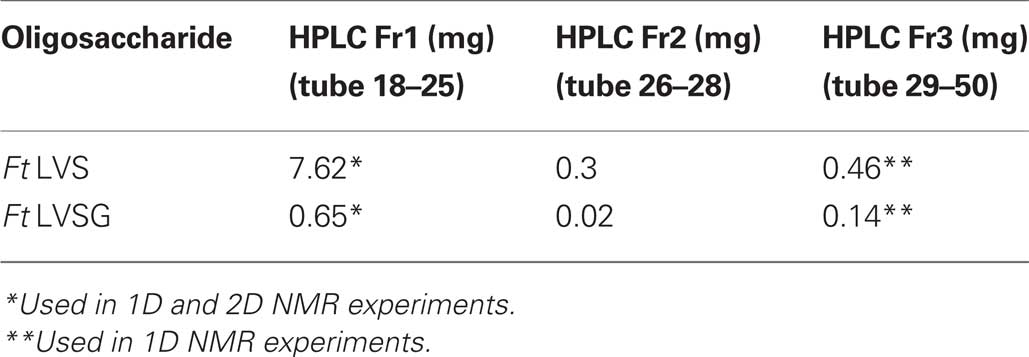
Table 2. Main fraction and yields obtained in gel filtration using Superdex peptide column.
-4)-α-D-GalpNAcAN-(1 → 4)-α-D-GalpNAcAN-(1 → 3)-β-D-QuipNAc-(1 → 2)-β-D-Quip4Fo-(1 →
The differential staining with the F. tularensis and F. novicida monoclonal antibodies coupled with the fact that the F. novicida monoclonal antibody binds to the LMW LPS and is, therefore, likely binding to the core OS, suggests that the true monoclonal antibody-tracked alteration between Ft LVS and Ft LVSG is related to the core region. Therefore, we analyzed OSs found in Fraction 3 from Ft LVS and Ft LVSG by 1D proton NMR spectroscopy. The results are shown in Figure 3. The spectrum of Ft LVS Fraction 3 indicates that a small amount of truncated OPS is still present. We also see resonances that are consistent with the published core structure with the exception that we do not observe evidence for the core GalNAc residue. The Ft LVS and Ft LVSG proton spectra clearly differ from one another indicating that the Ft LVSG Fraction 3 contains different structures than found in the Ft LVS Fraction 3. Therefore, since the OSs in Fraction 3 would be those that would comprise the core region, as well as some possible truncated OPS, these data support the conclusion that the Ft LVSG has an altered core region compared to that of Ft LVS.
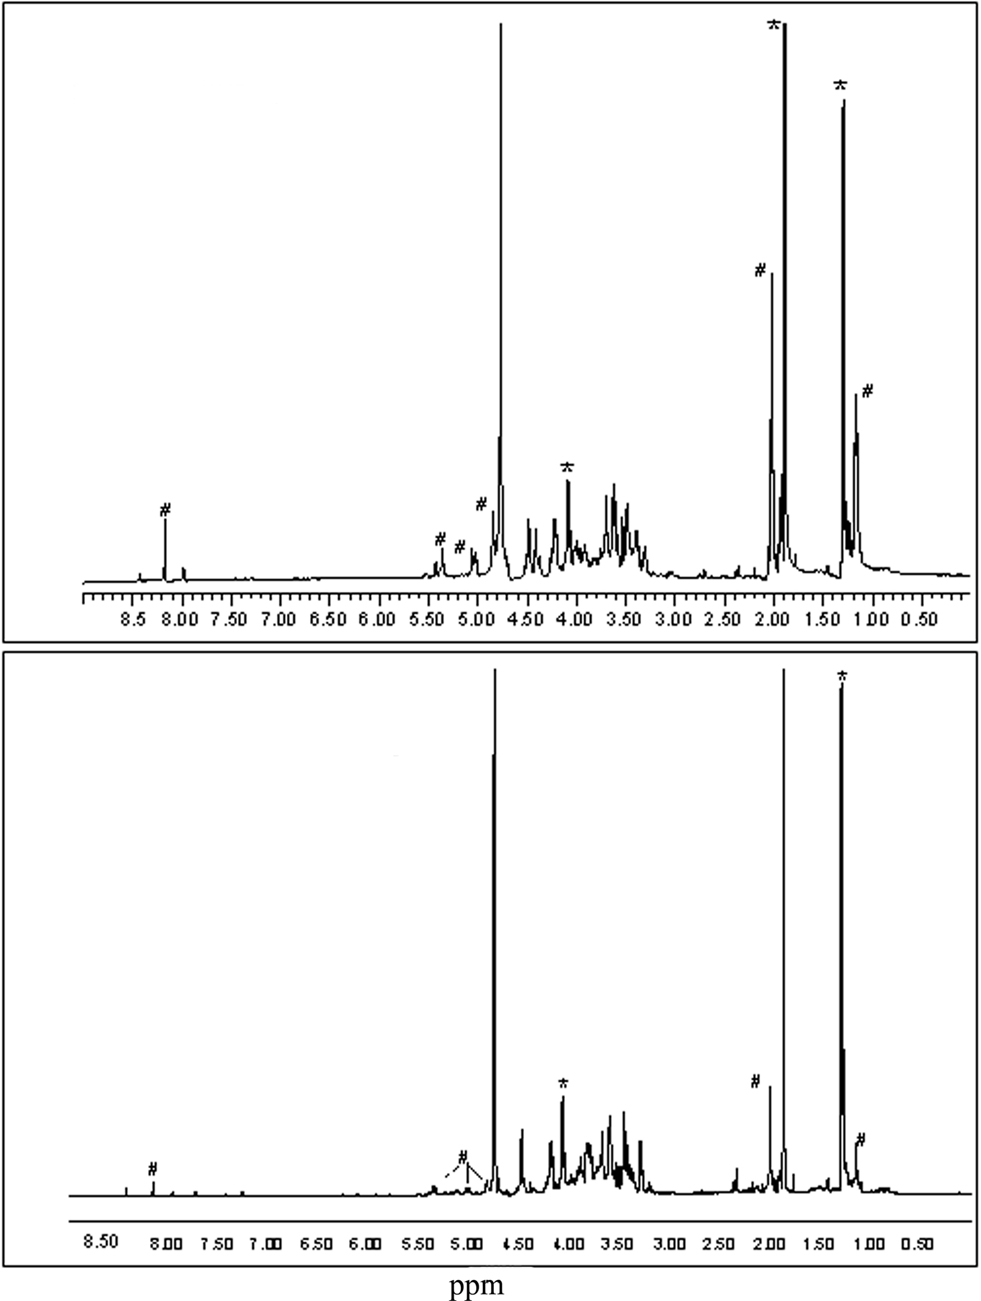
Figure 3. The proton NMR spectra of the LPS core region oligosaccharides from Ft LVS and Ft LVSG. The proton NMR spectra of the oligosaccharides found in Fraction 3 from Ft LVS (top) and Fraction 3 from Ft LVSG (bottom) are shown. The resonances marked with # are likely due to OPS fragments. Those marked with * are due to contaminating acetate and lactate. Thus, non-marked resonances denote the LPS core region.
Analysis of Ft LVSG Lipid a Demonstrates a Reduction in Galactosamine Modification
Cowley et al. (1996) demonstrated that Ft LVSG lipid A versus that of Ft LVS elicited increased NO induction in rat macrophages. We confirmed this finding (NO production by rat macrophages measured as nitrate by the Griess reagent system) by both Ft LVSG LPS and purified lipid A (data not shown). This suggested that the lipid A of Ft LVSG was different than that of Ft LVS. To explore these differences, we performed structural analyses on purified lipid A of Ft LVS and Ft LVSG. MALDI-TOF analysis in negative and positive ion mode was performed on replicate lipid A preparations. Both showed the absence of a peak at m/z 1666 in Ft LVSG that was present in Ft LVS. It is known that this peak represents the addition of galactosamine (161 Da) to the basic structure at m/z 1504 (2× GlcN, 3× C18:0 (3-OH), C16:0, P), though previous data suggested that this modification was not observed in the Ft LVS strain (Kanistanon et al., 2008; Figures 4A,B). This was the only structural alteration noted. Since the MALDI-TOF analysis is only semi-quantitative, we performed galactosamine quantitation assays to further demonstrate the reduced galactosamine modification of lipid A in Ft LVSG. The lipid A was derivatized and analyzed by GC–MS. F. novicida showed the highest degree of modification at 25% while Ft LVS was at 14%. Both Ft LVSG and Ft LVSGD showed reduced galactosamine modification, with 6 and 7%, respectively (Figure 5A).
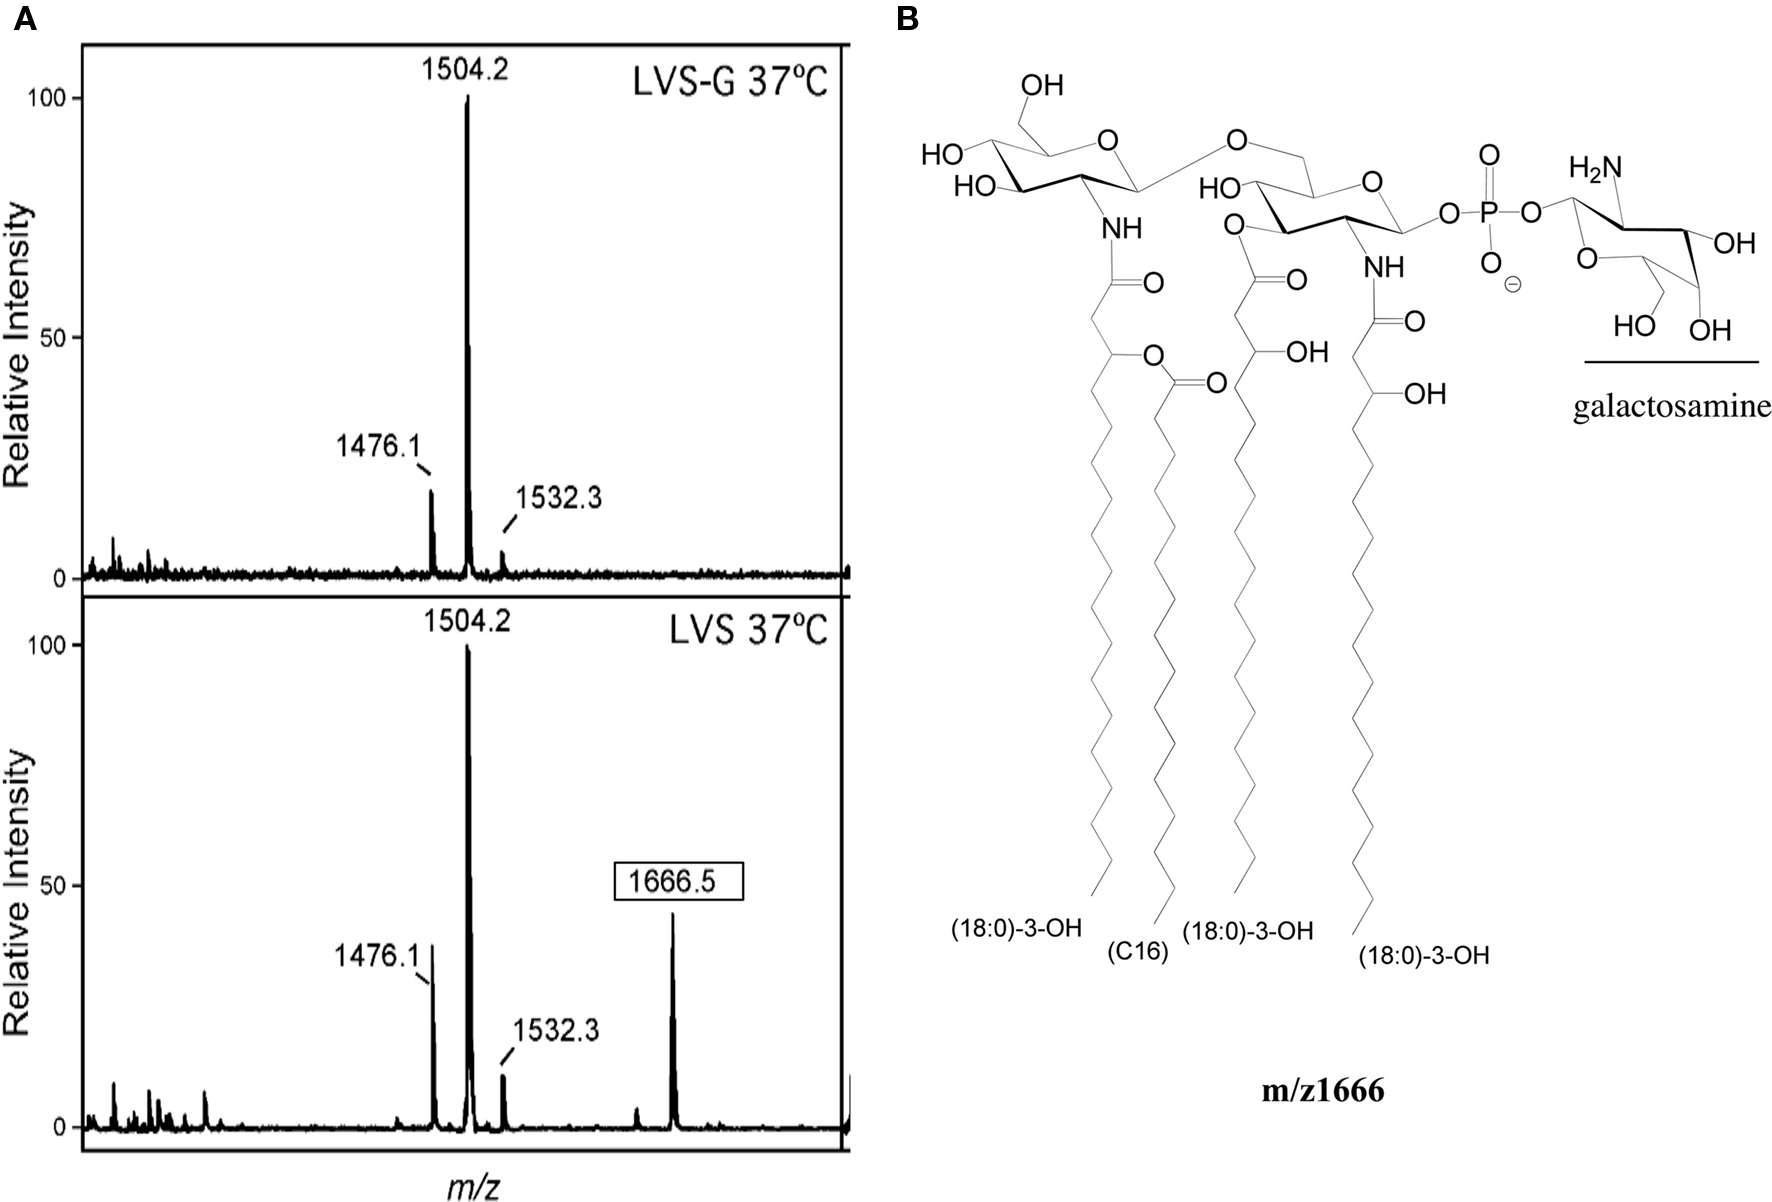
Figure 4. Structural analysis of lipid A. (A) MALDI-TOF analysis of lipid A of Ft LVS and Ft LVSG. The boxed m/z denotes the species containing galactosamine that shows differential relative intensity between Ft LVS and Ft LVSG. (B) The m/z 1666 structure of lipid A of Ft LVS.
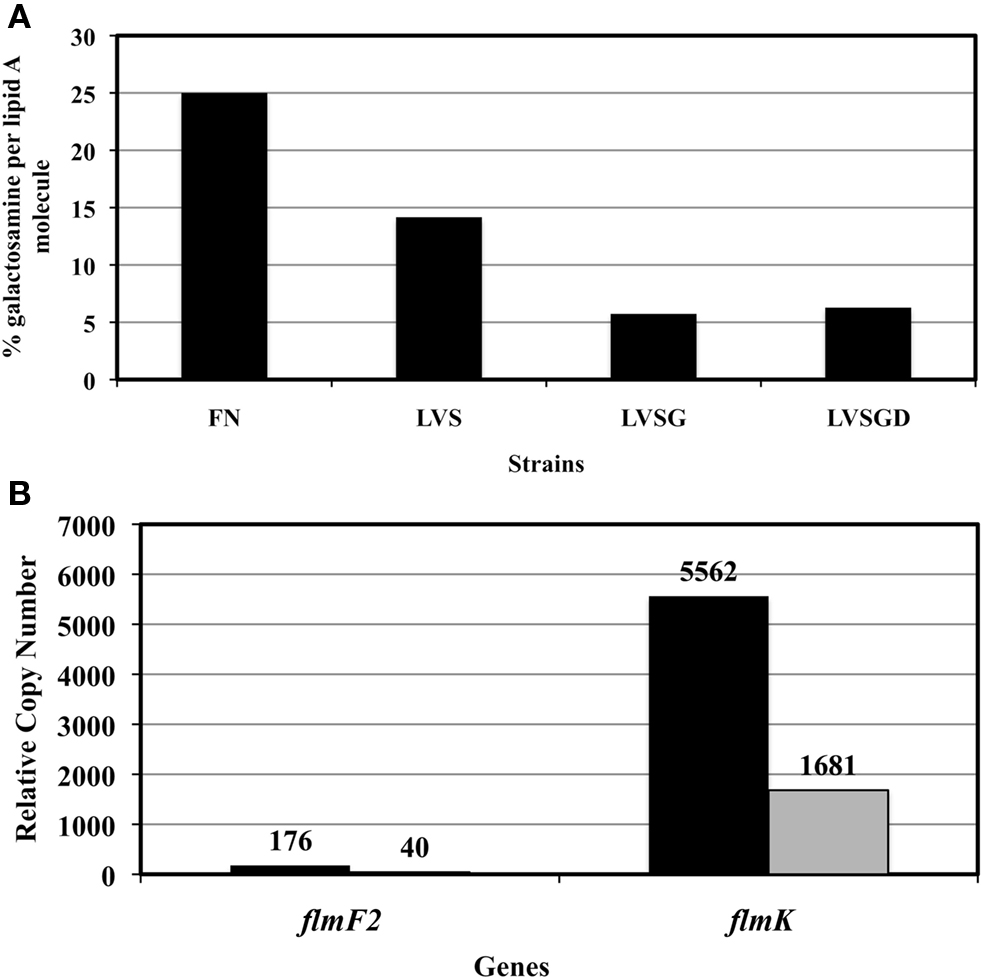
Figure 5. (A) Glucosamine quantification in the lipid A samples. (B) Differential expression of LPS modification genes flmF2 and flmK in Ft LVS and Ft LVSG as determined by real-time PCR. RCN-Relative copy number, actual values are shown above the bars.
Three genes have been identified that are responsible for galactosamine or mannose lipid A modification (Gunn and Ernst, 2007; Kanistanon et al., 2008). The transferases FlmF1 and FlmF2 are required for adding mannose or glucosamine residues, respectively, to the lipid A. The glycosyltransferase FlmK can add both mannose and galactosamine to lipid A (Gunn and Ernst, 2007; Kanistanon et al., 2008). A real-time PCR assay was performed on the genes flmF2 and flmK from Ft LVS and Ft LVSG to determine if their expression was altered and might be responsible for the observed lipid A galactosamine modification alteration. Expression of both genes was found to be significantly less in Ft LVSG (Figure 5B), correlating with the reduction in galactosamine modification. Mutation of the flmF2 gene in Ft LVS, which eliminates the galactosamine modification, reduced the frequency of phase variation from 30% to 5-7% in stationary phase liquid cultures. Though F. novicida strains carrying this mutation have been shown to affect mouse virulence and cytokine/chemokine induction in macrophages, the Ft LVS flmF2 mutant demonstrated no defect in survival in macrophages of mouse (Raw, J774.1 and MH-S), rat (bone marrow derived, alveolar), or human (THP-1 and monocyte derived macrophages) origin (data not shown, see below section).
The Ft LVSG Variant has a Rat and Human But not Mouse Intramacrophage Survival Defect
It has been shown previously by Cowley et al. (1996) that Ft LVS and Ft LVSG intracellular growth/survival was similar in mouse macrophages, but that differences in growth/survival could be visualized in rat bone marrow-derived macrophages. We examined the survival of Ft LVS and Ft LSVG in various macrophages including J774.1 (a mouse macrophage cell line), MH-S (a mouse alveolar macrophage cell line) and mouse bone marrow-derived macrophages and did not find any significant differences in survival of Ft LVS and Ft LSVG (data not shown). However, we observed that Ft LVSG survived less well in rat bone marrow derived macrophages and a rat alveolar macrophage cell line (ATCC# CRL-2192) and that this inhibition of growth of Ft LVSG can be reversed by using the NO inhibitor NMMA (data not shown). These findings were consistent with the previous findings of Cowley et al. (1996). We then examined intramacrophage survival in human MDMs and the THP-1 macrophage-like cell line. We observed that the Ft LVSG strain survived less well over the first 12 h post-infection in both cell types with macrophage cell death at later time points. The defect was most prominent for the MDMs, where the Ft LVSG strain demonstrated nearly a log defect in survival at 12 h post-infection versus the Ft LVS strain (Figure 6). Thus, the Ft LVSG strain has an intramacrophage survival defect in rat and human but not mouse macrophages.
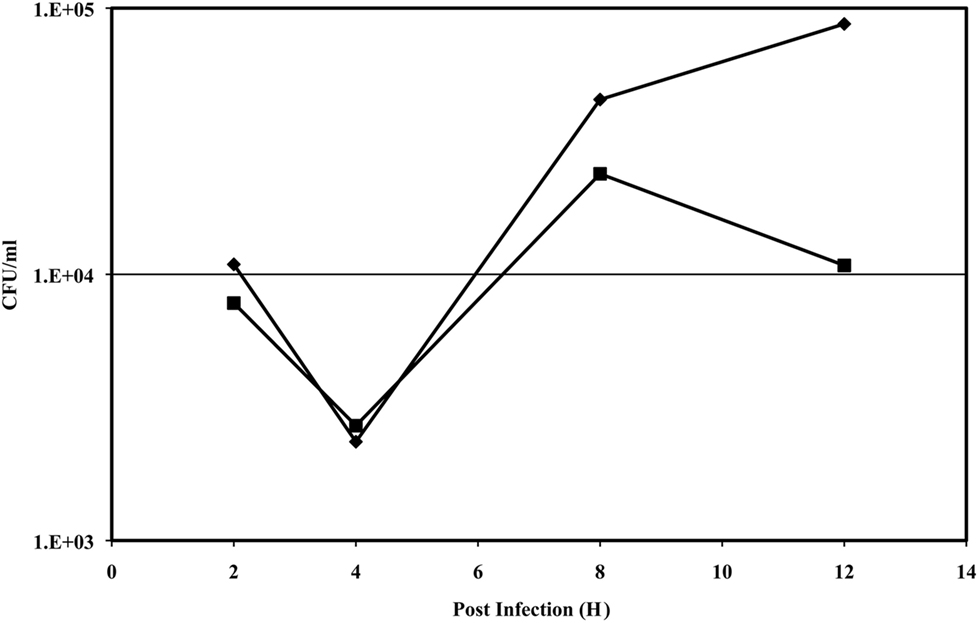
Figure 6. Intramacrophage survival assay of Ft LVS and Ft LVSG in human monocyte-derived macrophages. Symbols: diamond, Ft LVS; square, Ft LVSG. The data presented is from an assay performed in triplicate with little variation between replicates (resulting in non-visible error bars), and this experiment was performed three times on separate occasions with similar results.
Ft LVSG and Ft LVS are Similarly Virulent in the Mouse Model but Differentially Protect Against f. Tularensis Schus4 Challenge
Gray variants have been shown to be less virulent (Eigelsbach and Downs, 1961) and/or less protective as vaccines against F. tularensis SchuS4 challenge (Eigelsbach and Downs, 1961; Cowley et al., 1996; Hartley et al., 2006; Conlan and Oyston, 2007) However, the specific virulence of the Ft LVSG strain in the mouse model of tularemia has not been determined. To compare the virulence of Ft LVS and Ft LVSG, BALB/c mice were infected with 100 CFU of Ft LVS and Ft LVSG intranasally and observed for survival. Both Ft LVS and Ft LVSG infected mice demonstrated 80% survival (N = 10 mice; Figure 7A). The surviving mice were challenged with 1000 CFU of F. tularensis SchuS4 (∼100-fold above the LD50) intranasally 4 weeks post vaccination (Figure 7B). All Ft LVS vaccinated mice (N = 8) survived the challenge whereas Ft LVSG vaccinated mice (N = 8) could not survive the challenge and succumbed to infection within 5 days. These results suggest that Ft LVSG is as virulent in mice as Ft LVS but it does not protect against Type A challenge.
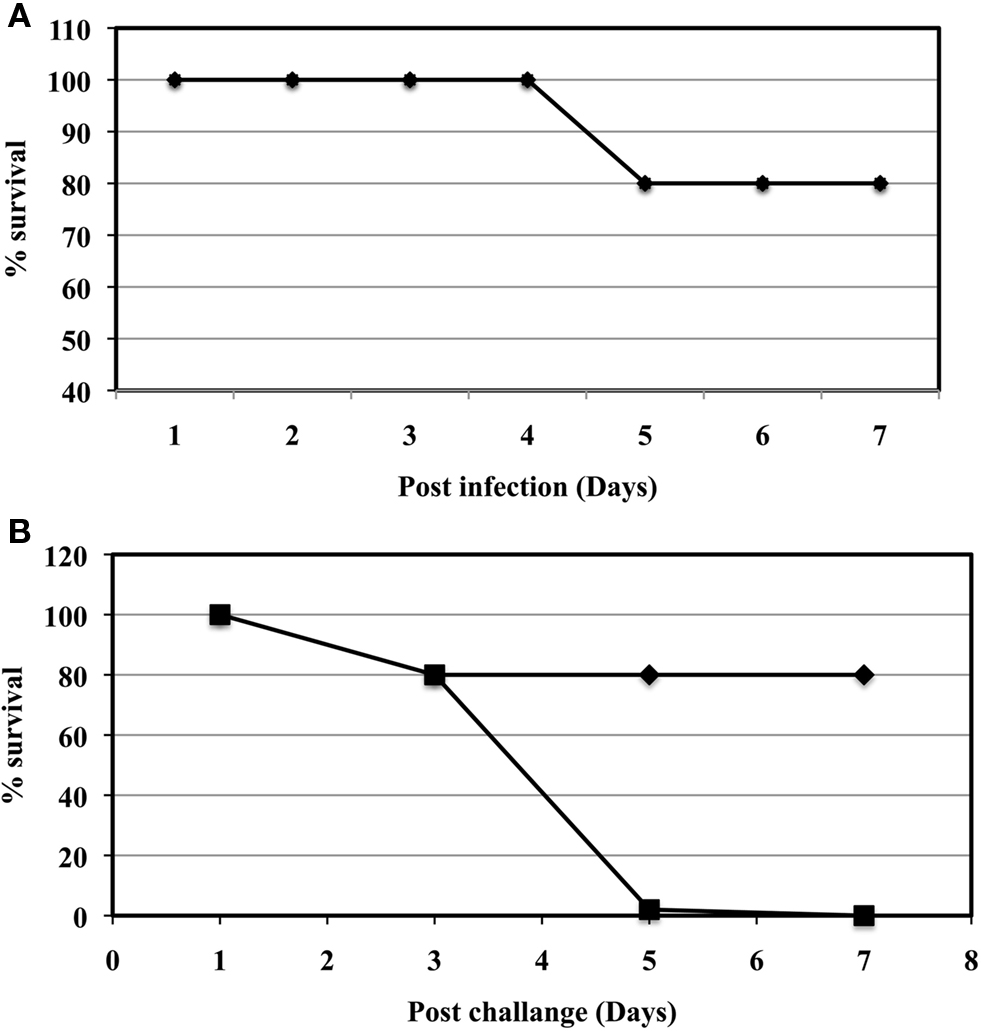
Figure 7. Virulence assays in the mouse model of tularemia. (A) The virulence of Ft LVS and Ft LVSG in mice inoculated by the intranasal route. Symbols: diamond, Ft LVS; square, Ft LVSG. N = 10 mice per strain. (B) Challenge of vaccinated mice with F. tularensis SchuS4. Symbols: diamond, Ft LVS; square, Ft LVSG. N = 8 mice per strain.
Discussion
Francisella tularensis LVS has been known to phase vary from a blue (i.e., wildtype) to a gray variant since the phenomenon was first described by Eigelsbach in 1951 (Eigelsbach et al., 1951). Such variation has proven to be an issue historically in vaccine production runs of Ft LVS (Conlan and Oyston, 2007; Oyston, 2009). The Ft LVS gray variants are problematic because they are dramatically less efficacious than the blue colony morphotypes in protection studies against the virulent F. tularensis Type A strain. The phenotypes associated with the gray variants are quite variable, as they have been described to give rise to different colony sizes and opacity, but the only two that have been molecularly characterized share the characteristic of LPS alteration. While this characteristic is shared, this also presents yet another difference, as the gray variant described by Hartley et al. (2006), (similar to Ft LVSGD studied in this work) has been shown to lack O-antigen while Ft LVSG still possessed an O-antigen, albeit reduced in amount, which has altered F. novicida/F. tularensis-LPS specific monoclonal antibody reactivity patterns. Thus, gray variants are themselves variable, but an increased understanding of the mechanism(s) behind this variation would aid future tularemia vaccine production.
In addition to the presence/absence of the O-antigen, we demonstrate biochemically that the Ft LVSG O-antigen chain carbohydrates are reduced in Ft LVSG versus Ft LVS. It is unclear if this demonstrates that the O-antigen chain length of LVSG is shorter or if the lipid A plus core is capped less efficiently with O-antigen. A reduction in Ft LVSG O-antigen chain carbohydrates was previously suggested in a manuscript by Clay et al. (2008) based on evidence from silver staining patterns and Western blot analysis. Clay et al. (2008) also demonstrated that the Ft LVSG strain was bound by complement component C3 in higher amounts than Ft LVS and was dramatically more susceptible to complement-mediated killing. It is of interest that, while susceptible to complement, Ft LVSG is still as virulent as Ft LVS in the mouse model. It is likely that the effect of complement-mediated killing is quantitative rather than absolute and that the current mouse model is not sensitive enough to record an effect. Alternatively, the result in the mouse model may reflect a fundamental difference in complement function between mouse and man. For example, it is known that C3 in mouse serum is more labile than in human serum and this may result in different levels of C3 opsonization and regulation in mouse versus human serum.
Both F. tularensis and F. novicida anti-LPS monoclonal antibodies reacted with LVSG, which had been interpreted to demonstrate that the O-antigen of Ft LVSG was altered, creating an epitope(s) reactive to both antibodies. However, closer examination of the Western blots show F. novicida monoclonal antibody reactivity to Ft LVSG LPS with low molecular weight species, likely lipid A plus core, as well as higher species containing lipid A, plus core, plus O-antigen repeats. The F. novicida anti-LPS monoclonal antibody reacted only with the low molecular weight species to Ft LVS LPS. This suggested that the F. novicida anti-LPS monoclonal antibody recognized a core epitope and that core, and not the O-antigen regions of Ft LVS and Ft LVSG, may differ. This was confirmed by NMR analysis of purified LPS carbohydrates, which demonstrated identity between the Ft LVSG and Ft LVS O-antigen regions while the LPS core region of Ft LVSG was different from that of Ft LVS. If, as we suspect, the F. novicida anti-LPS monoclonal antibody epitope is within the core region and the Ft LVS anti-LPS monoclonal epitope is within the O-antigen, then because of observed Western blot reactivities, both Ft LVS and Ft LVSG contain an “F. novicida-like” core. Thus, it is possible that Ft LVS makes two distinct core OSs (an F. novicida monoclonal antibody reactive and an Ft monoclonal antibody reactive), but cannot add O-antigen to the “F. novicida-like” core. Ft LVSG, on the other hand, can either produce both core types and ligate O-antigen to both, or can only make the F. novicida reactive core type and can add O-antigen to this core.
Regarding the mechanism of O-antigen chain length reduction/differential O-antigen ligation, these processes are typically mediated by an O-antigen ligase (e.g., RfaL), O-antigen polymerase (e.g., Wzy) and a chain length determinant (e.g., Cld). Francisella spp. appear to have multiple proteins with homology to RfaL, and their differential expression may account for the observed O-antigen phenotypes. BLAST searches of the Ft LVS genome with the RfaL locus of Salmonella typhimurium revealed three high scoring loci: FTL1122 (41% identity but 188 amino acids in Ft LVS versus 292 amino acids in F. tularensis SchuS4), FTL 0706 (37% identity), and FTL0598 (26% identity, called the wzy locus in Ft LVS; Prior et al., 2003). Surprisingly, BLAST searches with the S. typhimurium Wzy showed no strong identity to Francisella proteins. No Cld ortholog exists in F. tularensis (Prior et al., 2003; our recent BLAST searches). It is unclear if another unknown enzyme serves this function or is the O-antigen chain length is unregulated in this bacterium. Thus, it is possible that multiple or novel proteins mediate the O-antigen polymerase, ligase and length determination functions in Francisella and may be responsible for the core/O-antigen data described here. Further biochemical analysis is ongoing to determine the exact structural changes in the Ft LVSG LPS core region, as are genetic experiments to identify genes conferring F. novicida monoclonal antibody reactivity to Ft LVS.
The lipid A regions of Ft LVS and Ft LVSG were shown to be identical with the exception of a galactosamine modification, which was reduced/absent in the Ft LVSG variant. The galactosamine modification was not detected previously in Ft LVS, but was clearly evident in the Ft LVS strain analyzed here. Mannose is also observed as a modification of lipid A in F. novicida and Type A subspecies, but not Type B subspecies (the background of the Ft LVS strain). Consistent with these published data, mannose was not observed in our assays. While the flmF2 (glucosamine addition) and flmK (both mannose and glucosamine addition) genes showed reduced transcription in the Ft LVSG strain consistent with the reduced lipid A modification, mutants in these genes in Ft LVS did not result in the small colony or gray phenotype on plates nor were the mutants defective in intramacrophage survival. Thus, these mutants did not exhibit obvious characteristics of the Ft LVSG gray variant. These mutants did, however, demonstrate a dramatically reduced phase variation rate to gray variants, suggesting that galactosamine modification may be involved in but is not sufficient for the gray phenotype. Further phenotypic testing (e.g., lipid A NO induction, mouse virulence) is ongoing, as is the construction of a double flmF2 flmK mutant. It is also possible that no expression versus reduced expression of these enzymes may have different effects, but titrated gene expression in Francisella is not yet a reality, so this concern will be addressed when the technology is available.
Experiments performed in this study confirmed those of Cowley et al. (1996) regarding increased NO induction in rat but not mouse phagocytes by the gray strain LPS. This correlated with decreased survival of these gray variants in rat and human macrophages, which could be reversed in rat macrophages by the addition of a NO synthase inhibitor. However, experience suggests that stimulated mouse macrophages are better capable than, for e.g., human MDMs, of NO production. Thus, there is no direct correlation of strain intracellular survival with the inherent capabilities of the macrophages of the chosen animal model to produce NO, suggesting the involvement of additional factors.
Based on the results of Eigelsbach and colleagues (Eigelsbach et al., 1951; Eigelsbach and Downs, 1961) and Hartley et al. (2006), we were surprised that the Ft LVSG strain did not possess a virulence defect by the intranasal route. However, in the Hartley et al. (2006) study, mice were vaccinated and challenged by the subcutaneous route, and the Eigelsbach work (Eigelsbach et al., 1951; Eigelsbach and Downs, 1961) typically used intraperitoneal vaccination and subcutaneous challenge. Thus the route of administration may play a role in gray variant virulence. Consistent in all gray variant mouse model vaccination experiments is their reduced capacity to protect against challenge by the Type A F. tularensis subspecies. The mechanism behind the lack of protective capacity is not known. Ft LVS flmF2 and flmK mutants were avirulent in the mouse model, thus the observed reduction in galactosamine modification may play a role in early clearance and the lack of development of a protective immune response (Kanistanon et al., 2008). While 1-D gel electrophoresis of whole cell lysates and fractions showed no obvious protein differences between Ft LVSG and Ft LVS, it is possible that these bacteria may possess alterations other than those observed in the LPS. Ongoing assays include microarray analysis, 2-D gel electrophoresis and other more sophisticated proteomic analysis. The continued study of gray variants of F. tularensis will provide important mechanistic details behind these phenotypically distinct bacteria, which will move the field closer to the ability to phase lock a wildtype strain for the development of effective and safe tularemia vaccines.
Conflict of Interest Statement
The authors declare that the research was conducted in the absence of any commercial or financial relationships that could be construed as a potential conflict of interest.
Acknowledgments
The authors thank Robert House, Andrew Hoover, Robert Miller, and Steve Matthews of DynPort Vaccine Company LLC, a CSC company, for the strain we named LVSGD. The authors also thank Francis Nano for his guidance in the initial work on Francisella including Ft LVSG, Brian Bell for his help with visualizing gray variants, and Larry Schlesinger for his assistance with the MDM model. This work was sponsored by the NIH/NIAID Regional Center of Excellence for Bio-defense and Emerging Infectious Diseases Research (RCE) Program. This work was partially supported by a grant from the DOE (DE-FG02-98ER20307) to the CCRC . The authors wish to acknowledge membership within and support from the Region V “Great Lakes” RCE (NIH award 2-U54-AI-057153).
References
Apicella, M. A., Griffiss, J. M., and Schneider, H. (1994). Isolation and characterization of lipopolysaccharides, lipooligosaccharides, and lipid A. Methods Enzymol. 235, 242–252.
Caroff, M., Tacken, A., and Szabo, L. (1988). Detergent-accelerated hydrolysis of bacterial endotoxins and determination of the anomeric configuration of the glycosyl phosphate present in the “isolated lipid A” fragment of the Bordetella pertussis endotoxin. Carbohydr. Res. 175, 273–282.
Clay, C. D., Soni, S., Gunn, J. S., and Schlesinger, L. S. (2008). Evasion of complement-mediated lysis and complement C3 deposition are regulated by Francisella tularensis lipopolysaccharide O antigen. J. Immunol. 181, 5568–5578.
Conlan, W. J., and Oyston, P. C. (2007). Vaccines against Francisella tularensis. Ann. N. Y. Acad. Sci. 1105, 325–350.
Cowley, S. C., Myltseva, S. V., and Nano, F. E. (1996). Phase variation in Francisella tularensis affecting intracellular growth, lipopolysaccharide antigenicity and nitric oxide production. Mol. Microbiol. 20, 867–874.
Eigelsbach, H. T., Braun, W., and Herring, R. D. (1951). Studies on the variation of Bacterium tularense. J. Bacteriol. 61, 557–569.
Eigelsbach, H. T., and Downs, C. M. (1961). Prophylactic effectiveness of live and killed tularemia vaccines. I. Production of vaccine and evaluation in the white mouse and guinea pig. J. Immunol. 87, 415–425.
Ellis, J., Oyston, P. C., Green, M., and Titball, R. W. (2002). Tularemia. Clin. Microbiol. Rev. 15, 631–646.
Gunn, J. S., and Ernst, R. K. (2007). The structure and function of Francisella lipopolysaccharide. Ann. N. Y. Acad. Sci. 1105, 202–218.
Hartley, G., Taylor, R., Prior, J., Newstead, S., Hitchen, P. G., Morris, H. R., Dell, A., and Titball, R. W. (2006). Grey variants of the live vaccine strain of Francisella tularensis lack lipopolysaccharide O-antigen, show reduced ability to survive in macrophages and do not induce protective immunity in mice. Vaccine 24, 989–996.
Kalhorn, T. F., Kiavand, A., Cohen, I. E., Nelson, A. K., and Ernst, R. K. (2009). A sensitive liquid chromatography/mass spectrometry-based assay for quantitation of amino-containing moieties in lipid A. Rapid Commun. Mass Spectrom. 23, 433–442.
Kanistanon, D., Hajjar, A. M., Pelletier, M. R., Gallagher, L. A., Kalhorn, T., Shaffer, S. A., Goodlett, D. R., Rohmer, L., Brittnacher, M. J., Skerrett, S. J., and Ernst, R. K. (2008). A Francisella mutant in lipid A carbohydrate modification elicits protective immunity. PLoS Pathog. 4, e24. doi: 10.1371/journal.ppat.0040024.
Keim, P., Johansson, A., and Wagner, D. M. (2007). Molecular epidemiology, evolution, and ecology of Francisella. Ann. N. Y. Acad. Sci. 1105, 30–66.
Mohapatra, N. P., Soni, S., Bell, B. L., Warren, R., Ernst, R. K., Muszynski, A., Carlson, R. W., and Gunn, J. S. (2007). Identification of an orphan response regulator required for the virulence of Francisella spp. and transcription of pathogenicity island genes. Infect. Immun. 75, 3305–3314.
Mohapatra, N. P., Soni, S., Rajaram, M. V., Dang, P. M., Reilly, T. J., El-Benna, J., Clay, C. D., Schlesinger, L. S., and Gunn, J. S. (2010). Francisella acid phosphatases inactivate the NADPH oxidase in human phagocytes. J. Immunol. 184, 5141–5150.
Mohapatra, N. P., Soni, S., Reilly, T. J., Liu, J., Klose, K. E., and Gunn, J. S. (2008). Combined deletion of four Francisella novicida acid phosphatases attenuates virulence and macrophage vacuolar escape. Infect. Immun. 76, 3690–3699.
Oyston, P. C., Sjostedt, A., and Titball, R. W. (2004). Tularaemia: bioterrorism defence renews interest in Francisella tularensis. Nat. Rev. Microbiol. 2, 967–978.
Prior, J. L., Prior, R. G., Hitchen, P. G., Diaper, H., Griffin, K. F., Morris, H. R., Dell, A., and Titball, R. W. (2003). Characterization of the O antigen gene cluster and structural analysis of the O antigen of Francisella tularensis subsp. tularensis. J. Med. Microbiol. 52, 845–851.
Rohmer, L., Brittnacher, M., Svensson, K., Buckley, D., Haugen, E., Zhou, Y., Chang, J., Levy, R., Hayden, H., Forsman, M., Olson, M., Johansson, A., Kaul, R., and Miller, S. I. (2006). Potential source of Francisella tularensis live vaccine strain attenuation determined by genome comparison. Infect. Immun. 74, 6895–6906.
Sjostedt, A. (2007). Tularemia: history, epidemiology, pathogen physiology, and clinical manifestations. Ann. N. Y. Acad. Sci. 1105, 1–29.
Thirumalapura, N. R., Goad, D. W., Mort, A., Morton, R. J., Clarke, J., and Malayer, J. (2005). Structural analysis of the O-antigen of Francisella tularensis subspecies tularensis strain OSU 10. J. Med. Microbiol. 54, 693–695.
Vinogradov, E., Perry, M. B., and Conlan, J. W. (2002). Structural analysis of Francisella tularensis lipopolysaccharide. Eur. J. Biochem. 269, 6112–6118.
Wehrly, T. D., Chong, A., Virtaneva, K., Sturdevant, D. E., Child, R., Edwards, J. A., Brouwer, D., Nair, V., Fischer, E. R., Wicke, L., Curda, A. J., Kupko, J. J. III, Martens, C., Crane, D. D., Bosio, C. M., Porcella, S. F., and J. Celli. (2009). Intracellular biology and virulence determinants of Francisella tularensis revealed by transcriptional profiling inside macrophages. Cell. Microbiol. 11, 1128–1150.
Keywords: Francisella, LPS, phase variation, tularemia, vaccine
Citation: Soni S, Ernst RK, Muszynski A, Mohapatra NP, Perry MB, Vinogradov E, Carlson RW and Gunn JS (2010) Francisella tularensis blue–gray phase variation involves structural modifications of lipopolysaccharide O-antigen, core and lipid A and affects intramacrophage survival and vaccine efficacy. Front. Microbio. 1:129. doi: 10.3389/fmicb.2010.00129
Received: 31 August 2010;
Accepted: 28 October 2010;
Published online: 19 November 2010.
Edited by:
Adel M. Talaat, University of Wisconsin Madison, USAReviewed by:
Martin I. Voskuil, University of Colorado Denver, USAFrancis Nano, University of Victoria, Canada
Copyright: © 2010 Soni, Ernst, Muszynski, Mohapatra, Perry, Vinogradov, Carlson and Gunn. This is an open-access article subject to an exclusive license agreement between the authors and the Frontiers Research Foundation, which permits unrestricted use, distribution, and reproduction in any medium, provided the original authors and source are credited.
*Correspondence: John S. Gunn, The Ohio State University, Biomedical Research Tower, Rm. 1006, 460 W. 12th Ave., Columbus, OH 43210-1214, USA. e-mail: john.gunn@osumc.edu