Microbial, Physical, and Chemical Changes in Galveston Bay Following an Extreme Flooding Event, Hurricane Harvey
 Jamie L. Steichen1*
  Jessica M. Labonté1
  Rachel Windham1
  David Hala1
  Karl Kaiser2,3
  Samantha Setta1 Patricia C. Faulkner1
  Hernando Bacosa1
  Ge Yan2 Manoj Kamalanathan1
  Antonietta Quigg1,3
- 1Department of Marine Biology, Texas A&M University at Galveston, Galveston, TX, United States
- 2Department of Marine Science, Texas A&M University at Galveston, Galveston, TX, United States
- 3Department of Oceanography, Texas A&M University, College Station, TX, United States
Hurricane Harvey (category four storm) made landfall along the coast of Texas (United States) and then stalled out over Texas and Louisiana, releasing 1.29 × 10¹¹ m3 of precipitation over 5 days. This caused extensive flooding that elevated freshwater river discharge and land runoff into Galveston Bay and eventually into the Gulf of Mexico. The floodwaters delivered a significant influx of dissolved organic carbon (DOC), organic pollutants and nutrients along with terrestrial and freshwater associated microbes. Over the 24 days following the flooding event, samples were collected on five cruises across Galveston Bay from the mouth of the San Jacinto River (Houston, TX, United States) to the Gulf of Mexico. Parameters measured for this study include: water quality (temperature, salinity, pH, and dissolved oxygen), nutrients (NO3–, NO2–, NH4+, Pi, and HSiO3–), polycyclic aromatic hydrocarbons (PAHs), pharmaceuticals (cotinine, carbamazepine, carbamazepine-epoxide, and prednisone), biocide (imidacloprid), DOC, bacteria, and the eukaryotic community composition (16S and 18S rRNA genes). In the week after the flood event, bay-wide salinities decreased to 0–5 compared to the higher pre-Harvey salinities of 20–30 (recorded 5 days before the flood). Water treatment facilities and petrochemical plants were compromised due to the heavy flooding in the region. Increased concentrations of DOC, nutrients, PAHs, pharmaceuticals, and biocides were observed across Galveston Bay immediately following the storm. During the 4 weeks after Harvey, concentrations of DOC, nutrients, and organic pollutants began to decrease coinciding with rising salinities as the freshwater was flushed into the Gulf of Mexico and seawater began moving back into the Bay. Successive blooms of Chlorophyta, diatoms (Bacillariophyta), and dinoflagellates (Dinophyta) occurred similar to post-storm communities from past hurricanes that have impacted estuarine systems along the Gulf of Mexico. The bacterial community showed an increase in the abundance of bacteria associated with terrestrial soils and freshwater at the initial time point and then decreased over time and were replaced by their estuarine and marine relatives within the month following the hurricane. The eukaryotic community changed substantially following Harvey and did not recover to pre-Harvey conditions during our study period, suggesting a longer recovery time compared to the prokaryotes. Although the water quality parameters and prokaryotic community showed signs of returning to pre-Harvey conditions within the month following the flood event, long-term impacts need to be measured in the years following the flood.
Introduction
Houston, Texas (United States) is located within the watershed of Galveston Bay, which is the second largest estuary system in the northern Gulf of Mexico. The volume of freshwater delivered to Galveston Bay during Hurricane Harvey (1.40–1.70 × 10¹⁰ m3) was similar in magnitude to the volume of freshwater inflow that is typically delivered to the Bay over the course of a year (1.86 × 10¹⁰ m3) [Du et al., 2019; Texas Water Development Board, 2019; Thyng et al., 2020 (in review)]. During the passing of Hurricane Harvey from 25–30 August 2017, more than 1.29 × 10¹¹ m3 of rain fell across Texas and Louisiana (United States). It is estimated that during the flooding event, locations in Houston, TX, sank into the Earth ∼2 cm where rainfall totals reached up to 1.54 m (van Oldenborgh et al., 2017; Blake and Zelinsky, 2018; Milliner et al., 2018).
The Trinity and San Jacinto Rivers deliver >70% of the freshwater inflow into Galveston Bay (Guthrie et al., 2012). Highly contaminated Superfund sites which were compromised from the deluge that Hurricane Harvey produced (Chapin, 2017) are located within the lower watershed of the San Jacinto River. Spills from compromised wastewater treatment systems, industrial facilities, oil refineries, and chemical plants released > 1.17 × 10⁵ m3 of raw sewage and toxic chemicals as well as 4.53 × 10⁵ kg of deadly air pollutants (Environment Texas Research and Policy Center, 2017; van Oldenborgh et al., 2017; Wolf, 2017; Kiaghadi and Rifai, 2019). Pollutants released by Texas facilities include benzene, 1,3-butadiene, hexane, hydrogen sulfide, toluene, and xylene (all known carcinogens except hexane) and >300,000 kg of sulfur dioxide, which can lead to the formation of dangerous contaminants (Wolf, 2017). Non-point sources of polycyclic aromatic hydrocarbons (PAHs) could have also included those previously found in the sealant of parking lots (Van Metre et al., 2006) and in sediments disturbed by floodwaters (Horney et al., 2018). Due to the increased industrial pollution in the region, Galveston Bay sediments and biota are traditionally key focus areas for environmental monitoring of petrogenic PAHs, and legacy pollutants such as polychlorinated biphenyls (PCBs), dioxins, and metals (Roach et al., 1993; Willett et al., 1997; Qian et al., 2001; Suarez et al., 2006; Howell et al., 2008; Lakshmanan et al., 2010; Yin et al., 2015). While attention is typically focused on monitoring such pollutants, recent concerns have grown for the environmental presence of new or “emerging” pollutants (Ankley et al., 2007; Boxall et al., 2012), such as pharmaceuticals and/or biocides (PBs). Although the occurrence and bioaccumulation potential of select PBs has been reported in surface waters and fish inhabiting river systems (Du et al., 2016), to our knowledge studies focused on the presence of PBs in the Galveston Bay watershed have not been conducted previously.
Previous studies on the water quality within Galveston Bay have been conducted which have provided a baseline of the pre-Harvey conditions (Guo et al., 1999; Örnólfsdóttir et al., 2004; Roelke et al., 2013; Dorado et al., 2015). Freshwater inflow pulses which deliver nutrients and organic matter to Galveston Bay vary seasonally, producing a dynamic and complex system (Roelke et al., 2013; Dorado et al., 2015; Pinckney et al., 2017). The microbial community responds to variations in the water quality by displaying seasonal changes in the community structure within this highly productive estuary (Lester and Gonzalez, 2011; Roelke et al., 2013; Dorado et al., 2015). Depending on the volume of freshwater delivered to Galveston Bay, phytoplankton biomass has actually been shown to decrease following these pulses due to hydraulic displacement (Roelke et al., 2013). The response of the phytoplankton community has also been shown to be dependent on the level of nutrient limitation present before the freshwater pulse occurs (Roelke et al., 2013; Dorado et al., 2015). Guo et al. (1999) observed that dissolved organic carbon (DOC) in Galveston Bay decreased non-conservatively with increasing salinity indicating a removal of the DOC with increased mixing between freshwater and seawater. At low to intermediate salinities input of DOC was observed that was attributed to primary productivity and resuspension of DOC from bottom sediments.
Hurricane Harvey caused extensive flooding of rivers and produced land runoff to the point that freshwater draining into Galveston Bay via the Houston Ship Channel pushed the leading edge of the saltwater wedge out toward the Gulf of Mexico [Du et al., 2019; Thyng et al., 2020 (in review)]. Flooding of this volume has not been recorded previously in Galveston Bay leading to questions regarding the response of the biological community. This paper summarizes the water quality parameters, PBs, DOC, PAHs, and changes in the microbial community (16S rRNA and 18S rRNA analyses) in Galveston Bay immediately following Hurricane Harvey. Collectively, these findings show a transition from an estuarine microbial community preceding the hurricane to a primarily freshwater microbial community after the flooding event, which then began the shift back to an estuarine/marine biotic community. Within the month after the passing of the hurricane, the prokaryotes showed signs of returning to a pre-flooding community while the eukaryotic community still appeared to be in transition. The impacts of the increased contaminants and the extensive period of low salinity should be monitored in years to come to determine the long-term effects on the biological community including the fisheries. This collaborative effort will allow for improved understanding of the physicochemical and biological changes following a large storm event within subtropical estuaries.
Materials and Methods
Study Area and Sampling Design
The San Jacinto and Trinity Rivers are the two major sources of freshwater inflows to Galveston Bay (Figure 1), delivering 16 and 55% of the annual riverine discharge to the northwest and northeastern reaches of the Bay, respectively (Guthrie et al., 2012). Buffalo Bayou, adjacent to the San Jacinto River, brings in an additional 12% while smaller tributaries around the Bay account for the rest of the inputs (Guthrie et al., 2012; Figure 1). Five sampling cruises T1 (09/04/2017), T2 (09/09/2017), T3 (09/16/2017), T4 (09/21/2017), and T5 (09/28/2017) were conducted during the month following Hurricane Harvey onboard the R/V Trident. Ten stations (1–10) were sampled to capture the conditions immediately following Hurricane Harvey on a transect from the San Jacinto River mouth (station 1) near the Port of Houston to the mouth of Galveston Bay near the Gulf of Mexico (station 10) (Figure 1).
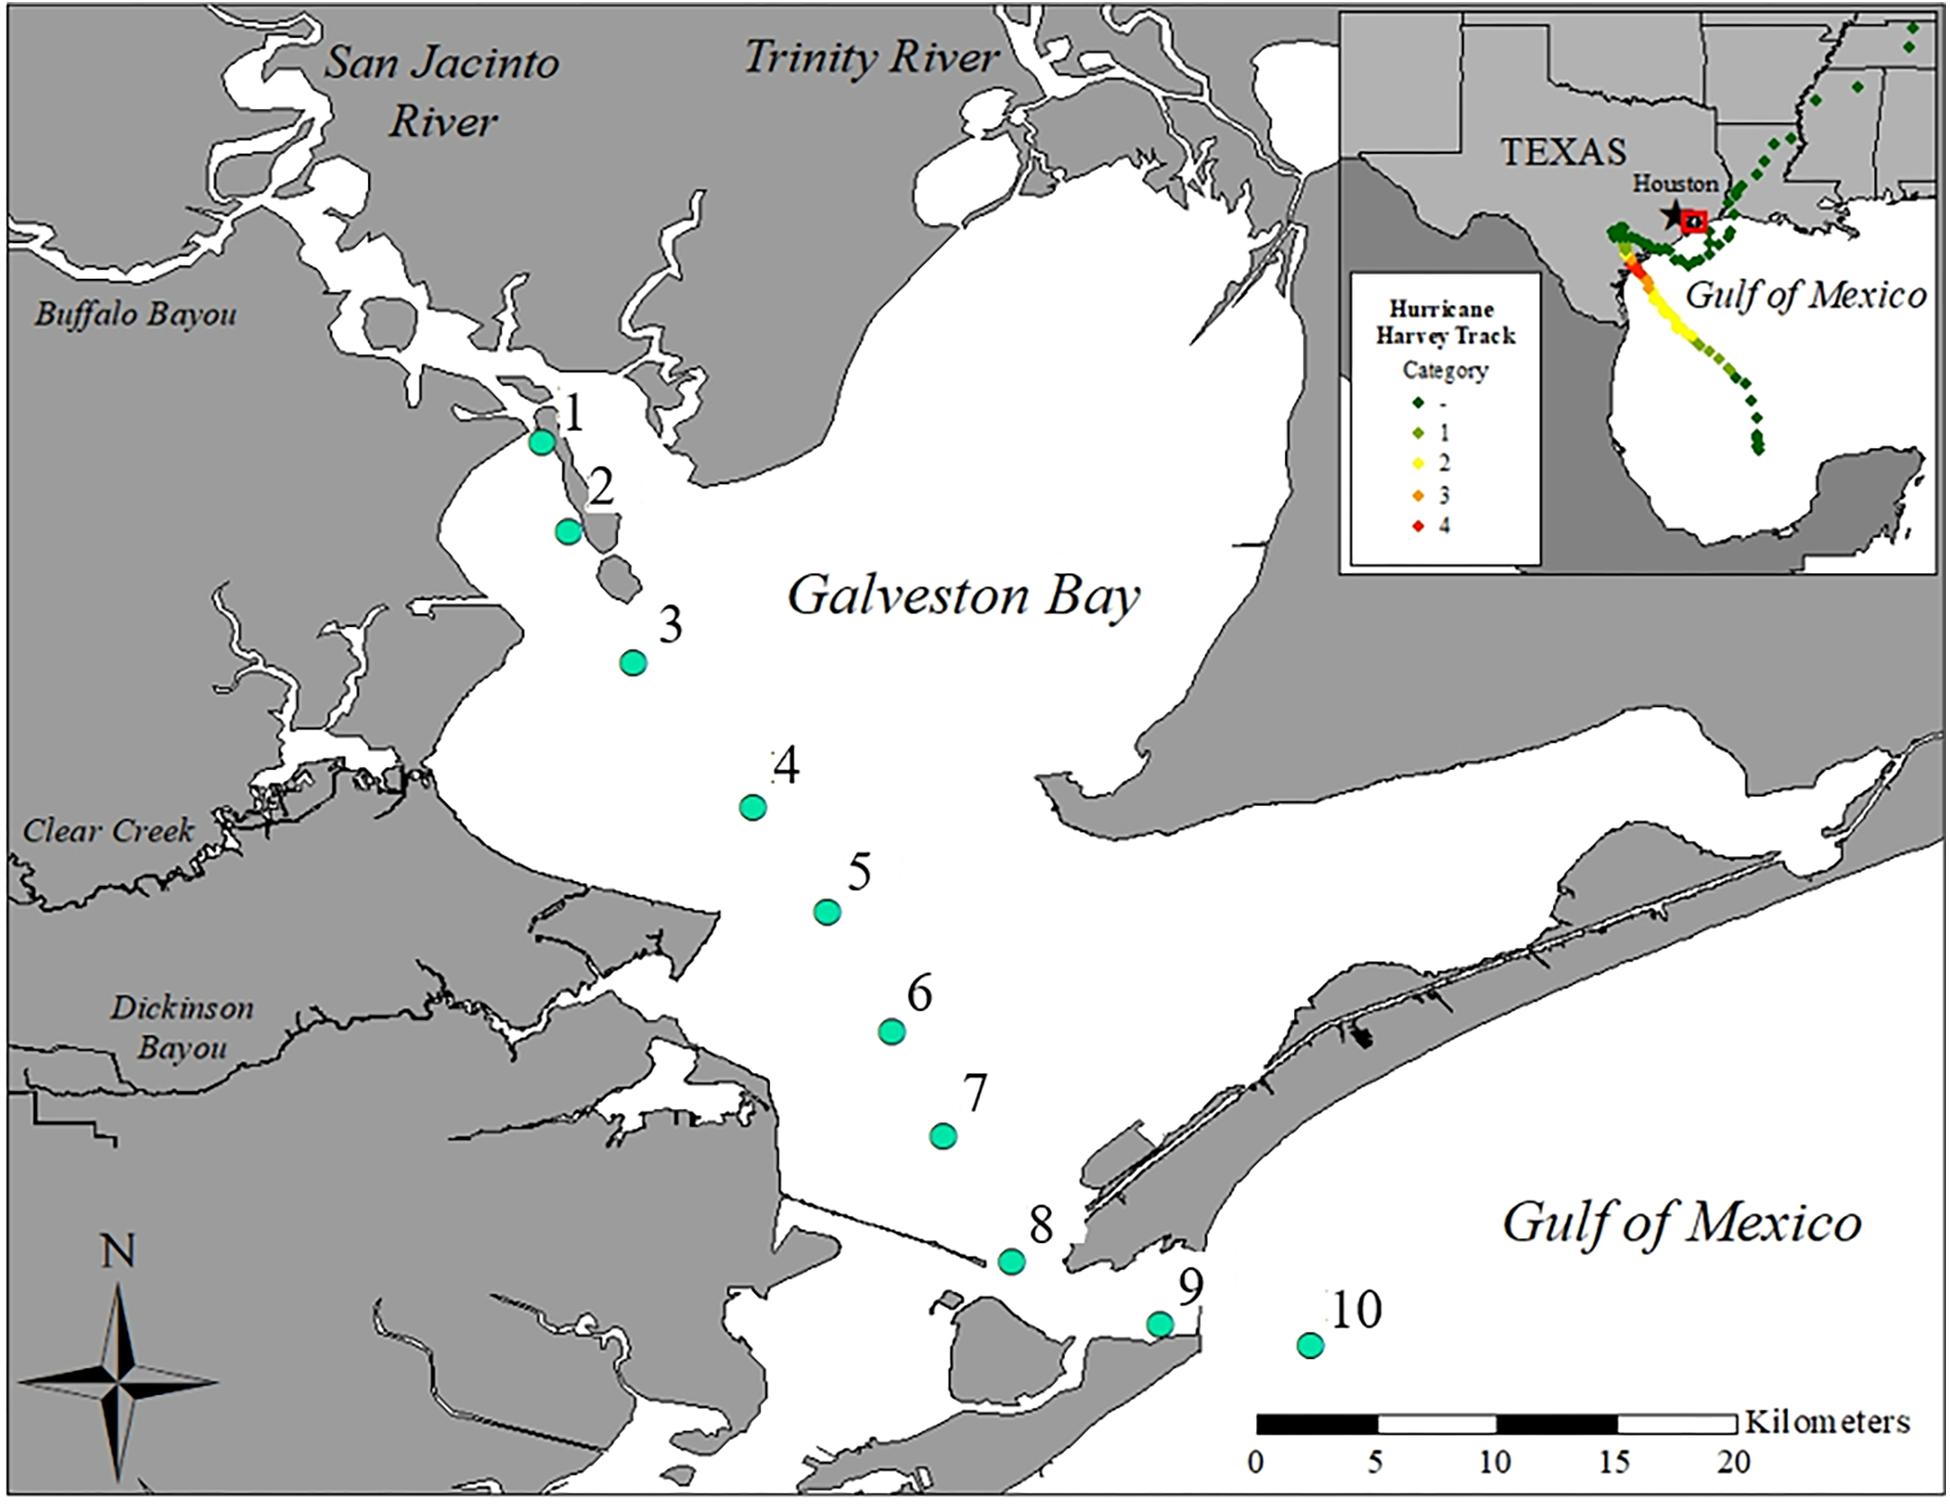
Figure 1. Map of Galveston Bay, TX (United States) showing the ten stations sampled during each cruise labeled as stations 1–10. Inset shows location of Galveston Bay along the upper Texas coastline of the Gulf of Mexico. The color dotted line displays the path and landfalls of Hurricane Harvey.
Water Quality Sampling
While the average water depth in the bay is ∼2.4 m, sampling close to the ship channel allowed us to evaluate a deeper profile. A calibrated Hydrolab MS5 datasonde was used to collect water quality parameters from surface down to 4 m at each station including temperature (°C), salinity, dissolved oxygen (mg L−1 and %), and pH. Secchi depth (m) was collected simultaneously. Unfiltered surface water samples (≥100 mL) were collected for total nitrogen (TN) and total phosphorus (TP). Surface water (≥100 mL) was also vacuum-filtered through a pre-rinsed, 47 mm glass fiber filter (GF/F), and the filtrate was used to measure the dissolved nutrients including: nitrate (NO3–), nitrite (NO2–), ammonium (NH4+), phosphate (Pi), and silicate (HSiO3–). Filtrate was placed in acid-washed (10% HCl) 250-mL polyethylene Nalgene bottles rinsed three times with filtrate from the sample and then frozen until analysis. All water samples collected for total and dissolved nutrient analysis were shipped to the Geochemical and Environmental Research Group at Texas A&M University for analysis on the Lachat QuikChem AE autoanalyzer (American Public Health Association [APHA], 1985). The sum of NO3–, NO2–, and NH4+ was used to calculate dissolved inorganic nitrogen (DIN). The resulting DIN value was then divided by Pi to calculate the ratio of inorganic nitrogen to phosphate (DIN:Pi). Samples for DOC were filtered through 0.2 μm Whatman-Nucleopore Q-TEC filters (Filtration Solutions) on board. Concentrations of DOC were determined using a high temperature-combustion method and a Shimadzu TOC-V analyzer (Benner and Strom, 1993). Total suspended sediments (TSS) were collected from the surface water samples during all time points at all stations; 150 mL of surface water was filtered through a pre-weighed and combusted 47 mm GF/F. After filtration the sample was placed in a drying oven at 103–105°C for at least 24 h and then weighed. The difference in weight was used to calculate the TSS (Method 2540 D of Standard Methods; American Public Health Association [APHA], 1998).
16S rRNA and 18S rRNA Gene Community Analyses
For the 16S and 18S ribosomal RNA (rRNA) gene analysis samples were collected at every station during each time point. The water samples were filtered on 0.2 μm polyethylsulfone (PES) membrane filters immediately after returning to shore. Two pre-Harvey samples (named pre-Harvey controls) were collected off the Texas A&M University at Galveston Boat Basin (coordinates) on 07/31/2017 and 08/22/2017. Each sample was filtered through a GF/F (with a 0.7 μm pore-size), followed by a 0.22 μm pore-size polyvinylidene fluoride (PVDF) filter. Filters were stored in –80°C freezer until total nucleic acid was extracted, using the MO Bio PowerSoil DNA Isolation Kit (cat. no. 128888-50). DNA could not be extracted from the pre-Harvey controls GF/F filters, therefore all further PCR amplifications were performed from the PVDF DNA extractions. PCR amplification using Promega GoTaq Flexi DNA Polymerase was performed following the 16S/18S rRNA gene Illumina amplicon protocol from the Earth Microbiome project.1 Each sample was amplified in triplicate 25 μL reactions with the following cycling parameters: 95°C for 3 min, 30 cycles of 95°C for 45 s, 50°C for 60 s, and 72°C for 90 s, and a final elongation step at 72°C for 10 min. For the prokaryotes, amplifications were performed using the 515F-806R primer pair (10 μM each) modified to include recently published revisions that reduce bias against the Crenarchaeota and Thaumarchaeota lineages as well as the SAR11 bacterial clade (Apprill et al., 2015; Parada et al., 2016). The primer pair was additionally modified to include Golay barcodes and adapters for Illumina MiSeq sequencing. Final primer sequences are detailed in Walters et al. (2016). The primer pair utilized for the Eukaryote analysis was V8f-1510r (Bradley et al., 2016). For eukaryotes the V8V9 hypervariable region on the 18S rRNA and for prokaryotes the V4 hypervariable region on the 16S rRNA were used for amplification (Caporaso et al., 2011; Bradley et al., 2016). Following amplification, the triplicate products were combined together and run on a 1.5% agarose gel to assess amplification success and relative band intensity. Amplicons were then quantified with the QuantiFluor dsDNA System (Promega), pooled at equimolar concentrations, and purified with an UltraClean PCR Clean-Up Kit (MoBio Laboratories; Carlsbad, CA, United States). The purified library, along with aliquots of the three sequencing primers, were sent to the Georgia Genomics Facility (Athens, GA, United States) for MiSeq sequencing (v2 chemistry, 2 × 250 bp). Sequence reads for both the 16S rRNA and 18S rRNA were processed separately using mothur v.1.39.5 following the MiSeq SOP https://www.mothur.org/wiki/MiSeq_SOP (Schloss et al., 2009; Kozich et al., 2013).
Organic Pollutants
Pharmaceuticals and Biocides
Twenty-eight pharmaceuticals and biocides (PBs) were monitored in water samples from Galveston Bay. These included: amphetamine, atenolol, carbamazepine, carbamazepine epoxide, chlorfenvinphos, cotinine, dexamethasone, diazepam, dichlofenthion, diclofenac, drospirenone, fluoxetine, gestodene, imazalil, imidacloprid, ketoprofen, levonorgestrel, melengestrol acetate, nicotine, norethindrone, prednisolone, prednisone, prochloraz, progesterone, propranolol, pyriproxyfen, sulfamethoxazole, and trimethoprim (along with representative internal standards). All analytes were assessed in unfiltered water samples from Galveston Bay. Of the 28 monitored compounds, only five analytes presented levels above limits of detection (set to the lowest respective standard yielding an accuracy of geq70% and precision leq 20%). The pharmaceuticals measured included cotinine (nicotine metabolite), carbamazepine (anti-epileptic and bi-polar disorder medication), carbamazepine-epoxide (carbamazepine metabolite), prednisone (anti-inflammatory synthetic corticoid), and the biocide, imidacloprid (insecticide). Samples (1 L) for PBs analysis were collected at each station during every time-point. Collectively, these can be used as proxies for human activities and in the case of this study, for excess flows, over flows, and other flood impacts on waste water treatment facilities that would release them into the environment. PBs were quantified using an Agilent 1260 UHPLC system with triple-quad 6420 mass detector using an Agilent jet-stream electrospray source. PBs from Galveston Bay water samples (500 mL) were spiked with an internal standard (deuterated carbamazepine or d10-carbamazepine) and extracted using Oasis HLB solid phase cartridges (500 mg, Waters Cat#186000115). The mass spectrometer settings included a capillary voltage of 3.5 kV and nebulizer gas temperature of 350°C and gas flow of 12 L/min. All PBs were quantified using multiple-reaction-monitoring (using previously optimized precursor > product ions) in positive electrospray ionization (ESI +) mode. These included: 177.1 > 80.2 (cotinine), 237.1 > 194 (carbamazepine), 253.1 > 180 (carbamazepine epoxide), 359.2 > 341.1 (prednisone), and 256.1 > 175 (imidacloprid). Deuterated carbamazepine (d10-carbamazepine, 247.2 > 204.1) was used as internal standard and all compounds were chromatographically separated on an Agilent poroshell EC-C18 column (3 × 50 mm, 2.7 μm). The mobile phase comprised of LC-MS grade Milli-Q water and methanol, with each containing 5 mM ammonium formate. The mobile phase gradient transitioned from 30%, increasing linearly to 70% in 3 min, and then to 95% over 6 min. The gradient was subsequently decreased from 95 to 70% over 3 min and from 70 to 30% (initial condition) in 3 min with a constant flow rate of 0.4 mL/min. The total chromatographic runtime was 25 min.
Polycyclic Aromatic Hydrocarbons (PAHs)
The 16 PAHs included in this study are naphthalene, acenaphthylene, acenaphthene, fluorene, phenanthrene, anthracene, fluoranthene, pyrene, benzo(a)anthracene, chrysene, benzo(b)fluoranthene, benzo(k)fluoranthene, benzo(a)pyrene, indeno(1,2,3-cd)pyrene, dibenzo(a,h)anthracene, and benzo(ghi)perylene. Water samples were collected at each station during each time point throughout the sample period. The PAHs from the water samples were extracted using liquid–liquid extraction based on Wade et al. (2011) with few modifications. Briefly, the water sample was placed in a 2-L separatory funnel, acidified by sulfuric acid, and extracted three times with 30 mL of dichloromethane. Prior to extraction, a mixture of deuterated standards containing naphthalene-d8, phenanthrene-d10, and perylene-d12 was added (Kamalanathan et al., 2019). The extract was filtered through a chromatography column containing anhydrous sodium sulfate and concentrated by rotary evaporator. The samples were then analyzed by gas chromatography (HP-6890 Series) interfaced with an Agilent 5973 inert mass selective detector (MSD), and operated in a selective ion-monitoring (SIM) mode (Bacosa et al., 2018). The PAHs were quantified using a calibration curve of PAHs standards. The final concentration was corrected based on the recovery of the standards.
Multivariate Statistical Analysis
Statistical analyses were conducted using PRIMER v6 + PERMANOVA add-on package software (Plymouth Routines in Multivariate Ecological Research; Clarke and Warwick, 1994). Environmental variables including water quality parameters, nutrients, DOC, PAHs, and PBs were square root transformed, normalized to place all parameters on the same unit less scale, and then used to build a similarity matrix based on the calculated Euclidean distances. The 16S rRNA gene and 18S rRNA gene community analyses were conducted on the operational taxonomic unit (OTU) abundance data which were square root transformed and then used to calculate a Bray–Curtis similarity index matrix. This index best represents the similarities (or dissimilarities) within the biotic community due to the fact these data are not normally distributed and have unequal variance distribution characteristics (Clarke and Gorley, 2006).
The relationship between the distributions of the biological and environmental variables was investigated using the distance-based linear model (DISTLM) in the PRIMER v6 software package (Clarke and Warwick, 2001). The DISTLM calculates the correlations between each of the environmental variables and the biological dataset. The DISTLM was run on the Bray–Curtis similarity matrix of the 16S rRNA and 18S rRNA OTU abundances. The DISTLM routine was carried out to provide a method of matching the microbial community from the 16S rRNA and 18S rRNA results with the environmental variables. A permutational analysis of variance (PERMANOVA) was run to determine significant differences between time points and stations for both the environmental and biological data. PERMANOVA was run on the Euclidean distance matrix of the transformed and normalized environmental data and the Bray–Curtis similarity matrix built from the square root transformed biological data. The biological data points were displayed in an nMDS to visualize the distribution of the biotic data in ordination space. The environmental vectors were overlain on the nMDS to show the Pearson correlations in relation to the biotic community changes temporally and spatially.
Results
Water Quality
The elevated precipitation and freshwater inflows entering the Bay from the San Jacinto and Trinity Rivers resulted in decreased salinity and increased sediment load (Figures 1, 2, Supplementary Figures S1, S2, and Table 1). During the T1 cruise (1 week after Hurricane Harvey passed over the Houston metro region) salinities across the Bay were low (0.02–6.57 at surface and 0.04–13.90 at 4 m depth). Near the mouth of the San Jacinto River (station 1) salinities were 0.02 at the surface and 0.36 at 4 m depth (Figure 2). Four weeks after hurricane passed the salinities began to increase ranging from 7.82 at the surface closest to the San Jacinto River up to 21.14 (4 m depth) at the Gulf of Mexico location (station 10) (Figure 2). Temperatures were lowest during the T2 sampling and then increased over time through T5 (Figure 3A and Table 1). The pH was lowest during the T1 sampling event and then increased during T2 and T3 and began to plateau during T4 and T5 (Figure 3B and Table 1).
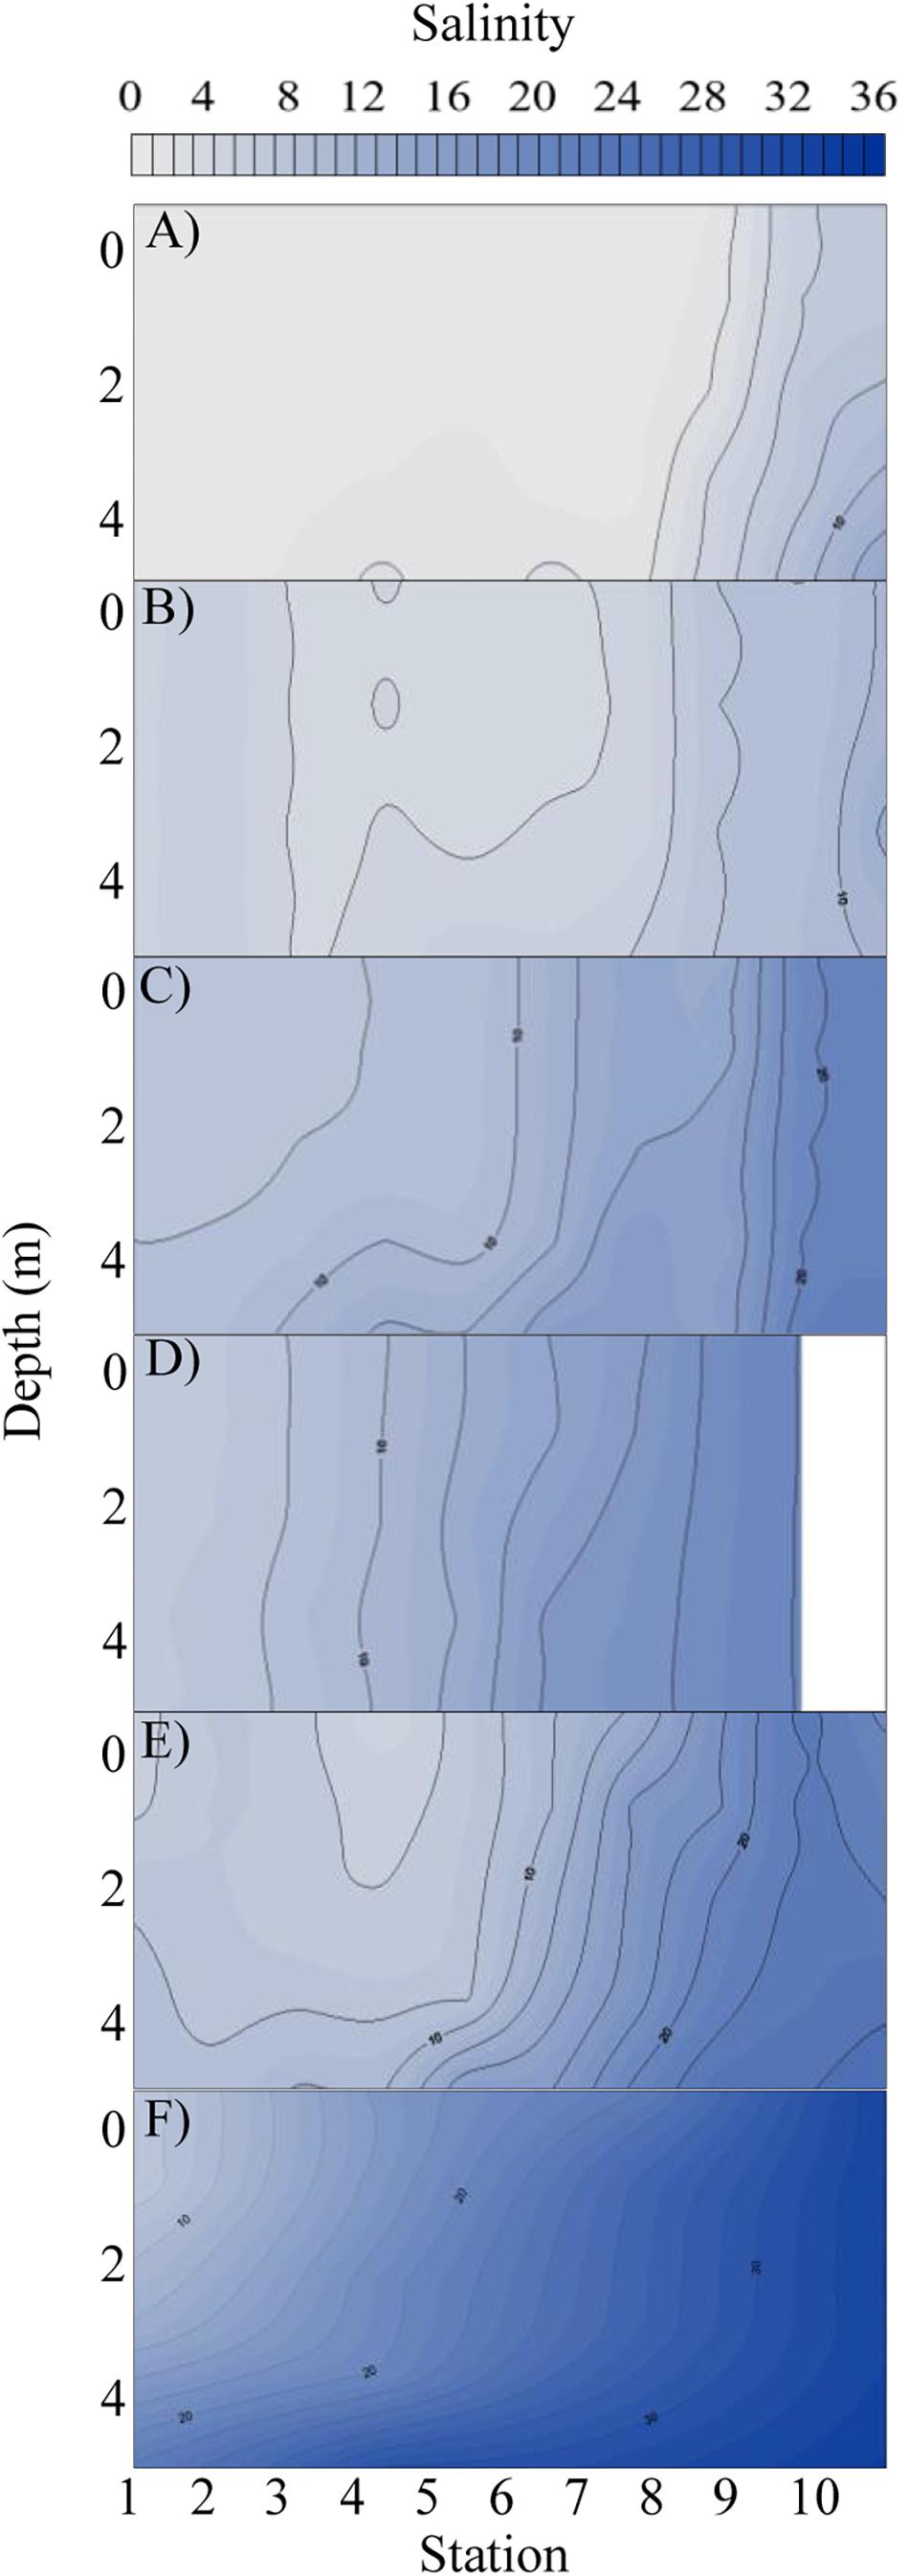
Figure 2. Salinity profile with depth (y-axis) at each station (x-axis) along the cruise transect for each time point: (A) T1, (B) T2, (C) T3, (D) T4, (E) T5, and (F) pre-Harvey. The pre-Harvey salinity was measured in the same month (August) during the previous year (2016) along the same sample transect used for this study. Salinities are shown from zero to thirty six along a color gradient from light gray to dark blue, respectively.
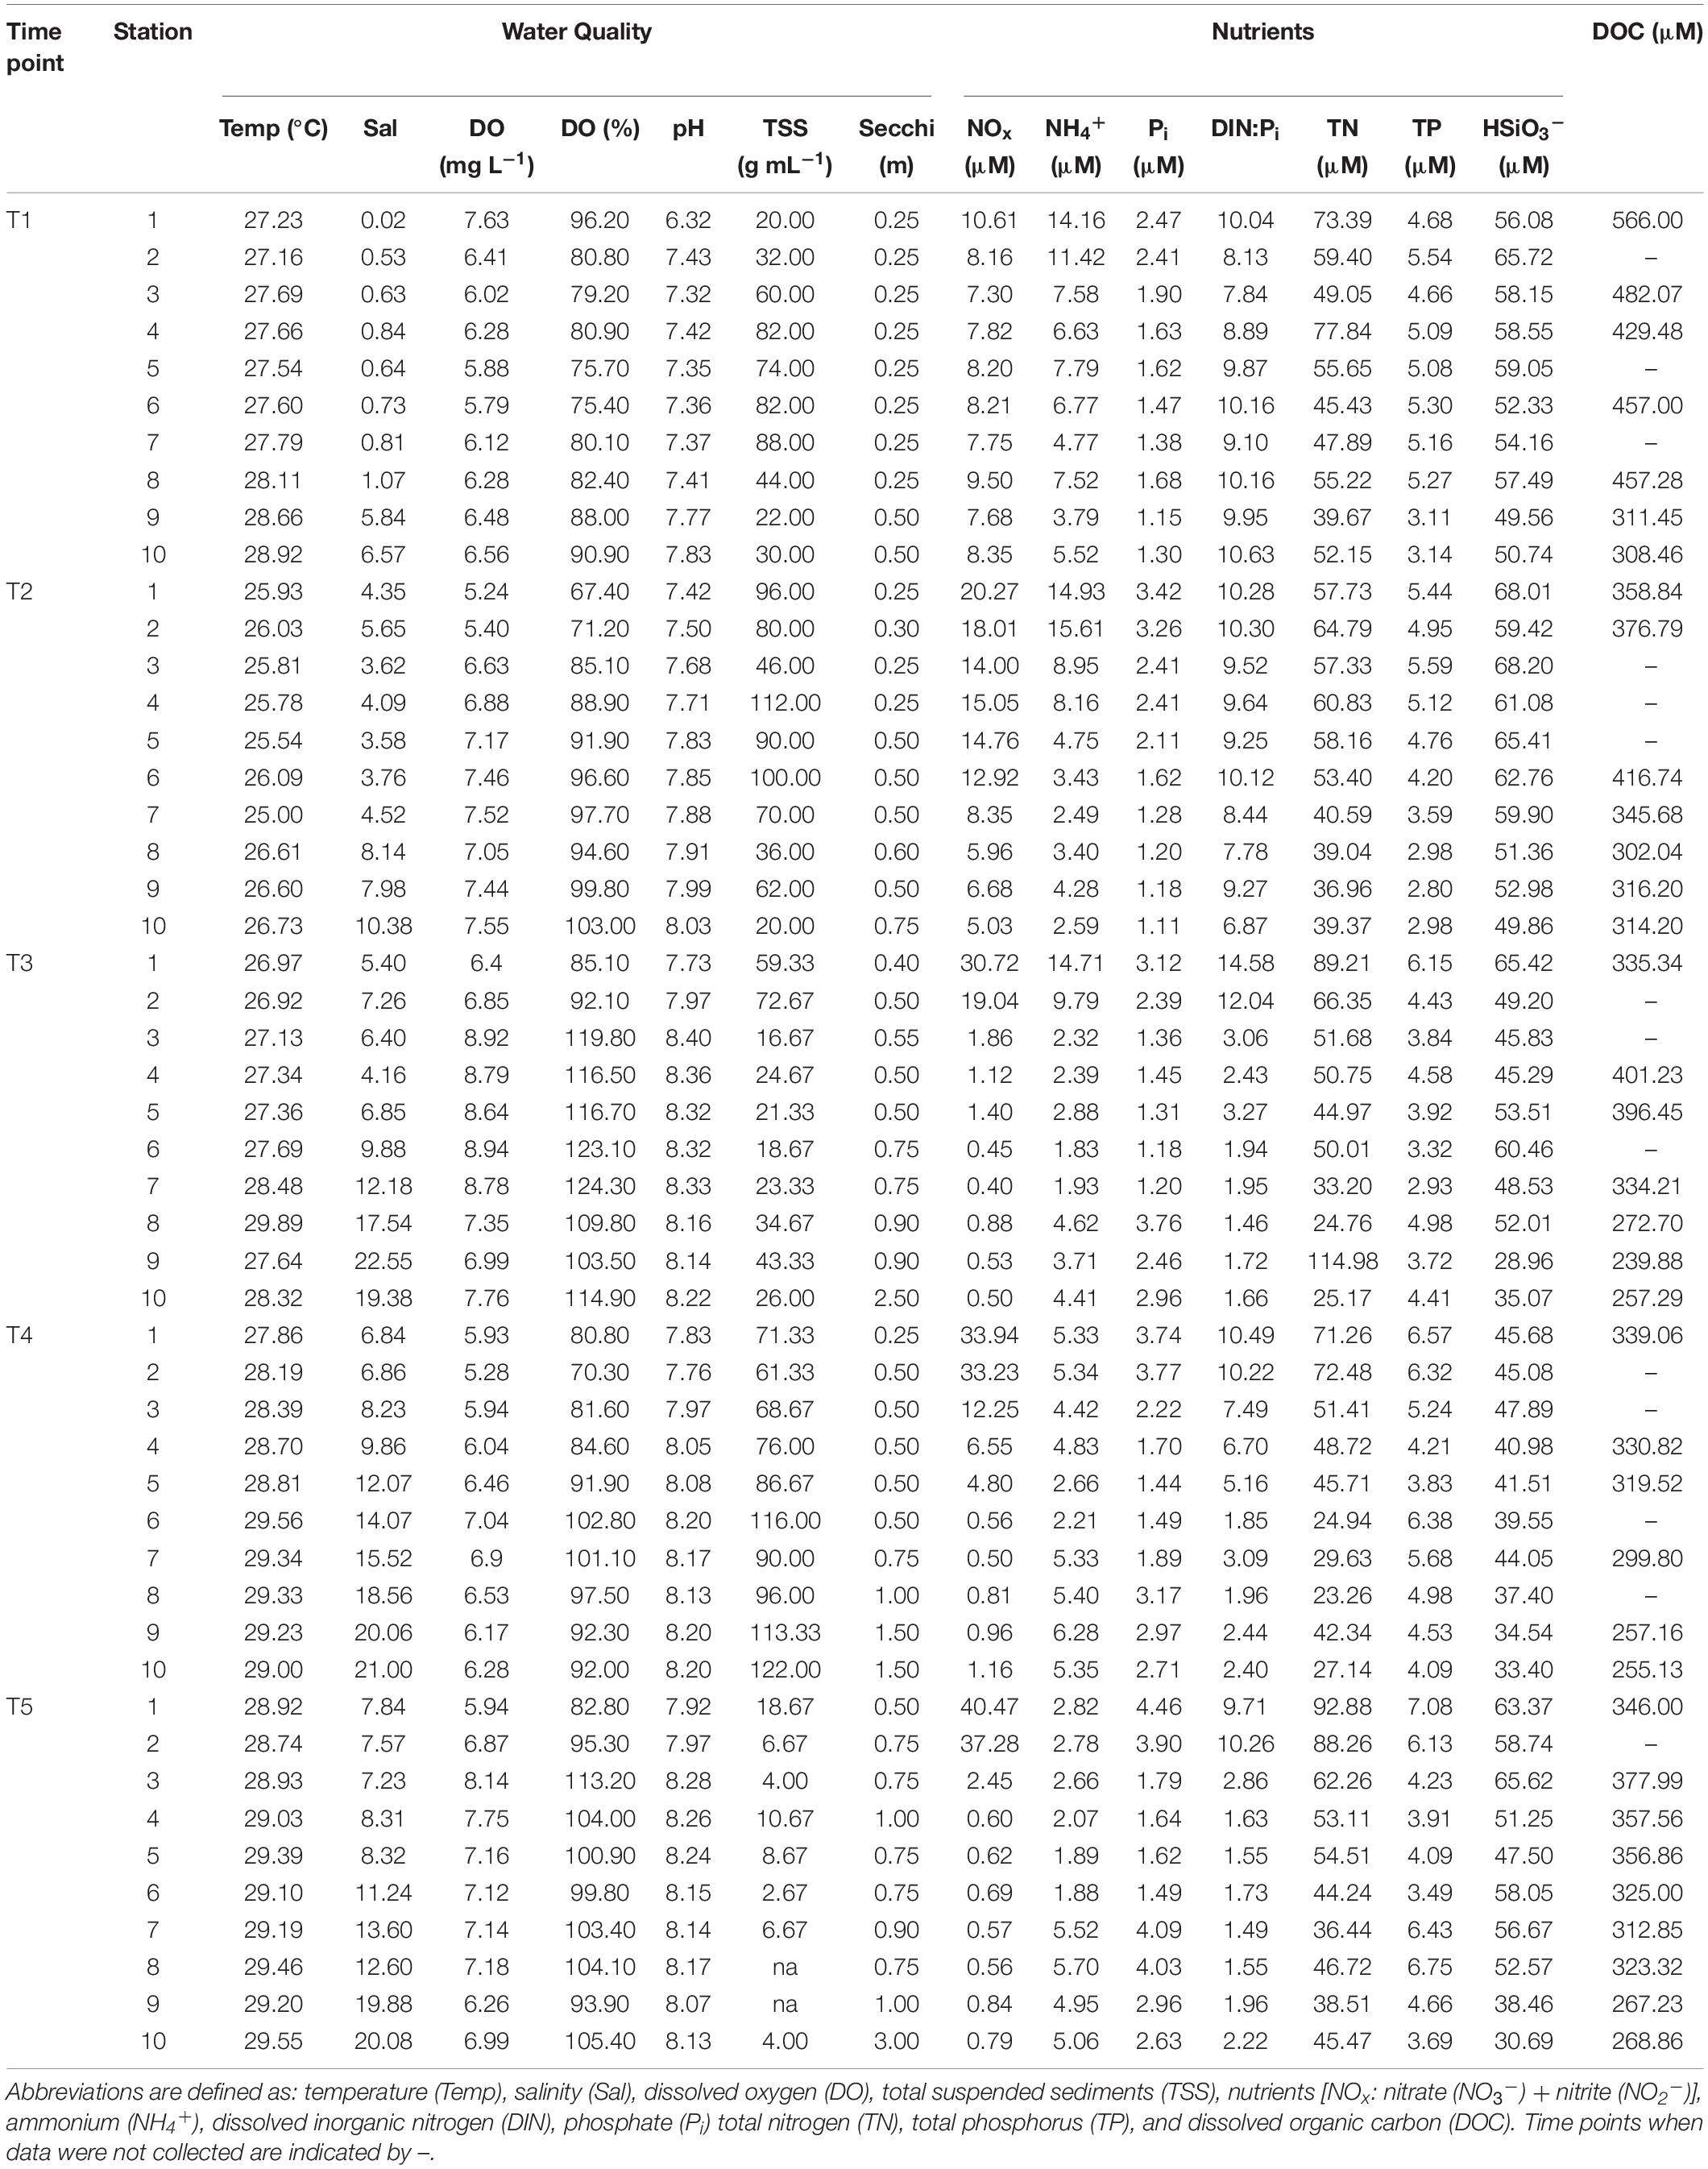
Table 1. Water quality parameters that were measured at each stations during each time point.
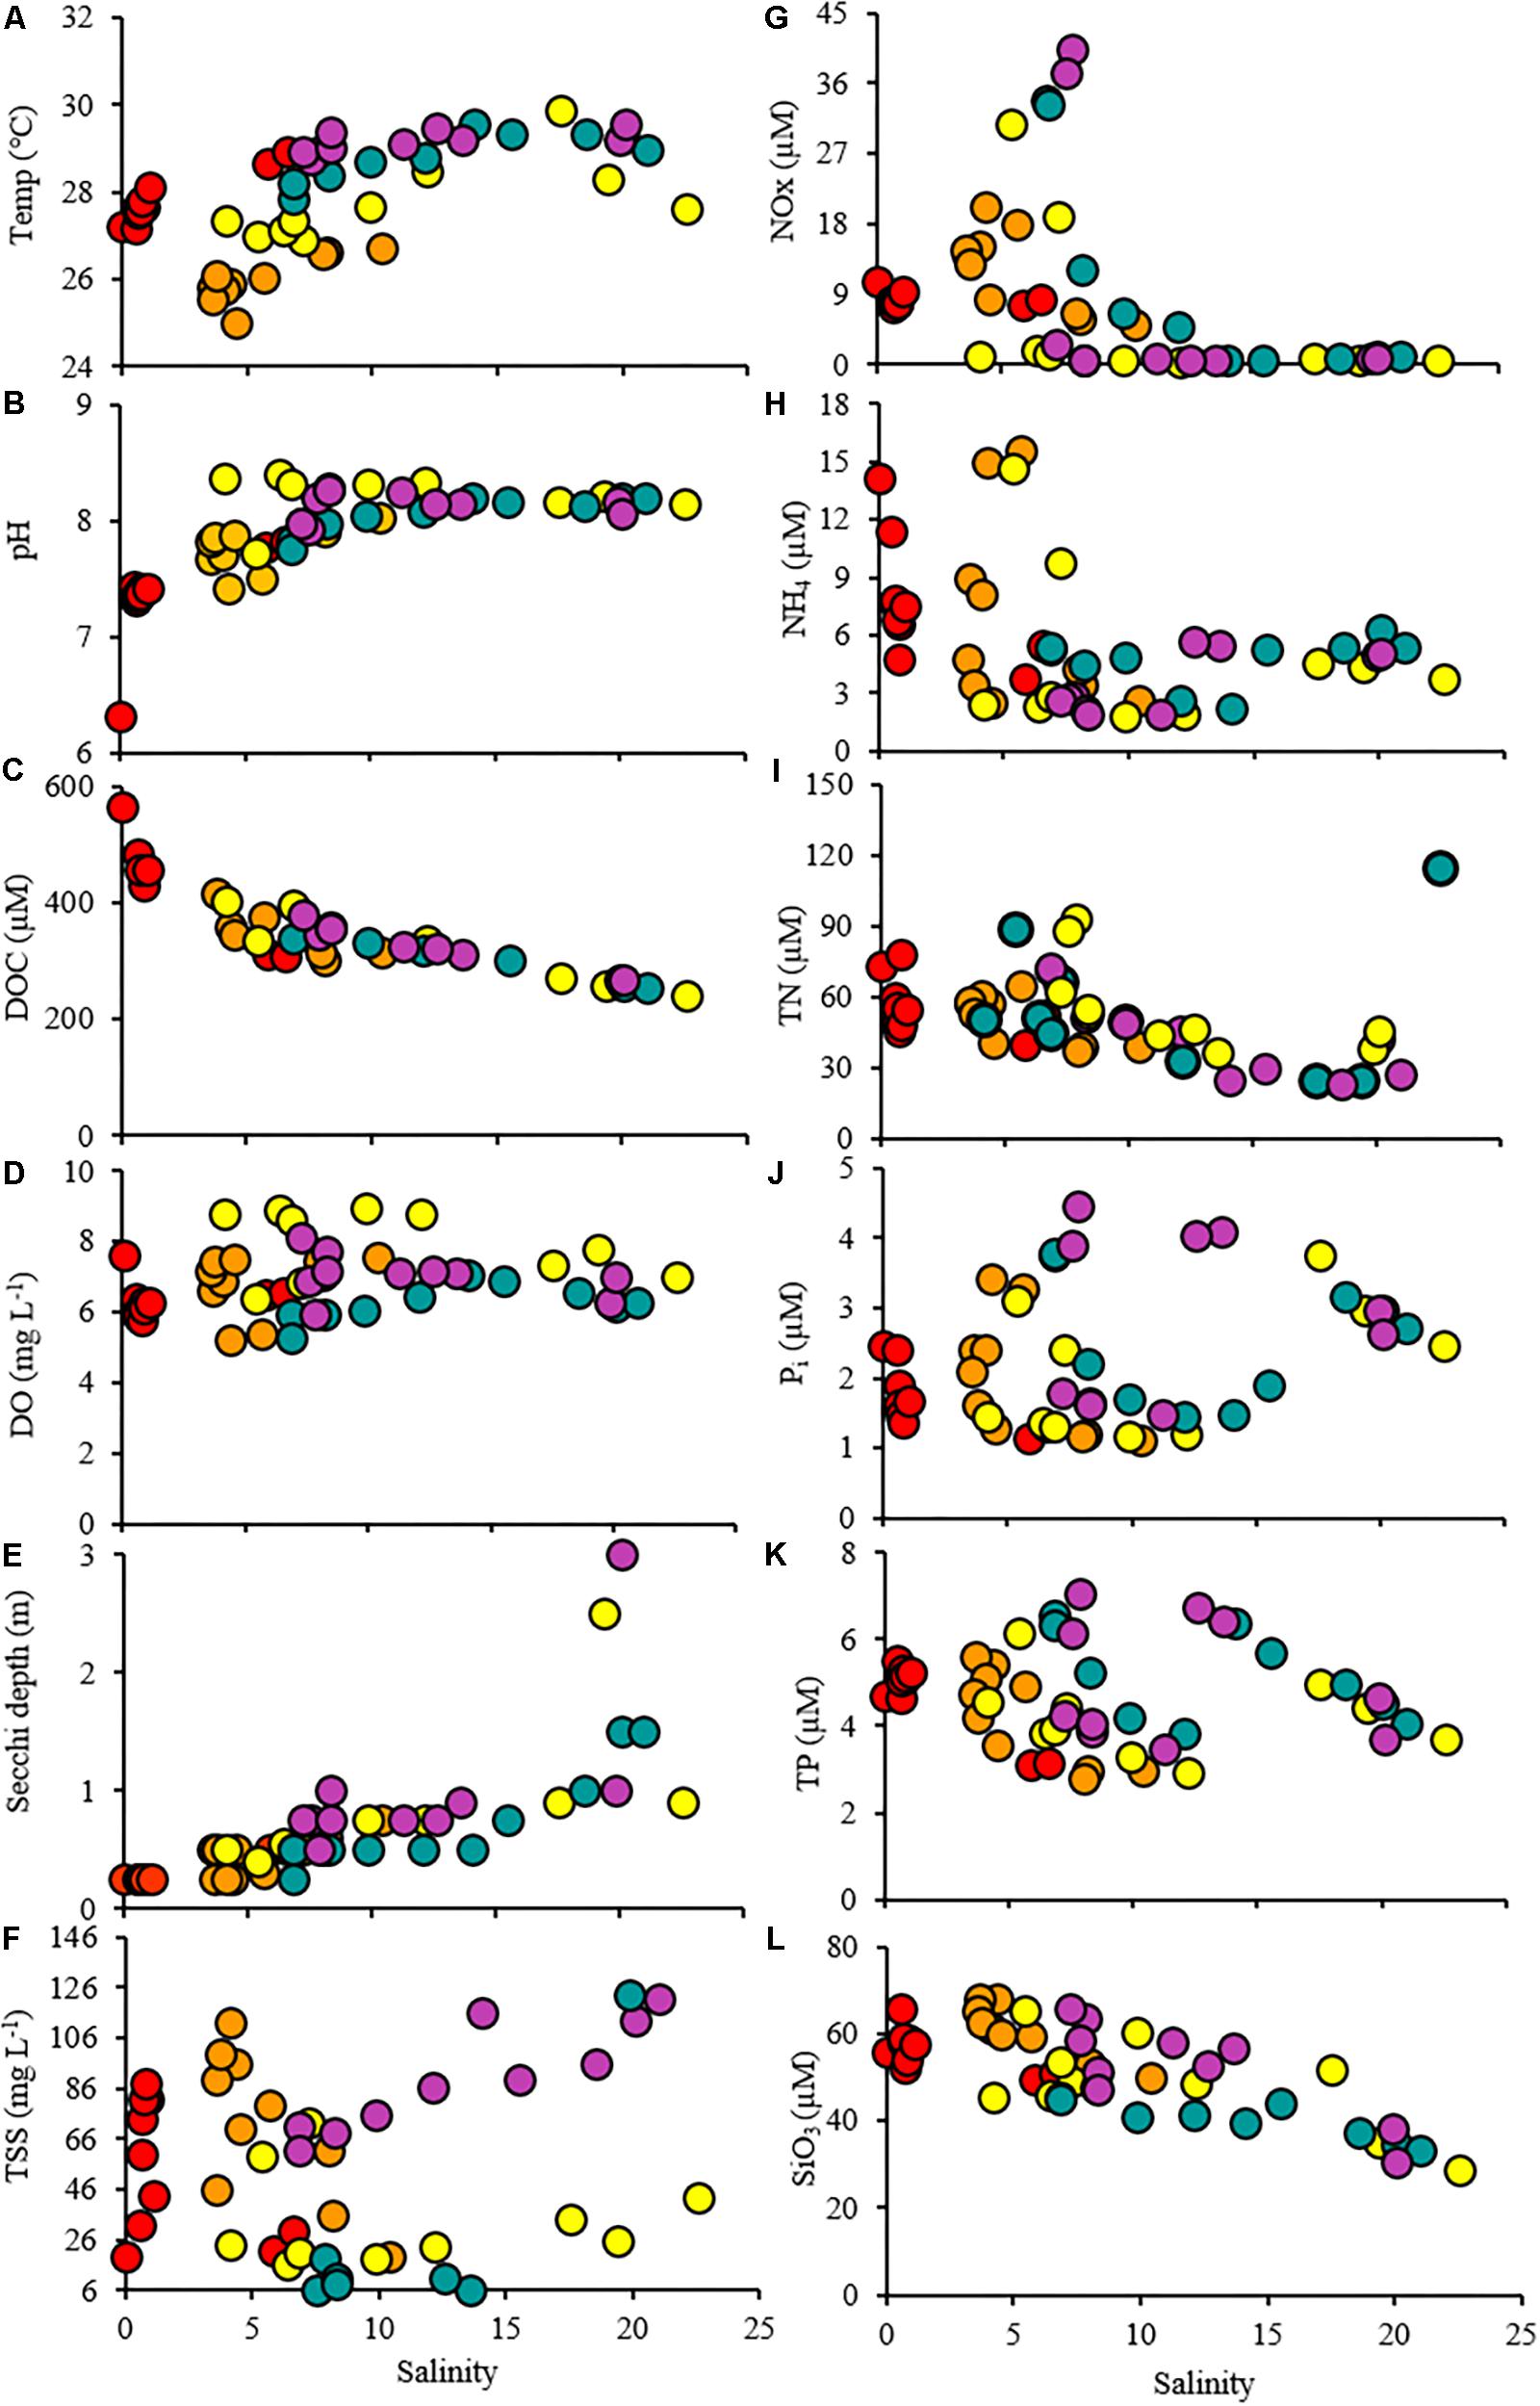
Figure 3. Scatterplots showing the relationship between the salinity and the water quality parameters throughout the study period. Time points are indicated by colors (T1: red, T2: orange, T3: yellow, T4: green, T5: purple).
Dissolved organic carbon concentrations were highest (308–566 μM) during the first cruise at stations 1–8 (Figures 3C, 4 and Table 1). As the salinity began to increase during the last three cruises, DOC concentrations declined and ranged from 267 to 401 μM across the bay (Figures 2, 4). The DOC displays an inverse relationship with Secchi depth with increasing time after the flooding event (Figures 3C,I and Table 1). Highest TSS concentrations were recorded during T1, T2, and T4 (Figure 3F and Table 1). The highest TSS concentration was observed during the T4 cruise at 122 mg L–1 at station 10 while the lowest value (20 mg L–1) was observed during the T1 cruise (Figure 3F and Table 1).
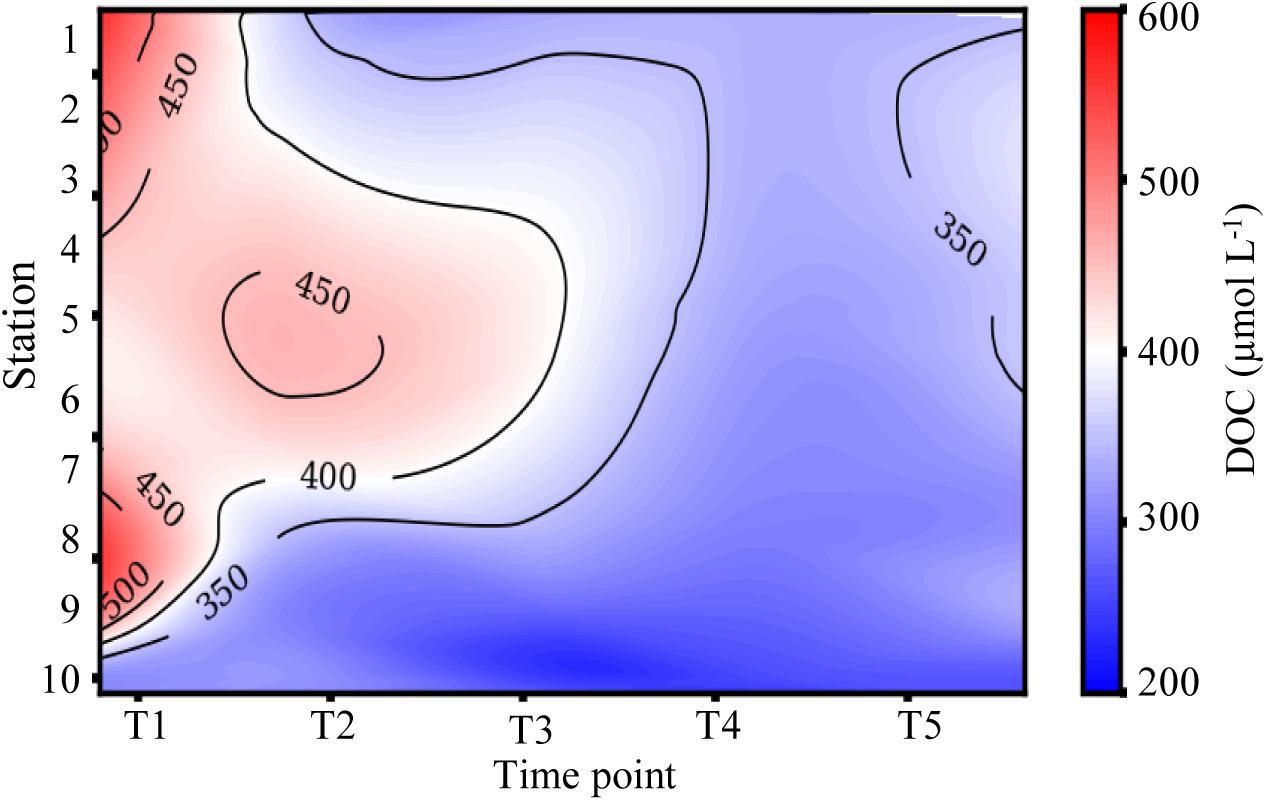
Figure 4. Time series of dissolved organic carbon (DOC) from the mouth of the San Jacinto River to the Gulf of Mexico. Stations are indicated along the y-axis and time points are represented along the x-axis.
NO3– + NO2– (NOx) concentrations increased with time at the stations nearest the river mouth with highest concentrations observed during the last time point (Figure 3G and Table 1). NH4+ was observed in the highest concentrations at stations 1–8 during the first cruise (T1) ranging from 4.77 to 14.16 μM (Figure 3H and Table 1). The concentrations of NH4+ remained elevated at the stations 1 and 2 nearest the San Jacinto River mouth during the first three cruises (T1–T3) ranging from 14.17 to 14.97 μM (Figure 3H and Table 1). Over time and with increasing distance from the mouth of the river, the NH4+ concentrations decreased to concentrations < 6 μM (Figure 3H and Table 1). The TN ranged from 23.26 to 114.98 μM with lowest concentrations occurring near the Gulf of Mexico and higher concentrations present near the river mouth during T3 and T4 (Figure 3I and Table 1). The orthophosphate (Pi) concentrations were lowest immediately following the flooding event at all stations ranging from 1.11 to 3.74 μM (Figure 3J and Table 1). The highest concentrations of Pi were observed at the northernmost stations during T2–T4 and also at mid bay stations during the latest time point (Figure 3J and Table 1). TP exhibited two peaks along the cruise transect at stations 1 and 2 and stations 8 and 9 during the latter time points (T3–T5; Figure 3K and Table 1). The DIN:Pi was below 16 during the entire cruise period indicative of nitrogen limitation across the bay system (Table 1). The highest concentrations of silicate were observed in the samples collected during T2 ranging from 68.01 μM at the northernmost site (station 1) to 49.86 μM at the furthest point from the river mouth (station 10; Table 1). At the last time point, the HSiO3– remained high at station 1 (63.37 μM) but decreased to 30.69 μM at station 10 nearest the Gulf of Mexico (Figure 3L and Table 1).
16S and 18S rRNA Gene Community Analysis
Prokaryotic community analysis (16S rRNA) revealed the generally dominant members of the marine bacteria coastal community pre-Harvey (07/31/2017 and 08/22/2017) including Acidimicrobiia, Cyanobacteria, Betaproteobacteria, SAR11, Gammaproteobacteria, and Oceanospirillales (Figures 5, 6). These estuarine/marine bacteria were replaced by microorganisms of terrestrial origin including bacteria within the phyla Actinobacteria and Verrucomicrobia (class Opitutae), sedimentary classes with the phylum Actinobacteria, and freshwater origin phyla Betaproteobacteria, Burkholderiales, and Sphingobacteria (associated with treated wastewater) following Harvey (Figures 5, 6 and Supplementary Figure S4). Spartobacteria began to increase in relative abundance during time points T3 and T5 (Figure 5). Marine Cyanobacteria, dominated by Synechococcus sp., normally represent ∼20–30% of the total abundance of all OTUs on average in Galveston Bay. After Hurricane Harvey, <5% of all OTUs were Cyanobacteria and then increased back to normal levels within 6 weeks following Harvey. Betaproteobacteria followed an opposite trend and decreased in abundance from early to late time-points over time (Figures 5, 6 and Supplementary Figure S4). Although the relative abundance of the phyla Proteobacteria did not change greatly over the sample period, the classes within this group of bacteria did fluctuate with the variability in salinity and other environmental parameters (Figure 6). The Alphaproteobacteria, Deltaproteobacteria, and Gammaproteobaceteria increased in OTU relative abundance with increasing salinities post-Harvey (Figure 6). The Betaproteobacteria groups made up a majority of the relative abundance immediately following the flooding event and then decreased with time as the salinities increased across the Bay (Figure 6).
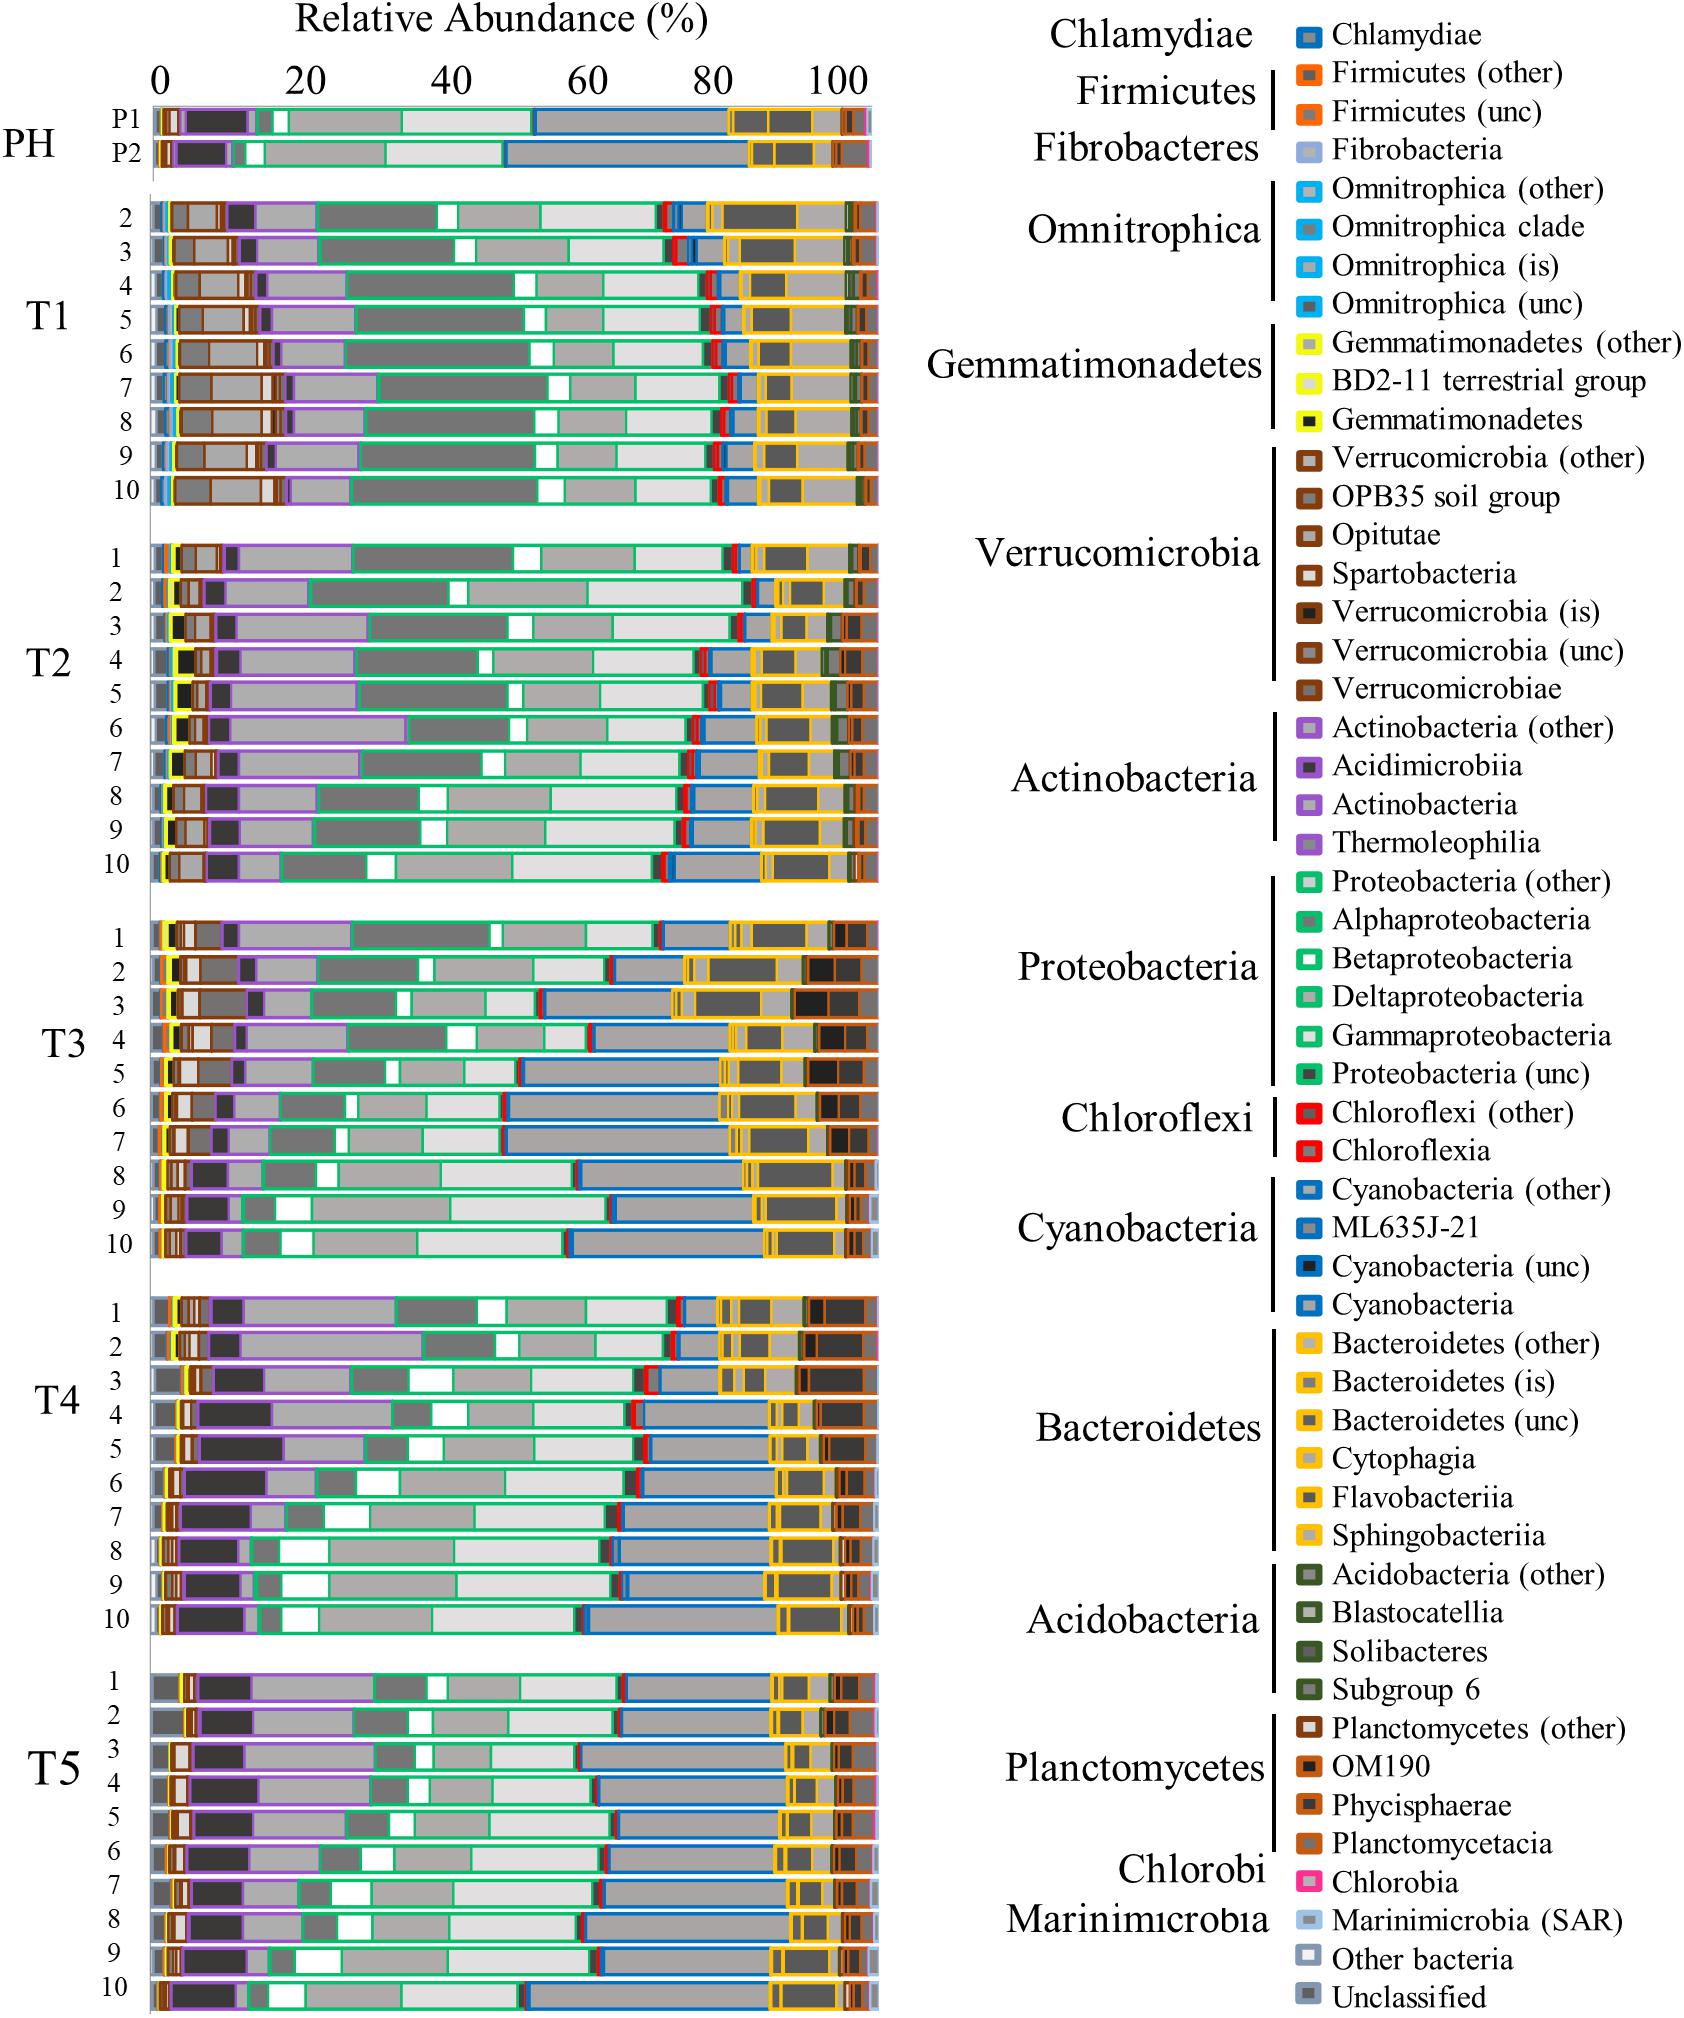
Figure 5. Bar graph showing the relative abundance of OTUs for the Bacteria community identified by 16s rRNA analysis. Time points are separated into blocks (T1–T5). Within each time point block, each bar represents the relative abundance for the members of the Bacteria community at each station (1–10). The phyla are indicated by differing border color on the bar graphs [incertae sedis (is) and unclassified (unc)]. P1 and P2 are pre-Harvey (PH) samples from 07/31/17 and 08/22/17, respectively.
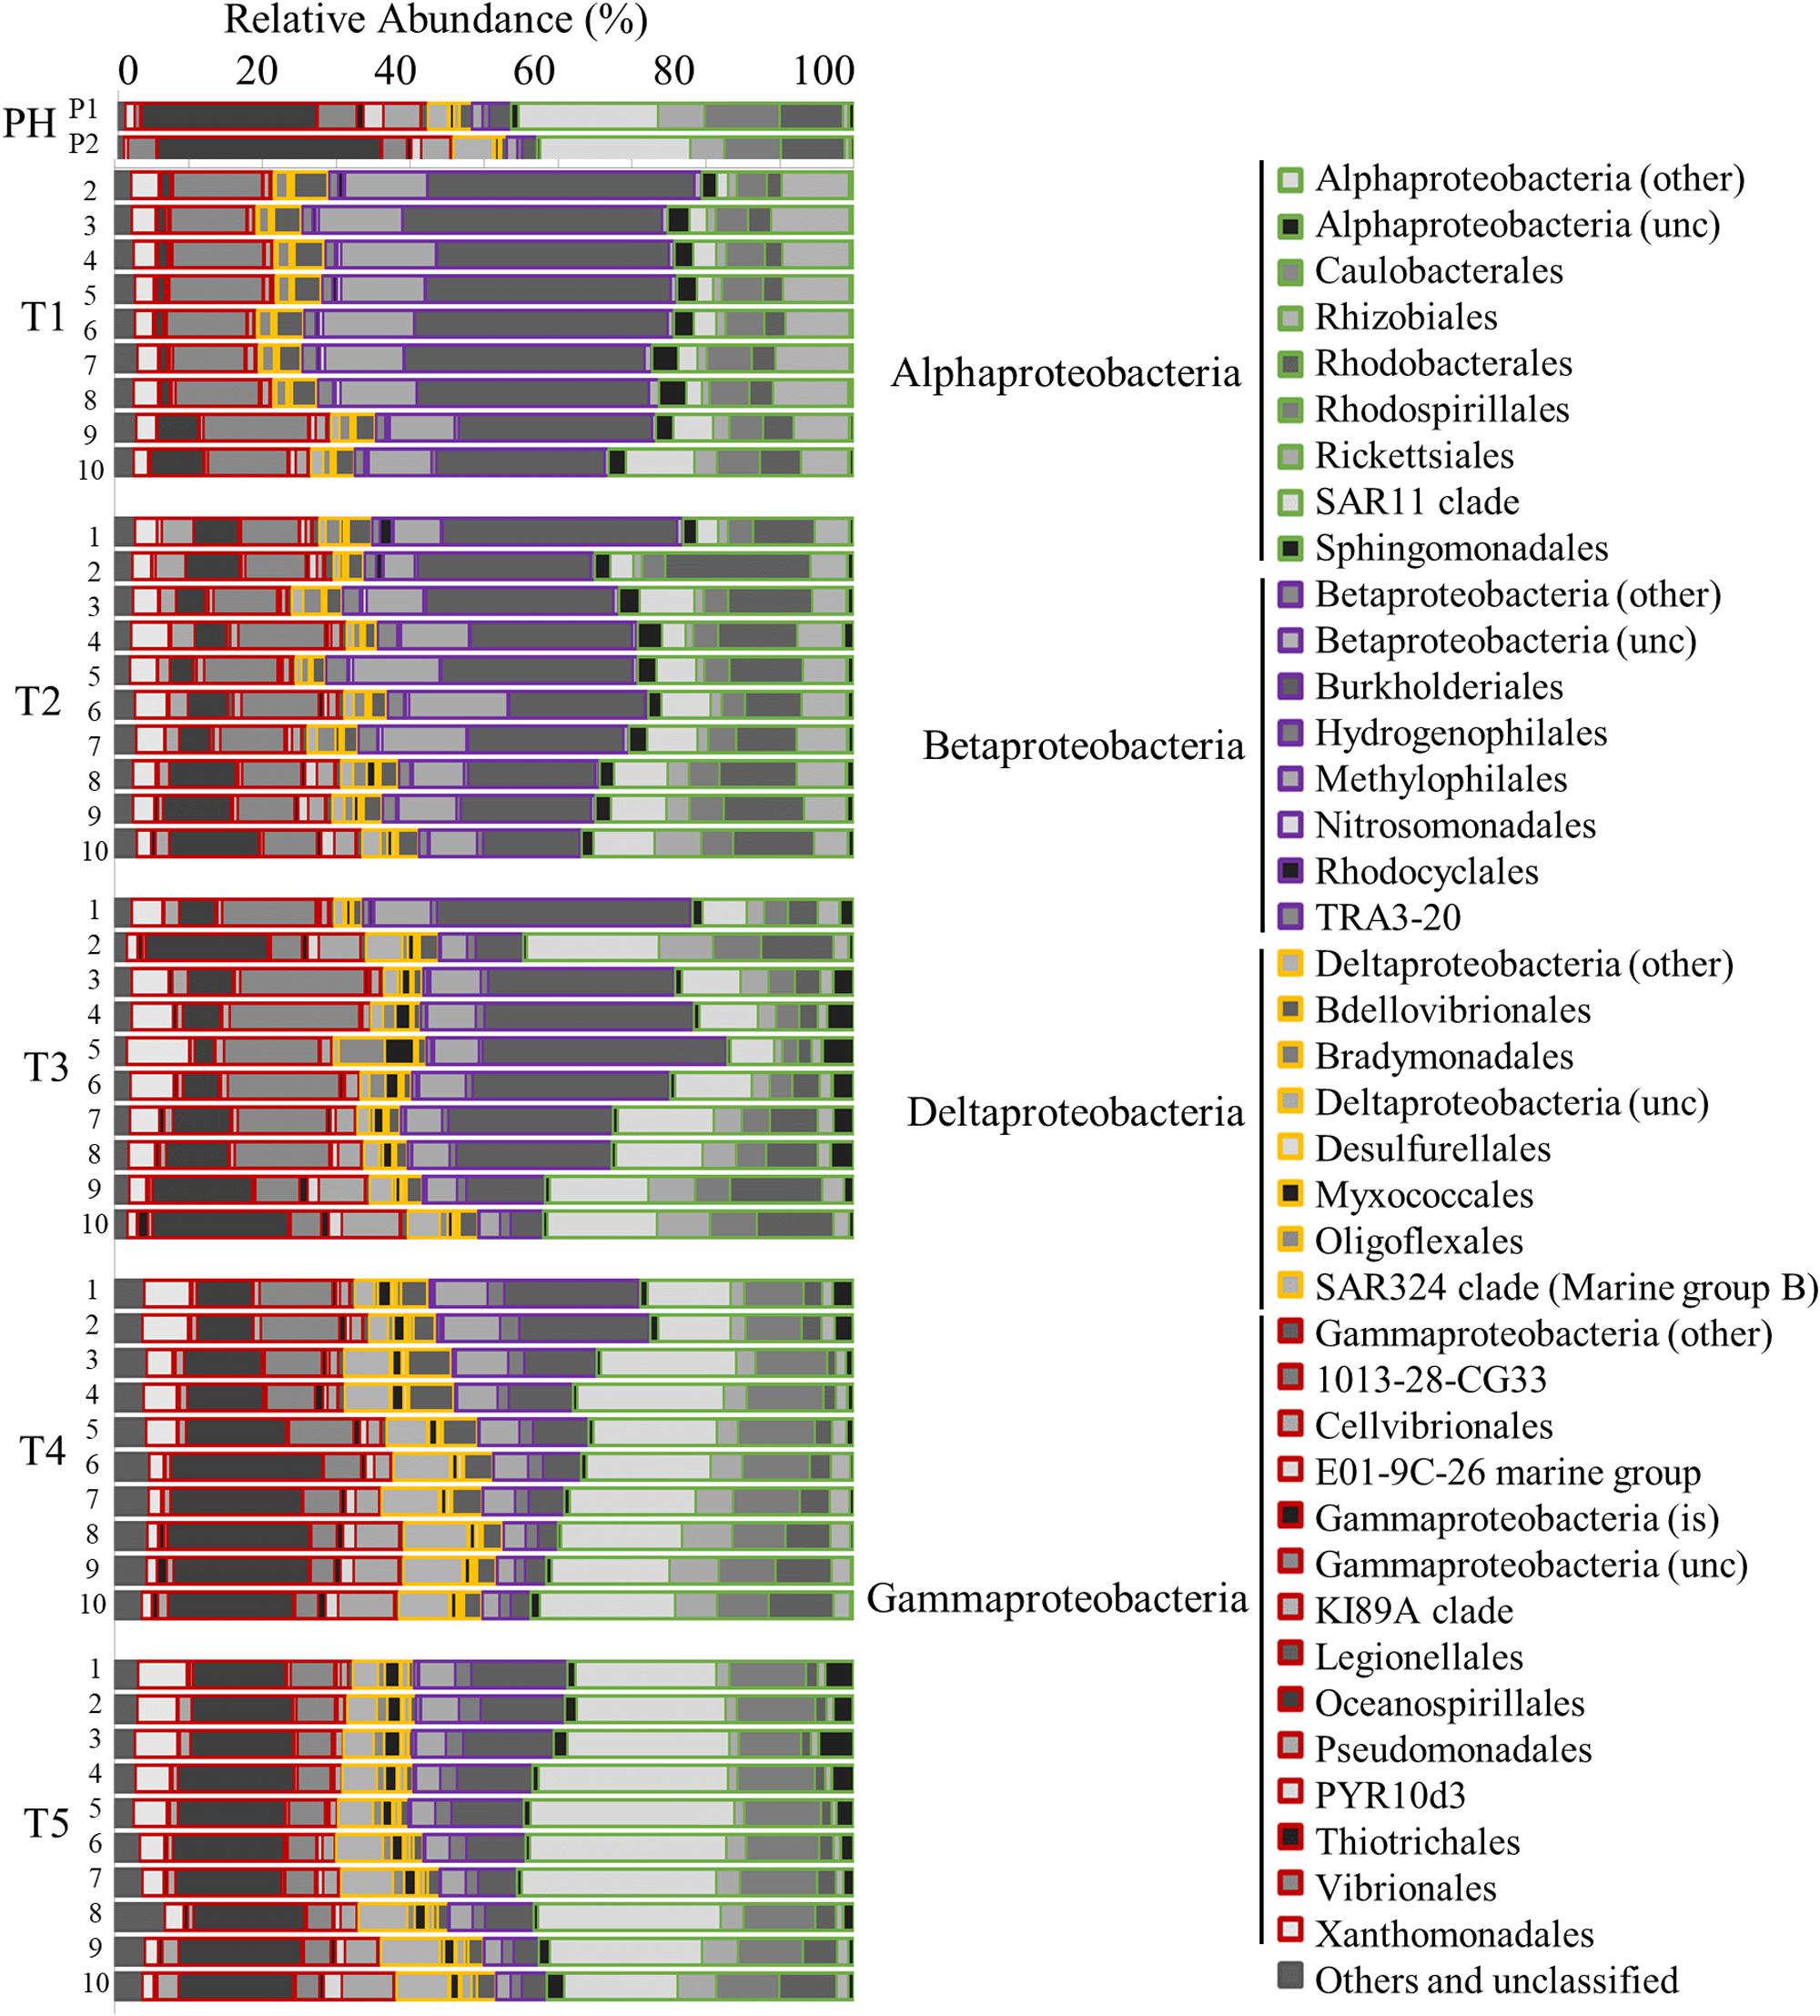
Figure 6. Bar graph showing the relative abundance of OTUs for the Proteobacteria community identified by 16s rRNA analysis. Time points are separated into blocks (T1–T5). Within each time point block, each bar represents the relative abundance for the members of the bacteria community at each station (1–10). The phyla are indicated by differing border color on the bar graphs [incertae sedis (is) and unclassified (unc)]. P1 and P2 are pre-Harvey samples from 07/31/17 and 08/22/17, respectively.
The eukaryotic community (18S rRNA gene) analysis shows that the dominant members of the community were Cryptophyta, Oligotrichea (ciliates), and Ochrophyta (mostly comprised of species within Bacillariophyta hereafter referred to as diatoms). Immediately following Hurricane Harvey (T1), the relative abundance of both Cryptophyta, Oligotrichea, and diatoms reflected that of Pre-Harvey conditions (Figure 7). At the next time point (T2), the highest relative abundance of freshwater chlorophytes were observed at transect stations closer to the San Jacinto River mouth (Figure 7). The relative abundance of diatoms dominated the community at all stations during T2 and even more so during T3 cruise (Figure 7). During the T3 cruise, the chlorophytes were replaced by Ochrophyta (predominantly diatoms) and Myzozoa (mostly Dinophyceae). In contrast, the relative abundance of Dinophyceae (dinoflagellates) was lower during these two cruises in and was highest at stations closest to the Gulf of Mexico during T4 and T5 cruises (Figure 7).
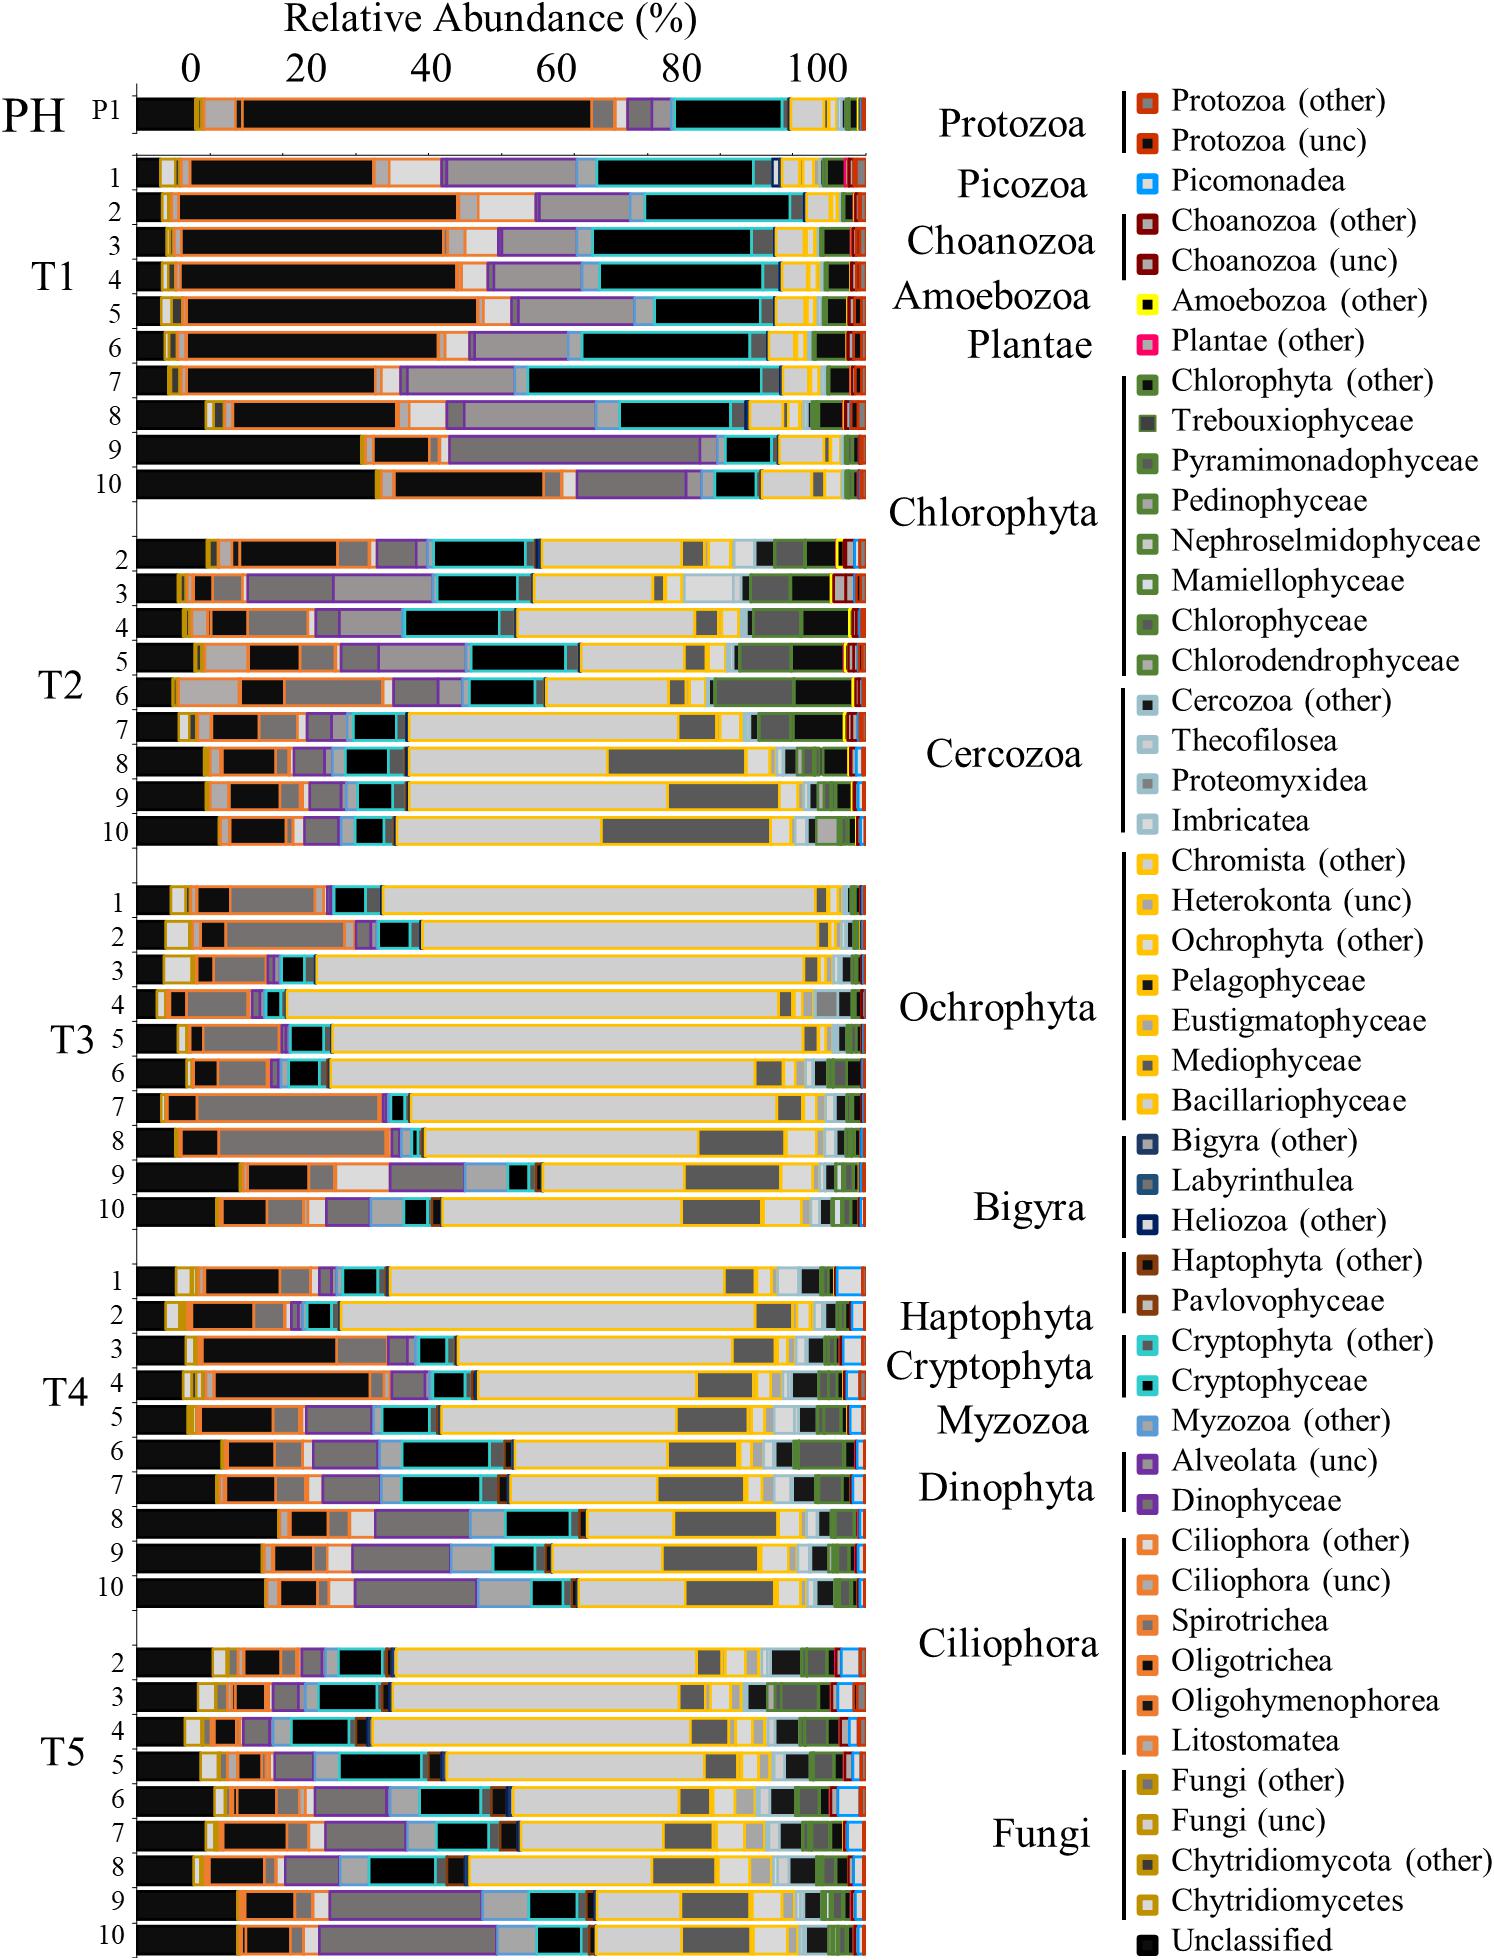
Figure 7. Bar graph showing the relative abundance of OTUs for the eukaryotic community identified by 18s rRNA analysis. Time points are separated into blocks (T1–T5). Within each time point block, each bar represents the relative abundance for the members of the bacteria community at each station (1–10). The phyla are indicated by differing border color on the bar graphs [unclassified (unc)]. P1 is a pre-Harvey sample from 07/31/17.
Water sampling in Galveston Bay during all cruises (T1–T5) showed the presence of PBs in the weeks following Hurricane Harvey varying on both temporal and spatial scales (Figure 8A, Table 2, and Supplementary Figure S5). Temporally the concentrations of cotinine, carbamazepine, carbamazepine-epoxide, and imidacloprid, behaved similarly to each other, while prednisone did not (Figure 8A and Table 2). Levels for cotinine (0.005–0.013 ng L–1), imidacloprid (0.026–0.074 ng L–1), carbamazepine (0.017–0.036 ng L–1), and carbamazepine-epoxide (0.004–0.011 ng L–1) were all lower immediately following Hurricane Harvey during T1, and then steadily increased over successive weeks (Figure 8A and Table 2). However, prednisone levels were highest immediately following the storm (21.07 ng L–1) at station 1 and then decreased with increasing distance from the mouth of the San Jacinto River to station 10 (7.29 ng L–1). After T1, prednisone was only detected at station 4 during T2 (0.154 ng L–1) and then during T3 at stations 1, 2, 4, and 6 in low concentrations (0.291–1.23 ng L–1; Figure 8A and Table 2). PAHs in the water column were relatively higher during T1 at stations 1, 2, and 6 and then declined with increasing distance from the mouth of the San Jacinto River (Figure 8B). At stations 1, 2, and 6, the concentration of PAHs was 102, 167, and 103 ng L–1, respectively. The concentrations of PAHs decreased to 24 ng L–1 at station 10 closest to the Gulf of Mexico. For the time points T2–T5, the concentrations of PAHs ranged from a minimum of 19 ng L–1 at station 7 during the T4 cruise to a maximum of 69 ng L–1 at station 2 during the T2 cruise. Overall, PAHs levels declined with increasing time after the hurricane passed.
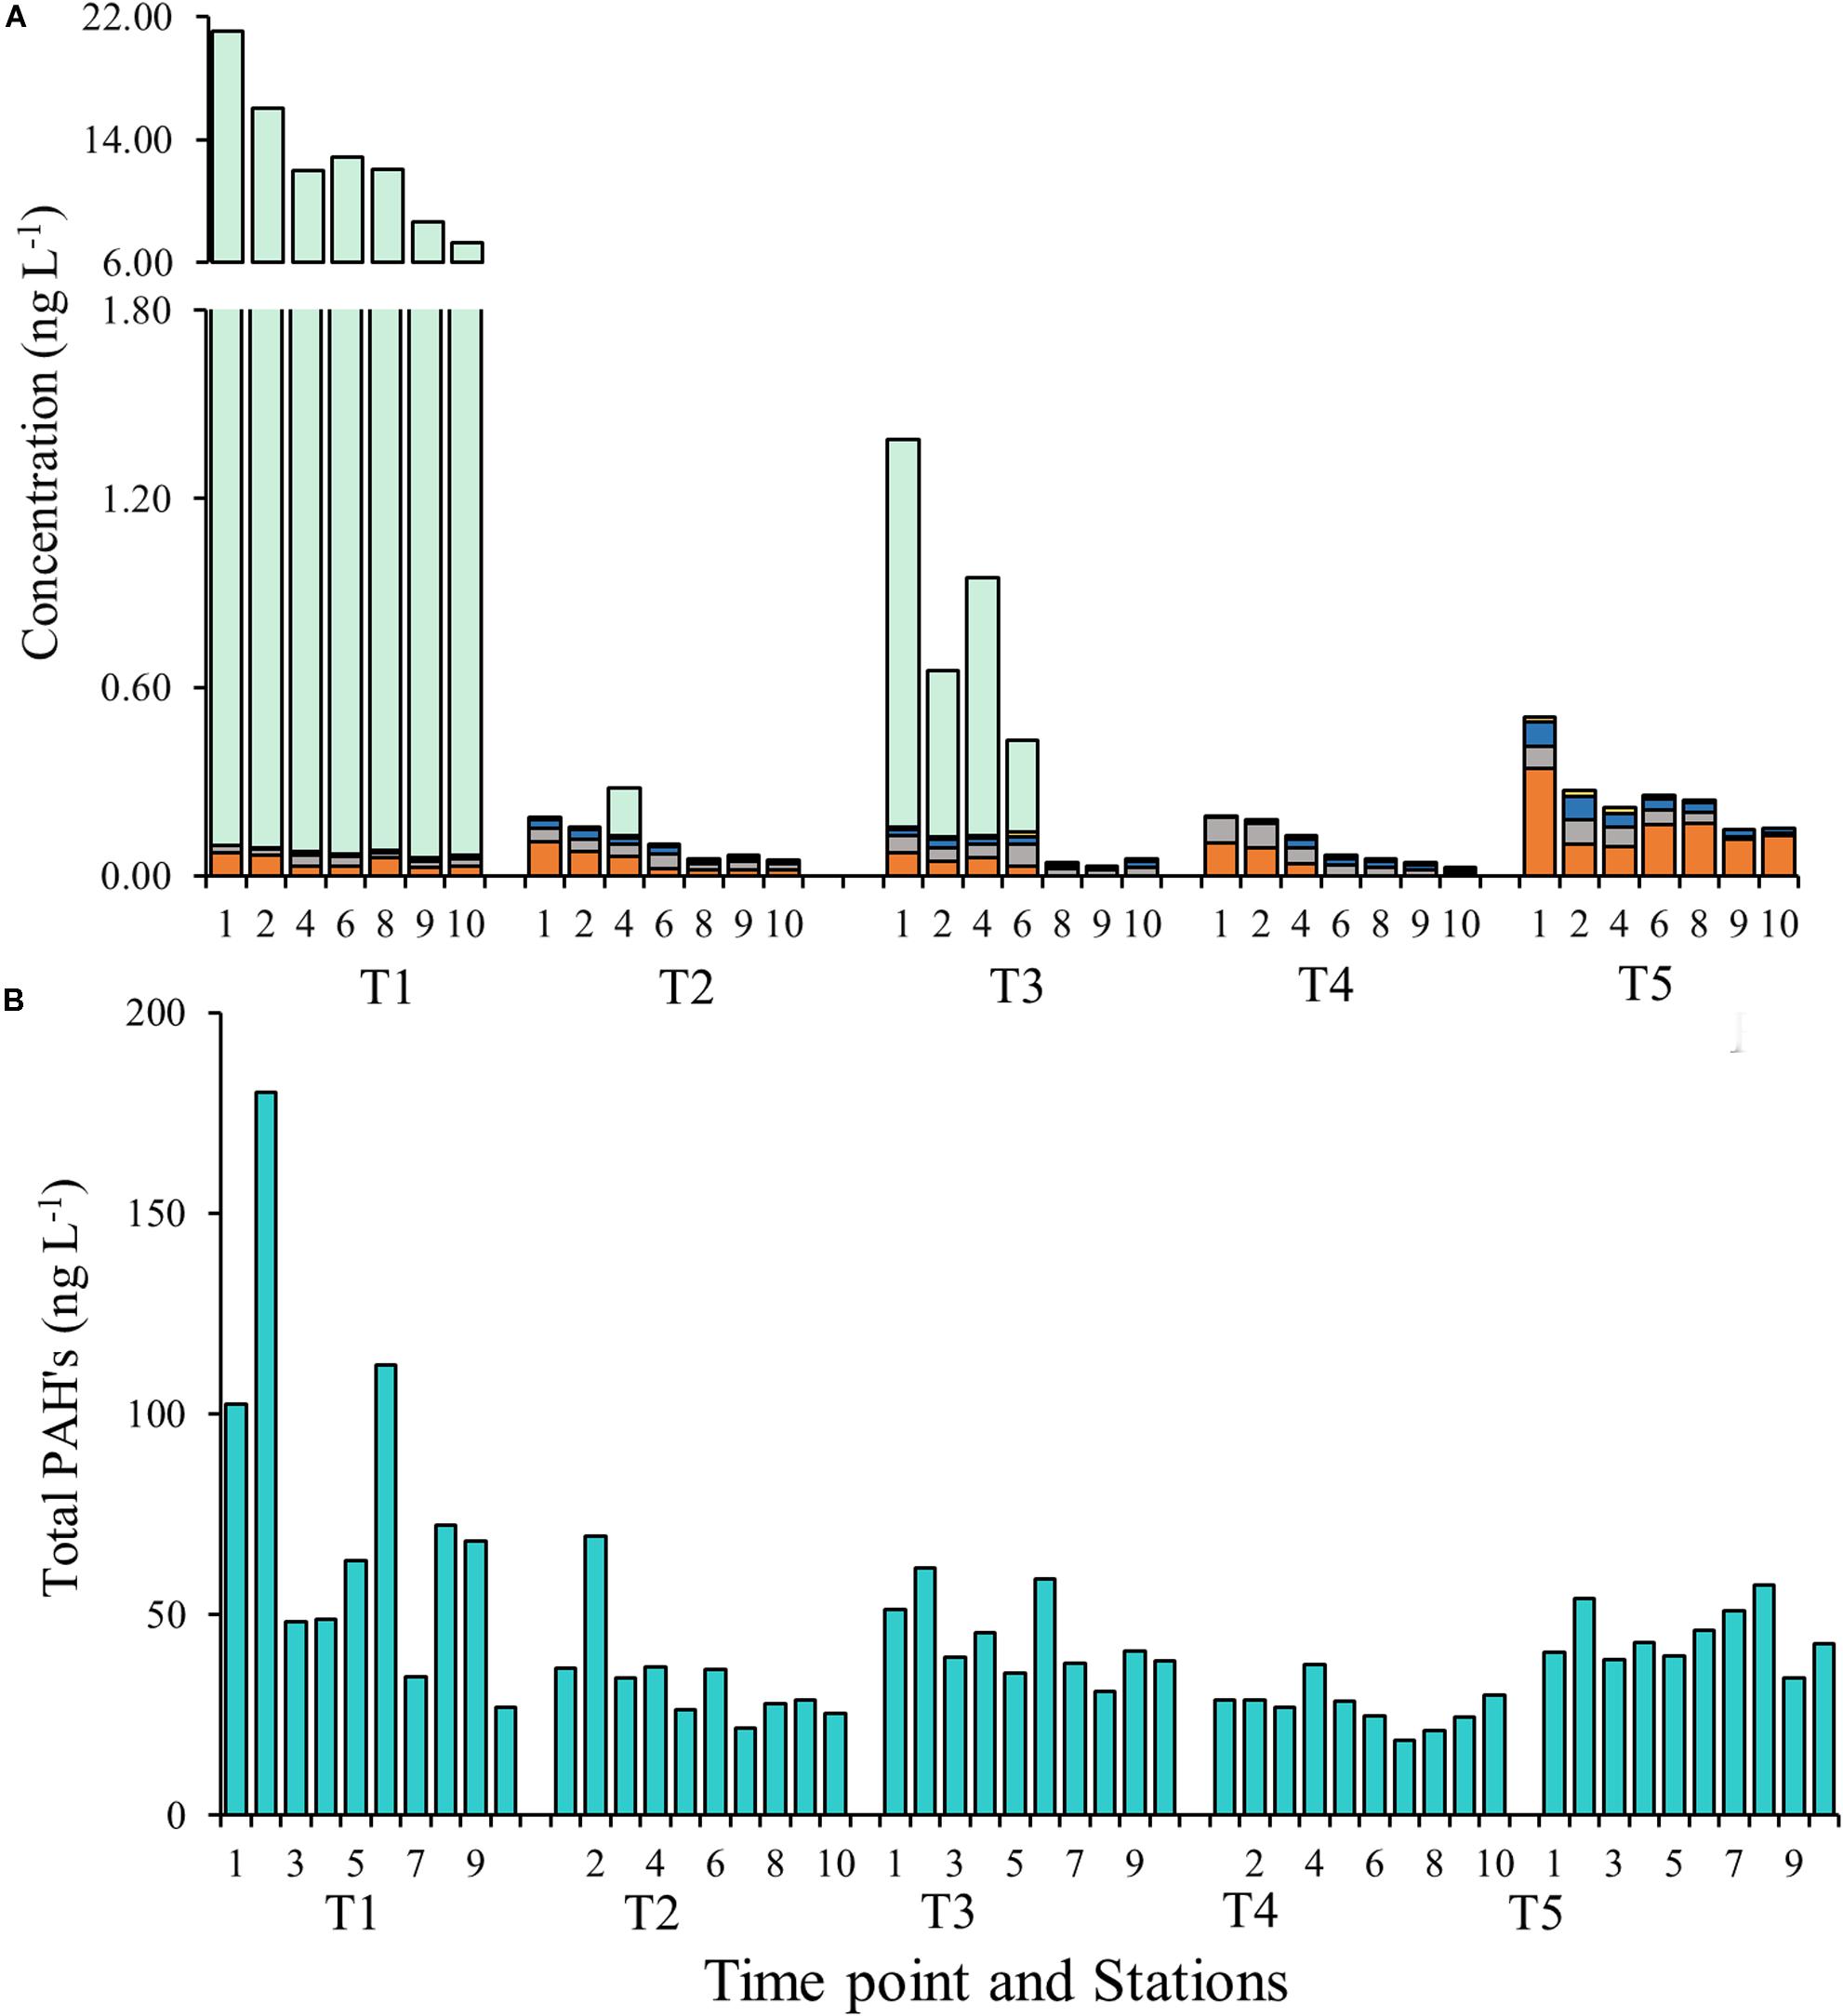
Figure 8. (A) Concentrations of pharmaceuticals and biocides at each time point and station. The y-axis on the left corresponds to the imidacloprid (orange), carbamazepine (gray), cotinine (blue), and carbamazepine-epoxide (yellow) and the y-axis on the right corresponds to Prednisone (green). (B) Concentrations of polycyclic aromatic hydrocarbons (PAHs) at each time point and at each station.
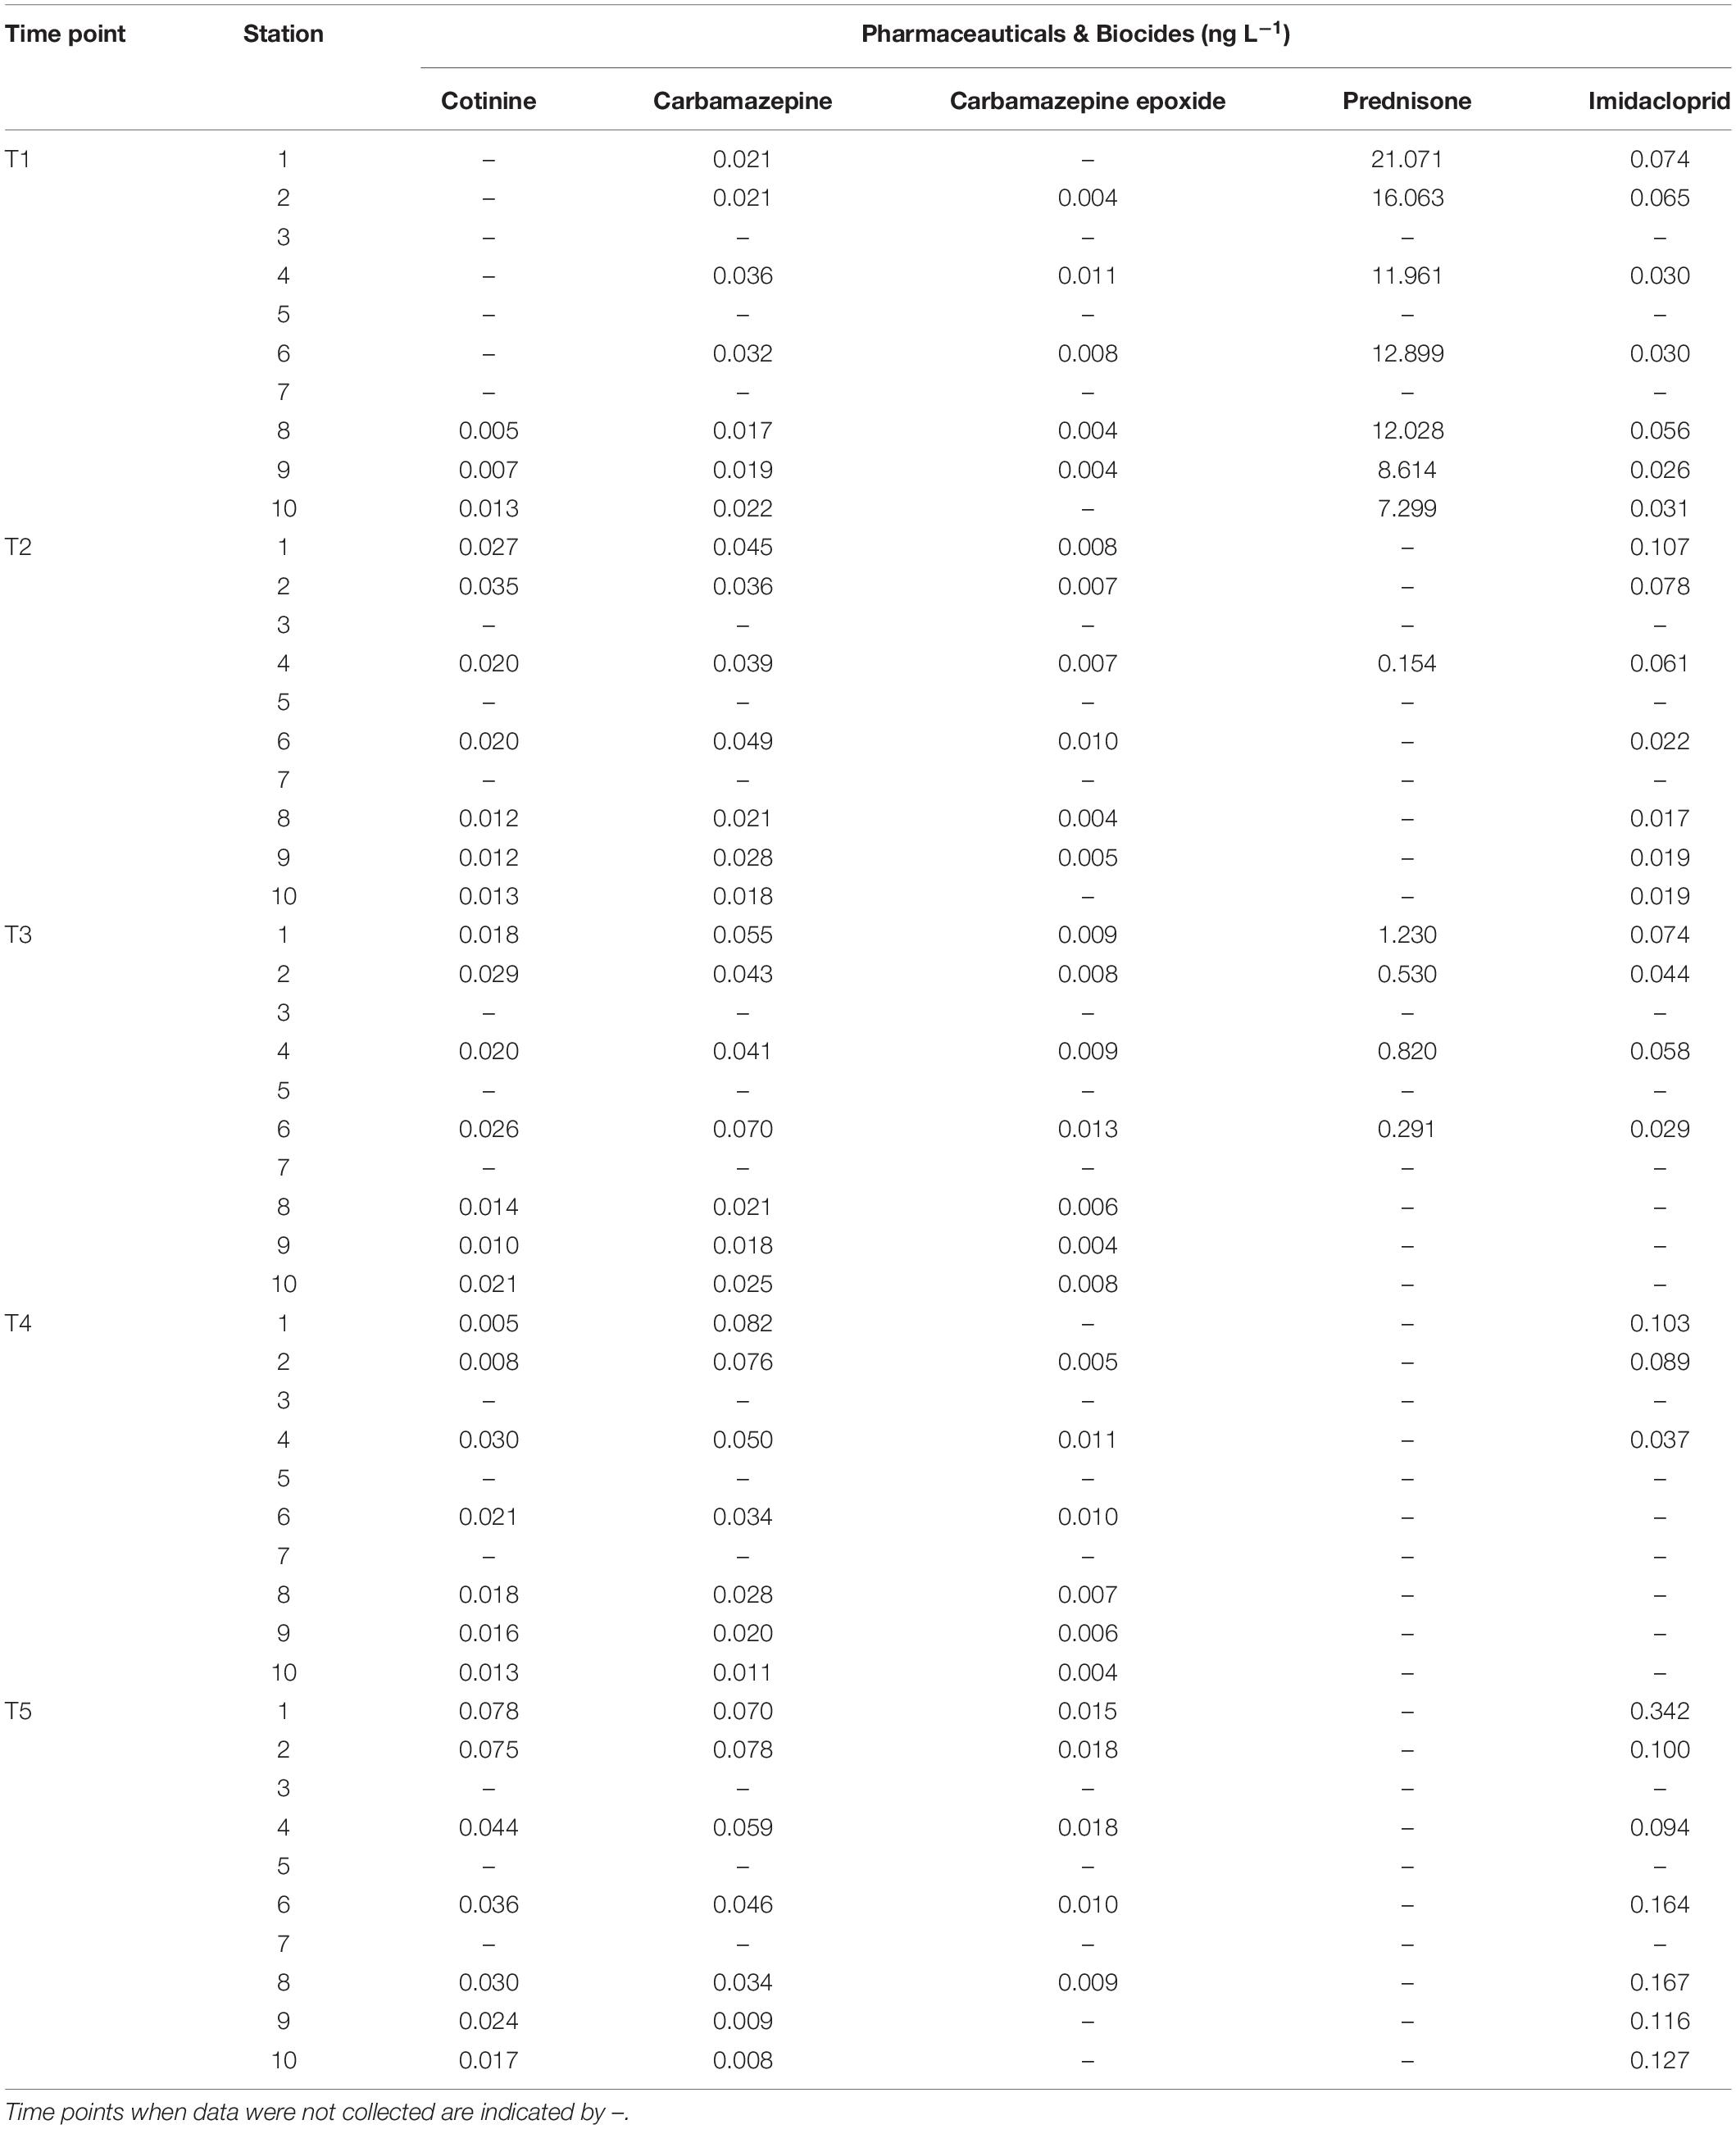
Table 2. Additional abiotic factors including the pharmaceuticals and biocide data collected at each time point at the respective time point and station.
Multivariate Analysis
The results of the DISTLM analysis showed salinity, pH, DIN:Pi, secchi, temperature, dissolved oxygen, HSiO3–, and DIN were all strongly significantly correlated (p < 0.001) with the changes in the biotic community (Table 3). The Pi and TN were also significantly correlated (p < 0.05) with the changes in the biotic community (Table 3). The nMDS shows the distribution of the biotic community measured at each time point and station with a stress level of 0.10 which corresponds to an acceptable ordination that represents the distribution of data points accurately (Figure 9). Increased salinity, pH, dissolved oxygen, and temperature were all strongly correlated (ρ > 0.70) with biotic community that was present during the later time points (T4 and T5) and stations that were closest to the Gulf of Mexico (stations 6–10; Figure 9). Increased nutrients (DIN:Pi and HSiO3–) were correlated (ρ > 0.4) with the biotic community that was present during the early time points (T1, T2 and select stations during T3) and stations located closer to the mouth of the San Jacinto river stations 1–5; Figure 9). The results of the PERMANOVA confirm that there was a significant difference in the biological community when comparing T1 to T2 (p < 0.05) and T3–T5 (p < 0.001; Table 4 and Supplementary Table S1). The biotic variables during T2 were also significantly different from T3–T4 (p < 0.01) and T5 (p < 0.001; Table 4). T3 biological variability was significantly different from T4–T5 (p < 0.001) and T4 was significantly different from T5 (p < 0.01; Table 4). Regarding the environmental variability across time points, T1 and T2 were significantly different from each other (p < 0.001) and were also significantly different from all other time points (p < 0.001; Table 4). T3, T4, and T5 were also significantly different from each other in terms of environmental variability (p < 0.01; Table 4). When considering biological community variability between stations looking at all the time points combined stations 2–4 were all significantly different from station 10 (p < 0.05) and station 5 was significantly different from stations 8 and 9 (p < 0.05; Table 4). While the environmental variability between station 1 and station 2 was not different they were both significantly different from stations 3–8 (p < 0.05) and from stations 9–10 (p < 0.01; Table 4).
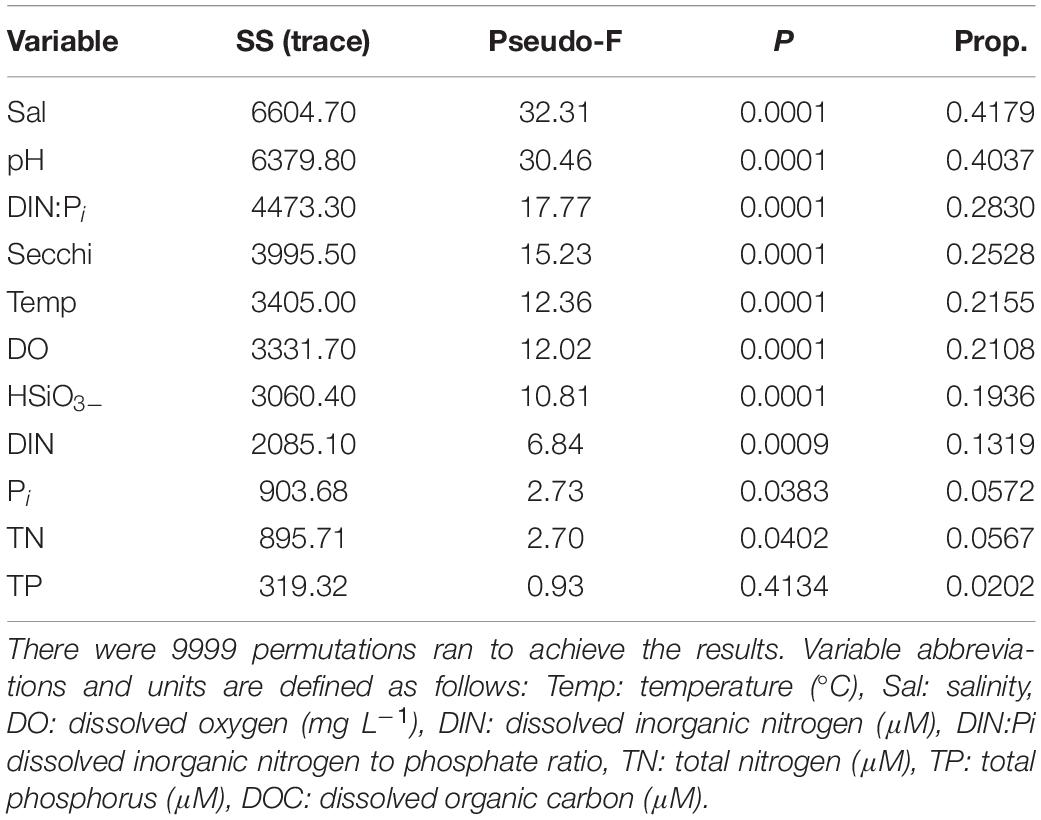
Table 3. Results of the DISTLM analysis that was run on biological data matrix with the environmental data as the predictor variables.
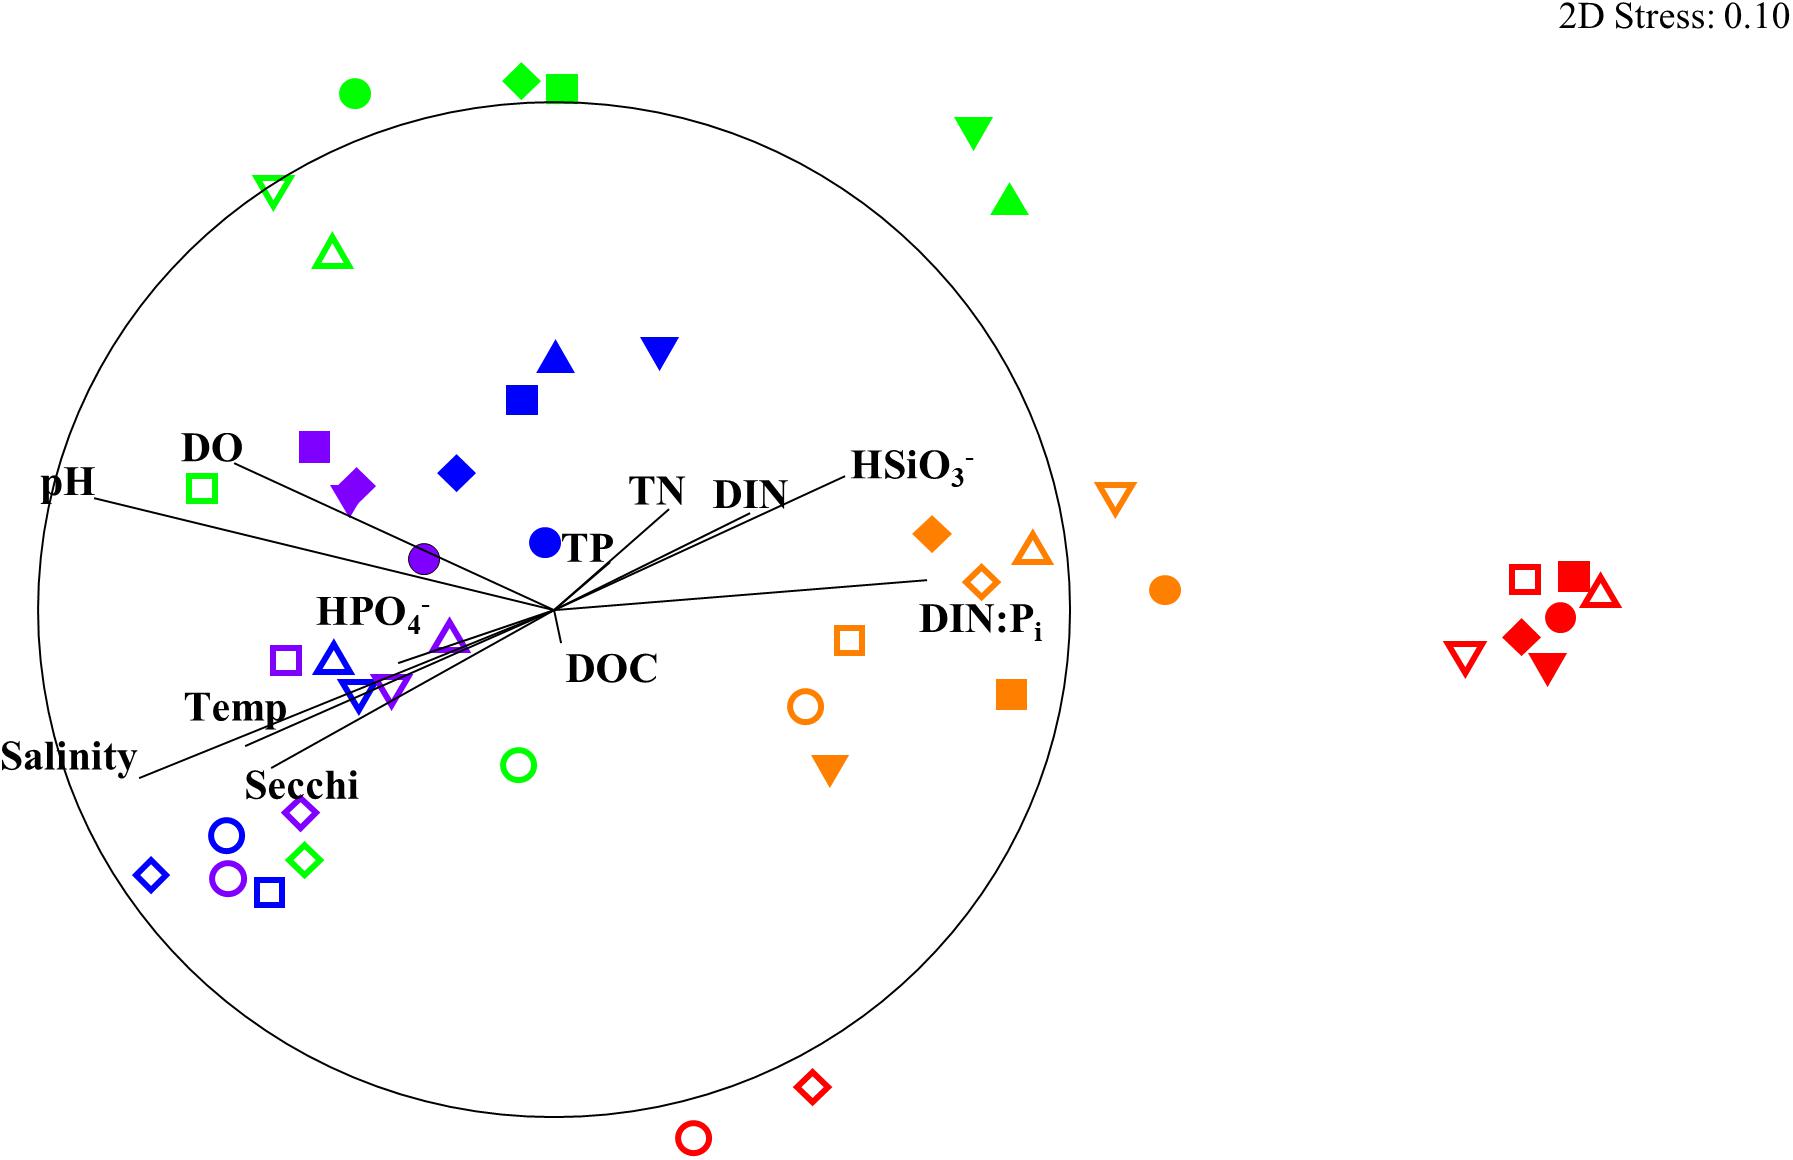
Figure 9. nMDS of biological community showing Pearson correlation of environmental parameters as Temp: temperature (°C), Sal: salinity, DO: dissolved oxygen (mg L– 1), DIN: dissolved inorganic nitrogen (μM), DIN:Pi: dissolved inorganic nitrogen to phosphate ratio, TN: total nitrogen (μM1), TP: total phosphorus (μM), DOC: dissolved organic carbon (μM). Stations are shown as differing symbols: Station 1 (closed upward triangle), 2 (closed downward triangle), 3 (closed square), 4 (closed diamond), 5 (closed circle), 6 (open upward triangle), 7 (open downward triangle), 8 (open square), 9 (open diamond), 10 (open circle). Time points are differentiated by color T1 (red), T2 (orange), T3 (green), T4 (blue), and T5 (purple). nMDS constructed from square root transformed values from the 16S and 18S rRNA OTU abundance data that were used to construct a Bray–Curtis similarity matrix. The circle represents a Pearson correlation of 1.0.
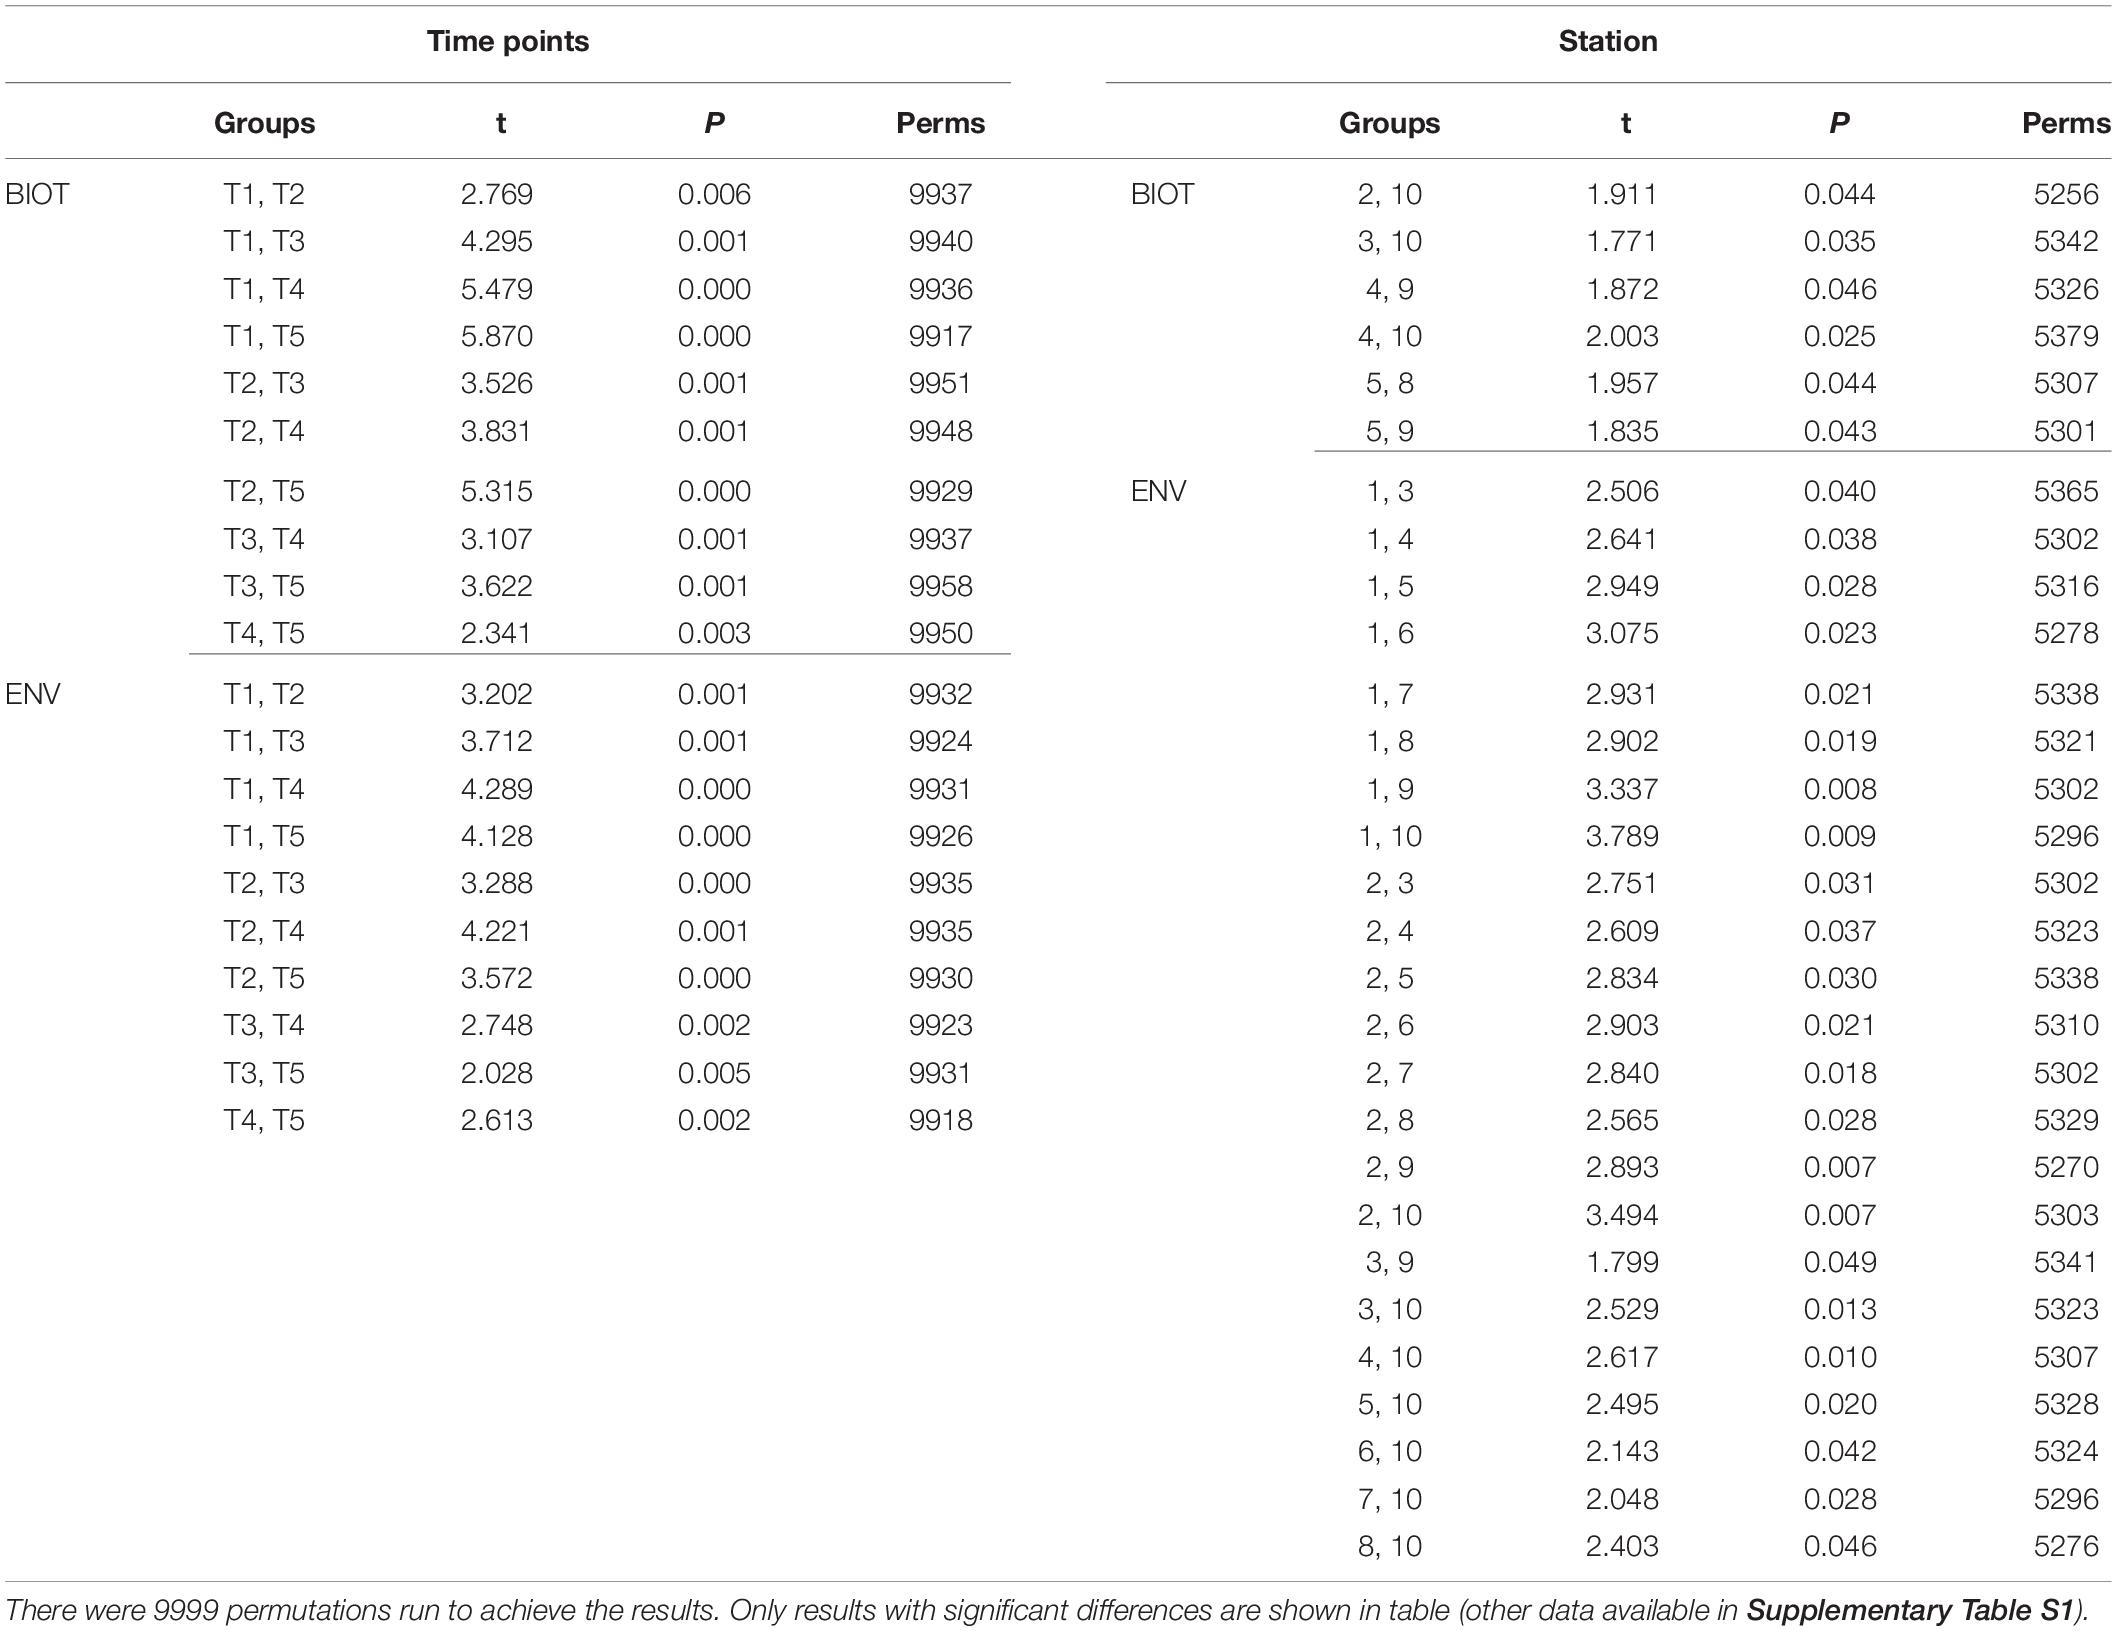
Table 4. Results of the PERMANOVA analysis that was run on biological data matrix with the environmental data as the predictor variables.
Discussion
The total volume of freshwater that entered Galveston Bay by rainfall and runoff during Hurricane Harvey was approximately three to six times the bay volume [Du et al., 2019; Thyng et al., 2020 (in review)]. Historically salinities at the same locations and time of year would range from 20 to 30 (Roelke et al., 2013; Dorado et al., 2015; Pinckney et al., 2017) which is similar to what was observed in during the pre-Harvey sample collections. This flooding event pushed the saltwater out of the bay via hydraulic flushing creating freshwater conditions for over 2 weeks. Although the salinities did begin to increase in the weeks following the flood event, pre-flood salinities were not reached during this study period reflective of the large displacement of bay waters associated with this storm (Figure 2 and Supplementary Figures S1, S2). This large pulse of freshwater via river discharge, runoff, and direct precipitation delivered 105 ± 10 Gg of terrigenous DOC to the bay within one week following the hurricane (Yan et al., this issue). With this initial pulse of freshwater, elevated concentrations of ammonium were measured in the bay from and were believed to be from a variety of sources associated with Harvey including agricultural runoff, waste water, and storm water. The ammonium concentration was elevated during the first two cruises and then declined as it was potentially taken up by the bacterioplankton and phytoplankton. The TN also increased in concentration during the first cruise and showed a decrease over time potentially indicating that the microbial community was remineralizing this source of organic nitrogen to ammonium and also converting the ammonium to NOx.
Flooding of the bay impacted microbial communities such that the generally dominant members of the marine coastal bacteria community (Acidomicrobia, Alphaproteobacteria, Cyanobacteria, Betaproteobacteria SAR11, and Gammaproteobacteria Oceanospirillales), were replaced by microorganisms of terrestrial (Actinobacteria, OBP45 Soil Group, Opitutae, OBP35 soil group), sedimentary (Actinobacteria), agricultural (OM190 soil group), and freshwater (Betaproteobacteria: Burkholderiales and Methylophilales) origin (Figures 5–7, 9; Chistoserdova, 2011a, b; Beck et al., 2013). During the first cruise, the bacterial communities at all stations were very homogenous, consistent with the parallel trends observed in the water quality values. Sphingobacteria, more commonly found in activated sludge from wastewater treatment plants (Herlemann et al., 2013), had higher relative abundance during the first two cruises and at the freshwater sites for the later time points. Microbes associated with surface sediments (species within the class Opitutae) were observed in the earlier cruises, which could explain times when terrestrial soils may have been present in the floodwaters. Four weeks after the hurricane, a shift in the members of the phylum Verrucomicrobia occurred from the soil-based Opitutae class to the aquatic Spartobacteria class indicating that the estuarine/marine conditions were returning to the system (Herlemann et al., 2013). There was no increase in the relative abundance of gut-associated bacteria (i.e., Enterobacteria and Firmicutes), suggesting there was minimal human influence on the bacterial community in earlier time points compared (Zhang et al., 2015). van Oldenborgh et al. (2017) calculated that there was a pulse (1.14 × 10⁵ m3) of untreated wastewater and raw sewage into the bay during the flooding event. For this study, the first cruise took place approximately 1 week after the flooding event, thus the gut-associated signal may have been missed if it was present during and immediately following the storm, or that our detection limit is too high to pick up the least abundant microorganisms. Members of the microbial community typically present in the bay and normally associated with coastal marine environments, such as Oceanospirillales, SAR11, and Marine Group A, were barely detectable after Hurricane Harvey and slowly increase with time after the storm. Marine Cyanobacteria dominated by Synechococcus sp. typically represent ∼20–30% of the total abundance of all OTUs within Galveston Bay. After Hurricane Harvey, Cyanobacteria represented <5% of all OTUs and gradually came back to pre-hurricane levels within the 6 weeks following the flood. The observed decrease in marine Cyanobacteria could be due to the lower salinity and lower water temperatures, a seasonal trend that has been observed along the coast of Texas (Suttle and Chan, 1994) and other environments (Xia et al., 2015; Kim et al., 2018).
The response of the microbial community (including bacteria and phytoplankton) after a flooding event can be dependent on the nutrient concentrations present in the estuary before the storm waters were introduced to the system (Roelke et al., 2013; Dorado et al., 2015). Initially DIN:Pi observed in Galveston Bay following Harvey was relatively high (∼10), particularly adjacent to the river mouth, and then returned closer to ∼1 by the end of the month, indicating the phytoplankton populations were nitrogen limited as has been observed previously (Roelke et al., 2013; Dorado et al., 2015). The organic phosphorus continued to increase with time as the flood waters continued to move out of the bay toward the Gulf of Mexico. The Pi also increased with time after the initial flooding event supporting the idea that the bacterial community was remineralizing the organic phosphorus throughout the bay. In previous studies, members of the phytoplankton community (diatoms) have responded by increasing in biomass if nutrients were limiting prior to a flooding event (Paerl et al., 2001; Roelke et al., 2013; Dorado et al., 2015). When pulses of nutrients are introduced into a system that is nutrient replete, the phytoplankton biomass may not increase in response to additional nutrients (Roelke et al., 2013; Dorado et al., 2015). Inversely, the Dinophyceae have shown a negative correlation with freshwater inflows or added nutrients (Roelke et al., 2013; Dorado et al., 2015). Other factors that may contribute to changes in the phytoplankton abundance depend on the volume of floodwater and how the residence time of the system is affected. Phytoplankton biomass has been shown to decrease following large flooding events due to the hydraulic flushing physically pushing the bay waters out of the system (Paerl et al., 2001; Pinckney et al., 2009; Roelke et al., 2013). Immediately following Harvey, a small phytoplankton bloom occurred with a dominance of diatoms, cryptophytes, and chlorophytes, in response to the freshwater inflow and pulse of nutrients from Hurricane Harvey suggesting nutrients may have been limiting prior to this flooding event (Piehler et al., 2004). Blooms of both diatoms and dinoflagellates have previously been seen after flooding events in an Australian lagoon (Cook et al., 2010; Hallegraeff, 2010) and in North Carolina’s Neuse River Estuary after Hurricane Isabel (Wetz and Paerl, 2008) and in Lake Ponchetrain, LA (United States) following Hurricanes Katrina and Rita (Pinckney et al., 2009).
Alongside changes in phytoplankton communities are corresponding changes in eukaryotic grazers. Ciliate grazers, including select freshwater Oligotrichea, preferentially consume cryptophytes (Müller and Schlegel, 1999; Posch et al., 2015). Before Harvey, Oligotrichea (a ciliate grazer) was dominant alongside its prey the cryptophytes. Similar to what Posch et al. (2015) had observed following the hurricane, diatoms were in high in relative abundance along with the ciliate grazers Listomatae. During the third cruise, the ciliate grazer Spirotrichae increased in abundance compared to earlier time points, after which Oligotrichea had the highest abundance of the ciliates which is a pattern that had previously been documented during Hurricanes Katrina and Rita and in freshwater lakes (Amaral-Zettler et al., 2008; Posch et al., 2015). Notably, the ciliate grazer sequences which were discovered in this study were similar to that observed after Hurricanes Katrina and Rita by Posch et al. (2015). After Hurricane Harvey, the eukaryotic community changed drastically, and did not recover to pre-Harvey conditions within the month of sampling, suggesting a longer recovery period compared to the prokaryotes. While much is known about commercial and recreational fisheries (Thronson and Quigg, 2008; Lester and Gonzalez, 2011; Tolan, 2013; Steichen and Quigg, 2018; Oakley and Guillen, 2019) less is known about the lower eukaryotic trophic levels and how they respond to extreme events.
The Galveston Bay watershed is a sink for runoff, major industrial, agricultural, municipal effluent discharges, and also serves as a high-intensity transportation hub for regional oil refineries and industries with intensive shipping traffic visiting its three major ports (Steichen et al., 2012). In addition to these anthropogenic pressures, spills from tankers and barges have released a variety of chemicals (including petroleum products) into Galveston Bay (Williams et al., 2017). As a result of these various contamination sources, Galveston Bay waters, sediments, and biota (microbes, invertebrates, finfish, etc.) are traditionally key focus areas for environmental monitoring studies observing legacy pollutants, such as PAHs, PCBs, dioxins, and metals (Roach et al., 1993; Willett et al., 1997; Qian et al., 2001; Suarez et al., 2006; Howell et al., 2008; Lakshmanan et al., 2010; Yin et al., 2015). Flooding from large storm events has been shown to affect estuarine systems by decreasing residence times, delivering increased concentrations of nutrients, organic matter, and potentially pollutants (Paerl et al., 2001; Peierls et al., 2003; Pinckney et al., 2009).
In general, the low volatility and polar nature of PBs ensure widespread distributions through primarily aqueous transport routes (mainly surface waters) or through food-chain (trophic) transfer (Daughton and Ternes, 1999). Major sources of pharmaceuticals in the environment include effluent outfalls from wastewater treatment plants and runoff from agriculture or from landfill leachates (Boxall et al., 2012; Gaw et al., 2014). In this study, the PBs (cotinine, imidacloprid, carbamazepine, and carbamazepine-epoxide) increased in concentration with time indicating a dilution effect by the freshwater pulse following this flooding event. Prednisone, a commonly prescribed steroidal (glucocorticoid) anti-inflammatory drug in North America (Cdc Md STARnet, 2019), had been measured in Galveston Bay previously by Rashid and Duffett (2016). The level of prednisone following Harvey presents an exception to the trends observed for the remainder PBs showing an increase from pre-Harvey conditions, compared to the undetectable levels at the subsequent time points. This result is difficult to explain as it is counter to the expectation of PB dilution following the six orders of magnitude of rainfall relative to sewage overflow. It may be likely that a point-source release of prednisone due to the flooding caused by Harvey is responsible for the observed trends (i.e., high levels immediately following Harvey, with levels decreasing thereafter). Overall, our results indicate that there is likely to be a low level of PB contamination (∼0.01–0.1 ng L–1) in Galveston Bay, with elevated levels more characteristic of the upper reaches of the Bay and around the entrance to the Houston Ship Channel. It is likely that these compounds constitute commonly occurring PBs that represent an “anthropogenic footprint” in the Houston/Galveston Bay watershed but further work is necessary to provide confirmation.
In what is argued to be an extremely rare event, the 1000-year flooding associated with Hurricane Harvey occurred in a region already showing positive trends in terms of intensity and frequency of extreme precipitation events (van Oldenborgh et al., 2017). In a modeling study, Emanuel (2017) estimated that the annual probability of 500 mm of area-integrated rainfall was about 1% in the period 1981–2000 but increased to 18% in the period 2081–2100. Both studies make it clear that extreme rainfall events along the Texas Gulf Coast are on the rise. Recent events along the northern Gulf of Mexico coast, including two 500-year floods in the years immediately prior to Hurricane Harvey (May 2015 and April 2016) as well as several other severe storm events which directly impacted the Houston area this century (Tropical Storm Allison, 2001 and Hurricane Ike, 2008), indicate these models are tracking observations. Extreme rainfall events should be part of the discussion of environmental management and mitigation and future improvements to flood protection systems in major cities around the Gulf and globally. Although the water quality and microbial community showed signs of returning to pre-Harvey conditions within the month following the flood event, long-term impacts need to be measured in the years following the flood. While the nekton community in estuarine systems is resilient to short-term disturbances, there may be more lasting effects with the predicted rise in the frequency and magnitude of these large rain events (Waide, 1991; Paperno et al., 2006; Oakley and Guillen, 2019). With an increase in frequency and intensity of these coastal disturbances and extreme flooding events, there may be a shift in the amount of time needed for a system to recover (Paerl et al., 2001). Rapid declines in the salinity of estuarine systems such as what was observed in Galveston Bay have been shown to impact the resident nekton community by decreasing the availability of suitable habitat for these macrofauna (Lenihan and Peterson, 1998; Eby et al., 2000; Paerl et al., 2001; McFarlin et al., 2015). Future work should be done on the effects this freshening had on the organisms in the bay following a disruption at the base of the food web. The impacts of the increased contaminants and the extensive period of low salinity created due to this flooding event warrant continued monitoring of the water quality conditions and microbial community of this system in years to come to determine the long-term effects on the biological community from the base of the food web upward within Galveston Bay.
Collectively, these findings showed that over the month following the storm, a transition occurred from an estuarine biotic community before the hurricane to a primarily freshwater biotic community after the flooding event and then began the shift back to an estuarine/marine biotic community within about a month after the flood event. There was a large pulse of organic matter that provided substrate for microbial degradation. The bacterial community showed an increase in the abundance of bacteria associated with terrestrial soils and freshwater at the initial time point and then decreased over time and were replaced by their estuarine and marine relatives within the month following the hurricane. The microbial eukaryotic community (phytoplankton and grazers) displayed a rapid transition from an estuarine community to a freshwater community following the storm with a slower recovery compared to the 16S rRNA community. This collaborative effort will allow for improved understanding of the physicochemical and biological changes following a large storm event within subtropical estuaries. While this work captured the immediate impact of a hurricane on an estuarine system, future work is recommended to enhance our understanding pertaining to the long-term effects of a storm of this magnitude on various levels of the food web.
Data Availability Statement
The datasets generated for this study can be found in the BioProject #PRJNA558756. This research was made possible by a grant from The Gulf of Mexico Research Initiative to support consortium research entitled ADDOMEx (Aggregation and Degradation of Dispersants and Oil by Microbial Exopolymers) Consortium. Data are publicly available through the Gulf of Mexico Research Initiative Information and Data Cooperative (GRIIDC) at http://data.gulfresearchinitative.org (doi: 10.7266/PGC99C7D).
Author Contributions
The author contribution to this manuscript is as follows: JS 25%, AQ 20%, JL 15%, RW 5%, DH 5%, PF 5%, KK 5%, SS 5%, HB 5%, GY 5%, and MK 5%.
Funding
AQ, JS, RW, SS, and MK were either fully or partially supported by the GOMRI (ADDOMEx; project SA15-22) and by the Texas Commission on Environmental Quality: Galveston Bay Estuary Program (US EPA Grant Number: CE-00655006). Work done by JL was funded by the National Science Foundation—RAPID Response (Award #1801367). KK and GY were funded by National Science (Grant #: 1333633).
Conflict of Interest
The authors declare that the research was conducted in the absence of any commercial or financial relationships that could be construed as a potential conflict of interest.
Acknowledgments
We would like to thank all members of the Phytoplankton Dynamics lab at Texas A&M University at Galveston (TAMUG) that assisted with cruise plans and organization, sample collection, and processing. Many thanks to the crew of the TAMUG R/V Trident and to everyone from TAMUG that came along (with very short notice) to assist in sample collection, sample processing, and data analysis.
Supplementary Material
The Supplementary Material for this article can be found online at: https://www.frontiersin.org/articles/10.3389/fmars.2020.00186/full#supplementary-material
FIGURE S1 | MODIS images (http://ge.ssec.wisc.edu/modis-today/) of Galveston Bay before, during, and after the passing of Hurricane Harvey on 22, 29, 31 August and 9, 16, 28 September 2017.
FIGURE S2 | The daily river inflow for the San Jacinto and Trinity Rivers (log10 scale). To account for total San Jacinto River daily discharge multiple gage locations are summed: Cedar (USGS 08067500), Brays (USGS 08075000), Buffalo (USGS 08073600), Chocolate (USGS 08078000), Greens (USGS 08076000), Halls (USGS 08076500), Hunting (USGS 08075770), Lake Houston (USGS 08072000),Vince (USGS 08075730), and White Oak (USGS 08074500). The Trinity River flow was measured at the Liberty gage (USGS 08067000). Arrow indicates the passing of Hurricane Harvey.
FIGURE S3 | PCA of environmental data with base environmental variables shown as vectors: Temp: temperature (°C), Sal: salinity, DO: dissolved oxygen (mg L–1), DIN: dissolved inorganic nitrogen (μM), DIN:Pi: dissolved inorganic nitrogen to phosphate ratio, TN: total nitrogen (μM), TP: total phosphorus (μM), DOC: dissolved organic carbon (μM). Stations are shown as differing symbols: Station 1 (closed upward triangle), 2 (closed downward triangle), 3 (closed square), 4 (closed diamond), 5 (closed circle), 6 (open upward triangle), 7 (open downward triangle), 8 (open square), 9 (open diamond), 10 (open circle). Time points are differentiated by color T1 (red), T2 (orange), T3 (green), T4 (blue), and T5 (purple). Environmental data were square root transformed and normalized then used to calculate the Euclidean matrix and construct the PCA.
FIGURE S4 | nMDS of biological community showing taxa as vectors (Pearson correlation > 0.8). Stations are shown as differing symbols: 1 (closed upward triangle), 2 (closed downward triangle), 3 (closed square), 4 (closed diamond), 5 (closed circle), 6 (open upward triangle), 7 (open downward triangle), 8 (open square), 9 (open diamond), 10 (open circle). Time points are differentiated by color T1 (red), T2 (orange), T3 (green), T4 (blue), and T5 (purple). nMDS constructed from square root transformed values from the 16S and 18S rRNA OTU abundance data that were used to construct a Bray–Curtis similarity matrix.
FIGURE S5 | PCA of the PAHs and PBs with base environmental variables shown as vectors. Stations are shown as differing symbols: Station 1 (closed upward triangle), 2 (closed downward triangle), 3 (closed square), 4 (closed diamond), 5 (closed circle), 6 (open upward triangle), 7 (open downward triangle), 8 (open square), 9 (open diamond), 10 (open circle). Time points are differentiated by color T1 (red), T2 (orange, T3 (green), T4 (blue), and T5 (purple). Environmental data were square root transformed and normalized then used to calculate the Euclidean matrix and construct the PCA.
TABLE S1 | Non-significant results of the PERMANOVA analysis that was run on biological data matrix with the environmental data as the predictor variables. There were 9999 permutations ran to achieve the results.
Footnotes
References
Amaral-Zettler, L. A., Rocca, J. D., Lamontagne, M. G., Dennett, M. R., and Gast, R. J. (2008). Changes in microbial community structure in the wake of Hurricanes Katrina and Rita. Environ. Sci. Technol. 42, 9072–9078. doi: 10.1021/es801904z
American Public Health Association [APHA] (1985). Standard Methods for the Examination of Water and Wastewater, 16th Edn. Washington, D.C.: American Public Health Association.
American Public Health Association [APHA] (1998). Standard Methods for the Examination of Water and Wastewater, 20th Edn. Washington, D.C.: APHA, AWWA, and WEF.
Ankley, G. T., Brooks, B. W., Huggett, D. B., and Sumpter, J. P. (2007). Repeating history: pharmaceuticals in the environment. Environ. Sci. Technol. 41, 8211–8217. doi: 10.1021/es072658j
Apprill, A., McNally, S., Parsons, R., and Weber, L. (2015). Minor revision to V4 region SSU rRNA 806R gene primer greatly increases detection of SAR11 bacterioplankton. Aquat. Microb. Ecol. 75, 129–137. doi: 10.3354/ame01753
Bacosa, H. P., Kamalanathan, M., Chiu, M. H., Tsai, S. M., Sun, L., Labonté, J. M., et al. (2018). Extracellular polymeric substances (EPS) producing and oil degrading bacteria isolated from the northern Gulf of Mexico. PLoS ONE 13:e0208406. doi: 10.1371/journal.pone.0208406
Beck, D. A., Kalyuzhnaya, M. G., Malfatti, S., Tringe, S. G., del Rio, T. G., Ivanova, N., et al. (2013). A metagenomic insight into freshwater methane-utilizing communities and evidence for cooperation between the Methylococcaceae and the Methylophilaceae. PeerJ 1:e23. doi: 10.7717/peerj.23
Benner, R., and Strom, M. (1993). A critical evaluation of the analytical blank associated with DOC measurements by high-temperature catalytic oxidation. Mar. Chem. 41, 153–160. doi: 10.1016/0304-4203(93)90113-3
Blake, E. S., and Zelinsky, D. A. (2018). “National Hurricane Center Tropical Cyclone Report Hurricane Harvey”: National Oceanic and Atmospheric Administration. Report No. AL092017. Available online at: https://www.nhc.noaa.gov/data/tcr/AL092017_Harvey.pdf
Boxall, A. B., Rudd, M. A., Brooks, B. W., Caldwell, D. J., Choi, K., and Hickmann, S. (2012). Pharmaceuticals and personal care products in the environment: what are the big questions? Environ. Health Perspect. 120, 1221–1229.
Bradley, I. M., Pinto, A. J., and Guest, J. S. (2016). Design and evaluation of Illumina MiSeq-compatible, 18S rRNA gene-specific primers for improved characterization of mixed phototrophic communities. Appl. Environ. Microbiol. 82, 5878–5891. doi: 10.1128/aem.01630-16
Caporaso, J. G., Lauber, C. L., Walters, W. A., Berg-Lyons, D., Lozupone, C. A., Turnbaugh, P. J., et al. (2011). Global patterns of 16S rRNA diversity at a depth of millions of sequences per sample. Proc. Natl. Acad. Sci. 108, 4516–4522. doi: 10.1073/pnas.1000080107
Cdc Md STARnet (2019). Data and Statistics Muscular Dystrophy, On-Line (cited 2019 Oct 14). Available online at: https://www.cdc.gov/ncbddd/musculardystrophy/data.html
Chapin, J. (2017). EPA approves plan to clean up San Jacinto waste pits. KHOU (newspaper on the Internet). Available online at: http://www.khou.com/news/local/epa-approves-plan-to-clean-up-san-jacinto-waste-pits/482678370
Chistoserdova, L. (2011a). Methylotrophy in a lake: from metagenomics to single-organism physiology. Appl. Environ. Microbiol. 77, 4705–4711. doi: 10.1128/aem.00314-11
Chistoserdova, L. (2011b). Modularity of methylotrophy, revisited. Environ. Microbiol. 13, 2603–2622. doi: 10.1111/j.1462-2920.2011.02464.x
Clarke, K. R., and Warwick, R. M. (1994). Similarity-based testing for community pattern: the two-way layout with no replication. Mar. Biol. 118, 167–176. doi: 10.1007/bf00699231
Clarke, K. R., and Warwick, R. M. (2001). Change in Marine Communities. An Approach to Statistical Analysis and Interpretation. Plymouth: PRIMER-e.
Cook, P. L., Holland, D. P., and Longmore, A. R. (2010). Effect of a flood event on the dynamics of phytoplankton and biogeochemistry in a large temperate Australian lagoon. Lim. Ocean. 55, 1123–1133. doi: 10.4319/lo.2010.55.3.1123
Daughton, C. G., and Ternes, T. A. (1999). Pharmaceuticals and personal care products in the environment: agents of subtle change? Environ. Health Perspect. 6, 907–938. doi: 10.1289/ehp.99107s6907
Dorado, S., Booe, T., Steichen, J., McInnes, A. S., Windham, R., and Shepard, A. (2015). Towards an understanding of the interactions between freshwater inflows and phytoplankton communities in a subtropical estuary in the Gulf of Mexico. PLoS One 10:e0130931. doi: 10.1371/journal.pone.0130931
Du, B., Haddad, S. P., Luek, A., Scott, W. C., Saari, G. N., Burket, S. R., et al. (2016). Bioaccumulation of human pharmaceuticals in fish across habitats of a tidally influenced urban bayou. Environ. Tox. Chem. 35, 966–974. doi: 10.1002/etc.3221
Du, J., Park, K., Dellapenna, T. M., and Clay, J. M. (2019). Dramatic hydrodynamic and sedimentary responses in Galveston Bay and adjacent inner shelf to Hurricane Harvey. Sci. Tot. Environ. 653, 554–564. doi: 10.1016/j.scitotenv.2018.10.403
Eby, L. A., Crowder, L. B., and McClellan, C. (2000). Neuse River Estuary Modeling andMonitoring Project, Stage 1, Effects of Water Quality on Distribution and Composition of the Fish Community, Report 325C. Raleigh, NC: Univ. of North Carolina Water Resources Res. Inst.
Emanuel, K. (2017). Assessing the present and future probability of Hurricane Harvey’s rainfall. Proc. Nat. Acad. Sci. U.S.A. 114, 12681–12684. doi: 10.1073/pnas.1716222114
Environment Texas Research and Policy Center (2017). Raw Sewage Released by Hurricane Harvey. Available online at: https://environmenttexascenter.org/
Gaw, S., Thomas, K. V., and Hutchinson, T. H. (2014). Sources, impacts and trends of pharmaceuticals in the marine and coastal environment. Philos. Trans. R. Soc. Lond. B Biol. Sci. 369, 20130572. doi: 10.1098/rstb.2013.0572
Guo, L., Santschi, P. H., and Bianchi, T. S. (1999). “Dissolved organic matter in estuaries of the Gulf of Mexico,” in Biogeochemistry of Gulf of Mexico Estuaries, eds T.S. Bianchi, J. Pennock, and R. R. Twilley (New York, NY: Jhon Wiley and Sons). 269–299.
Guthrie, C. G., Matsumoto, J., and Solis, R. S. (2012). “Analysis of the influence of water plan strategies on inflows and salinity in galveston bay,” in Final Report to the United States Army Corps of Engineers, Contract #R0100010015. (Austin, TX: Texas Water Development Board), 71.
Hallegraeff, G. M. (2010). Ocean climate change, phytoplankton community responses, and harmful algal blooms: a formidable predictive challenge. J. Phycol. 46, 220–235. doi: 10.1111/j.1529-8817.2010.00815.x
Herlemann, D. P., Lundin, D., Labrenz, M., Jürgens, K., Zheng, Z., Aspeborg, H., et al. (2013). Metagenomic de novo assembly of an aquatic representative of the verrucomicrobial class Spartobacteria. Mar. Bio. 4:e569-12.
Horney, J. A., Casillas, G. A., Baker, E., Stone, K. W., Kirsch, K. R., Camargo, K., et al. (2018). Comparing residential contamination in a houston environmental justice neighborhood before and after Hurricane Harvey. PLoS ONE 13:e0192660. doi: 10.1371/journal.pone.0192660
Howell, N. L., Suarez, M. P., Rifai, H. S., and Koenig, L. (2008). Concentrations of polychlorinated biphenyls (PCBs) in water, sediment, and aquatic biota in the Houston Ship Channel, Texas. Chemosphere 70, 593–606. doi: 10.1016/j.chemosphere.2007.07.031
Kamalanathan, M., Chiu, M. H., Bacosa, H., Schwehr, K., Tsai, S. M., Doyle, S., et al. (2019). Role of polysaccharides in diatom Thalassiosira pseudonana and its associated bacteria in hydrocarbon presence. Plant Phys. 180, 1898–1911. doi: 10.1104/pp.19.00301
Kiaghadi, A., and Rifai, H. S. (2019). Physical, chemical, and microbial quality of floodwaters in houston following hurricane harvey. Environ. Sci. Technol. 53, 4832–4840. doi: 10.1021/acs.est.9b00792
Kim, Y., Jeon, J., Kwak, M. S., Kim, G. H., Koh, I., and Rho, M. (2018). Photosynthetic functions of Synechococcus in the ocean microbiomes of diverse salinity and seasons. PLoS One 13:e0190266. doi: 10.1371/journal.pone.0190266
Kozich, J. J., Westcott, S. L., Baxter, N. T., Highlander, S. K., and Schloss, P. D. (2013). Development of a dual-index sequencing strategy and curation pipeline for analyzing amplicon sequence data on the MiSeq Illumina sequencing platform. Appl. Environ. Microbiol. 79, 5112–5120. doi: 10.1128/aem.01043-13
Lakshmanan, D., Howell, N. L., Rifai, H. S., and Koenig, L. (2010). Spatial and temporal variation of polychlorinated biphenyls in the Houston Ship Channel. Chemosphere 80, 100–112. doi: 10.1016/j.chemosphere.2010.04.014
Lenihan, H. S., and Peterson, C. H. (1998). How habitat degradation through fishery disturbance enhances impacts of hypoxia on oyster reefs. Ecol. Appl. 8, 128–140. doi: 10.1890/1051-0761(1998)008[0128:hhdtfd]2.0.co;2
Lester, L. J., and Gonzalez, L. A. (2011). State of the Bay: A Characterization of the Galveston bay Ecosystem Texas Commission on Environmental Quality, third Edn. Houston, TX: Galveston Bay Estuary Program.
McFarlin, C. R., Bishop, T. D., Hester, M. W., and Alber, M. (2015). Context-dependent effects of the loss of Spartina alterniflora on salt marsh invertebrate communities. Estuar. Coastal Shelf Sci. 163, 218–230. doi: 10.1016/j.ecss.2015.05.045
Milliner, C., Materna, K., Bürgmann, R., Fu, Y., Moore, A. W., Bekaert, D., et al. (2018). Tracking the weight of Hurricane Harvey’s stormwater using GPS data. Sci. Adv. 4:eaau2477. doi: 10.1126/sciadv.aau2477
Müller, H., and Schlegel, A. (1999). Responses of three freshwater planktonic ciliates with different feeding modes to cryptophyte and diatom prey. Aquat. Microb. Ecol. 17, 49–60. doi: 10.3354/ame017049
Oakley, J. W., and Guillen, G. J. (2019). Impact of hurricane harvey on galveston bay saltmarsh nekton communities. Estuar. Coasts 1–9. doi: 10.1007/s12237-019-00581-7
Örnólfsdóttir, E. B., Lumsden, S. E., and Pinckney, J. L. (2004). Nutrient pulsing as a regulator of phytoplankton abundance and community composition in Galveston Bay, Texas. J. Exp. Mar. Biol. Ecol. 303, 197–220. doi: 10.1016/j.jembe.2003.11.016
Paerl, H. W., Bales, J. D., Ausley, L. W., Buzzelli, C. P., Crowder, L. B., and Eby, L. A. (2001). Ecosystem impacts of three sequential hurricanes (Dennis, Floyd, and Irene) on the United States’ largest lagoonal estuary, Pamlico Sound, NC. Proc. Natl. Acad. Sci. U.S.A. 98, 5655–5660. doi: 10.1073/pnas.101097398
Paperno, R., Tremain, D. M., Adams, D. H., Sebastian, A. P., Sauer, J. T., and Dutka-Gianelli, J. (2006). The disruption and recovery of fish communities in the Indian River lagoon, Florida, following two hurricanes in 2004. Estuar. Coasts 29, 1004–1010. doi: 10.1007/bf02798662
Parada, A. E., Needham, D. M., and Fuhrman, J. A. (2016). Every base matters: assessing small subunit rRNA primers for marine microbiomes with mock communities, time series and global field samples: primers for marine microbiome studies. Environ. Microbiol. 18, 1403–1414. doi: 10.1111/1462-2920.13023
Peierls, B. L., Christian, R. R., and Paerl, H. W. (2003). Water quality and phytoplankton as indicators of hurricane impacts on a large estuarine ecosystem. Estuaries 26, 1329–1343. doi: 10.1007/BF02803635
Piehler, M. F., Twomey, L. J., Hall, N. S., and Paerl, H. W. (2004). Impacts of inorganic nutrient enrichment on phytoplankton community structure and function in Pamlico Sound, NC, USA. Estuar. Coastal Shelf Sci. 61, 197–209. doi: 10.1016/j.ecss.2004.05.001
Pinckney, J. L., Quigg, A. S., and Roelke, D. L. (2017). Interannual and seasonal patterns of estuarine phytoplankton diversity in Galveston Bay, Texas, USA. Estuar. Coasts 40, 310–316. doi: 10.1007/s12237-016-0135-8
Pinckney, J. L., Wee, J. L., Hou, A., and Walker, N. D. (2009). Phytoplankton community structure responses to urban effluent inputs following Hurricanes Katrina and Rita. Mar. Ecol. Prog. Ser. 387, 137–146. doi: 10.3354/meps08091
Posch, T., Eugster, B., Pomati, F., Pernthaler, J., Pitsch, G., and Eckert, E. M. (2015). Network of interactions between ciliates and phytoplankton during spring. Front. Microbiol. 6:1289.
Qian, Y., Wade, T. L., and Sericano, J. L. (2001). Sources and bioavailability of polynuclear aromatic hydrocarbons in Galveston Bay. Texas. Estuar. 24, 817–827.
Rashid, A. R., and Duffett, M. (2016). Medications for children: a survey of community pharmacists. J. Ped. Pharm. Therap. 21, 213–223. doi: 10.5863/1551-6776-21.3.213
Roach, R. W., Carr, R. S., Howard, C. L., and Cain, B. W. (1993). “An assessment of produced water impacts at two sites in the Galveston Bay system,” in Proceedings of the Galveston Bay Characterization Workshop; 1991 Feb 21-23, eds F. S. Shipley and R. W. Kiesling (Webster, TX: Galveston Bay National Estuary Program Publication GBNEP-6).
Roelke, D. L., Li, H. P., Hayden, N. J., Miller, C. J., Davis, S. E., Quigg, A., et al. (2013). Co-occurring and opposing freshwater inflow effects on phytoplankton biomass, productivity and community composition of Galveston Bay, USA. Mar. Ecol. Prog. Ser. 477, 61–76. doi: 10.3354/meps10182
Schloss, P. D., Westcott, S. L., Ryabin, T., Hall, J. R., Hartmann, M., and Hollister, E. B. (2009). Introducing mothur: open-source, platform-independent, community-supported software for describing and comparing microbial communities. Appl. Environ. Microbiol. 75, 7537–7541. doi: 10.1128/aem.01541-09
Steichen, J. L., and Quigg, A. (2018). Fish species as indicators of freshwater inflow within a subtropical estuary in the Gulf of Mexico. Ecol. Indicat. 85, 180–189. doi: 10.1016/j.ecolind.2017.10.018
Steichen, J. L., Windham, R., Brinkmeyer, R., and Quigg, A. (2012). Ecosystem under pressure: ballast water discharge into Galveston Bay, Texas (USA) from 2005 to 2010. Mar. poll. Bull. 64, 779–789. doi: 10.1016/j.marpolbul.2012.01.028
Suarez, M. P., Rifai, H. S., Palachek, R., Dean, K., and Koenig, L. (2006). Distribution of polychlorinated dibenzo-p-dioxins and dibenzofurans in suspended sediments, dissolved phase and bottom sediment in the Houston Ship Channel. Chemosphere 62, 417–429. doi: 10.1016/j.chemosphere.2005.04.088
Suttle, C. A., and Chan, A. M. (1994). Dynamics and distribution of cyanophages and their effect on marine Synechococcus spp. Appl. Environ. Microbiol. 60, 3167–3174. doi: 10.1128/aem.60.9.3167-3174.1994
Texas Water Development Board (2019). Water Data for Coastal Texas Database. Available online at: https://www.waterdatafortexas.org/coastal/hydrology/galveston
Thronson, A., and Quigg, A. (2008). Fifty-five years of fish kills in coastal Texas. Estuar. Coasts 31, 802–813. doi: 10.1007/s12237-008-9056-5
Thyng, K. M., Hetland, R. D., Socolofsky, S. A., Fernando, N., Turner, E. L., and Schoenbaechler, C. (2020). Hurricane Harvey caused unprecedented freshwater inflow to Galveston Bay. Estuar. Coasts (in review)Google Scholar
Tolan, J. M. (2013). “Estuarine fisheries community-level response to freshwater inflows,” in Water Resources Planning, Development and Management, ed. R. Wurbs (London: IntechOpen), doi: 10.5772/52313
Van Metre, P. C., Mahler, B. J., Scoggins, M., and Hamilton, P. A. (2006). Parking lot Sealcoat: A Major Source of Polycyclic Aromatic Hydrocarbons (PAHs) in Urban and Suburban Environments. Reston, VA: USGS.
van Oldenborgh, G. J., Van Der Wiel, K., Sebastian, A., Singh, R., Arrighi, J., Otto, F., et al. (2017). Attribution of extreme rainfall from Hurricane Harvey, August 2017. Environ. Res. Let. 12:124009. doi: 10.1088/1748-9326/aa9ef2
Wade, T. L., Sweet, S. T., Sericano, J. L., Guinasso, N. L. Jr., Diercks, A. R., and Highsmith, R. C. (2011). “Analyses of water samples from the Deepwater Horizon oil spill: documentation of the subsurface plume,” in Monitoring and Modeling the Deepwater Horizon Oil Spill: A Record-Breaking Enterprise, eds Y. Liu, A. Macfadyen, Z.-G. Ji, and R. H. Weisberg (Washington, DC: John Wiley & Sons), 77–82. doi: 10.1029/2011gm001103
Waide, R. B. (1991). Summary of the response of animal populations to hurricanes in the Caribbean. Biotropica 23, 508–512.
Walters, W., Hyde, E. R., Berg-Lyons, D., Ackermann, G., Humphrey, G., Parada, A., et al. (2016). Improved bacterial 16S rRNA gene (V4 and V4-5) and fungal internal transcribed spacer marker gene primers for microbial community surveys. Msystems 1:e00009-15.
Wetz, M. S., and Paerl, H. W. (2008). Estuarine phytoplankton responses to hurricanes and tropical storms with different characteristics (trajectory, rainfall, winds). Estuar. Coasts 31, 419–429. doi: 10.1007/s12237-008-9034-y
Willett, K. L., McDonald, S. J., Steinberg, M. A., Beatty, K. B., Kennicutt, M. C., and Safe, S. H. (1997). Biomarker sensitivity for polynuclear aromatic hydrocarbon contamination in two marine fish species collected in Galveston Bay, Texas. Environ. Toxicol. Chem. 16, 1472–1479. doi: 10.1002/etc.5620160721
Williams, A. K., Bacosa, H. P., and Quigg, Q. (2017). The impact of dissolved inorganic nitrogen and phosphorous on responses of microbial plankton to the Texas City “Y” Oil Spill in Galveston Bay, Texas (USA). Mar. Pollut. Bull. 121, 32–44. doi: 10.1016/j.marpolbul.2017.05.033
Wolf, S. (2017). Press Release Analysis: Nearly One Million Pounds of Seven Deadly Air Pollutants Released by Texas Refineries during Harvey Floods. Arizona: Center for Biological Diversity.
Xia, X., Vidyarathna, N. K., Palenik, B., Lee, P., and Liu, H. (2015). Comparison of the seasonal variations of Synechococcus assemblage structures in estuarine waters and coastal waters of Hong Kong. Appl. Environ. Microbiol. 81, 7644–7655. doi: 10.1128/aem.01895-15
Yan, G., Labonte, J., Quigg, A., and Kaiser, K. (this issue). Hurricanes accelerate carbon cycling in coastal ecosystems.
Yin, F., Hayworth, J. S., and Clement, T. P. (2015). A tale of two recent spills—comparison of 2014 Galveston Bay and 2010 Deepwater Horizon oil spill residues. PLoS ONE 10:e0118098. doi: 10.1371/journal.pone.0124645
Keywords: hurricane, microbes, 16S rRNA, 18S rRNA, organic pollutants, freshwater inflows, estuary, carbon
Citation: Steichen JL, Labonté JM, Windham R, Hala D, Kaiser K, Setta S, Faulkner PC, Bacosa H, Yan G, Kamalanathan M and Quigg A (2020) Microbial, Physical, and Chemical Changes in Galveston Bay Following an Extreme Flooding Event, Hurricane Harvey. Front. Mar. Sci. 7:186. doi: 10.3389/fmars.2020.00186
Received: 05 August 2019; Accepted: 10 March 2020;
Published: 22 April 2020.
Edited by:
Hans Paerl, The University of North Carolina at Chapel Hill, United StatesReviewed by:
Siddhartha Mitra, East Carolina University, United StatesNathan Samuel Hall, The University of North Carolina at Chapel Hill, United States
Copyright © 2020 Steichen, Labonté, Windham, Hala, Kaiser, Setta, Faulkner, Bacosa, Yan, Kamalanathan and Quigg. This is an open-access article distributed under the terms of the Creative Commons Attribution License (CC BY). The use, distribution or reproduction in other forums is permitted, provided the original author(s) and the copyright owner(s) are credited and that the original publication in this journal is cited, in accordance with accepted academic practice. No use, distribution or reproduction is permitted which does not comply with these terms.
*Correspondence: Jamie L. Steichen, jamie.steichen@tamu.edu