 Marcus O. Olatoye1
 Zhenbin Hu
 Peter O. Aikpokpodion
- 1Department of Crop Sciences, University of Illinois, Urbana-Champaign, IL, United States
- 2Department of Agronomy, Kansas State University, Manhattan, KS, United States
- 3Department of Genetics and Biotechnology, University of Calabar, Calabar, Nigeria
Genetic architecture reflects the pattern of effects and interaction of genes underlying phenotypic variation. Most mapping and breeding approaches generally consider the additive part of variation but offer limited knowledge on the benefits of epistasis which explains in part the variation observed in traits. In this study, the cowpea multiparent advanced generation inter-cross (MAGIC) population was used to characterize the epistatic genetic architecture of flowering time, maturity, and seed size. In addition, consideration for epistatic genetic architecture in genomic-enabled breeding (GEB) was investigated using parametric, semi-parametric, and non-parametric genomic selection (GS) models. Our results showed that large and moderate effect–sized two-way epistatic interactions underlie the traits examined. Flowering time QTL colocalized with cowpea putative orthologs of Arabidopsis thaliana and Glycine max genes like PHYTOCLOCK1 (PCL1 [Vigun11g157600]) and PHYTOCHROME A (PHY A [Vigun01g205500]). Flowering time adaptation to long and short photoperiod was found to be controlled by distinct and common main and epistatic loci. Parametric and semi-parametric GS models outperformed non-parametric GS model, while using known quantitative trait nucleotide(s) (QTNs) as fixed effects improved prediction accuracy when traits were controlled by large effect loci. In general, our study demonstrated that prior understanding of the genetic architecture of a trait can help make informed decisions in GEB.
Introduction
Asymmetric transgressive variation in quantitative traits is usually controlled by non-additive gene interaction known as epistasis (Rieseberg et al., 1999). Epistasis has been defined as the interaction of alleles at multiple loci (Mathew et al., 2018). The joint effect of alleles at these loci may be lower or higher than the total effects of the loci (Johnson, 2008). In selfing species, epistasis is common due to high level of homozygosity (Volis et al., 2010) and epistatic interactions have been found among loci underlying flowering time in barley (Mathew et al., 2018), rice (Chen et al., 2015; Chen et al., 2018b), and sorghum (Li et al., 2018a). Although, theoretical models and empirical studies involving simulations have suggested the significant role for epistasis in breeding (Melchinger et al., 2007; Volis et al., 2010; Messina et al., 2011; Howard et al., 2014), empirical evidence from practical breeding are limited. In addition, most of the current statistical models cannot efficiently characterize or account for epistasis (Mackay, 2001; Moore and Williams, 2009; Sun et al., 2012; Mathew et al., 2018). Common quantitative traits mapping approaches are often single-locus analysis techniques. These techniques focus on the additive contribution of genomic loci (Barton and Keightley, 2002), which only explains a fraction of the genetic variation which can lead to missing heritability.
Regardless of the limitations of genomic mapping approaches, characterization of the genetic basis of complex agronomic traits has been beneficial for breeding purposes. For example, markers tagging quantitative trait loci (QTL) have been used in marker-assisted selection (MAS) in breeding programs (Zhang et al., 2003; Pan et al., 2006; Saghai Maroof et al., 2008; Foolad and Panthee, 2012; Massman et al., 2013; Mohamed et al., 2014; Zhao et al., 2014). However, the efficiency of QTL-based MAS approach in breeding is limited. First, the small sample size of bi-parental populations where QTL is detected often results in overestimation of the respective QTL effect sizes, a phenomenon known as Beavis effect (Utz et al., 2000; Xu, 2003; King and Long, 2017). Second, linkage mapping is limited in power to detect small effect loci; thus, only the available large effect loci are used for MAS (Ben-Ari and Lavi, 2012). Third, genetic diversity is limited to the two parents forming the bi-parental population; thus, QTL may not reflect the entire variation responsible for the trait and may not be transferable to other genetic backgrounds (Xu et al., 2017). Multi-parental populations as nested association mapping (NAM) and multiple advanced generation intercross (MAGIC) offer increased power, resolution, reliable estimate of QTL effects, and increased diversity than bi-parentals. Additionally, the MAGIC mapping population presents greater genetic diversity than bi-parentals to identify higher-order epistatic interactions (Mathew et al., 2018).
Notably, MAS is more efficient with traits controlled by few genomic loci than polygenic traits (Bernardo, 2008). In contrast, genomic selection (GS) that employs genome wide markers has been found to be more suited for complex traits, and also having higher response to selection than MAS (Bernardo and Yu, 2007; Wong and Bernardo, 2008; Cerrudo et al., 2018). In GS, a set of genotyped and phenotyped individuals are first used to train a model that estimates the genomic estimated breeding values (GEBVs) of un-phenotyped but genotyped individuals (Jannink et al., 2010). GS models often vary in performance with the genetic architecture of traits. Parametric GS models are known to capture additive genetic effects but are not efficient with epistatic effects due to the computational burden of high-order interactions (Moore and Williams, 2009; Howard et al., 2014). Parametric GS models with incorporated kernels (marker based relationship matrix) for epistasis have recently been developed (Covarrubias-Pazaran, 2016). Semi-parametric and non-parametric GS models capturing epistatic interactions have been developed and implemented in plant breeding (Gianola et al., 2006; Gianola and de los Campos, 2008; De Los Campos et al., 2010). Semi-parametric models as reproducing Kernel Hilbert space (RKHS) reduces parametric space dimensions to efficiently capture epistatic interactions among markers (Jiang and Reif, 2015; de Oliveira Couto et al., 2017). Using simulated data, Howard et al. (2014) showed that semi-parametric and non-parametric GS models can improve prediction accuracies under epistatic genetic architectures. In summary, different models may fit different genetic architectures. In general, GS has been widely studied and applied to major crop species including both cereals and legumes while its applications in orphan crop species has gained increased attention in recent times.
Cowpea (Vigna unguiculata L. Walp) is a widely adapted warm-season orphan herbaceous leguminous annual crop and an important source of protein in developing countries (Muchero et al., 2009; Varshney et al., 2012; Boukar et al., 2018; Huynh et al., 2018). Due to its flexibility as a “hungry season crop” (Langyintuo et al., 2003), cowpea is part of the rural families’ coping strategies to mitigate the effect of changing climatic conditions. Cowpea’s nitrogen fixing and drought tolerance capabilities make it a valuable crop for low-input and smallholder farming systems (Hall et al., 2003; Boukar et al., 2018). Breeding efforts using classical approaches have been made to improve cowpea’s tolerance to both biotic (disease and pest) and abiotic (drought and heat) stressors (Hall et al., 2003; Hall, 2004). Advances in applications of next-generation sequencing (NGS) and development of genomic resources (consensus map, draft genome, and multi-parent population) in cowpea have provided the opportunity for the exploration for GEB (Muchero et al., 2009; Boukar et al., 2018; Huynh et al., 2018). MAS and GS have improved genetic gain in soybean (Glycine max) (Jarquin et al., 2016; Kurek, 2018; Matei et al., 2018), common bean (Phaseolus vulgaris) (Schneider et al., 1997; Yu et al., 2000; Wen et al., 2019), chickpea (Roorkiwal et al., 2016; Li et al., 2018b), pigeonpea (Varshney et al., 2010; Pazhamala et al., 2015), and lentil (Haile et al., 2019). However, cowpea still lags behind major legumes in the area of GEB applications. GEB has the potential to expedite cowpea breeding to ensure food security in developing countries where national breeding programs still depend on labor-intensive and time-consuming classical breeding approaches.
In this study, we used the cowpea MAGIC population to first characterize the genetic architecture (main effect and epistatic effect loci) of flowering time, maturity, and seed size, and second, to evaluate considerations for genetic architecture in genomic-enabled breeding using parametric, semi-parametric, and non-parametric GS models and MAS. Our results showed that flowering time and maturity under short day are both controlled by moderate effect loci, while flowering time under long day and seed size are controlled by large and moderate effect loci. Also, accounting for large effect loci as fixed effects in parametric GS model improved prediction accuracy.
Experimental Procedures
Plant Genetic Resource and Phenotypic Evaluation
This study was performed using publicly available cowpea MAGIC population’s phenotypic and genotypic data (Huynh et al., 2018). The MAGIC population was derived from an intercross between eight founders. The F1s were derived from eight-way intercross between the founders and were subsequently selfed through single-seed descent for eight generations. The F8 RILs were later genotyped with 51,128 SNPs using the Illumina Cowpea Consortium Array. A core set of 305 MAGIC RILs were selected and phenotyped (Huynh et al., 2018). The RILs were evaluated under two irrigation regimes.
In this study, the flowering time (FLT), maturity (MAT), and seed size (SS) data were analyzed for environment-by-environment correlations and best linear unbiased predictions (BLUPs). The traits analyzed in this study are: FTFILD (FLT under full irrigation and long day), FTRILD (FLT under restricted irrigation and long day), FTFISD (FLT under full irrigation and short day), FTRISD (FLT under restricted irrigation and short day), FLT_BLUP (BLUP of FLT across environments), MFISD (MAT under full irrigation and short day), MRISD (MAT under restricted irrigation and short day), MAT_BLUP (BLUP of MAT across environments), SSFISD (SS under full irrigation and short day), SSRISD (SS under restricted irrigation and short day), and SS_BLUP(BLUP of SS across environments). In addition, using both genomic and phenotypic data, narrow sense heritability was estimated using rrBLUP package in R (Endelman, 2011).
QTL and Epistasis Mapping
QTL mapping was performed for all traits using the stepwise regression model implemented in TASSEL 5.0 standalone version (Bradbury et al., 2007). The approach implements both forward inclusion and backward elimination steps. The model accounts for major effect loci and reduces collinearity among markers. The model was designed for multi-parental populations, and no family term was used in the model since MAGIC population development involved several steps of intercross that reshuffles the genome and minimizes phenotype-genotype covariance. A total of 32,130 SNPs across 305 RILs were used in the analysis. A permutation of 1,000 was used in the analysis.
To characterize the epistatic genetic architecture underlying FLT, MAT, and SS, the Stepwise Procedure for constructing an Additive and Epistatic Multi-Locus model (SPAEML; Chen et al., 2018a) epistasis pipeline implemented in TASSEL 5.0 was used to perform epistasis mapping for phenotypic traits (FTFILD, FTRILD, FTFISD, FTRISD, FT_BLUP, MFISD, MRISD, MT_BLUP, SSFISD, SSRISD, and SS_BLUP). One critical advantage of SPAEML that led to its consideration for this study is its ability to correctly distinguish between additive and epistatic loci. SPAEML source code is available at https://bitbucket.org/wdmetcalf/tassel-5-threaded-model-fitter. The minor allele frequency of each marker was estimated using a custom R script from http://evachan.org/rscripts.html. The additive effect of the marker was estimated as the difference between the mean phenotypic value of two homozygous classes of the alleles of a marker divided by two. The proportion of phenotypic variation explained (PVE) by each marker was estimated by multiplying the R2 obtained from fitting a regression between the marker and the trait of interest by 100. The regression model for estimating PVE is:
where yij is the phenotype, μ is the overall mean, γi is the term for associated marker/SNP, and εij is the residual term. This was implemented using the lm function in R.
A set of a priori genes (n = 100; Data S1) was put together from Arabidopsis thaliana and G. max FLT and SS genes obtained from literature and https://www.mpipz.mpg.de/14637/Arabidopsis_flowering_genes. The cowpea orthologs of these genes were obtained by blasting the A. thaliana and G. max sequence of the a priori genes on the new Vigna genome assembly v.1 on Phytozome (Goodstein et al., 2012). The corresponding cowpea gene with the highest score was selected as a putative ortholog. Colocalizations between the cowpea putative orthologs and associated markers were identified using a custom R script. Only significant marker and a priori genes at the same genetic position were reported.
Marker-Assisted Selection Pipeline
In order to evaluate the performance of MAS in cowpea, a custom pipeline was developed in R. Using subbagging approach, 80% of the 305 RILs randomly sampled without replacement was used as the training population, followed by performing a multi-locus GWAS (multi-locus mixed model, MLMM) (Segura et al., 2012) on both genomic and phenotypic data of the training population. The MLMM approach implements stepwise regression involving both forward and backward regressions. This model accounts for major effect loci and reduces the effect of allelic heterogeneity. A K-only model that accounts for a random polygenic term (kinship relationship matrix) was used in the MLMM model. No term for population structure was used in the model since MAGIC population development involved several steps of intercross that reshuffles the genome and minimizes phenotype-genotype covariance. A total of 32,130 SNPs across 305 RILs were used in the GWAS analysis and coded as −1 and 1 for homozygous markers/SNPs and 0 for heterozygous SNPs. Bonferroni correction with α = 0.05 was used to determine the cut-off threshold for each trait association (α/total number of markers = 1.6 e-06).
where y is the vector of phenotypic data, β is a vector of fixed effects other than SNPs, ∝ is the vector of SNP effects, u is a vector of polygenic background effects, and e is the vector of residual effects. X, S, and Z are incident matrices of 1s and 0s relating y to β, ∝, and u (Yu et al., 2006).
Afterwards, the top three most significant associations were then selected from the genomic data of the training population to train a regression model by fitting the SNPs as predictors in a regression model with the phenotypic information as the response variable. This training model was later used alongside the predict function in R to predict the phenotypic information of the validation population (20% that remained after sub-setting the training population). The prediction accuracy of MAS was obtained as the correlation between this predicted phenotypic information and the observed phenotypic information for the validation data.
Genomic Selection Pipeline
In order to evaluate the performance of using known marker/SNP as fixed effects in GS models and to compare the performance of parametric, semi-parametric, and non-parametric GS models, a custom GS pipeline was developed in R. The GS pipeline was made up of four GS models, which were named as FxRRBLUP (ridge regression BLUP where markers were fitted as both fixed and random effects; parametric), RRBLUP (RRBLUP where markers were only fitted as random effects; parametric), reproducing Kernel Hilbert space (RKHS; semi-parametric), and support vector regression (SVR; non-parametric). First, using subagging approach, 80% of the RILs were randomly sampled without replacement (training population) followed by running MLMM GWAS and selecting the three most significant associations, which were used as fixed effects in the FxRRBLUP. These three SNPs were removed from the rest of SNPs that were fitted as random effects in the FxRRBLUP model. Using a high number of SNPs as fixed effects have been found to increase bias (Rice and Lipka, 2019), as a result, three QTNs were fitted as fixed effects. The RRBLUP, RKHS, and SVR models were fitted simultaneously in the same cycle as FxRRBLUP to ensure unbiased comparison of GS models. Likewise, in order to ensure unbiased comparison between GS and MAS approaches, similar seed numbers were used for the subagging sampling of training populations across 100 cycles for GS and MAS. The validation set was composed of the remaining 20% of the RILs after sampling the 80% (training set). Prediction accuracy in GS was estimated as the Pearson correlation between measured phenotype and GEBVs of the validation population. Also, for FLT, each environment was used as a training population to predict the other three environments.
Ridge Regression BLUP (RRBLUP)
The two RRBLUP models (with and without fixed-effect term) can be described as;
where y is the vector (n x 1) of observations (phenotypic data), μ is the vector of the general mean, q is the number of selected significant associated markers (q = 3), Xk is the kth column of the design matrix X, α is the fixed additive effect associated with markers k … q, u random effects term, with E(um) = 0, (variance of marker effect), p is the marker number (p > n), Zm is the mth column of the design matrix Z, and u is the vector of random marker effects associated with markers m … p. In the model, u random effects term, with E(um) = 0, (variance of marker effect), Var(e) = σ2 (residual variance), Cov(u, e) = 0, and the ridge parameter λ equals (Meuwissen et al., 2001; Endelman, 2011; Howard et al., 2014). In this study, RRBLUP with and without fixed effects were implemented using the mixed.solve function in rrBLUP R package (Endelman, 2011).
Reproducing Kernel Hilbert Space (RKHS)
Semi-parametric models are known to capture interactions among loci. The semi-parametric GS approach used in this study was implemented as Bayesian RKHS in BLGR package in R (Perez, 2014), and described as follows:
where y is the vector of phenotype, 1 is a vector of 1’s, μ is the mean, u is vector of random effects ∼MVN (0, ), and ε is the random residual vector ∼ MVN (0, I). In Bayesian RKHS, the priors p(ㅰμ, u, ε) are proportional to the product of density functions MVN (0, ) and MVN (0, I). The kernel entries matrix (Kh) with a Gaussian kernel uses the squared Euclidean distance between marker genotypes to estimate the degree of relatedness between individuals, and a smoothing parameter (h) multiplies each entry in Kh by a constant. In the implementation of RKHS, a default smoothing parameter h of 0.5 was used alongside 1,000 burns and 2,500 iterations.
Support Vector Regression (SVR)
Support vector regression method (Vapnik, 1995; Maenhout et al., 2007; Long et al., 2011) was used to implement non-parametric GS approach in this study. The aim of the SVR method is to minimize prediction error by implementing models that minimizes large residuals (Long et al., 2011). Thus, it is also referred to as the “ε-intensive” method. It was implemented in this study using the normal radial function kernel (rbfdot) in the ksvm function of kernlab R package (Karatzoglou et al., 2004).
Parameters Evaluated in GS and MAS
Additional parameters were estimated to further evaluate the performance of GS and MAS models. A regression model was fitted between observed phenotypic information and GEBV of the validation set to obtain both intercept and slope for both GS and MAS in each cycle of prediction. The estimates of the intercept and slope of the regression of the observed phenotypic information on GEBVs are valuable since their deviations from expected values can provide insight into deficiencies in the GS and MAS models (Daetwyler et al., 2013). The bias estimate (slope and intercept) signifies how the range of values in measured and predicted traits differ from each other. In addition, the coincidence index between the observed and GEBVs for both GS and MAS models was evaluated. The coincidence index (Fernandes et al., 2018) evaluates the proportion of individuals with highest trait values (20%) that overlapped between the measured phenotypes and predicted phenotypic trait values for the validation population.
Results
Phenotypic and Genotypic Variation in Cowpea
Results showed variation between number of days to 50% flowering under long-day photoperiod and short-day photoperiod. Days to FLT were higher for RILs under long day than short day (Figure 1). Results showed positive high correlations between environments for each trait (Tables S1 and S2). Furthermore, genomic heritability were moderate for the traits ranging between 0.41 under long-day photoperiod to 0.48 for FLT under short-day photoperiod, 0.21 under restricted irrigation to 0.30 under full irrigation for MAT, and 0.39 under restricted irrigation to 0.47 under full irrigation for SS (Tables S1 and S2).
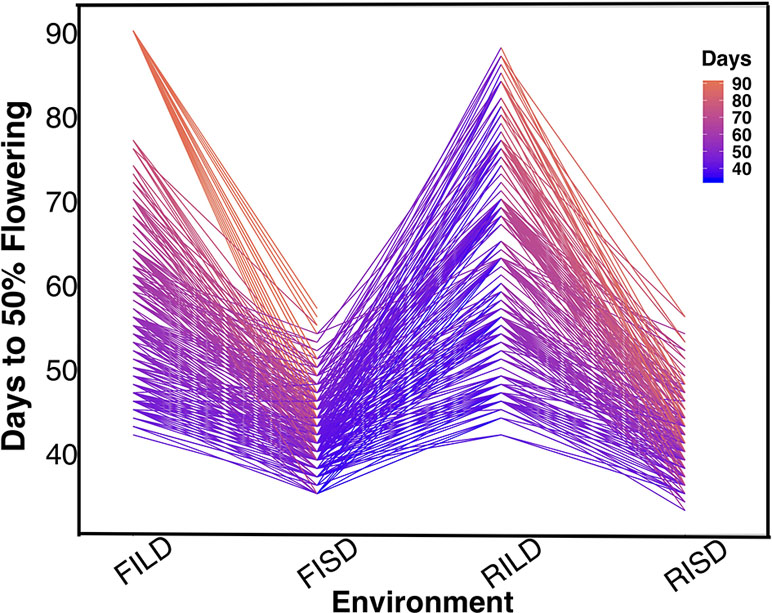
Figure 1 The reaction norm plot for flowering time variation under long-day and short-day periods. Evaluation environments are represented on the x-axis (full irrigation and long day [FILD], full irrigation and short day [FISD], restricted irrigation and long day [RILD], and restricted irrigation and short day [RISD]). The number of days to 50% flowering is represented on the y-axis.
Genetic Architecture of Traits
Main Effect QTL
The cowpea multi-parental advanced generation intercross (MAGIC) population facilitated the characterization of the genetic architecture of FLT, MAT, and SS. In this study, QTL associated with FLT, MAT, and SS were identified using stepwise regression analysis (Table S3, Data S2). Results showed that 32 QTL (22 unique) in total were associated with FLT traits (FT_BLUP [eight QTLs, explaining 73.2% of phenotypic variation (PV)], FTFILD [five QTL, explaining 66.2% of PV], FTRILD [five QTL explaining 48.6% of PV], FTFISD [eight QTL explaining 52.1% of PV], and FTRISD [six QTL explaining 43.9% of PV]). Each of the total QTL associated with FLT traits explained between 2 and 28% of the phenotypic variation. QTL qVu9:23.36, qVu9:24.77, and qVu9:22.65 (MAF = 0.29, 0.28, and 0.49) explained the largest proportion of variation (28%, 24%, and 19%) with additive effects of 7, 7, and 6 days, respectively. The minor allele frequency (MAF) of the FLT QTL ranges from 0.13 to 0.50. For MAT traits, 13 QTL (11 unique QTL) in total were identified with five QTL (explaining 35.9% of PV) for MAT_BLUP, four QTL (explaining 24.5% of PV) for MFISD, and four QTL (explaining 27.9% of PV) for MRISD. All MAT trait QTL explained between 4.5 to 10% of phenotypic variation and MAF ranges from 0.15 to 0.49.
Furthermore, for SS traits, 10 QTL (seven unique QTL) in total were identified with three QTL (explaining 39.3% of PV) for SS_BLUP, three QTL (explaining 41% of PV) for SSFISD, and four QTL (explaining 39.4% of PV) for SSRISD. QTL qVu8:74.21, qVu8:74.29, and qVu8:76.81 associated with SSFISD, SS_BLUP, and SSRISD explained the largest PV (29%, 25%, and 20%). All SS trait QTL explained between 3 and 29% of PV and with MAF range between 0.21 and 0.49. A pleiotropic QTL qVu8:74.21 (MAF = 0.24) was associated with both MRISD and SSRISD (explained 5% and 29% of PV, respectively). In summary, QTL effects range from small to large for all traits in this study (Figure 2).
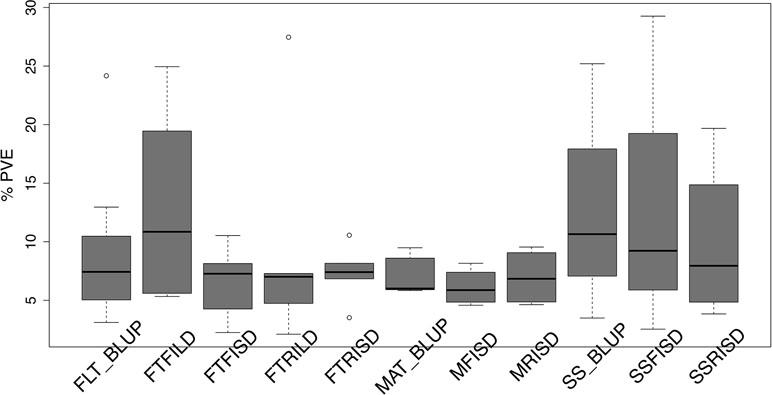
Figure 2 Distribution of effect size of quantitative traits loci (QTL) associated with traits in the cowpea MAGIC population. Box plots of the distribution of proportion of variation explained (PVE) by quantitative traits loci (QTL) associated with best linear unbiased predictions (BLUP) of flowering time across environments (FLT_BLUP), flowering time under full irrigation and long day (FTFILD), flowering time under restricted irrigation and long day (FTRILD), flowering time under full irrigation and short day (FTFISD), flowering time under restricted irrigation and short day (FTRISD), BLUP of maturity across environments (MAT_BLUP) maturity under full irrigation and short day (MFISD), maturity under restricted irrigation and short day (MRISD), BLUP of seed size across environments (SS_BLUP) seed size under full irrigation and short day (SSFISD), and seed size under restricted irrigation and short day (SSRISD).
Two-Way Epistatic Interaction QTL
Currently, there is limited knowledge about what role epistasis plays in phenotypic variation in cowpea. Our results identified epistatic loci underlying FLT, MAT, and SS (Table S4, Data S3). For FLT traits, there were 42 two-way epistatic interactions at 84 epistatic loci (only 65 loci were unique). Among these are; 20 epistatic loci for FLT_BLUP, 18 epistatic or FTFILD, 12 epistatic loci for FTRILD, 14 epistatic loci for FTFISD, and 20 epistatic loci for FTRISD. Some large effect loci were involved in epistatic interactions in FLT; examples include, QTL qVu9:25.39 (MAF = 0.28, FT_BLUP PVE = 23.5%, FTFILD PVE = 24.5%, FTRILD PVE = 26%) and QTL qVu9:3.46 (MAF = 0.35, FLT_BLUP PVE = 13.5%, FTRILD PVE = 14.1%). For MAT, there were 17 pairwise epistatic interactions across 34 loci (of which 30 were unique). Among the MAT QTL, qVu9:8.37 had the largest effect explaining ∼9% of the phenotypic variation. One epistatic interaction overlapped with both FTRISD, MRISD, and MT_BLUP (qVu2:48.05+ qVu9:8.37, MAF = 0.30, and 0.39, respectively). For SS, there were 13 interactions at 26 loci (19 were unique). Only one QTL (qVu8:74.29, MAF = 0.25) had interactions with multiple QTL. The largest effect epistatic QTL associated with the three SS traits (SS_BLUP, SSFISD, and SSRISD) is qVu8:74.29 (MAF0.25). Some QTL were found to overlap among main effect QTL and epistatic effect QTL for FLT (nine QTL), MAT (three QTL), and SS (three QTL) (Figure S1).
Main Effect and Epistatic QTL Colocalized with A priori Genes
Gene functions can be conserved across species (Huang et al., 2017). In this study, a set of a priori genes was compiled from both A. thaliana and G. max. Both main effect QTL and epistatic QTL colocalized with putative cowpea orthologs of A. thaliana and G. max FLT and SS genes (Figures 3–6, Figures S2–S11, Data S4) at the same genetic position. However, two genes (TOE2 and AHK2) did not colocalize with the QTL at the same genetic position but were reported due to their proximity and biological relevance. A putative cowpea ortholog (Vigun09g050600) of A. thaliana circadian clock gene phytochrome E (PHYE; AT4G18130) (Aukerman and Sakai, 2003) colocalized with FTFILD QTL (qVu9:22.65; PVE = 19.5%; main effect QTL) at the same genetic position. Also, a putative cowpea ortholog (Vigun07g241700) of A. thaliana circadian clock gene TIME FOR COFFEE (TIC; AT3G22380) (Hall et al., 2003) colocalized at the same genetic position with FTFISD QTL (qVu7:86.92; PVE = 2.6%; main effect QTL). The cowpea FLT gene (VuFT; Vigun06g014600; CowpeaMine v.06) colocalized with an epistatic QTL (qVu6:0.68; PVE = 3.5%) associated with FLT_BLUP and FTRILD at the same genetic position. The cowpea ortholog (Vigun11g157600) of A. thaliana circadian clock gene PHYTOCLOCK1 (PCL1; AT3G46640) (Hazen et al., 2005) colocalized with an epistatic QTL (qVu11:50.94; PVE = 8–10%) associated with both FTFILD and FTRILD at the same genetic position.
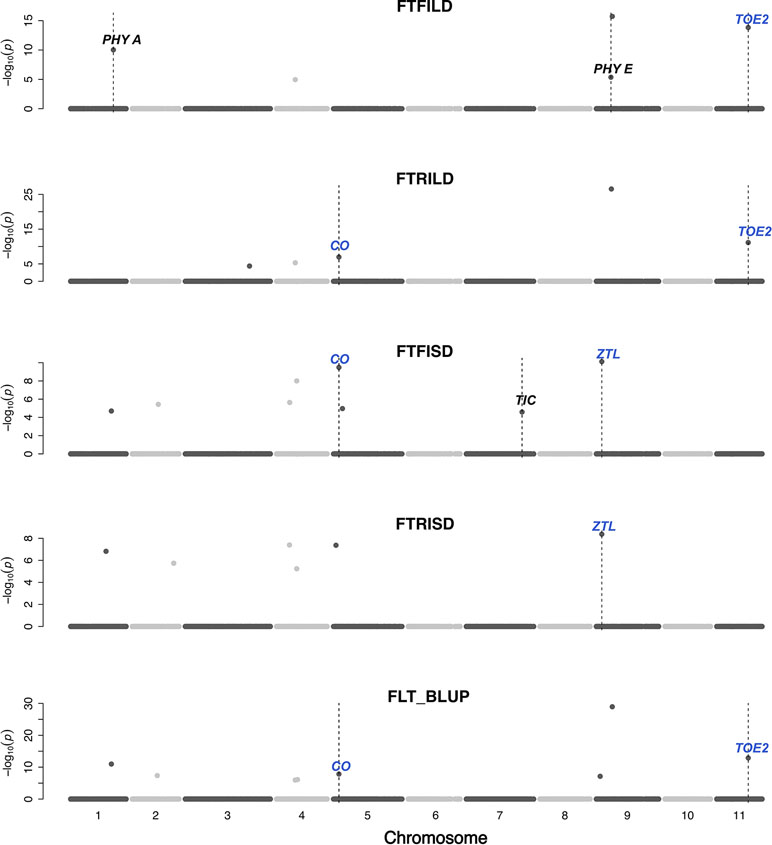
Figure 3 Main QTL plot for flowering time traits in the cowpea MAGIC population. QTL plots for flowering time under full irrigation and long day (FTFILD), flowering time under restricted irrigation and long day (FTRILD), flowering time under full irrigation and short day (FTFISD), flowering time under restricted irrigation and short day (FTRISD), and BLUPs of environments (FLT_BLUP). The chromosome numbers are located on the x-axis and the negative log of the P-values on the y-axis. The genetic position of the colocalization between QTL and a priori genes are indicated by broken vertical lines. The texts displayed on the vertical broken lines are the names of a priori genes (blue for genes associated with multiple environments or traits, and black for genes associated with single environments or trait).
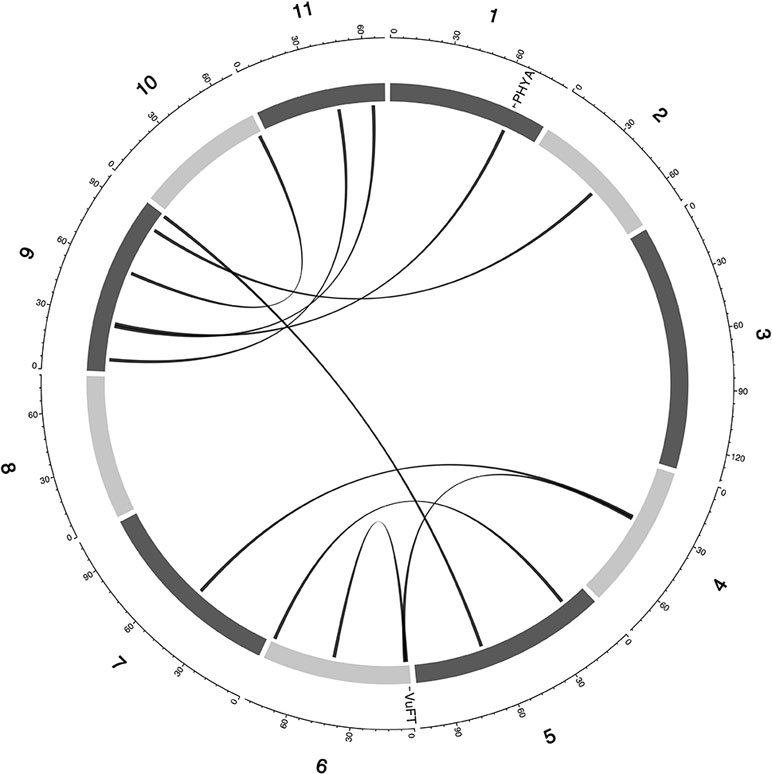
Figure 4 Epistatic QTL for FLT_BLUP for MAGIC population. Chromosomes are shown in shades of gray, two-way interacting loci are connected with black solid lines, and colocalized a priori genes are texts between chromosomes and genetic map.
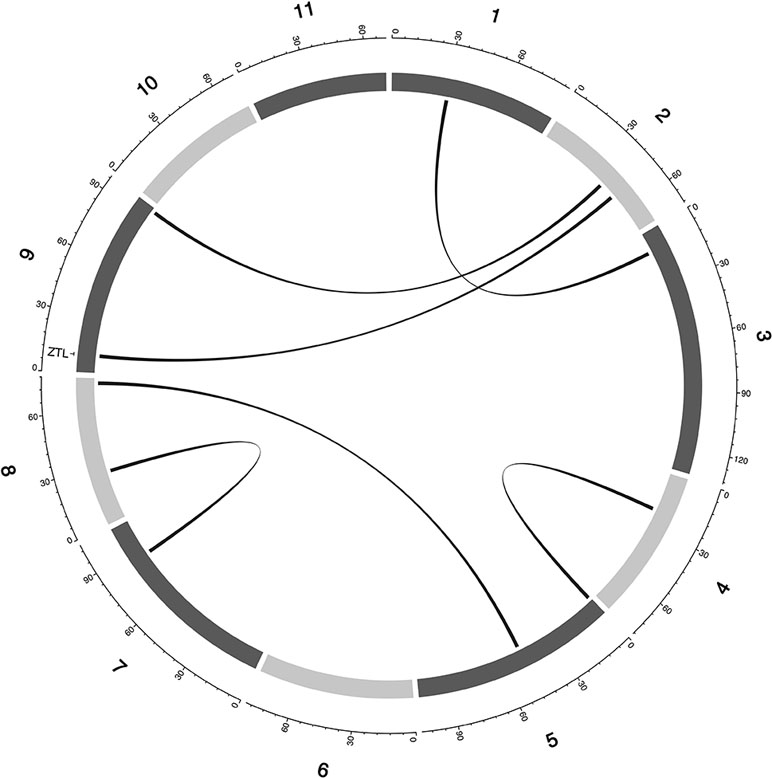
Figure 5 Epistatic QTL for MAT_BLUP in MAGIC population. Chromosomes are shown in shades of gray, two-way interacting loci are connected with black solid lines, and colocalized a priori genes are texts between chromosomes and genetic map.
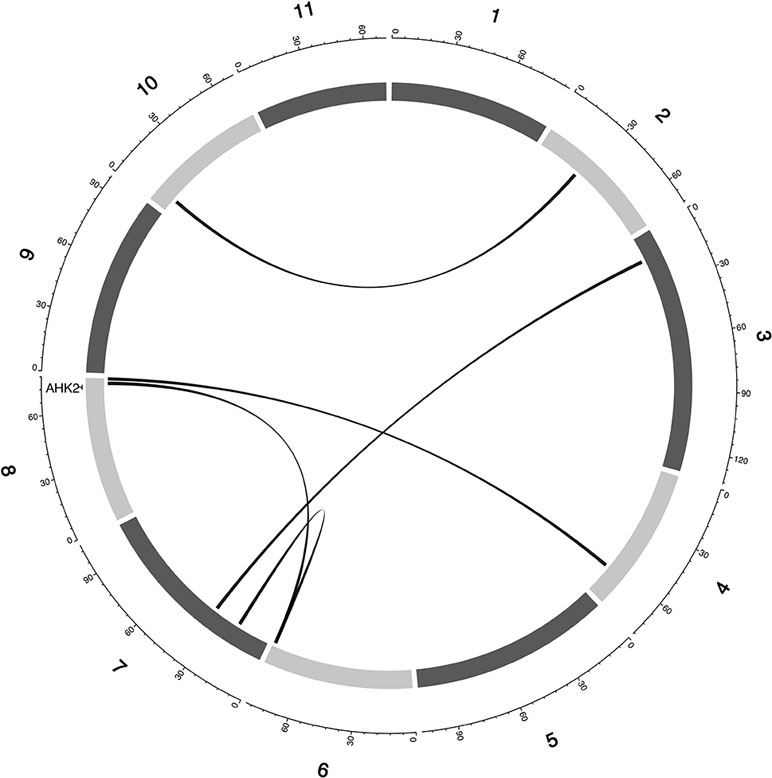
Figure 6 Epistatic QTL for MAT_BLUP in MAGIC population. Chromosomes are shown in shades of gray, two-way interacting loci are connected with black solid lines, and colocalized a priori genes are texts between chromosomes and genetic map.
A putative cowpea ortholog (Vigun11g148700) of A. thaliana photoperiod gene TARGET OF EAT2 (TOE2; AT5G60120) (Mathieu et al., 2009) was found at a proximity of 0.6cM from a QTL (qVu11:49.06; PVE = 7–11%; main effect QTL) associated with FTFILD, FTRILD, and FLT_BLUP. Some of the a priori genes colocalized with some QTL that are both main effect and epistatic QTL. For instance, the cowpea ortholog (Vigun01g205500) of G. max FLT gene phytochrome A (PHYA; Glyma19g41210) (Tardivel et al., 2014) colocalized with a FTFILD QTL (qVu1:66.57; PVE = 5.3%; both main effect and epistatic QTL) at the same genetic position (Data S4). Lastly, a putative cowpea ortholog (Vigun08g217000) of A. thaliana histidine kinase2 gene (AHK2; AT5G35750) (Orozco-Arroyo et al., 2015) was found at a proximity of about 1–2cM from three QTL (qVu8:74.29, qVu8:74.21, qVu8:76.81; PVE = 25%, 29.3%, and 20%, respectively; main effect and epistatic QTL) associated with SS traits SS_BLUP, SSFISD, and SSRISD). In addition, some a priori genes were associated with multiple traits. The putative cowpea ortholog (Vigun05g024400) of A. thaliana circadian clock gene CONSTANS (CO; AT5G15840) (Wenkel et al., 2006) colocalized at the same genetic position with a QTL (qVu5:8.5; PVE = 6–8%; both main effect and epistatic QTL) associated with FLT and MAT traits (FLT_BLUP, FTFISD, FTRILD, FTRISD, MAT_BLUP, and MFISD). The putative cowpea ortholog (Vigun09g025800) of A. thaliana circadian clock gene ZEITLUPE (ZTL; AT5G57360) (Somers et al., 2000) colocalized at the same genetic position with a QTL (qVu9:8.37; PVE = 9–11%; both main effect and epistatic QTL) associated with FLT and MAT traits (FTFISD, FTRISD, and MRISD).
GS and MAS for Flowering Time
Prior knowledge about the genetic architecture of a trait can help make informed decisions in breeding. Comparing the performance of GS and MAS models for FLT within each daylength results showed that, under long day length (FTFILD and FTRILD), FxRRBLUP (mean prediction accuracy [mPA] = 0.68, 0.68; mean coincidence index [mCI] = 0.49, 0.40) and MAS (mPA = 0.64, 0.61; mCI = 0.45, 0.37) outperformed RRBLUP (mPA = 0.55, 0.58; mCI = 0.37, 0.35), RKHS (mPA = 0.55, 0.58; mCI = 0.37, 0.36), and SVR (mPA = 0.54, 0.50; mCI = 0.35, 0.28) (Figures 7 and 8, Tables S3 and 4). For FLT under long day, coincidence index values were higher under full irrigation than under restricted irrigation. For FLT under short day (FTFISD and FTRISD), all GS models outperformed MAS (mPA = 0.33, 0.25; mCI = 0.30, 0.26). Among the GS models, RKHS and RRBLUP had the highest prediction accuracies. However, the coincidence index of FxRRBLUP was higher than the rest of the GS models for FTRISD. In general, the mean of the slope and intercept for the GS models except SVR were usually close to the expected (1 and 0) (Figures S12–S13). MAS also deviated away from the expected slope and intercept (1 and 0) more than the FxRRBLUP, RKHS, and RRBLUP for FTRISD (Figures S12–S13). To evaluate the effect of photoperiod and irrigation regime on the performance of training population, each environment (day length and irrigation regime combination) was used as a training population to predict the rest in a di-allele manner. Results showed that prediction accuracy between environments in the same photoperiod was higher than environments in different photoperiod (Figure S14). Also, when training populations were under full irrigation, their prediction accuracies were higher than when training populations were under restricted irrigation (Figure S14). For FT_BLUP, GS models outperformed MAS except SVR which had the same mPA (0.59) as MAS while FxRRBLUP had the highest mPA and mCI among the GS models (Figures S15 and 16). Overall, Table S7 showed that FxRRBLUP had the best performance in six out of the eight traits by environment combination.
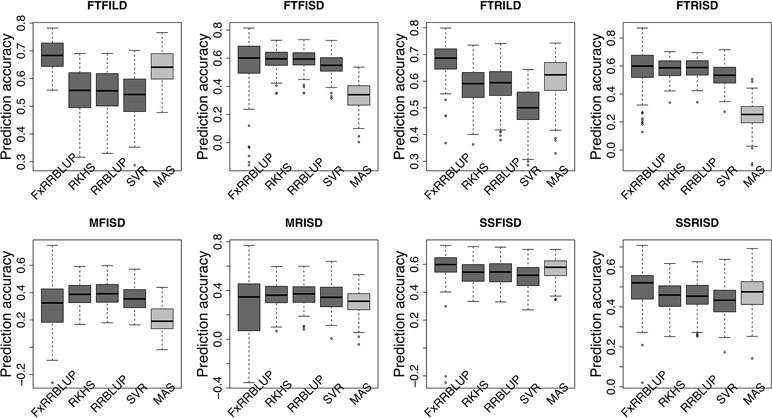
Figure 7 Comparison of prediction accuracy across GS and MAS models. Boxplots in each panel showed the distribution of prediction accuracy values across 100 cycles for FxRRBLUP (ridge regression best linear unbiased prediction: parametric model with fixed effects), RKHS (reproducing Kernel Hilbert space; semi-parametric model), RRBLUP (ridge regression best linear unbiased prediction: parametric model with no fixed effects), SVR (support vector regression: non-parametric model), and MAS (marker-assisted selection) for flowering time under full irrigation and long day (FTFILD), flowering time under restricted irrigation and long day (FTRILD), flowering time under full irrigation and short day (FTFISD), flowering time under restricted irrigation and short day (FTRISD), maturity under full irrigation and short day (MFISD), maturity under restricted irrigation and short day (MRISD), seed size under full irrigation and short day (SSFISD), and seed size under restricted irrigation and short day (SSRISD).
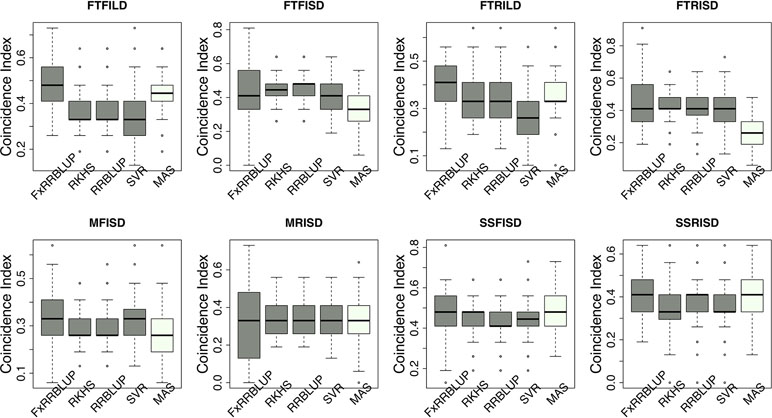
Figure 8 Comparison of coincidence index across GS and MAS models. Boxplots in each panel showed the distribution of coincidence index values across 100 cycles for FxRRBLUP (ridge regression best linear unbiased prediction: parametric model with fixed effects), RKHS (reproducing Kernel Hilbert space; semi-parametric model), RRBLUP (ridge regression best linear unbiased prediction: parametric model with no fixed effects), SVR (support vector regression: non-parametric model), and MAS (marker-assisted selection) for flowering time under full irrigation and long day (FTFILD), flowering time under restricted irrigation and long day (FTRILD), flowering time under full irrigation and short day (FTFISD), flowering time under restricted irrigation and short day (FTRISD), maturity under full irrigation and short day (MFISD), maturity under restricted irrigation and short day (MRISD), seed size under full irrigation and short day (SSFISD), and seed size under restricted irrigation and short day (SSRISD).
GS and MAS for Maturity and Seed Size
For MAT (MT_BLUP, MFISD, and MRISD), RKHS and RRBLUP had better performance (Figures 7 and 8; Tables S4 and S5) than the rest of the models including MAS. All models deviated from the expected slope and intercept estimates, but RRBLUP had the least deviation for MRISD. For SS, FxRRBLUP had the best performance followed by MAS compared to the rest of the GS models (RKHS, RRBLUP, and SVR) (Figures 7 and 8; Tables S5 and S6). GS and MAS models had varying levels of deviation from the expected estimates of slope and intercept. RKHS and RRBLUP were closer to the expected than FxRRBLUP and MAS (Figures S12–S13) while SVR had the highest deviation.
Discussion
Epistasis Plays Important Roles in Determining the Genetic Architecture of Agronomic Traits in Cowpea
Multi-parental populations have demonstrated ability to facilitate robust characterization of genetic architecture in terms of genetic effect size, pleiotropy, and epistasis (Buckler et al., 2009; Brown et al., 2011; Peiffer et al., 2014; Bouchet et al., 2017; Mathew et al., 2018). Using the cowpea MAGIC population, this study showed that both additive main QTL and additive × additive epistatic QTL with large and (or) moderate effects underlie FLT, MAT, and SS in cowpea. Although we identified two-way epistatic interactions, results showed that some loci were involved in interactions with more than one independent loci (Figures 4 and 5 and Figures S4–11). This implies the possibility of three-way epistatic interactions underlying some of the traits. Our inability to identify and discuss three-way epistatic interactions is due to the mapping approach used, which only mapped two-way epistatic interactions. Three-way epistatic interactions have been found to underlie FLT in the selfing crop specie barley (Mathew et al., 2018). Furthermore, overlaps between main and epistatic loci (Figure S2) indicate these to be main effect loci that are involved in epistatic interactions with other loci. However, one caveat that may also be responsible for some of the QTL among the overlaps is the false positive rate of SPEAML. The SPEAML software used for epistasis mapping showed high false positive rate with a sample size of 300 individuals (Chen et al., 2018a). It is possible that some of the overlapped QTL are main QTL that were miscategorized as epistatic loci by SPEAML since our cowpea MAGIC population had 305 RILs.
Distinct and Common Genetic Regulators Underlie Flowering Time
FLT is an important adaptive trait in breeding. Photoperiod impacted days to FLT as observed from the reaction norm plot for cowpea MAGIC FLT data which showed drastic reductions in days to flowering for RILs under short day compared to long days (Figure 1). Our mapping results (main effect and epistatic) showed that both unique and common loci underlie FLT variation under long and short photoperiod (Figure 1; Figures S4–S8). Epistatic loci underlie FLT in both selfing (Komeda, 2004; Juenger et al., 2005; Huang et al., 2013; Chen et al., 2018b; Li et al., 2018a; Mathew et al., 2018) and outcrossing (Buckler et al., 2009; Durand et al., 2012) species. In addition, the effect size of FLT loci differs between selfing and out crossing species as QTL effect sizes are large in the former (Lin et al., 1995; Maurer et al., 2015) and small in the later (Buckler et al., 2009). In the present study, the large effects (up to 25% PVE and additive effect of 7 days) of FLT loci were only identified under long-day photoperiod and not under short-day photoperiod (Figure 2, Tables S3 and S4). The loci detected under short-day photoperiod were of moderate effects (PVE = 1–10% and maximum additive effect size of 2 days). The large effect size attributed to some of the loci that are unique to FLT adaptation under long photoperiod suggests the possible effect of recent selection ate these loci (Orr, 1998; Orr, 1999; Brown et al., 2011; Dittmar et al., 2016).
Conserved genetic pathways often underlie traits in plant species (Liu et al., 2013; Huang et al., 2017). Examination of colocalizations between a priori genes and QTL in this study identified putative cowpea orthologs of A. thaliana and G. max FLT that may underlie phenotypic variation in cowpea. FLT is affected by photoperiodicity and regulated by a network of genes (Sasaki et al., 2018) involved in floral initiation, circadian clock regulation, and photoreception (Lin, 2002). In addition, certain a priori genes were unique to either FLT under long day or short day. For instance, cowpea putative orthologs of photoreceptors (PHY A [Vigun01g205500] and PHY E [Vigun09g050600]) and circadian clock gene PHYTOCLOCK1 (PCL1 [Vigun11g157600]) colocalized with only QTL associated with FLT under long day, while cowpea putative orthologs of circadian clock genes (Time for Coffee [TIC (Vigun07g241700)] and Zeitlupe [ZTL]) colocalized with only QTL associated with FLT under short day. However, the cowpea putative ortholog of photoperiod gene CONSTANS (CO [Vigun05g024400]) colocalized with QTL associated with FLT under both long and short days. Thus, our study suggests that distinct and common genetic regulators control FLT adaptation to both long- and short-day photoperiod in cowpea. Further studies utilizing functional approaches will be helpful to decipher gene regulation patterns under both long- and short-photoperiod in cowpea.
Genetic Basis of Maturity and Seed Size
In this study, the genetic basis of MAT and SS were evaluated under short-day photoperiod only. Our study demonstrated that MAT under short day is controlled by moderate and small effect main and epistatic loci. MAT QTL were found to colocalize with cowpea putative orthologs of Arabidopsis circadian clock and photoperiod (ZTL [ZEITLUPE], CO [CONSTANS]) genes. One pleiotropic QTL (qVu9:8.37 colocalized with ZTL [ZEITLUPE]) was found to be associated with both MAT and FLT under restricted irrigation and short-day photoperiod. Pleiotropic QTL between MAT and FLT were also reported in soybean (Kong et al., 2018). This suggest a possible genetic basis for the positive relationship found between MAT and FLT in prior studies (Huynh et al., 2018; Owusu et al., 2018). A major large effect locus explaining up to 29% of the phenotypic variation was found to be associated with SS. This QTL was found at about 2cM from the cowpea ortholog of Arabidopsis AHK2 SS gene. Further studies, using mapping panels with more diverse founders and more a priori genes will be required to identify further genes underlying natural variations in MAT and SS in cowpea.
Genetic Architecture Influenced GS and MAS Performance
GS models differ in their efficiency to capture complex cryptic interactions among genetic markers (de Oliveira Couto et al., 2017). The traits evaluated in this study are controlled by both main effect and epistatic loci. In this study, comparison among the GS models showed that parametric and semi-parametric GS models outperformed non-parametric GS model for all traits. SVR, a non-parametric model, had the least prediction accuracy and coincidence index and also had the highest bias (Figures S12 and S13). Previous studies have shown that semi-parametric and non-parametric models increased prediction accuracy under epistatic genetic architecture (Howard et al., 2014; Jacquin et al., 2016). In this study, none of semi-parametric and non-parametric models outperformed parametric models (Figures 6 and 7). Some of the studies comparing the performance of parametric, semi-parametric, and non-parametric GS models were based on simulations of traits controlled solely by epistatic genetic architectures. Therefore, the performance of the models under simulated combined genetic effects (additive + epistasis) is not well understood. The comparable performance of RKHS to RRBLUP (parametric model) in this study in terms of prediction accuracy, coincidence index, and bias estimates attests to RKHS ability to capture both additive and epistatic interactions (Gianola et al., 2006; Gianola and Van Kaam, 2008; De Los Campos et al., 2010; Gota and Gianola, 2014) for both prediction accuracy and selection of top performing lines. The performance of GS models is often indistinguishable, and RRBLUP has been recommended as an efficient parametric GS model (Heslot et al., 2012; Lipka et al., 2015). SVR had the worst performance with extremely high bias estimates.
Understanding the genetic architecture of agronomic traits can help improve accuracy of genomic predictions (Hayes et al., 2010; Swami, 2010). Our study demonstrated that the effect size of QTL associated with a trait played a role in the performance of GS and MAS models. For instance, for traits controlled by both large and moderate effect loci (FTFILD, FTRILD, SSFISD, and SSRISD), parametric model with known loci as fixed effect (FxRRBLUP) followed by MAS outperformed the rest of the GS models (RRBLUP, RKHS, and SVR). The use of known markers as fixed effects has been shown to increase prediction accuracy (Bernardo, 2014; Spindel et al., 2016) in parametric GS models. For traits that were controlled by moderate effect loci (FTFISD, FTRISD, MFISD, and MTRISD), our results showed that the two parametric GS models (FxRRBLUP and RRBLUP) and semi-parametric (RKHS) had similar prediction accuracy; however, FxRRBLUP had higher bias than RRBLUP and RKHS (Figure S12–S13). Furthermore, the performance of MAS in comparison to GS models in this study supported the fact that large effect loci are important influencers of MAS (Bernardo, 2008). For small breeding programs in developing countries, MAS might be a prudent choice over GS for traits controlled by large effects loci in cowpea since GS will require genotyping of more markers than MAS. The large effect loci identified in this study can be transferred to different breeding populations because they were identified in a MAGIC population with wide genetic background (Descalsota et al., 2018; Huynh et al., 2018). Our study thus demonstrates that prior knowledge of the genetic architecture of a trait can help make informed decision about the best GEB method to employ in breeding.
In summary, using the cowpea MAGIC population, our study identified both main QTL and two-way epistatic loci underlying FLT, MAT, and SS. These traits are oligogenic in genetic architecture with QTL effects ranging from small to large sizes. The effect size of the markers/QTL reported in this study may be upwardly biased due to the small size (n = 305) of the cowpea MAGIC population. Thus, studies with higher sample sizes (n > 1,000) will prove more accurate (Xu, 2003; King and Long, 2017). The identified QTL and their colocalized a priori genes will serve as stepping stone for future studies considering the molecular characterization of the genes underlying FLT, MAT, and SS in cowpea. Further, we demonstrated that prior knowledge of the genetic architecture of a trait can help make informed decision in GEB. Due to variations observed across photoperiod/environments for FLT, we will recommend the development of photoperiod insensitive lines in cowpea breeding. Also, given that some QTL were identified in specific environments, considerations should be given to field evaluation of mapping populations under contrasting environments that are representative of natural populations’ environmental conditions. In addition, the cowpea MAGIC population may not capture all the genetic variation available in cowpea for FLT, MAT, and SS because only eight founders were used for its development. Thus, some of our markers may not be well diagnostic in breeding populations that do not share close ancestry with the cowpea MAGIC founders. Despite this limitation, this study still provides technical details that can be part of considerations for GS and MAS in cowpea breeding.
Data Availability
Publicly available datasets were analyzed in this study. This data can be found here: https://onlinelibrary.wiley.com/doi/full/10.1111/tpj.13827
Author Contributions
MO obtained data from UCR; concept by MO and ZH; MO and ZH analyzed the data; MO, ZH, and PA wrote the manuscript. All authors read and approved the manuscript.
Conflict of Interest Statement
The authors declare that the research was conducted in the absence of any commercial or financial relationships that could be construed as a potential conflict of interest.
Acknowledgments
We express our gratitude to Prof. Timothy Close, Prof. Philip Roberts, Dr. Bao-Lam Huynh and their team at the University of California—Riverside, USA for their incredible contributions to cowpea genomics and the privilege to use the cowpea MAGIC population data for this study. The MAGIC population development, phenotyping, and genotyping was supported in large part by grants from the Generation Challenge Program of the Consultative Group on International Agricultural Research, with additional support from the USAID Feed the Future Innovation Lab for Collaborative Research on Grain Legumes (Cooperative Agreement EDH-A-00-07-00005), the USAID Feed the Future Innovation Lab for Climate Resilient Cowpea (Cooperative Agreement AID-OAA-A-13-00070), and NSF-BREAD (Advancing the Cowpea Genome for Food Security). We also thank Dr. Bode Olukolu, Dr. Sandeep Marla, and Fanna Maina for helping with the manuscript review. Thanks to Joanna, Eleazar, Christy, Grace, Fangfang, and Isimemen for their support.
“This manuscript has been released as a Pre-Print at: (Olatoye et al., 2019);
Olatoye et al. (2019) ‘Epistasis detection and modeling for genomic selection in cowpea (Vigna unguiculata. L. Walp.)’ bioRxiv. Cold Spring Harbor Laboratory, p. 576819. doi: 10.1101/576819.”
Supplementary Material
All the R scripts used for analyses in the study are available at: https://github.com/marcbios/Cowpea.git
The Supplementary Material for this article can be found online at: https://www.frontiersin.org/articles/10.3389/fgene.2019.00677/full#supplementary-material
Data S1 | Candidate gene list
Data S2 | Main effect QTL list
Data S3 | Epistatic QTL list
Data S4 | Genes that colocalized with main and epistatic QTL
References
Aukerman, M. J., Sakai, H. (2003). Regulation of flowering time and floral organ identity by a MicroRNA and its APETALA2-like target genes. Plant Cell 15 (11), 2730–2741. doi: 10.1105/tpc.016238
Barton, N. H, Keightley, D. (2002). Understanding quantitative genetic variation. Nat. Rev. Genet. 3, 11–21. doi: 10.1038/nrg700
Ben-Ari, G., Lavi, U. (2012). “Marker-assisted selection in plant breeding,” in Plant Biotechnology and Agriculture (Cambridge, MA: Elsevier), 163–184. doi: 10.1016/B978-0-12-381466-1.00011-0
Bernardo, R., Yu, J. (2007). Prospects for genomewide selection for quantitative traits in maize. Crop Sci. 47 (3), 1082. doi: 10.2135/cropsci2006.11.0690
Bernardo, R. (2008). Molecular markers and selection for complex traits in plants: learning from the last 20 years. Crop Sci. 48 (5), 1649–1664. doi: 10.2135/cropsci2008.03.0131
Bernardo, R. (2014). Genomewide Selection when major genes are known. Crop Sci. 54 (1), 68. doi: 10.2135/cropsci2013.05.0315
Bouchet, S., Olatoye, M. O., Marla, S. R., Perumal, R., Tesso, T., Yu, J., et al. (2017). Increased power to dissect adaptive traits in global sorghum diversity using a nested association mapping population. Genetics 206 (2), 573–585. doi: 10.1534/genetics.116.198499
Boukar, O., Belko, N., Chamarthi, S., Togola, A., Batieno, J., Owusu, E., et al. (2018). Cowpea (Vigna unguiculata): genetics, genomics and breeding. Plant Breed. 2018, 1–10. doi: 10.1111/pbr.12589
Bradbury, P. J., Zhang, Z., Kroon, D. E., Casstevens, T. M., Ramdoss, Y., Buckler, E. S. (2007). TASSEL: software for association mapping of complex traits in diverse samples. Bioinformatics 23 (19), 2633–2635. doi: 10.1093/bioinformatics/btm308
Brown, P. J., Upadyayula, N., Mahone, G. S., Tian, F., Bradbury, P. J., Myles, S., et al. (2011). Distinct genetic architectures for male and female inflorescence traits of maize. PLoS Genet. 7 (11), e1002383. doi: 10.1371/journal.pgen.1002383
Buckler, E. S., Holland, J. B., Bradbury, P. J., Acharya, C. B., Brown, P. J., Browne, C., et al. (2009). The genetic architecture of maize flowering time. Science 325 (5941), 714–718. doi: 10.1126/science.1174276
Cerrudo, D., Cao, S., Yuan, Y., Martinez, C., Suarez, E. A., Babu, R., et al. (2018). Genomic selection outperforms marker assisted selection for grain yield and physiological traits in a maize doubled haploid population across water treatments. Front. Plant Sci. 9, 366. doi: 10.3389/fpls.2018.00366
Chen, A. H., Ge, W., Metcalf, W., Jakobsson, E., Mainzer, L. S., Lipka, A. E. (2018a). An assessment of true and false positive detection rates of stepwise epistatic model selection as a function of sample size and number of markers. Heredity 122, 660–671. doi: 10.1038/s41437-018-0162-2
Chen, J, Li, X., Cheng, C., Wang, Y., Qin, M., Zhu, H., et al. (2015). Characterization of epistatic interaction of QTLs LH8 and EH3 controlling heading date in rice. Sci. Rep. 4 (1), 4263. doi: 10.1038/srep04263
Chen, M., Ahsan, A., Meng, X., Rahaman, M., Chen, H., Monir, M. (2018b). Identification epistasis loci underlying rice flowering time by controlling population stratification and polygenic effect. DNA Res. 26 (2), 119–130. doi: 10.1093/dnares/dsy043
Covarrubias-Pazaran, G. (2016). Genome-Assisted prediction of quantitative traits using the R package sommer. PLoS ONE 11 (6), 1–15. doi: 10.1371/journal.pone.0156744
Daetwyler, H. D., Calus, M. P. L., Pong-Wong, R., de los Campos, G., Hickey, J. M. (2013). Genomic prediction in animals and plants: simulation of data, validation, reporting, and benchmarking. Genetics 193 (2), 347–365. doi: 10.1534/genetics.112.147983
De Los Campos, G., Gianola, D., Rosa, G. J. M., Weigel, K. A., Crossa, J. (2010). Semi-parametric genomic-enabled prediction of genetic values using reproducing kernel Hilbert spaces methods. Genet. Res. 92 (4), 295–308. doi: 10.1017/S0016672310000285
de Oliveira Couto, E. G., Bandeira e Sousa, M., Jarquín, D., Burgueño, J., Crossa, J., Fritsche-Neto, R., et al. (2017). Genomic-Enabled prediction in maize using kernel models with genotype × environment interaction. G3: Genes Genomes Genet. 7 (6), 1995–2014. doi: 10.1534/g3.117.042341
Descalsota, G. I. L., Swamy, B. P. M., Zaw, H., Inabangan-Asilo, M. A., Amparado, A., Mauleon, R., et al. (2018). Genome-wide association mapping in a rice MAGIC Plus population detects QTLs and genes useful for biofortification. Front. Plant Sci. 9 (1347), 1–20. doi: 10.3389/fpls.2018.01347
Dittmar, E. L., Oakley, C. G., Conner, J. K., Gould, B. A., Schemske, D. W. (2016). Factors influencing the effect size distribution of adaptive substitutions. Proc. R. Soc. B Biol. Scie. 283 (1828), 1–8. doi: 10.1098/rspb.2015.3065
Durand, E., Bouchet, S., Bertin, P., Ressayre, A., Jamin, P., Charcosset, A., et al. (2012). Flowering time in maize: linkage and epistasis at a major effect locus. Genetics 190 (4), 1547–1562. doi: 10.1534/genetics.111.136903
Endelman, J. B. (2011). Ridge regression and other kernels for genomic selection with R package rrBLUP. Plant Genome J. 4 (3), 250. doi: 10.3835/plantgenome2011.08.0024
Fernandes, S. B., Dias, K. O. G., Ferreira, D. F., Brown, P. J. (2018). Efficiency of multi-trait, indirect, and trait-assisted genomic selection for improvement of biomass sorghum. Theor. Appl. Genet. 131 (3), 747–755. doi: 10.1007/s00122-017-3033-y
Foolad, M. R., Panthee, D. R. (2012). Marker-assisted selection in tomato breeding. Crit. Rev. Plant Sci. 31 (2), 93–123. doi: 10.1080/07352689.2011.616057
Gianola, D., de los Campos, G. (2008). Inferring genetic values for quantitative traits non-parametrically. Genet. Res. 90 (6), 525–540. doi: 10.1017/S0016672308009890
Gianola, D., Van Kaam, J. B. C. H. M. (2008). Reproducing kernel Hilbert spaces regression methods for genomic assisted prediction of quantitative traits. Genetics 178 (4), 2289–2303. doi: 10.1534/genetics.107.084285
Gianola, D., Fernando, R. L., Stella, A. (2006). Genomic-assisted prediction of genetic value with semiparametric procedures. Genetics 173 (3), 1761–1776. doi: 10.1534/genetics.105.049510
Goodstein, D. M., Shu, S., Howson, R., Neupane, R., Hayes, R. D., Fazo, J., et al. (2012). Phytozome: a comparative platform for green plant genomics. Nucleic Acids Res. 40 (Database issue), D1178–D1186. doi: 10.1093/nar/gkr944
Gota, M., Gianola, D. (2014). Kernel-based whole-genome prediction of complex traits: a review. Front. Genet. 5, 1–13. doi: 10.3389/fgene.2014.00363
Haile, T. A., Heidecker, T., Wright, D., Neupane, S., Ramsay, L., Vandenberg, A., et al. (2019). Genomic selection for lentil breeding: empirical evidence. bioRxiv, 608406. doi: 10.1101/608406
Hall, A. E. (2004). Breeding for adaptation to drought and heat in cowpea. Eur. J. Agron. 21 (4), 447–454. doi: 10.1016/j.eja.2004.07.005
Hall, A. E., Cisse, N., Thiaw, S., Elawad, H. O. A., Ehlers, J. D., Ismail, A. M., et al. (2003). Development of cowpea cultivars and germplasm by the Bean/Cowpea CRSP. Field Crops Res. 82 (2–3), 103–134. doi: 10.1016/S0378-4290(03)00033-9
Hayes, B. J., Pryce, J., Chamberlain, A. J., Bowman, P. J., Goddard, M. E. (2010). Genetic architecture of complex traits and accuracy of genomic prediction: coat colour, milk-fat percentage, and type in holstein cattle as contrasting model traits. PLoS Genet. 6 (9), e1001139. doi: 10.1371/journal.pgen.1001139
Hazen, S. P., Schultz, T. F., Pruneda-Paz, J. L., Borevitz, J. O., Ecker, J. R., Kay, S. A. (2005). LUX ARRHYTHMO encodes a Myb domain protein essential for circadian rhythms. Proc. Natl. Acad. Sci. U. S. A. 102 (29), 10387–10392. doi: 10.1073/pnas.0503029102
Heslot, N., Yang, H. P., Sorrells, M. E., Jannink, J. L. (2012). Genomic selection in plant breeding: a comparison of models. Crop Sci. 52 (1), 146–160. doi: 10.2135/cropsci2011.06.0297
Howard, R., et al. (2016). Evaluation of parametric and nonparametric statistical methods in genomic prediction. Dissertation. Ames (IA): Iowa State University.
Howard, R., Carriquiry, A. L., Beavis, W. D. (2014). Parametric and nonparametric statistical methods for genomic selection of traits with additive and epistatic genetic architectures. G3: Genes Genomes Genet. 4 (6), 1027–1046. doi: 10.1534/g3.114.010298
Huang, P., Jiang, H., Zhu, C., Barry, K., Jenkins, J., Sandor, L., et al. (2017). Sparse panicle1 is required for inflorescence development in Setaria viridis and maize. Nat. Plants 3 (5), 17054. doi: 10.1038/nplants.2017.54
Huang, X., Ding, J., Effgen, S., Turck, F., Koornneef, M. (2013). Multiple loci and genetic interactions involving flowering time genes regulate stem branching among natural variants of Arabidopsis. New Phytol. 199, 843–857. doi: 10.1111/nph.12306
Huynh, B. L., Ehlers, J. D., Huang, B. E., Muñoz-Amatriaín, M., Lonardi, S., Santos, J. R. P., et al. (2018). A multi-parent advanced generation inter-cross (MAGIC) population for genetic analysis and improvement of cowpea (Vigna unguiculata L. Walp). Plant J. 93 (6), 1129–1142. doi: 10.1111/tpj.13827
Jacquin, L., Cao, T.-V., Ahmadi, N. (2016). A unified and comprehensible view of parametric and kernel methods for genomic prediction with application to rice. Front. Genet. 7, 145. doi: 10.3389/fgene.2016.00145
Jannink, J. L., Lorenz, A. J., Iwata, H. (2010). Genomic selection in plant breeding: from theory to practice. Briefings Funct. Genomics Proteomics 9 (2), 166–177. doi: 10.1093/bfgp/elq001
Jarquin, D., Specht, J., Lorenz, A. (2016). Prospects of genomic prediction in the usda soybean germplasm collection: historical data creates robust models for enhancing selection of accessions. G3: Genes Genomes Genet. 6 (8), 2329–2341. doi: 10.1534/g3.116.031443
Jiang, Y., Reif, J. C. (2015). Modeling epistasis in genomic selection. Genetics 201 (2), 759–768. doi: 10.1534/genetics.115.177907
Johnson, N. (2008). Sewall wright and the development of shifting balance theory. Nat. Educ. 1 (1), 52. doi: 10.1093/rfs/hhx028
Juenger, T. E., Sen, S., Stowe, K. A., Simms, E. L. (2005) “Epistasis and genotype-environment interaction for quantitative trait loci affecting flowering time in Arabidopsis thaliana” in Genetics of adaptation. Ed. Mauricio, R. (Dordrecht: Springer), 87–105.
Karatzoglou, A., Smola, A., Hornik, K., Zeileis, A. (2004). kernlab - an S4 package for kernel methods in R. J. Stat. Software 11 (9), 1–20. doi: 10.18637/jss.v011.i09
King, E. G., Long, A. D. (2017). The beavis effect in next-generation mapping panels in drosophila melanogaster. G3 (Bethesda, Md) 7 (6), 1643–1652. doi: 10.1534/g3.117.041426
Komeda, Y. (2004). Genetic regulation of time to flower in arabidopsis thaliana. Annu. Rev. Plant Biol. 55, 521–556. doi: 10.1146/annurev.arplant.55.031903.141644
Kong, L., Lu, S., Wang, Y., Fang, C., Wang, F., Nan, H., et al. (2018). Quantitative trait locus mapping of flowering time and maturity in soybean using next-generation sequencing-based analysis. Front. Plant Sci. 9, 995. doi: 10.3389/fpls.2018.00995
Kurek, A. (2018). Phenotypic and genomic selection for multi-trait improvement in soybean line and variety development. Dissertation. Ames (IA): Iowa State University.
Langyintuo, A. S., Lowenberg-DeBoer, J., Faye, M., Lambert, D., Ibro, G., Moussa, B., et al. (2003). Cowpea supply and demand in west and central africa. Field Crops Res. 82 (2–3), 215–231. doi: 10.1016/S0378-4290(03)00039-X
Li, X., Guo, T., Mu, Q., Li, X., Yu, J. (2018a). Genomic and environmental determinants and their interplay underlying phenotypic plasticity. Proc. Natl. Acad. Sci. 115 (26), 6679–6684. doi: 10.1073/pnas.1718326115
Li, Y., Ruperao, P., Batley, J., Edwards, D., Khan, T., Colmer, T. D., et al. (2018b). Investigating drought tolerance in chickpea using genome-wide association mapping and genomic selection based on whole-genome resequencing data. Front. Plant Sci. 9, 190. doi: 10.3389/fpls.2018.00190
Lin, C. (2002). Photoreceptors and regulation of flowering time. Plant Physiol. 123 (1), 39–50. doi: 10.1104/pp.123.1.39
Lin, Y.-R., Schertz, K. F., Paterson, A. H. (1995). Comparative analysis of qtls affecting plant height and maturity across the poaceae, in reference to an interspecific Sorghum population. Genetics 141, 391–411.
Lipka, A. E., Kandianis, C. B., Hudson, M. E., Yu, J., Drnevich, J., Bradbury, P. J., et al. (2015). From association to prediction: statistical methods for the dissection and selection of complex traits in plants. Curr. Opin. Plant Biol. 24, 110–118. doi: 10.1016/j.pbi.2015.02.010
Liu, C., Teo, Z. W. N., Bi, Y., Song, S., Xi, W., Yang, X., et al. (2013). A conserved genetic pathway determines inflorescence architecture in arabidopsis and rice. Dev. Cell 24 (6), 612–622. doi: 10.1016/j.devcel.2013.02.013
Long, N., Gianola, D., Rosa, G. J. M., Weigel, K. A. (2011). Application of support vector regression to genome-assisted prediction of quantitative traits. Theor. Appl. Genet. 123 (7), 1065–1074. doi: 10.1007/s00122-011-1648-y
Mackay, T. F. C. (2001). The genetic architecture of quantitative traits. Ann. Rev. Genet. 35 (1), 303–339. doi: 10.1146/annurev.genet.35.102401.090633
Maenhout, S., De Baets, B., Haesaert, G., Van Bockstaele, E. (2007). Support vector machine regression for the prediction of maize hybrid performance. Theor. Appl. Genet. 115 (7), 1003–1013. doi: 10.1007/s00122-007-0627-9
Massman, J. M., Jung, H.-J. G., Bernardo, R. (2013). Genomewide selection versus marker-assisted recurrent selection to improve grain yield and stover-quality traits for cellulosic ethanol in maize. Crop Sci. 53 (1), 58. doi: 10.2135/cropsci2012.02.0112
Matei, G., Woyann, L. G., Milioli, A. S., de Bem Oliveira, I., Zdziarski, A. D., Zanella, R., et al. (2018). Genomic selection in soybean: accuracy and time gain in relation to phenotypic selection. Mol. Breed. 38 (9), 117. doi: 10.1007/s11032-018-0872-4
Mathew, B., Léon, J., Sannemann, W., Sillanpää, M. J. (2018). Detection of epistasis for flowering time using bayesian multilocus estimation in a barley MAGIC population. Genetics 208 (2), 525–536. doi: 10.1534/genetics.117.300546
Mathieu, J., Yant, L. J., Mürdter, F., Küttner, F., Schmid, M. (2009). Repression of flowering by the miR172 target SMZ. PLoS Biol. 7 (7), e1000148. doi: 10.1371/journal.pbio.1000148
Maurer, A., Draba, V., Jiang, Y., Schnaithmann, F., Sharma, R., Schumann, E., et al. (2015). Modelling the genetic architecture of flowering time control in barley through nested association mapping. BMC Genomics 16 (1), 290. doi: 10.1186/s12864-015-1459-7
Melchinger, A. E., Utz, H. F., Piepho, H. P., Zeng, Z. B., Schön, C. C. (2007). The role of epistasis in the manifestation of heterosis: a systems-oriented approach. Genetics 177 (3), 1815–1825. doi: 10.1534/genetics.107.077537
Messina, C. D., Podlich, D., Dong, Z., Samples, M., Cooper, M. (2011). Yield-trait performance landscapes: from theory to application in breeding maize for drought tolerance. J. Exp. Bot. 62 (3), 855–868. doi: 10.1093/jxb/erq329
Meuwissen, T. H. E., Hayes, B. J., Goddard, M. E. (2001). Prediction of total genetic value using genome-wide dense marker maps. Genetics 157 (4), 1819–1829.
Mohamed, A., Ali, R., Elhassan, O., Suliman, E., Mugoya, C., Masiga, C. W., et al. (2014). First products of DNA marker-assisted selection in sorghum released for cultivation by farmers in sub-saharan Africa. J. Plant Sci. Mol. Breed. 3 (1), 3. doi: 10.7243/2050-2389-3-3
Moore, J. H., Williams, S. M. (2009). Epistasis and its implications for personal genetics. Am. J. Human Genet. 85 (3), 309–320. doi: 10.1016/j.ajhg.2009.08.006
Muchero, W., Diop, N. N., Bhat, P. R., Fenton, R. D., Wanamaker, S., Pottorff, M., et al. (2009). A consensus genetic map of cowpea [Vigna unguiculata (L) Walp]. and synteny based on EST-derived SNPs. Proc. Natl. Acad. Sci. U. S. A. 106 (43), 18159–18164. doi: 10.1073/pnas.0905886106
Okogbenin, E., Porto, M. C. M., Egesi, C., Mba, C., Espinosa, E., Santos, L. G., et al. (2007). Marker-assisted introgression of resistance to cassava mosaic disease into latin American germplasm for the genetic improvement of cassava in Africa. Crop Sci. 47 (5), 1895–1904. doi: 10.2135/cropsci2006.10.0688
Olatoye, M. O., Hu, Z., Aikpokpodion, P. O. (2019). Epistasis detection and modeling for genomic selection in cowpea (Vigna unguiculata. L. Walp). bioRxiv, 576819. doi: 10.1101/576819
Orozco-Arroyo, G., Paolo, D., Ezquer, I., Colombo, L. (2015). Networks controlling seed size in Arabidopsis. Plant Reprod. 28 (1), 17–32. doi: 10.1007/s00497-015-0255-5
Orr, H. A. (1998). The population genetics of adaptation: the distribution of factors fixed during adaptive evolution. Evolution 52 (4), 935–949. doi: 10.1111/j.1558-5646.1998.tb01823.x
Orr, H. A. (1999). The evolutionary genetics of adaptation: a simulation study. Genet. Res. Camb. 74, 207–214. doi: 10.1017/S0016672399004164
Owusu, E. Y., Akromah, R., Denwar, N. N., Adjebeng-Danquah, J., Kusi, F., Haruna, M. (2018). Inheritance of early maturity in some cowpea (Vigna unguiculata (L). Walp). Genotypes under rain fed conditions in Northern Ghana. Adv. Agric. 2018, 8930259.1–10. doi: 10.1155/2018/8930259
Pan, Y. B., Tew, T. L., Schnell, R. J., Viator, R. P., Richard, E. P., Grisham, M. P., et al. (2006). Microsatellite DNA marker-assisted selection of Saccharum spontaneum cytoplasm-derived germplasm. Sugar Tech. 8 (1), 23–29. doi: 10.1007/BF02943737
Pazhamala, L., Saxena, R. K., Singh, V. K., Sameerkumar, C. V., Kumar, V., Sinha, P., et al. (2015). Genomics-assisted breeding for boosting crop improvement in pigeonpea (Cajanus cajan). Front. Plant Sci. 6, 50. doi: 10.3389/fpls.2015.00050
Peiffer, J. A., Romay, M. C., Gore, M. A., Flint-Garcia, S. A., Zhang, Z., Millard, M. J., et al. (2014). The genetic architecture of maize height. Genetics 196 (4), 1337–1356. doi: 10.1534/genetics.113.159152
Perez, P. (2014). BGLR : a statistical package for whole genome regression and prediction. Genetics 198 (2), 483–495. doi: 10.1534/genetics.114.164442
Rice, B., Lipka, A. E. (2019). Evaluation of rr-blup genomic selection models that incorporate peak genome-wide association study signals in maize and sorghum. Plant Genome 12 (1), 0. doi: 10.3835/plantgenome2018.07.0052
Rieseberg, L. H., Archer, M. A., Wayne, R. K. (1999). Transgressive segregation, adaptation and speciation. Heredity 83 (4), 363–372. doi: 10.1038/sj.hdy.6886170
Roorkiwal, M., Rathore, A., Das, R. R., Singh, M. K., Jain, A., Srinivasan, S., et al. (2016). Genome-enabled prediction models for yield related traits in chickpea. Front. Plant Sci. 7, 1666. doi: 10.3389/fpls.2016.01666
Saghai Maroof, M. A., Jeong, S. C., Gunduz, I., Tucker, D. M., Buss, G. R., Tolin, S. A. (2008). Pyramiding of soybean mosaic virus resistance genes by marker-assisted selection. Crop Sci. 48 (2), 517. doi: 10.2135/cropsci2007.08.0479
Sasaki, E., Frommlet, F., Nordborg, M. (2018). GWAS with heterogeneous data: estimating the fraction of phenotypic variation mediated by gene expression data. Genes Genom Genet 8 (9), 3059–3068. doi: 10.1534/g3.118.200571
Schneider, K. A., Brothers, M. E., Kelly, J. D. (1997). Marker-assisted selection to improve drought resistance in common bean. Crop Sci. 37 (1), 51. doi: 10.2135/cropsci1997.0011183X003700010008x
Segura, V., Vilhjálmsson, B. J., Platt, A., Korte, A., Seren, Ü., Long, Q., et al. (2012). An efficient multi-locus mixed-model approach for genome-wide association studies in structured populations. Nature Genet. 44 (7), 825–830. doi: 10.1038/ng.2314
Somers, D. E., Schultz, T. F., Milnamow, M., Kay, S. A. (2000). ZEITLUPE encodes a novel clock-associated PAS protein from Arabidopsis. Cell. 101 (3), 319–329. doi: 10.1016/S0092-8674(00)80841-7
Spindel, J., Begum, H., Akdemir, D., Collard, B., Redoña, E., Jannink, J.-L., et al. (2016). Genome-wide prediction models that incorporate de novo GWAS are a powerful new tool for tropical rice improvement. Heredity 116, 395–408. doi: 10.1038/hdy.2015.113
Sun, X., Ma, P., Mumm, R. H. (2012). Nonparametric method for genomics-based prediction of performance of quantitative traits involving epistasis in plant breeding. PLoS ONE 7 (11), e50604. doi: 10.1371/journal.pone.0050604
Swami, M. (2010). Complex traits: using genetic architecture to improve predictions. Nat. Rev. Genet. 11 (11), 748. doi: 10.1038/nrg2888
Tardivel, A., Sonah, H., Belzile, F., O’Donoughue, L. S. (2014). Rapid identification of alleles at the soybean maturity gene E3 using genotyping by sequencing and a haplotype-based approach. Plant Genome 7 (2), 0. doi: 10.3835/plantgenome2013.10.0034
Utz, H. F., Melchinger, A. E., Schön, C. C. (2000). Bias and sampling error of the estimated proportion of genotypic variance explained by quantitative trait loci determined from experimental data in maize using cross validation and validation with independent samples. Genetics 154 (4), 1839–1849. doi: 10.2307/1403680
Vapnik, V. N. (1995). The Nature of Statistical Learning Theory. 1st edn. Jordan, M., Lauritzen, S.L., Lawless, J.F., Nair, V., editors. New York: Springer. doi: 10.1007/978-1-4757-3264-1
Varshney, R. K., Penmetsa, R. V., Dutta, S., Kulwal, P. L., Saxena, R. K., Datta, S., et al. (2010). Pigeonpea genomics initiative (PGI): an international effort to improve crop productivity of pigeonpea (Cajanus cajan L). Mol. Breed. 26 (3), 393–408. doi: 10.1007/s11032-009-9327-2
Varshney, R. K., Ribaut, J. M., Buckler, E. S., Tuberosa, R., Rafalski, A. J., Langridge, P. (2012). Can genomics boost productivity of orphan crops? Nat. Biotechnol. 30 (12), 1172–1176. doi: 10.1038/nbt.2440
Volis, S., Shulgina, I., Zaretsky, M., Koren, O. (2010). Epistasis in natural populations of a predominantly selfing plant. Heredity 106, 300–309. doi: 10.1038/hdy.2010.79
Wen, L., Chang, H.-X., Brown, P. J., Domier, L. L., Hartman, G. L. (2019). Genome-wide association and genomic prediction identifies soybean cyst nematode resistance in common bean including a syntenic region to soybean Rhg1 locus. Hortic. Res. 6 (1), 9. doi: 10.1038/s41438-018-0085-3
Wenkel, S., Turck, F., Singer, K., Gissot, L., Gourrierec, J., Samach, A., et al. (2006). Hd1, a major photoperiod sensitivity quantitative trait locus in rice, is closely related to the arabidopsis flowering time gene CONSTANS. Am. Soc. Plant Biol. 12 (12), 2473–2484. doi: 10.1105/tpc.12.12.2473
Wong, C. K., Bernardo, R. (2008). Genomewide selection in oil palm: increasing selection gain per unit time and cost with small populations. Theor. Appl. Genet. 116 (6), 815–824. doi: 10.1007/s00122-008-0715-5
Xu, Y., Li, P., Yang, Z., Xu, C. (2017). Genetic mapping of quantitative trait loci in crops. Crop J. 5 (2), 175–184. doi: 10.1016/j.cj.2016.06.003
Yu, J., Pressoir, G., Briggs, W. H., Vroh Bi, I., Yamasaki, M., Doebley, J. F., et al. (2006). A unified mixed-model method for association mapping that accounts for multiple levels of relatedness. Nat. Genet. 38 (2), 203–208. doi: 10.1038/ng1702
Yu, K., Park, S. J., Poysa, V. (2000). Marker-assisted selection of common beans for resistance to common bacterial blight: efficacy and economics. Plant Breed. 119 (5), 411–415. doi: 10.1046/j.1439-0523.2000.00514.x
Zhang, T., Yuan, Y., Yu, J., Guo, W., Kohel, R. J. (2003). Molecular tagging of a major QTL for fiber strength in Upland cotton and its marker-assisted selection. Theor. Appl. Genet. 106 (2), 262–268. doi: 10.1007/s00122-002-1101-3
Keywords: cowpea, genetic architecture, epistasis, QTL, genomic-enabled breeding, genomic selection, flowering time, photoperiod
Citation: Olatoye MO, Hu Z and Aikpokpodion PO (2019) Epistasis Detection and Modeling for Genomic Selection in Cowpea (Vigna unguiculata L. Walp.). Front. Genet. 10:677. doi: 10.3389/fgene.2019.00677
Received: 22 March 2019; Accepted: 27 June 2019;
Published: 30 July 2019.
Edited by:
Charles Chen, Oklahoma State University, United StatesReviewed by:
Eric Von Wettberg, University of Vermont, United StatesInês Fragata, University of Lisbon, Portugal
Copyright © 2019 Olatoye, Hu and Aikpokpodion. This is an open-access article distributed under the terms of the Creative Commons Attribution License (CC BY). The use, distribution or reproduction in other forums is permitted, provided the original author(s) and the copyright owner(s) are credited and that the original publication in this journal is cited, in accordance with accepted academic practice. No use, distribution or reproduction is permitted which does not comply with these terms.
*Correspondence: Peter O. Aikpokpodion, paikpokpodion@unical.edu.ng; paikpokpodion@gmail.com