 Jeannette Simino
 Yun Ju Sung
 Rezart Kume
- Division of Biostatistics, Washington University School of Medicine, St. Louis, MO, USA
Alcohol consumption is a known risk factor for hypertension, with recent candidate studies implicating gene-alcohol interactions in blood pressure (BP) regulation. We used 6882 (predominantly) Caucasian participants aged 20–80 years from the Framingham SNP Health Association Resource (SHARe) to perform a genome-wide analysis of SNP-alcohol interactions on BP traits. We used a two-step approach in the ABEL suite to examine genetic interactions with three alcohol measures (ounces of alcohol consumed per week, drinks consumed per week, and the number of days drinking alcohol per week) on four BP traits [systolic (SBP), diastolic (DBP), mean arterial (MAP), and pulse (PP) pressure]. In the first step, we fit a linear mixed model of each BP trait onto age, sex, BMI, and antihypertensive medication while accounting for the phenotypic correlation among relatives. In the second step, we conducted 1 degree-of-freedom (df) score tests of the SNP main effect, alcohol main effect, and SNP-alcohol interaction using the maximum likelihood estimates (MLE) of the parameters from the first step. We then calculated the joint 2 df score test of the SNP main effect and SNP-alcohol interaction using MixABEL. The effect of SNP rs10826334 (near SLC16A9) on SBP was significantly modulated by both the number of alcoholic drinks and the ounces of alcohol consumed per week (p-values of 1.27E-08 and 3.92E-08, respectively). Each copy of the G-allele decreased SBP by 3.79 mmHg in those consuming 14 drinks per week vs. a 0.461 mmHg decrease in non-drinkers. Index SNPs in 20 other loci exhibited suggestive (p-value ≤ 1E-06) associations with BP traits by the 1 df interaction test or joint 2 df test, including 3 rare variants, one low-frequency variant, and SNPs near/in genes ESRRG, FAM179A, CRIPT-SOCS5, KAT2B, ADCY2, GLI3, ZNF716, SLIT1, PDE3A, KERA-LUM, RNF219-AS1, CLEC3A, FBXO15, and IGSF5. SNP-alcohol interactions may enhance discovery of novel variants with large effects that can be targeted with lifestyle modifications.
Introduction
Hypertension afflicts 77.9 million adults in the United States (Go et al., 2013) and contributes to the public health burden of cardiovascular and cerebrovascular diseases (which cause death, induce functional disabilities, and reduce quality of life) (Roger et al., 2012). While increased awareness and treatment rates have partly alleviated the burden of hypertension, only half of all diagnosed hypertensives achieve their blood pressure (BP) goal (Roger et al., 2012). Dissecting the genetic and environmental architecture of BP regulation may inspire targeted lifestyle and pharmaceutical interventions that improve the prognosis and compliance of hypertensives. Although BP is a highly heritable trait, the identification of BP-associated genes has been slow and arduous compared to other complex traits like lipids. Genome-wide association studies (GWAS) of BP using up to 200,000 individuals have collectively identified ≈ 50 loci that explain less than 2.5% of the variance in BP (Adeyemo et al., 2009; Levy et al., 2009; Newton-Cheh et al., 2009; Padmanabhan et al., 2010; Ehret et al., 2011; Fox et al., 2011; Ho et al., 2011; Kato et al., 2011; Wain et al., 2011; Guo et al., 2012). The myriad of factors associated with BP, such as age, ethnicity, education, socioeconomic status, weight, physical activity, tobacco use, excessive alcohol consumption, psychosocial stress, and dietary factors (Xin et al., 2001; Go et al., 2013), complicate the dissection of its genetic underpinnings. These demographic and lifestyle factors may modulate the effect of genes on BP.
In this investigation, we focused on the role of alcohol consumption in the genetic and environmental architecture of BP. Alcohol consumption is a modifiable and highly prevalent behavior, as 51.5% of US adults consumed at least 12 alcoholic beverages in the past year (http://www.cdc.gov/nchs/fastats/alcohol.htm). Excessive alcohol consumption can be curbed to reduce the risk of hypertension (Fuchs et al., 2001; Kodavali and Townsend, 2006); a meta-analysis of 14 randomized clinical trials showed that reducing alcohol consumption in fairly heavy drinkers (>3 drinks per day) reduced systolic BP by 3.31 mmHg and diastolic BP by 2.04 mmHg (Xin et al., 2001). Yet, the effect of light-to-moderate alcohol consumption remains controversial (Klatsky and Gunderson, 2008; Leite et al., 2013) with mounting evidence that the genetic composition of an individual impacts the effect of alcohol consumption on hypertension risk. Candidate gene studies of hypertension and BP have implicated several interactions between alcohol and genes [ADH2 (Sen Zhang et al., 2013), ALDH2 (Chang et al., 2012; Nakagawa et al., 2013; Wang et al., 2013), SOD2 (Nakagawa et al., 2013), LEPR (Sober et al., 2009), ApoE (Leite et al., 2013), CYP11B2 (Pan et al., 2010), NADH2 (Kokaze et al., 2004, 2007), GNB3 (Polonikov et al., 2011), and ADM (Chen et al., 2013)].
Interactions between alcohol consumption and genes are biologically plausible, as the intermediate metabolites of alcohol can alter genes directly and influence their expression through epigenetic mechanisms (Alegria-Torres et al., 2011). The most common alcohol metabolism pathway involves two enzymes: alcohol dehydrogenase (ADH) and aldehyde dehydrogenase (ALDH). Ethanol is first oxidized to acetaldehyde by ADH, then the acetaldehyde is converted to acetate by ALDH, and the acetate is converted to water and carbon dioxide for elimination (National Institute on Alcohol Abuse and Alcoholism, 2007). Alcohol consumption can lead to acetaldehyde accumulation, which may be genotoxic (Joenje, 2011) and cause inter-strand crosslinking and other DNA damage (Lorenti Garcia et al., 2009; Joenje, 2011). Chronic alcohol consumption can lead to DNA hypomethylation through reductions in S-adenosylmethionine (Zakhari, 2013). Alcohol metabolism causes an increase in the NADH/NAD + ratio and generates reactive oxygen species and acetate, which can affect histone acetylation (Zakhari, 2013), damage DNA, and modify proteins (Finkel, 2011).
Most published GWAS ignore gene-alcohol interactions (Pan et al., 2011). Genome-wide studies incorporating gene-alcohol interactions may inform alcohol consumption guidelines, increase the accuracy of models predicting individual hypertension risk (Yi, 2010), enhance BP gene discovery efforts, and provide novel insights into the biological mechanisms and pathways underlying BP regulation (Thomas, 2010). Thus, we performed a genome-wide analysis of SNP-alcohol interactions on BP traits using 6882 (mostly) Caucasian participants from the Framingham SNP Health Association Resource (SHARe). We used participants 20–80 years old to examine the contribution of interactions between genetic variants and three alcohol measures (ounces of alcohol consumed per week, number of drinks consumed per week, and the number of days drinking alcohol per week) on four BP traits [systolic (SBP), diastolic (DBP), mean arterial (MAP), and pulse (PP) pressure]. Our aim was to identify novel BP loci with large interaction effects; discovery of such loci may facilitate alcohol intervention strategies and achievement of BP goals in genetically susceptible individuals, thereby reducing the public health burden of hypertension and its sequelae.
Methods
Subjects
We analyzed the Framingham SHARe data from dbGaP (accession number phs000007.v3.p2). The Framingham Heart Study (FHS) was initiated by the National Heart, Lung, and Blood Institute to investigate factors associated with the development of cardiovascular disease in a representative sample of the adult population of Framingham, Massachusetts (http://www.framinghamheartstudy.org/about-fhs/history.php). Our Framingham analysis set contained three inter-connected cohorts of mostly Caucasian participants: the Original cohort, the Offspring cohort, and the Third Generation (G3) Cohort. The Original Cohort, launched in 1948, included individuals aged 30–62 undergoing clinical examinations every 2 years (Dawber et al., 1951). The Offspring Cohort, launched in 1971, was formed from the biological descendents of the Original Cohort, as well as the spouses and offspring of the descendents (Feinleib et al., 1975). Following the baseline visit, participants in the Offspring Cohort underwent a second clinical visit 8 years later with subsequent visits every 4 years. The Third Generation Cohort, formed in 2002, included biological descendents or adopted offspring of the Offspring Cohort (Splansky et al., 2007). We analyzed a date-matched set of individuals aged 20–80 years old. The clinic visit dates from the twenty-sixth visit of the Original Cohort (May 1999 to November 2001) and the seventh visit of the Offspring Cohort (September 1998 to October 2001) were closest to each other, with the first visit of the Third Generation Cohort near the same time (April 2002 to July 2005); thus, we pooled the BP measurements from the twenty-sixth visit of the Original cohort (N = 6), the seventh visit of the Offspring Cohort (N ≈ 3000), and the first visit of the Third Generation Cohort (N ≈ 3800) to create a sample roughly analogous to a single-visit family study. Most members of the Original Cohort were beyond 80 years of age by the twenty-sixth exam. The six Original Cohort members that we included were part of extended pedigrees (one was a founder in a pedigree of 307 people). The average ages were 80, 61, and 40 years for the Original, Offspring, and Third Generation Cohorts, respectively.
Phenotypes
In general, SBP and DBP were measured using a consistent protocol and a standard mercury column sphygmomanometer (portable Baumanometer 300 Model or wall-mounted Baumanometer E98169) in the clinic (the protocol descriptions are publicly available on dbGaP). Participants were seated for at least 5 min before the first BP measurement. Our analysis phenotype was the average of three BP measurements (one nurse/technician reading and two physician readings). MAP was estimated by the sum of two-thirds the (average) DBP and one-third of the (average) SBP. PP was computed as the difference between (average) SBP and (average) DBP. Any Original Cohort members unable to complete the twenty-sixth visit onsite had sitting or supine BP measured by a power aneroid sphygmomanometer (gauge only) offsite.
Alcohol Measures
We analyzed three alcohol measures: ounces of alcohol consumed per week, number of drinks consumed per week, and the number of days consuming alcohol per week. At each clinic visit, participants reported their consumption of beer, wine, and liquor/spirits through a standardized questionnaire (publicly available on dbGaP). A drink was defined as a typical serving size for each particular type of alcoholic beverage, such as a bottle of beer, a glass of wine, or a mixed drink or shot of liquor. The ounces of alcohol consumed per week was derived by Framingham researchers to depict the actual ethanol content consumed; only a certain percentage of an alcoholic beverage is ethanol and this varies by beverage type. We calculated the number of drinks per week by summing the number of drinks per week from each alcohol beverage category. The number of days drinking alcohol per week was a lower bound on their drinking activity: it equaled the maximum days per week an individual drank any one type of alcoholic beverage. Non-drinkers were assigned values of 0 for all alcohol measures collected and/or calculated in their cohort.
Genotypes
SNPs were genotyped using the Affymetrix 500k array with the BRLMM calling algorithm and were filtered to remove Mendelian errors and gender discrepancies. Genotyped SNPs with call rates <90%, Hardy-Weinberg p-values < 1E-06, or less than 30 copies of the minor allele were excluded from our analysis. The dosage files for ~2.5 million imputed autosomal SNPs were available from the Framingham SHARe. We excluded SNPs with imputation quality R2 < 0.30 or less than 30 copies of the minor allele.
Statistical Analysis
We used the ABEL suite of packages to perform a two-step score test of the interaction between each SNP and alcohol measure on each BP trait (Aulchenko et al., 2007). In the first step, we fit a linear mixed model of each BP trait onto age, sex, BMI, and antihypertensive medication while accounting for the phenotypic correlation among relatives; this yielded maximum likelihood estimates (MLE) of the covariate coefficients, the residual variance, and the variance-covariance matrix for each BP trait (Aulchenko et al., 2007). In the second step, we conducted 1 degree-of-freedom (df) score tests of the SNP main effect, the alcohol main effect, and the SNP-alcohol interaction using the MLEs of the parameters from the first step (Aulchenko et al., 2010). We then employed MixABEL to calculate the joint 2 df score test of the SNP main effect and SNP-alcohol interaction. Since the 1 df interaction test statistics exhibited substantial inflation (genomic inflation factors up to 1.73), we applied the widely-accepted genomic control to achieve the expected distribution of p-values (Devlin and Roeder, 1999). The pre- and post-genomic control QQ plots are displayed in Figures S4–S7. For the joint 2 df test we did not perform any adjustment on the test statistics. Loci containing index SNPs with p ≤ 5E-08 were considered genome-wide significant, while loci harboring SNPs with p ≤ 1E-06 were deemed to have suggestive evidence of association with BP.
Results
Our analysis sample included 6882 genotyped individuals with at least one BP measure, one alcohol measure, and non-missing values of all covariates. Table 1 displays the descriptive statistics for the Framingham subsample used in the interaction analysis of each alcohol measure. The ounces of alcohol consumed per week and the number of days drinking per week were not available in the Third Generation Cohort; thus the sample size for the number of alcoholic drinks per week, which was available in the Third Generation Cohort, was 2.27 times larger than that of the other alcohol measures. The percentage of alcohol drinkers was also higher for the number of drinks per week sample while the mean age (49 vs. 61 years), antihypertensive use (19 vs. 33%), and mean SBP (120.5 vs. 126.0 mmHg) were lower. Table 2 describes the pedigrees analyzed for each alcohol measure (Wigginton and Abecasis, 2005); the pedigree size ranged from 1 to 307 individuals in each of the 1166 families available for analysis. Although the sample size approximately doubled for the drinks per week analysis, the number of relative pairs increased many-fold due to the inclusion of all three interrelated cohorts.
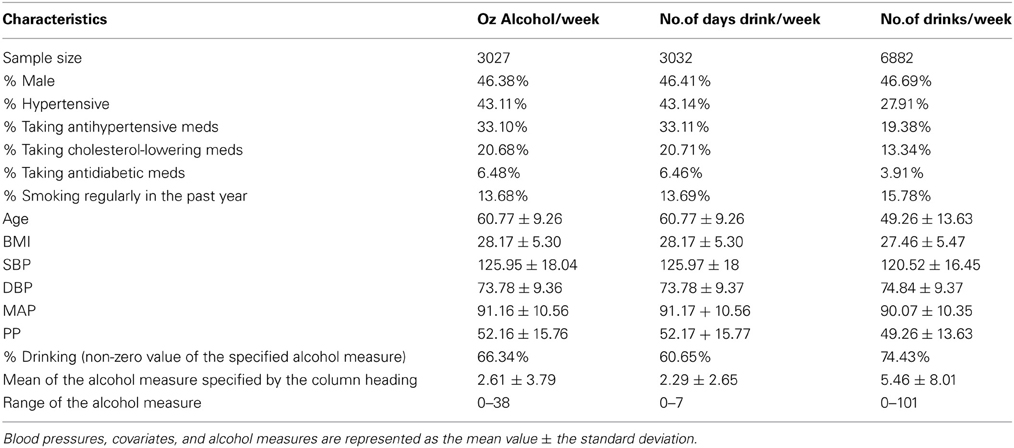
Table 1. Descriptive statistics for the BP traits, covariates, comorbidities, and alcohol measures.
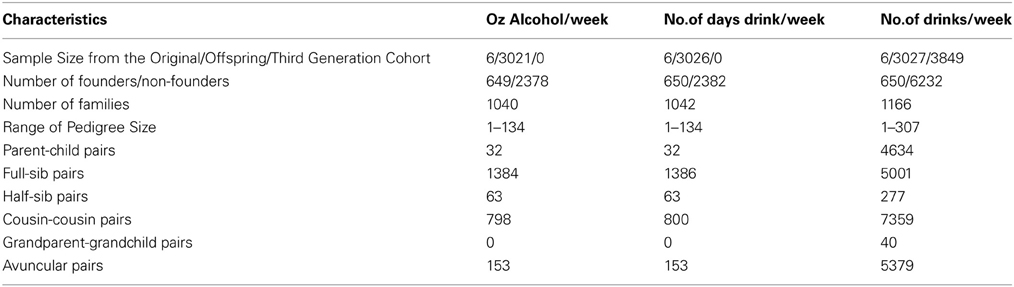
Table 2. Pedigree information for each analysis sample.
Our genome-wide analysis of SNP × alcohol interactions yielded one significant (p ≤ 5E-08) and 20 suggestive (p ≤ 1E-06) BP loci (using either the 1 or 2 df test of SNP-alcohol interactions). The number of loci associated with SBP, DBP, MAP, and PP were 8, 4, 9, and 3, respectively; three loci were associated with more than one trait. The alcohol measure with the largest sample size, drinks of alcohol per week, enabled the discovery of 16 of the 21 loci. The Manhattan plots in Figure 1 display the genome-wide results for the joint 2 df test of the SNP main effect and SNP-drinks per week interaction on all 4 BP traits. Six loci achieved significant or suggestive associations for BP traits in the ounces of alcohol consumed per week interaction analysis, while only 3 loci reached suggestive association in the number of days drinking per week interaction analysis.
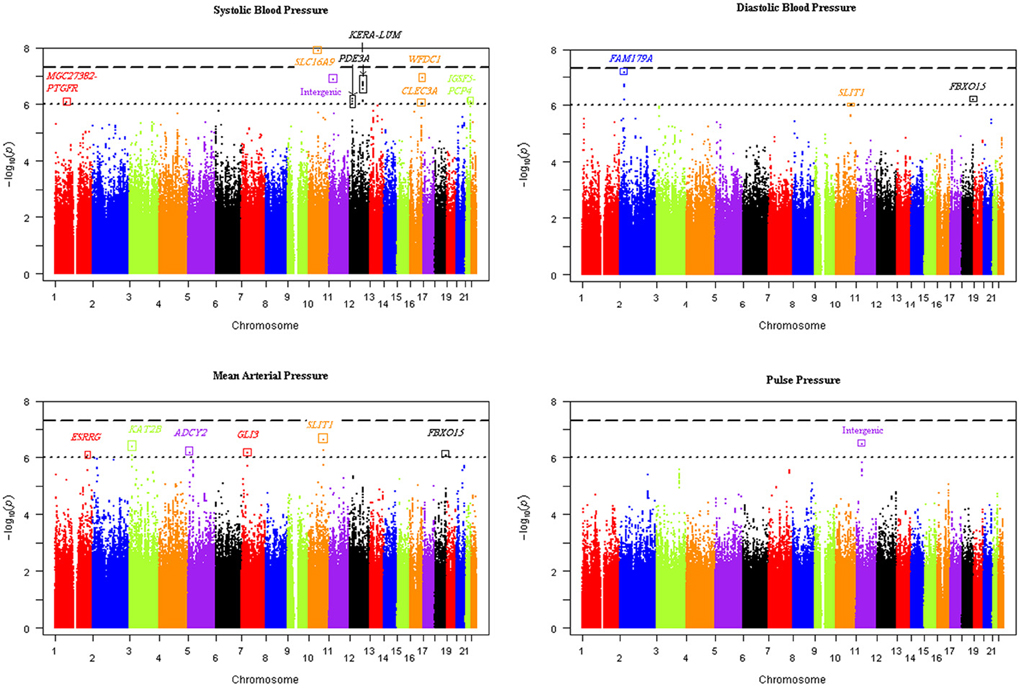
Figure 1. Manhattan plots of the joint 2 degree-of-freedom test of the SNP main effect and SNP-drinks per week interaction for each blood pressure trait. The -log(p-value) of the joint 2 df test of each SNP was plotted vs. the chromosomal location for all SNPs genome-wide. Sixteen unique loci were discovered using the four blood pressure traits.
For each BP trait and alcohol measure, we selected an index SNP to represent each significant and suggestive locus. Association results for the index SNPs are displayed in Table 3. Index SNPs in 19 of the 21 loci exhibited interactions with alcohol as evidenced by either a suggestive 1 df interaction test or a significant/suggestive joint 2 df test in conjunction with a nominally significant (p < 0.05) 1 df interaction test; two PP loci (represented by rs4953404 and rs12292796) appeared to be driven by main effects only (1 df interaction tests have p-values > 0.3 as shown in Table 3) and will be excluded from further discussion (see Figures S8–S14 for the regional association plots for all the significant and suggestive loci). Twelve loci exhibited qualitative interactions by having opposite signs on the coefficients for the SNP main effect and the SNP × alcohol interaction. The coded alleles of these SNPs decreased BP for non-drinkers and increased BP for heavy-drinkers or vice versa (increased BP for non-drinkers and decreased BP for heavy drinkers). For these 12 loci, the SNP may have protective or harmful effects depending on alcohol consumption.
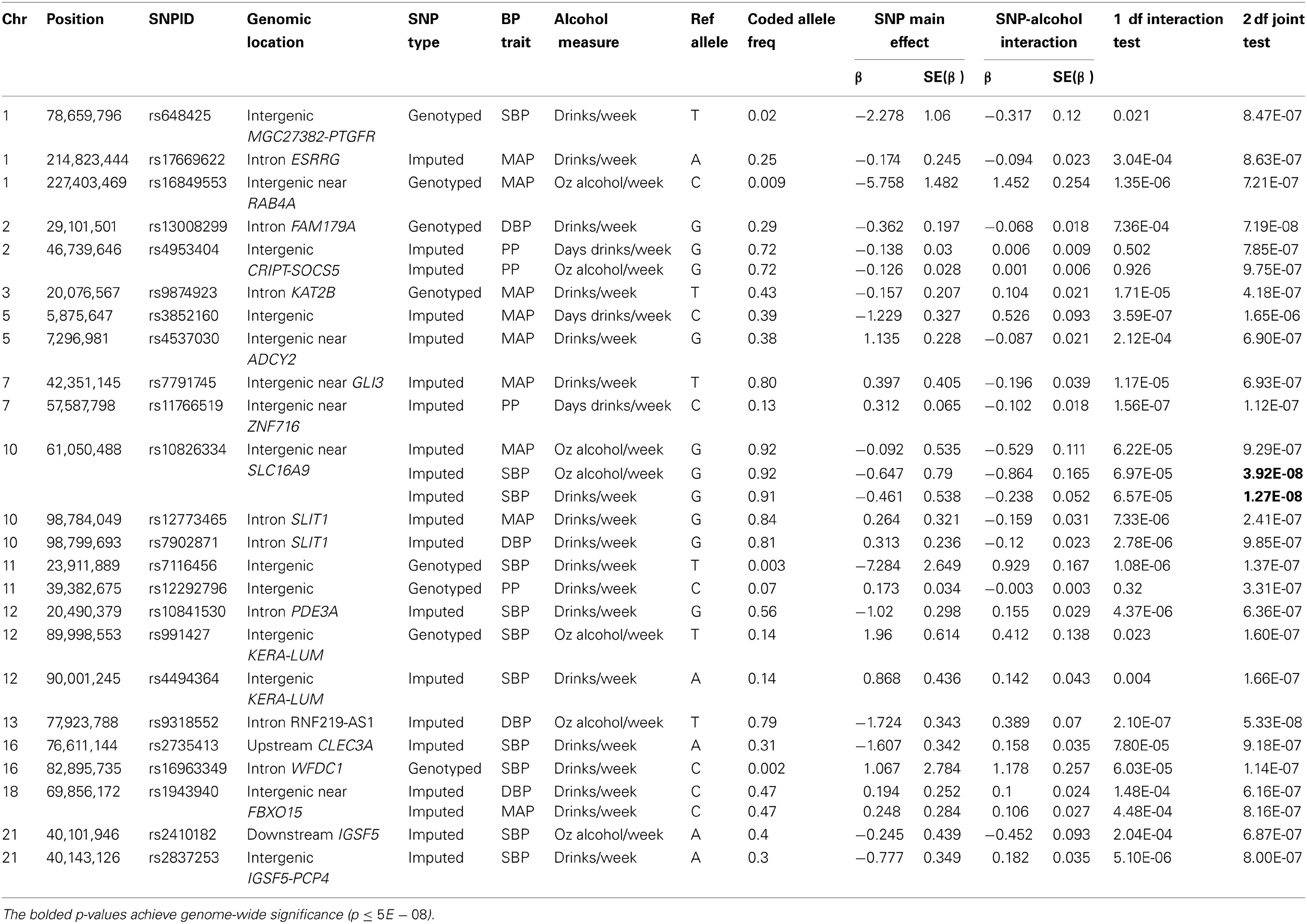
Table 3. Index SNPs harbored in loci with significant and suggestive interactions by the one degree-of-freedom interaction test and the joint two degree-of-freedom test.
Figure 2 displays the regional association plots for the three loci with the strongest statistical evidence, as well as plots of the effect of the index SNP as a function of alcohol consumption. SNP rs10826334 near monocarboxylic acid transporter 9 (SLC16A9) on chromosome 10 significantly interacted with both drinks per week and ounces of alcohol per week to influence SBP. Each copy of the G allele decreased SBP by 3.79 mmHg in individuals consuming 14 drinks per week as opposed to the 0.46 mmHg decrease per copy of the G allele in non-drinkers. Two other loci harbored index SNPs close to genome-wide significance. SNP rs9318552 intronic to RNF219 antisense RNA 1 (RNF219-AS1) on chromosome 13 interacted with ounces of alcohol per week to influence DBP (p-value = 5.3E-08). In non-drinkers, each copy of the T allele decreased DBP by 1.72 mmHg. However, in those drinking 8.4 ounces of alcohol per week (roughly the equivalent of 14 drinks) each copy of the T allele increased DBP by 1.54 mmHg. Thus, the T allele lowered DBP for alcohol consumption below 4.43 ounces of alcohol per week (~7.4 drinks per week) and raised DBP for alcohol consumption above this level. SNP rs13008299 intronic to family with sequence similarity 179, member A (FAM179A) on chromosome 2 interacted with drinks per week to influence DBP (p-value = 7.2E-08). Each copy of the G allele decreased DBP by 1.31 mmHg in individuals consuming 14 drinks per week as opposed to the 0.36 mmHg decrease per copy of the G allele in non-drinkers. All three of these common variants had supporting evidence in the region and non-negligible effect sizes as shown in Figure 2.
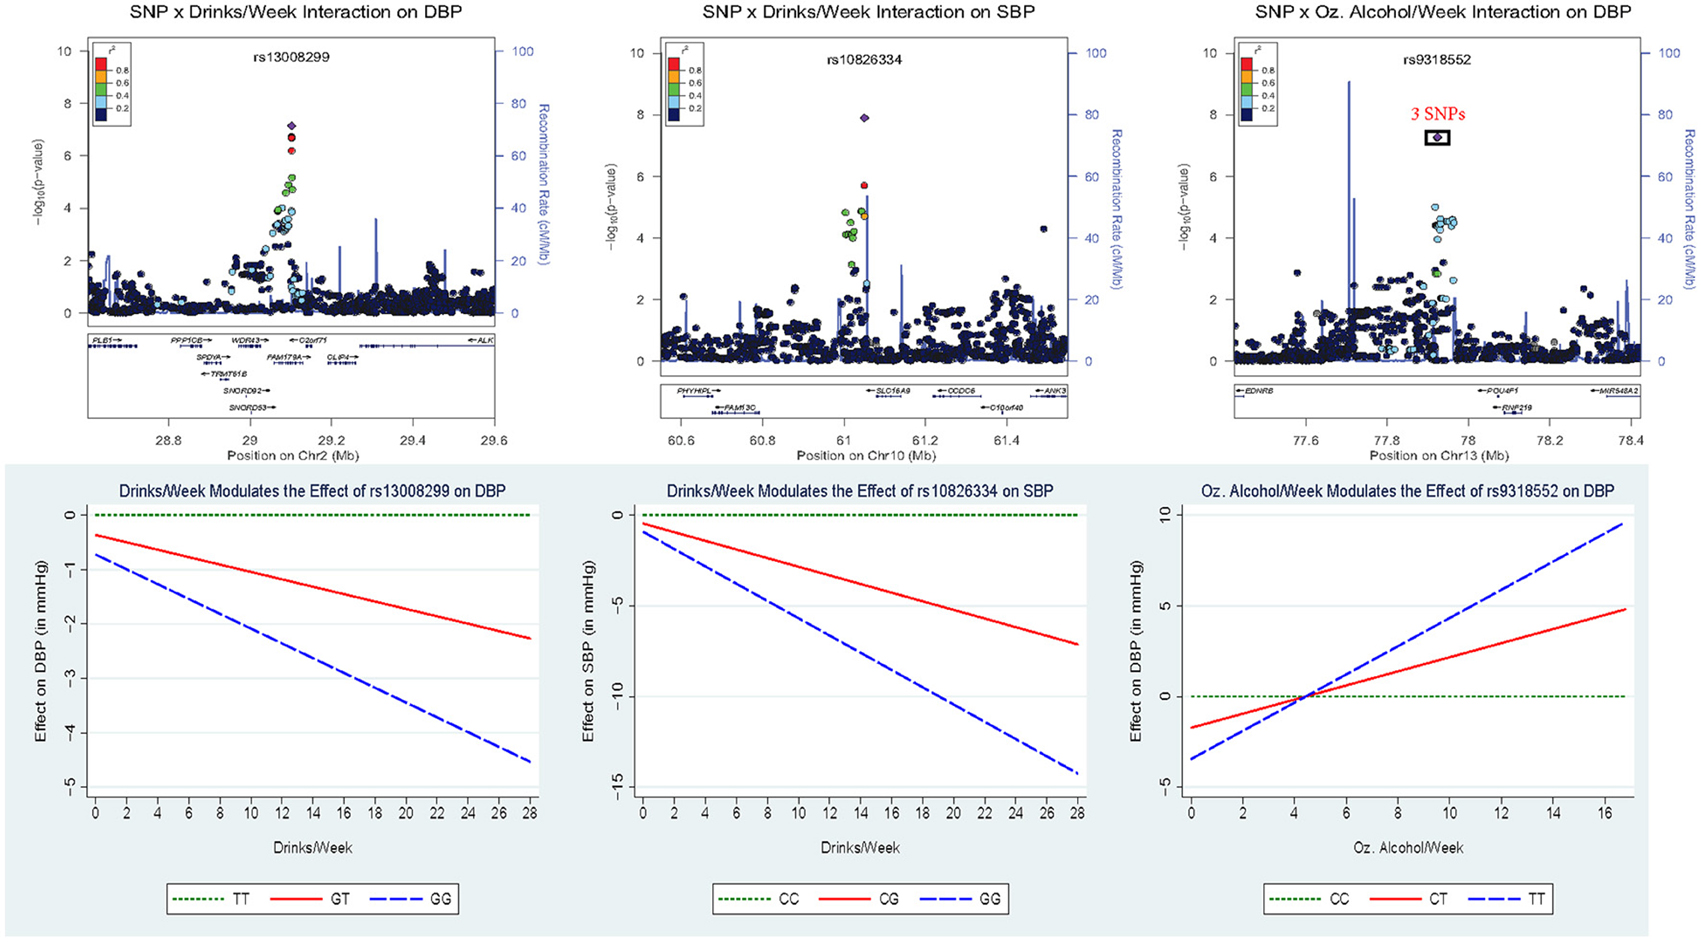
Figure 2. Regional association plots for the three loci with the strongest statistical evidence, as well as plots of the effect of the index SNP as a function of alcohol consumption. In the top panel, the p-value of the 2 df test is plotted vs. the chromosomal location (in basepairs) with the color scheme indicating the degree of linkage disequilibrium between each SNP and the index SNP (in purple). These regional plots were generated using LocusZoom (Pruim et al., 2010); rs9318552 was intronic to RNF219-AS1 but this gene was omitted from the plot. The bottom panel depicts the estimated effect of the index SNP as a function of alcohol consumption.
Four loci contained low-frequency (rs648425) and rare (rs16849553, rs7116456, rs16963349) variants with suggestive alcohol interactions but these garnered no supporting evidence from common SNPs in the area (see the regional association plots in Figures S8–S14). As shown in Table 3, these SNPs had large estimated effects on BP but also had large standard errors for these estimates. Three of these were intergenic but SNP rs16963349 was intronic to WAP four-disulfide core domain 1 (WFDC1), a possible tumor suppressor gene. Common variants in the remaining suggestive loci were harbored in or near estrogen-related receptor gamma (ESRRG), K (lysine) acetyltransferase 2B (KAT2B), adenylate cyclase 2 (brain) (ADCY2), GLI family zinc finger 3 (GLI3), zinc finger protein 716 (ZNF716), slit homolog 1 (Drosophila) (SLIT1), phosphodiesterase 3A, cGMP-inhibited (PDE3A), keratocan (KERA)—lumican (LUM), C-type lectin domain family 3, member A (CLEC3A), F-box protein 15 (FBXO15), and immunoglobulin superfamily, member 5 (IGSF5). The regional association plots for selected suggestive loci are shown in Figure 3.
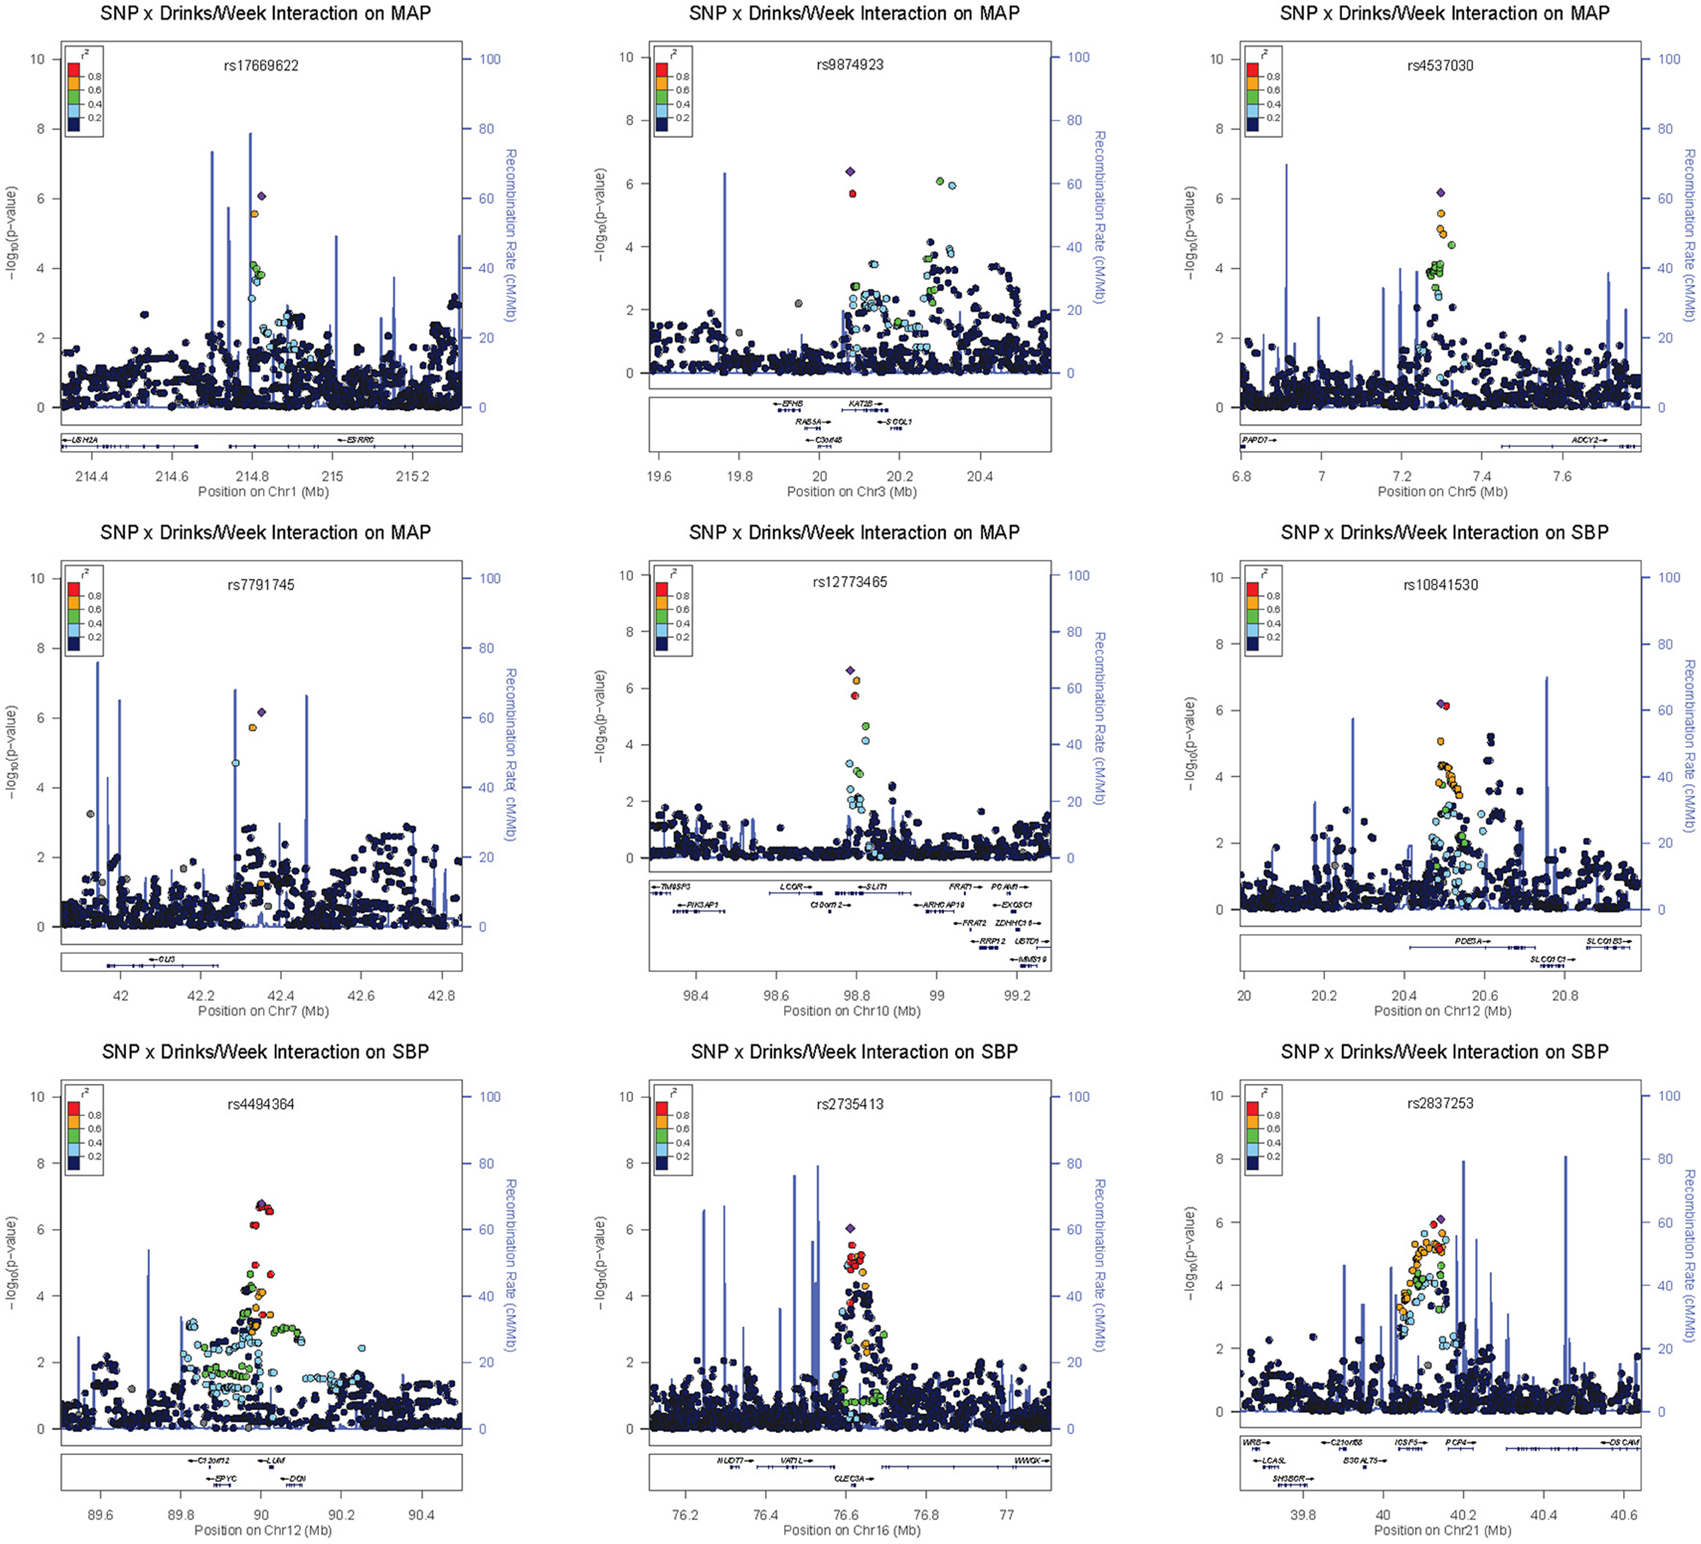
Figure 3. Regional association plots for selected suggestive loci.
Table 4 displays published BP, cardiovascular, alcohol drinking, and homocysteine/methionine metabolism associations located within ≈500 kb of our index SNPs. These results were collated from the NHGRI GWAS catalog (http://www.genome.gov/gwastudies), the dbGaP database (http://www.ncbi.nlm.nih.gov/projects/gapplusprev/sgap_plus.htm), and the integrated map on the NCBI SNP website (http://www.ncbi.nlm.nih.gov/snp/) on November 4, 2013. Three of our loci (represented by SNPs rs648425, rs7791745, and rs16963349 in the MGC27382-PTGFR, GLI3, and WFDC1 regions, respectively) were near significant (p ≤ 5E-08) BP associations identified in prior investigations of the Framingham Study (Levy et al., 2007). One additional locus (represented by two SNPs, rs12773465 and rs7902871, intronic to SLIT1) exhibited suggestive (p ≤ 1E-06) association in a prior Framingham analysis (Levy et al., 2007). SNP rs7791745 near GLI3 appears to represent a novel locus; the R2 measure of linkage disequilibrium between our index SNP and the previously associated SNP was less than 0.2 (Johnson et al., 2008; Pruim et al., 2010). No linkage disequilibrium information was available for the other three loci to determine if these represented novel BP-associated loci (Johnson et al., 2008; Pruim et al., 2010).
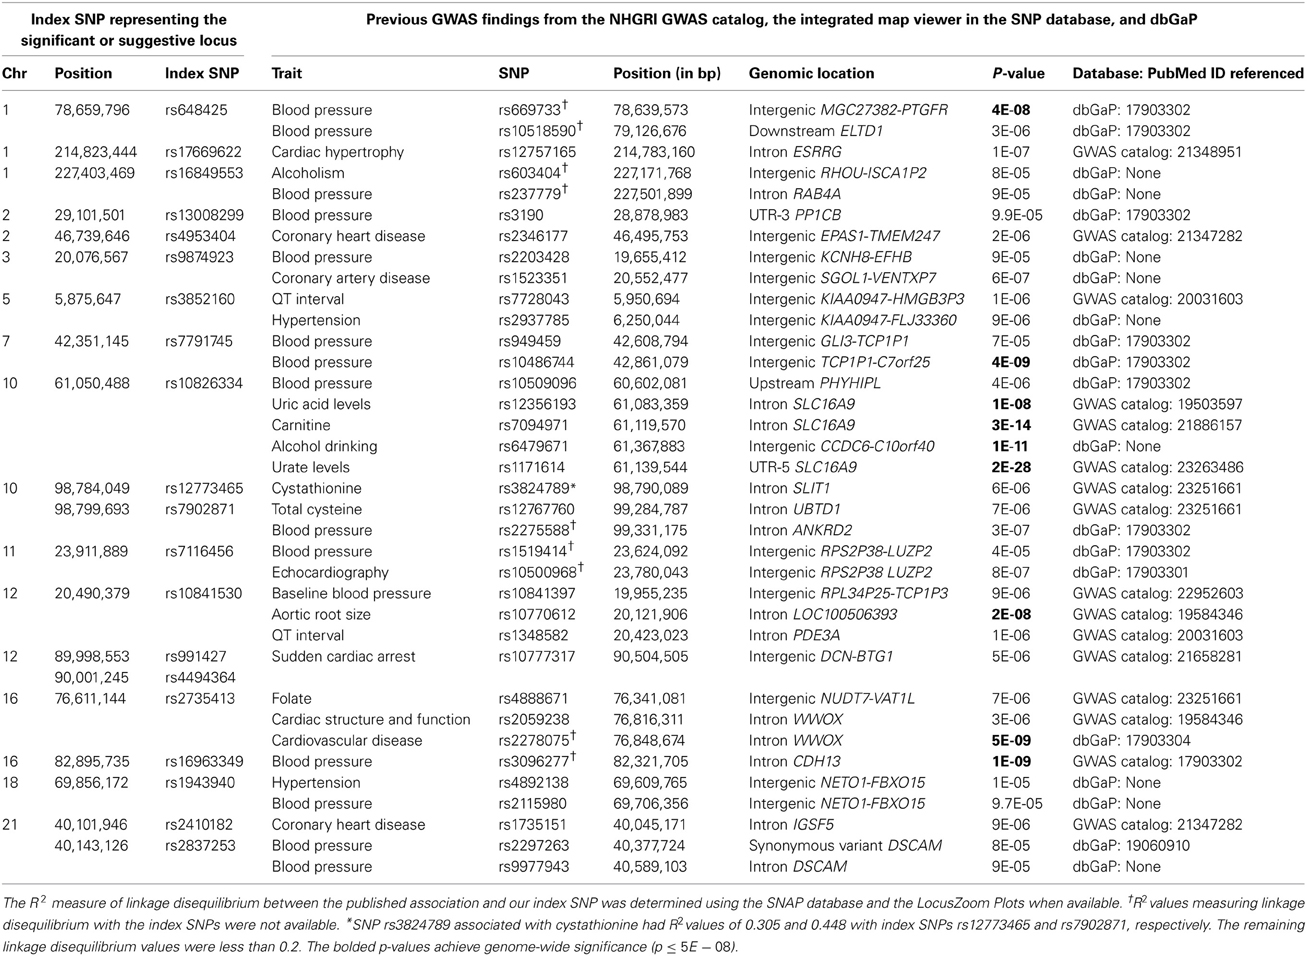
Table 4. Previous GWAS associations near our significant and suggestive loci.
Discussion
We identified one significant and twenty suggestive BP loci by exploiting gene-alcohol interactions in the analysis of 6882 participants from the FHS. Given that published GWAS with sample sizes up to 200,000 individuals have collectively identified fewer than 50 BP-associated loci, the identification of twenty-one candidate loci using interactions in a modest sized sample shows the promise of a more integrative gene and environment approach. Seventeen of these loci had failed to produce even suggestive evidence for BP in publicly-released findings from Framingham or other investigations. Our findings may also suggest why alcohol intake interventions may not reduce BP in all patients; some patients may be genetically susceptible to the effects of alcohol on BP and may experience the greatest BP changes with alcohol intake modifications, while others may have little genetic susceptibility and lack any marked BP response to alcohol consumption.
The interaction between alcohol and the significant locus near SLC16A9 is biologically plausible. The index SNP (rs10826334) from this locus was 33 kb away from a variant significantly associated with uric acid (Kolz et al., 2009); uric acid has been associated with hypertension in humans and animal models (Mazzali et al., 2001; Feig, 2011). Diets rich in alcohol increase serum uric acid levels (Schlesinger, 2005) which may subsequently influence the renin-angiotensin system and reduce nitric oxide synthase in the macula densa of the kidney (Mazzali et al., 2001; Soltani et al., 2013), thereby influencing BP. As shown in Table 4, further support for this locus is provided by two previously reported associations; index SNP rs10826334 was located between SNP rs6479671 significantly associated with alcohol drinking (317 kb away; p = 1E-11; see dbGaP database) and SNP rs10509096 weakly (448 kb away; p = 4E-06) associated with BP in a previous investigation using the Framingham Study (Levy et al., 2007).
The gene-alcohol interactions identified in this investigation may provide insights into mechanisms underlying BP regulation and generate hypotheses to be tested in animal models. For index SNP rs10826334 in the significant locus near SLC16A9, the change from the C to G allele changes potential GATA, NERF1a, and PU.1 transcription-factor-binding motifs (Ward and Kellis, 2012). Rats fed an ethanol-containing liquid diet for 3 weeks exhibited increased mRNA and protein levels of PU.1 in the proximal tibia (Iitsuka et al., 2012). Therefore, one potential mechanism is that alcohol consumption increases levels of PU.1, fostering increased binding for individuals with the PU.1 motif, and altering the expression of an unknown downstream BP-associated gene.
We learned several lessons from this investigation. First, incorporating gene-environment interactions (GEI) enhanced the discovery of variants with large effect sizes. Even among non-drinkers, the estimated effect sizes of three rare/low-frequency variants ranged from 2.28 to 7.28 mmHg per copy of the coded allele. For individuals consuming 14 drinks per week (or ~8.4 ounces of alcohol), variants from eight loci had effect sizes exceeding 2 mmHg per copy of the coded allele. For significant SNP rs10826334, each copy of the G allele decreased SBP by 3.79 mmHg in individuals consuming 14 drinks per week. SNP rs16963349 had the largest effect increasing SBP by 17.56 mmHg for each copy of the rare C allele among consumers of 14 drinks per week. This SNP (intronic to WFDC1) is 574 kb from a known BP variant in the cadherin 13 (CDH13) gene (Levy et al., 2007). Such large effect sizes based on alcohol consumption have been previously reported. For 60 year-old non-smoking apoE ε 2 carriers in Brazil, Leite et al reported that drinkers had a mean SBP 16.5 mmHg higher than non-drinkers whereas among apoE ε 4 carriers there was no difference by drinking status (Leite et al., 2013). In general, our effect estimates for the significant and suggestive variants were consistent with those from other populations. In older Chinese men that consumed alcohol, BP traits varied by as much as 3.5 mmHg based on the genotypes at SNPs in ADH2 and ALDH2 (Sen Zhang et al., 2013). In Japanese men that drank alcohol daily, the effect of a variant in the NADH2 gene was associated with a 4.77 mmHg increase in SBP (Kokaze et al., 2004). Thus, incorporating interactions between genes and environment in the analysis of sequence data may enhance effect sizes, and hence the statistical power, to discover BP variants from the whole allele frequency spectrum using reasonable sample sizes.
The second major lesson was that qualitative (“crossover”) interactions may be more pervasive than previously thought. We discovered twelve suggestive loci with interactions that changed direction of effect with alcohol consumption; in other words, alcohol consumption determined whether these variants increased or decreased BP. This further underscored the importance of incorporating GEI into genetic analyses. Omission of the SNP-alcohol interaction may mask the association between the genetic variant and BP (i.e., the effect of the SNP in drinkers may cancel out the effect of the SNP in non-drinkers) depending on the distribution of alcohol consumption in the sample. Perhaps part of the discordance of association results from previous BP studies can be attributed to differential distributions of environmental factors along with GEIs (Pan et al., 2010). For example, the CYP11B2 variant shown to interact with alcohol by Pan et al. (2010) yielded inconsistent results in previous studies of hypertension; some studies reported that the T allele was associated with hypertension risk while others concluded that the C allele or no alleles were associated with hypertension (Pan et al., 2010). The discovery of qualitative interactions also implies that recommendations concerning alcohol consumption and hypertension risk may need to be personalized based on genotype (Taylor et al., 2009; Green and Guyer, 2011) or focused on high-risk genetic subgroups (Hunter, 2005; Murcray et al., 2009; Thomas, 2010). The incorporation of interactions may increase the accuracy of models predicting individual hypertension risk (Yi, 2010; Chang et al., 2012) and may increase the proportion of BP variance explained by current GWAS findings.
The third lesson was that we cannot discount the impact of the sample size and age distribution on the consistency of findings across alcohol measures. The sample size roughly doubled, and the average age decreased by 12 years, when the Third Generation cohort was added to the other two cohorts for the drinks per week analysis; this analysis identified 15 loci that appeared to interact with alcohol as evidenced by at least suggestive evidence for the 2 df test and nominal (p-value ≤ 0.05) significance for the 1 df interaction test. Of these 15 loci that interacted with the number of drinks consumed per week: three loci (represented by rs10826334, rs991427/rs4494364, and rs2410182/rs2837253) were also significant or suggestive for ounces of alcohol per week on the same BP trait; four loci (represented by rs13008299, rs7116456, rs2735413, and rs1943940) had p-values less than 1E-04 for at least one of the other two alcohol measures (with p-value ranks of 25–164 out of the roughly 2.5 million SNPs ordered smallest to largest for that alcohol measure); three loci (represented by rs648425, rs10841530, rs9874923) contained SNPs with p-values less than 1E-04 for a different alcohol measure in the 500 kilobase region to each side of the sentinel SNP; and one locus (represented by rs16963349) was so rare that association tests could not be performed using the smaller sample sizes from the ounces of alcohol consumed per week or the days drinking per week analyses.
There were a few limitations in this investigation. Alcohol consumption may have been underreported, a phenomenon common among excessive drinkers. The number of drinks per week, the alcohol measure available in the greatest number of participants, is imprecise due to the variability of ethanol content by alcoholic beverage type (beer, wine, hard liquor, etc.). Our analysis was largely restricted to individuals of European ancestry; race was not collected in the Original Cohort and 20% of the Offspring Cohort, thus race was missing for 9.8% of the 6882 individuals analyzed. In addition, one participant reported a non-Caucasian race in the ounces of alcohol consumed per week and days drinking alcohol per week subsamples, with 58 individuals (from 44 families that also contained 1146 Caucasian participants) reporting non-Caucasian races in the drinks per week sample. We analyzed all individuals but adjusted for population stratification through the genomic control method. Candidate gene studies in Japanese, Chinese, and Brazilian populations have reported gene-alcohol interactions (Kokaze et al., 2004, 2007; Pan et al., 2010; Chang et al., 2012; Chen et al., 2013; Leite et al., 2013; Nakagawa et al., 2013; Sen Zhang et al., 2013; Wang et al., 2013). Thus, by broadening the investigation of interactions between alcohol and genes to other ethnic groups, we may be able to capitalize on population-specific variants, different distributions of alcohol consumption, and different linkage disequilibrium patterns. We adjusted for antihypertensive use as a dichotomous yes/no predictor; the type of medication, as well as the genetic composition of an individual, may determine the treatment response. In our investigation, the 1 df interaction test suffered from substantial genomic inflation. The genomic control method we used to correct the 1 df interaction tests appeared to overcorrect the tail of the p-value distribution which should harbor true associations (see Figures S4–S7). Thus, we were overly conservative, potentially missing some real associations. Likewise, by not adjusting the 2 df test we may be reporting false positives.
Although we restricted this analysis to a single visit from each participant, we plan on following up with a longitudinal analysis of gene-alcohol interactions using the Framingham SHARe data. All our findings, both the cross-sectional and longitudinal, require further validation and replication in an independent sample. Lastly, we did not account for genetic variants influencing alcohol metabolism (particularly ADH2, ALDH2). Different variants of the ADH and ALDH enzymes work at different efficiencies, thereby determining the concentration of intermediate metabolites such as acetaldehyde in the body following a given amount of ethanol consumption. A slow ALDH enzyme can cause acetaldehyde accumulation compared to the wild-type ALDH variant (National Institute on Alcohol Abuse and Alcoholism, 2007). Thus, by testing SNP-alcohol interactions in individuals with and without the slow ALDH variants, we can test whether the interaction effects of the novel variants are larger when acetaldehyde accumulates. This may help refine the metabolite or mechanism through which the alcohol interactions are occurring.
In summary, reliance on genetic main effects may impede discovery of novel variants with large effects that can be targeted with lifestyle modifications. GEIs have to potential to increase the clinical translatability of genetic findings and elucidate mechanisms underlying BP regulation.
Author Contributions
Concept and design (Jeannette Simino, Yun Ju Sung, D. C. Rao), acquisition from dbGaP and assembly of analysis data (Karen Schwander), data analysis (Rezart Kume and Yun Ju Sung), interpretation of results (all authors), manuscript writing (Jeannette Simino, Rezart Kume), and final review and approval of the manuscript (all authors).
Conflict of Interest Statement
The authors declare that the research was conducted in the absence of any commercial or financial relationships that could be construed as a potential conflict of interest.
Acknowledgments
We thank all participants of the Framingham Heart Study for their dedication to cardiovascular health research. Our investigation was supported by grant R01 HL107552 from the National Heart, Lung, and Blood Institute (NHLBI). The Framingham Heart Study is conducted and supported by the NHLBI in collaboration with Boston University (Contract No. N01-HC-25195). Funding for SHARe Affymetrix genotyping was provided by NHLBI Contract N02-HL-64278. This manuscript was not prepared in collaboration with investigators of the Framingham Heart Study and does not necessarily reflect the opinions or views of the Framingham Heart Study, Boston University, or NHLBI.
Supplementary Material
The Supplementary Material for this article can be found online at: http://www.frontiersin.org/journal/10.3389/fgene.2013.00277/abstract
Figure S4. Quantile-quantile plots of the 1 df SNP-alcohol interaction tests for SBP. Plots are presented for all three alcohol measures (drinks per week, days drinking per week, and ounces of alcohol per week) before and after the genomic control adjustment.
Figure S5. Quantile-quantile plots of the 1 df SNP-alcohol interaction tests for DBP. Plots are presented for all three alcohol measures (drinks per week, days drinking per week, and ounces of alcohol per week) before and after the genomic control adjustment.
Figure S6. Quantile-quantile plots of the 1 df SNP-alcohol interaction tests for MAP. Plots are presented for all three alcohol measures (drinks per week, days drinking per week, and ounces of alcohol per week) before and after the genomic control adjustment.
Figure S7. Quantile-quantile plots of the 1 df SNP-alcohol interaction tests for PP. Plots are presented for all three alcohol measures (drinks per week, days drinking per week, and ounces of alcohol per week) before and after the genomic control adjustment.
Figure S8–S14. Regional association plots for loci with suggestive or significant associations by the 1 df interaction test or the joint 2 df test. Plots are ordered by chromosome and position, with symbol color indicating the strength of the linkage disequilibrium (r-squared value) between the plotted SNP and the index SNP.
References
Adeyemo, A., Gerry, N., Chen, G., Herbert, A., Doumatey, A., Huang, H., et al. (2009). A genome-wide association study of hypertension and blood pressure in African Americans. PLoS Genet. 5:e1000564. doi: 10.1371/journal.pgen.1000564
Alegria-Torres, J. A., Baccarelli, A., and Bollati, V. (2011). Epigenetics and lifestyle. Epigenomics 3, 267–277. doi: 10.2217/epi.11.22
Aulchenko, Y. S., Ripke, S., Isaacs, A., and van Duijn, C. M. (2007). GenABEL: an R library for genome-wide association analysis. Bioinformatics 23, 1294–1296. doi: 10.1093/bioinformatics/btm108
Aulchenko, Y. S., Struchalin, M. V., and Van Duijn, C. M. (2010). ProbABEL package for genome-wide association analysis of imputed data. BMC Bioinformatics 11:134. doi: 10.1186/1471-2105-11-134
Chang, Y. C., Chiu, Y. F., Lee, I. T., Ho, L. T., Hung, Y. J., Hsiung, C. A., et al. (2012). Common ALDH2 genetic variants predict development of hypertension in the SAPPHIRe prospective cohort: gene-environmental interaction with alcohol consumption. BMC Cardiovasc. Disord. 12:58. doi: 10.1186/1471-2261-12-58
Chen, S., Lu, X., Zhao, Q., Wang, L., Li, H., and Huang, J. (2013). Association of adrenomedullin gene polymorphisms and blood pressure in a Chinese population. Hypertens. Res. 36, 74–78. doi: 10.1038/hr.2012.132
Dawber, T. R., Meadors, G. F., and Moore, F. E. Jr. (1951). Epidemiological approaches to heart disease: the Framingham Study. Am. J. Public Health Nations. Health 41, 279–281. doi: 10.2105/AJPH.41.3.279
Devlin, B., and Roeder, K. (1999). Genomic control for association studies. Biometrics 55, 997–1004. doi: 10.1111/j.0006-341X.1999.00997.x
Ehret, G. B., Munroe, P. B., Rice, K. M., Bochud, M., Johnson, A. D., Chasman, D. I., et al. (2011). Genetic variants in novel pathways influence blood pressure and cardiovascular disease risk. Nature 478, 103–109. doi: 10.1038/nature10405
Feig, D. I. (2011). Uric acid and hypertension. Semin. Nephrol. 31, 441–446. doi: 10.1016/j.semnephrol.2011.08.008
Feinleib, M., Kannel, W. B., Garrison, R. J., McNamara, P. M., and Castelli, W. P. (1975). The Framingham Offspring Study. Design and preliminary data. Prev. Med. 4, 518–525. doi: 10.1016/0091-7435(75)90037-7
Finkel, T. (2011). Signal transduction by reactive oxygen species. J. Cell Biol. 194, 7–15. doi: 10.1083/jcb.201102095
Fox, E. R., Young, J. H., Li, Y., Dreisbach, A. W., Keating, B. J., Musani, S. K., et al. (2011). Association of genetic variation with systolic and diastolic blood pressure among African Americans: the Candidate Gene Association Resource study. Hum. Mol. Genet. 20, 2273–2284. doi: 10.1093/hmg/ddr092
Fuchs, F. D., Chambless, L. E., Whelton, P. K., Nieto, F. J., and Heiss, G. (2001). Alcohol consumption and the incidence of hypertension: the Atherosclerosis Risk in Communities Study. Hypertension 37, 1242–1250. doi: 10.1161/01.HYP.37.5.1242
Go, A. S., Mozaffarian, D., Roger, V. L., Benjamin, E. J., Berry, J. D., Borden, W. B., et al. (2013). Heart disease and stroke statistics–2013 update: a report from the American Heart Association. Circulation 127, e6–e245. doi: 10.1161/CIR.0b013e318282ab8f
Green, E. D., and Guyer, M. S. (2011). Charting a course for genomic medicine from base pairs to bedside. Nature 470, 204–213. doi: 10.1038/nature09764
Guo, Y., Tomlinson, B., Chu, T., Fang, Y. J., Gui, H., Tang, C. S., et al. (2012). A genome-wide linkage and association scan reveals novel loci for hypertension and blood pressure traits. PLoS ONE 7:e31489. doi: 10.1371/journal.pone.0031489
Ho, J. E., Levy, D., Rose, L., Johnson, A. D., Ridker, P. M., and Chasman, D. I. (2011). Discovery and replication of novel blood pressure genetic loci in the Women's Genome Health Study. J. Hypertens. 29, 62–69. doi: 10.1097/HJH.0b013e3283406927
Hunter, D. J. (2005). Gene-environment interactions in human diseases. Nat. Rev. Genet. 6, 287–298. doi: 10.1038/nrg1578
Iitsuka, N., Hie, M., Nakanishi, A., and Tsukamoto, I. (2012). Ethanol increases osteoclastogenesis associated with the increased expression of RANK, PU.1 and MITF in vitro and in vivo. Int. J. Mol. Med. 30, 165–172. doi: 10.3892/ijmm.2012.974
Johnson, A. D., Handsaker, R. E., Pulit, S. L., Nizzari, M. M., O'Donnell, C. J., and de Bakker, P. I. (2008). SNAP: a web-based tool for identification and annotation of proxy SNPs using HapMap. Bioinformatics 24, 2938–2939. doi: 10.1093/bioinformatics/btn564
Kato, N., Takeuchi, F., Tabara, Y., Kelly, T. N., Go, M. J., Sim, X., et al. (2011). Meta-analysis of genome-wide association studies identifies common variants associated with blood pressure variation in east Asians. Nat. Genet. 43, 531–538. doi: 10.1038/ng.834
Klatsky, A. L., and Gunderson, E. (2008). Alcohol and hypertension: a review. J. Am. Soc. Hypertens. 2, 307–317. doi: 10.1016/j.jash.2008.03.010
Kodavali, L., and Townsend, R. R. (2006). Alcohol and its relationship to blood pressure. Curr. Hypertens. Rep. 8, 338–344. doi: 10.1007/s11906-006-0074-z
Kokaze, A., Ishikawa, M., Matsunaga, N., Yoshida, M., Satoh, M., Teruya, K., et al. (2007). NADH dehydrogenase subunit-2 237 Leu/Met polymorphism modifies the effects of alcohol consumption on risk for hypertension in middle-aged Japanese men. Hypertens. Res. 30, 213–218. doi: 10.1291/hypres.30.213
Kokaze, A., Ishikawa, M., Matsunaga, N., Yoshida, M., Sekine, Y., Sekiguchi, K., et al. (2004). Longevity-associated mitochondrial DNA 5178 A/C polymorphism and blood pressure in the Japanese population. J. Hum. Hypertens. 18, 41–45. doi: 10.1038/sj.jhh.1001632
Kolz, M., Johnson, T., Sanna, S., Teumer, A., Vitart, V., Perola, M., et al. (2009). Meta-analysis of 28,141 individuals identifies common variants within five new loci that influence uric acid concentrations. PLoS Genet. 5:e1000504. doi: 10.1371/journal.pgen.1000504
Leite, M. L., Moriguchi, E. H., and Lima-Costa, M. F. (2013). Interactive effects of ApoE polymorphism, alcohol and smoking on age-related trends of blood pressure levels in elderly men: the Bambui cohort study of ageing (1997–2008). J. Hum. Hypertens. 27, 497–503. doi: 10.1038/jhh.2012.70
Levy, D., Ehret, G. B., Rice, K., Verwoert, G. C., Launer, L. J., Dehghan, A., et al. (2009). Genome-wide association study of blood pressure and hypertension. Nat. Genet. 41, 677–687. doi: 10.1038/ng.384
Levy, D., Larson, M. G., Benjamin, E. J., Newton-Cheh, C., Wang, T. J., Hwang, S. J., et al. (2007). Framingham Heart Study 100K Project: genome-wide associations for blood pressure and arterial stiffness. BMC Med. Genet. 8(Suppl. 1):S3. doi: 10.1186/1471-2350-8-S1-S3
Lorenti Garcia, C., Mechilli, M., Proietti De Santis, L., Schinoppi, A., Kobos, K., and Palitti, F. (2009). Relationship between DNA lesions, DNA repair and chromosomal damage induced by acetaldehyde. Mutat. Res. 662, 3–9. doi: 10.1016/j.mrfmmm.2008.11.008
Mazzali, M., Hughes, J., Kim, Y. G., Jefferson, J. A., Kang, D. H., Gordon, K. L., et al. (2001). Elevated uric acid increases blood pressure in the rat by a novel crystal-independent mechanism. Hypertension 38, 1101–1106. doi: 10.1161/hy1101.092839
Murcray, C. E., Lewinger, J. P., and Gauderman, W. J. (2009). Gene-environment interaction in genome-wide association studies. Am. J. Epidemiol. 169, 219–226. doi: 10.1093/aje/kwn353
Nakagawa, T., Kajiwara, A., Saruwatari, J., Hamamoto, A., Kaku, W., Oniki, K., et al. (2013). The combination of mitochondrial low enzyme-activity aldehyde dehydrogenase 2 allele and superoxide dismutase 2 genotypes increases the risk of hypertension in relation to alcohol consumption. Pharmacogenet. Genomics 23, 34–37. doi: 10.1097/FPC.0b013e32835b1707
National Institute on Alcohol Abuse and Alcoholism, National Institutes of Health, and Services, U.D.O.H.A.H. (2007). Alcohol metabolism: an update. Alcohol Alert 72, 1–6. Available online at: http://pubs.niaaa.nih.gov/publications/AA72/AA72.pdf
Newton-Cheh, C., Johnson, T., Gateva, V., Tobin, M. D., Bochud, M., Coin, L., et al. (2009). Genome-wide association study identifies eight loci associated with blood pressure. Nat. Genet. 41, 666–676. doi: 10.1038/ng.361
Padmanabhan, S., Melander, O., Johnson, T., Di Blasio, A. M., Lee, W. K., Gentilini, D., et al. (2010). Genome-wide association study of blood pressure extremes identifies variant near UMOD associated with hypertension. PLoS Genet. 6:e1001177. doi: 10.1371/journal.pgen.1001177
Pan, W., Basu, S., and Shen, X. (2011). Adaptive tests for detecting gene-gene and gene-environment interactions. Hum. Hered. 72, 98–109. doi: 10.1159/000330632
Pan, X. Q., Zhang, Y. H., Liu, Y. Y., and Tong, W. J. (2010). Interaction between the C(-344)T polymorphism of CYP11B2 and alcohol consumption on the risk of essential hypertension in a Chinese Mongolian population. Eur. J. Epidemiol. 25, 813–821. doi: 10.1007/s10654-010-9504-y
Polonikov, A. V., Solodilova, M. A., Ivanov, V. P., Shestakov, A. M., Ushachev, D. V., Vialykh, E. K., et al. (2011). [A protective effect of GLY272SER polymorphism of GNB3 gene in development of essential hypertension and its relations with environmental hypertension risk factors]. Ter. Arkh. 83, 55–60.
Pruim, R. J., Welch, R. P., Sanna, S., Teslovich, T. M., Chines, P. S., Gliedt, T. P., et al. (2010). LocusZoom: regional visualization of genome-wide association scan results. Bioinformatics 26, 2336–2337. doi: 10.1093/bioinformatics/btq419
Roger, V. L., Go, A. S., Lloyd-Jones, D. M., Benjamin, E. J., Berry, J. D., Borden, W. B., et al. (2012). Heart disease and stroke statistics–2012 update: a report from the American Heart Association. Circulation 125, e2–e220. doi: 10.1161/CIR.0b013e31823ac046
Schlesinger, N. (2005). Dietary factors and hyperuricaemia. Curr. Pharm. Des. 11, 4133–4138. doi: 10.2174/138161205774913273
Sen Zhang, W., Xu, L., Mary Schooling, C., Jiang, C. Q., Keung Cheng, K., Liu, B., et al. (2013). Effect of alcohol and aldehyde dehydrogenase gene polymorphisms on alcohol-associated hypertension: the Guangzhou Biobank Cohort Study. Hypertens. Res. 36, 741–746. doi: 10.1038/hr.2013.23
Sober, S., Org, E., Kepp, K., Juhanson, P., Eyheramendy, S., Gieger, C., et al. (2009). Targeting 160 candidate genes for blood pressure regulation with a genome-wide genotyping array. PLoS ONE 4:e6034. doi: 10.1371/journal.pone.0006034
Soltani, Z., Rasheed, K., Kapusta, D. R., and Reisin, E. (2013). Potential role of uric acid in metabolic syndrome, hypertension, kidney injury, and cardiovascular diseases: is it time for reappraisal? Curr. Hypertens. Rep. 15, 175–181. doi: 10.1007/s11906-013-0344-5
Splansky, G. L., Corey, D., Yang, Q., Atwood, L. D., Cupples, L. A., Benjamin, E. J., et al. (2007). The Third Generation Cohort of the National Heart, Lung, and Blood Institute's Framingham Heart Study: design, recruitment, and initial examination. Am. J. Epidemiol. 165, 1328–1335. doi: 10.1093/aje/kwm021
Taylor, J. Y., Maddox, R., and Wu, C. Y. (2009). Genetic and environmental risks for high blood pressure among African American mothers and daughters. Biol. Res. Nurs. 11, 53–65. doi: 10.1177/1099800409334817
Thomas, D. (2010). Gene-environment-wide association studies: emerging approaches. Nat. Rev. Genet. 11, 259–272. doi: 10.1038/nrg2764
Wain, L. V., Verwoert, G. C., O'Reilly, P. F., Shi, G., Johnson, T., Johnson, A. D., et al. (2011). Genome-wide association study identifies six new loci influencing pulse pressure and mean arterial pressure. Nat. Genet. 43, 1005–1011. doi: 10.1038/ng.922
Wang, Y., Zhang, Y., Zhang, J., Tang, X., Qian, Y., Gao, P., et al. (2013). Association of a functional single-nucleotide polymorphism in the ALDH2 gene with essential hypertension depends on drinking behavior in a Chinese Han population. J. Hum. Hypertens. 27, 181–186. doi: 10.1038/jhh.2012.15
Ward, L. D., and Kellis, M. (2012). HaploReg: a resource for exploring chromatin states, conservation, and regulatory motif alterations within sets of genetically linked variants. Nucleic Acids Res. 40, D930–D934. doi: 10.1093/nar/gkr917
Wigginton, J. E., and Abecasis, G. R. (2005). PEDSTATS: descriptive statistics, graphics and quality assessment for gene mapping data. Bioinformatics 21, 3445–3447. doi: 10.1093/bioinformatics/bti529
Xin, X., He, J., Frontini, M. G., Ogden, L. G., Motsamai, O. I., and Whelton, P. K. (2001). Effects of alcohol reduction on blood pressure: a meta-analysis of randomized controlled trials. Hypertension 38, 1112–1117. doi: 10.1161/hy1101.093424
Yi, N. (2010). Statistical analysis of genetic interactions. Genet. Res. (Camb.) 92, 443–459. doi: 10.1017/S0016672310000595
Zakhari, S. (2013). Alcohol metabolism and epigenetics changes. Alcohol Res. Curr. Rev. 35, 6–17. Available online at: http://pubs.niaaa.nih.gov/publications/arcr351/6-16.pdf
Keywords: blood pressure, hypertension, alcohol, genome-wide, gene-alcohol interactions, gene-lifestyle interactions, interaction, GWAS
Citation: Simino J, Sung YJ, Kume R, Schwander K and Rao DC (2013) Gene-alcohol interactions identify several novel blood pressure loci including a promising locus near SLC16A9. Front. Genet. 4:277. doi: 10.3389/fgene.2013.00277
Received: 31 August 2013; Accepted: 22 November 2013;
Published online: 12 December 2013.
Edited by:
Xuefeng Wang, Harvard University, USAReviewed by:
Li Zhang, University of California, San Francisco, USARicardo De Matos Simoes, Queens University Belfast, UK
Copyright © 2013 Simino, Sung, Kume, Schwander and Rao. This is an open-access article distributed under the terms of the Creative Commons Attribution License (CC BY). The use, distribution or reproduction in other forums is permitted, provided the original author(s) or licensor are credited and that the original publication in this journal is cited, in accordance with accepted academic practice. No use, distribution or reproduction is permitted which does not comply with these terms.
*Correspondence: Jeannette Simino, Division of Biostatistics, Washington University School of Medicine, 660 South Euclid Avenue, Campus Box 8067, St. Louis, MO 63110-1093, USA e-mail: jeannette@wubios.wustl.edu