Ancient DNA From Museum Specimens and Next Generation Sequencing Help Resolve the Controversial Evolutionary History of the Critically Endangered Puebla Deer Mouse
 Susette Castañeda-Rico
 Livia León-Paniagua
 Cody W. Edwards
 Jesús E. Maldonado
- 1Center for Conservation Genomics, Smithsonian’s National Zoo & Conservation Biology Institute, Washington, DC, United States
- 2Department of Biology, George Mason University, Fairfax, VA, United States
- 3Smithsonian-Mason School of Conservation, Front Royal, VA, United States
- 4Departamento de Biología Evolutiva, Facultad de Ciencias, Universidad Nacional Autónoma de México, Mexico City, Mexico
Key insights into the evolutionary history of recently extinct or critically endangered species can be obtained through analysis of genomic data collected using high-throughput sequencing and ancient DNA from museum specimens, particularly where specimens are rare. For instance, the evolutionary history of the critically endangered Puebla deer mouse, Peromyscus mekisturus, remains unclear due to discordance between morphological and molecular phylogenetic analyses. However, previous molecular analyses were based on PCR and Sanger sequencing of only a few mitochondrial genes. Here, we used ancient DNA from historical museum specimens followed by target enrichment and high-throughput sequencing of several thousand nuclear ultraconserved elements and whole mitochondrial genomes to test the validity of the previous phylogenetic placement of P. mekisturus. Based on UCEs and mitogenomes, our results revealed that P. mekisturus forms a well-supported distinct lineage outside the clade containing all other members of the Peromyscus melanophrys group. Additionally, the mitogenome phylogeny further supports the placement of P. mekisturus as the sister species of the genus Reithrodontomys. This conflicts with the previous mtDNA phylogenetic reconstruction, in which P. mekisturus was nested within the species P. melanophrys. Our study demonstrates that high-throughput sequencing of ancient DNA, appropriately controlling for contamination and degradation, can provide a robust resolution of the evolutionary history and taxonomic status of species for which few or no modern genetic samples exist. In light of our results and pending further analysis with denser taxon sampling and the addition of morphological data, a re-evaluation of the taxonomy and conservation management plans of P. mekisturus is needed to ensure that the evolutionary distinctiveness of this species is recognized in future conservation efforts.
Introduction
Scientific collections are unique repositories of biodiversity. They preserve and make accessible specimens that capture variation across taxonomic boundaries, space, and time (Webster, 2018). The specimens deposited in museums allow us to study demographic changes of populations through space and time, including those of extinct species. These specimens also provide a historical context to examine patterns of genetic variation and offer direct measures of evolutionary processes (Burrell et al., 2015; Buerki and Baker, 2016). Genetic studies incorporating natural history collections also allow us to study rare or critically endangered species. Some of these species remain poorly understood due to the scarcity of samples, either because small population sizes make them difficult to find or because they have become extinct in the wild.
Despite their enormous potential, museum specimens are difficult to work with because of postmortem DNA fragmentation and damage. Additionally, the relationship between specimen age and DNA fragmentation is not linear, and even some recently collected samples (<20 years) can have highly fragmented DNA (Zimmermann et al., 2008; Allentoft et al., 2012; Sawyer et al., 2012; Burrell et al., 2015). DNA quality and quantity may be more strongly influenced by preservation methods, storage conditions, the type of tissue targeted, or how quickly the sample was desiccated than to the age of the specimen itself (Pääbo, 1989; Casas-Marce et al., 2010; Mason et al., 2011). Despite these challenges, museum specimens represent a unique repository of valuable information, making it worthwhile to unlock their potential with novel genomic protocols.
These novel genomic methods have spurred a renaissance in studies of natural history collections. Scientists have been studying ancient DNA for more than three decades, but the advent of high-throughput (HT) or next-generation sequencing (NGS) has made the process of sequencing ancient DNA from both model and non-model organisms much easier (Church, 2006; Lemmon and Lemmon, 2013; Hawkins et al., 2016a,b; McCormack et al., 2017; McDonough et al., 2018; Webster, 2018). The improvement is reflected by decreasing the cost and increasing the efficiency of genomic data collection by several orders of magnitude (Lemmon and Lemmon, 2013; Buerki and Baker, 2016; McCormack et al., 2017). NGS methods like sequence capture or target enrichment have been changing the field of phylogenetics and are especially well-suited for sequencing ancient DNA or other degraded samples. This method involves hybridizing genomic DNA to biotinylated DNA or RNA ‘baits’ present in solution and then washing away unbound, non-target DNA. The result is a DNA solution enriched for specific targets that can then be sequenced using NGS platforms (Burrell et al., 2015). Using sequence capture, researchers can focus sequencing efforts on loci useful for their particular genomic scope, enabling them to increase the number of taxa or samples that can be processed, analyze samples that were difficult to use in the past, and improve phylogenetic resolution (Lemmon and Lemmon, 2013). Filling gaps in the tree of life should significantly improve topological and branch-length estimation and will also allow more accurate biogeographical reconstructions (Buerki and Baker, 2016).
Members of the rodent genus Peromyscus are commonly referred to as deer mice. Peromyscus is the most common and speciose genus within the subfamily Neotominae. This genus comprises more than 70 new world species that diverged within the last 6–10 million years (Platt et al., 2015). Despite intensive and extensive studies of this genus, understanding its phylogenetic relationships has been difficult. Phylogenetic studies have suggested that the genus Peromyscus is paraphyletic, including Habromys, Isthmomys, Megadontomys, Neotomodon, Osgoodomys, and Podomys at the generic (sensu stricto) or subgeneric (sensu lato) level (Bradley et al., 2007; Miller and Engstrom, 2008; Platt et al., 2015; Sullivan et al., 2017). The large number of species, both described and undescribed, as well as the cryptic variation present in the group, have yielded numerous distinct phylogenetic hypotheses (Sullivan et al., 2017). Osgood (1909) placed related species into monophyletic species groups based mainly on morphological similarities. At present, several lines of evidence support the recognition of 13 Peromyscus species groups (Carleton, 1989; Hogan et al., 1993; Musser and Carleton, 1993, 2005, Dawson, 2005; Bradley et al., 2007). However, the composition of the groups has been modified several times based on new evidence and many of the species have been re-categorized (Carleton, 1989; Riddle et al., 2000; Álvarez-Castañeda and González-Ruiz, 2008).
The Peromyscus melanophrys group, endemic to México, comprises three species: Peromyscus melanophrys, P. perfulvus, and P. mekisturus (Osgood, 1909; Carleton, 1989; Musser and Carleton, 1993, 2005; Bradley et al., 2007; Castañeda-Rico et al., 2014). Recent field surveys searching for additional specimens of P. mekisturus have failed, suggesting that this species is likely extinct or close to extinction. To date, only one Sanger sequencing-based study has included all three species in phylogenetic analyses. Castañeda-Rico et al. (2014) analyzed all three species using the ND3, tRNA-Arg, ND4L, and partial ND4 mitochondrial genes. However, owing to the degraded condition of the P. mekisturus specimen (collected in 1947), only P. melanophrys and P. perfulvus samples produced sequences of the nuclear gene (GHR). Castañeda-Rico et al. (2014) found that the three species form a monophyletic group, which is concordant with long-standing morphology-based taxonomic hypotheses (Osgood, 1909; Carleton, 1989; Musser and Carleton, 1993, 2005). Critically, the Sanger sequencing data placed the single P. mekisturus specimen within a clade where all of the other samples are considered to be P. melanophrys, which contrasts with morphological evidence that supports all three groups as distinct species (Osgood, 1909; Carleton, 1989; Musser and Carleton, 1993, 2005).
Given the discrepancy between the morphological data and the molecular data based on Sanger sequencing, we aimed to test whether we could corroborate the previous phylogenetic hypothesis proposed by Castañeda-Rico et al. (2014) by using NGS methods to obtain dense nuclear and mitochondrial datasets for P. mekisturus and the other members of the Peromyscus melanophrys species group. Crucially, since P. mekisturus is only known from two specimens—Merriam (1898) holotype from Chalchicomula, and Hooper’s (1947) record from Tehuacán, both in Puebla, México—its phylogenetic position can only be resolved by denser sequencing of the genomes of the specimens in hand. Recent developments in NGS technology and ancient DNA protocols offer a huge advantage for rare and under-collected species such as this one, where sometimes only their holotypes are known to science.
Materials and Methods
Sampling and Lab Work
We sampled six museum specimens deposited in scientific collections in México and the United States (Table 1). We followed strict protocols to avoid contamination during sampling, including the use of a new disposable scalpel blade and gloves for each specimen, and bleaching 50% household bleach (5.25% sodium hypochlorite solution) followed by rinsing with HPLC-grade water of all work surfaces and utensils prior to each use (McDonough et al., 2018). We performed all laboratory work at the ancient DNA facilities at the Center for Conservation Genomics (CCG), Smithsonian Conservation Biology Institute, Washington, DC. We extracted genomic DNA from one tissue sample from each of the six specimens, including Peromyscus melanophrys, P. perfulvus, P. mekisturus, P. mexicanus, P. eremicus, and Habromys simulatus. The last three species were included as outgroups, following Castañeda-Rico et al. (2014).
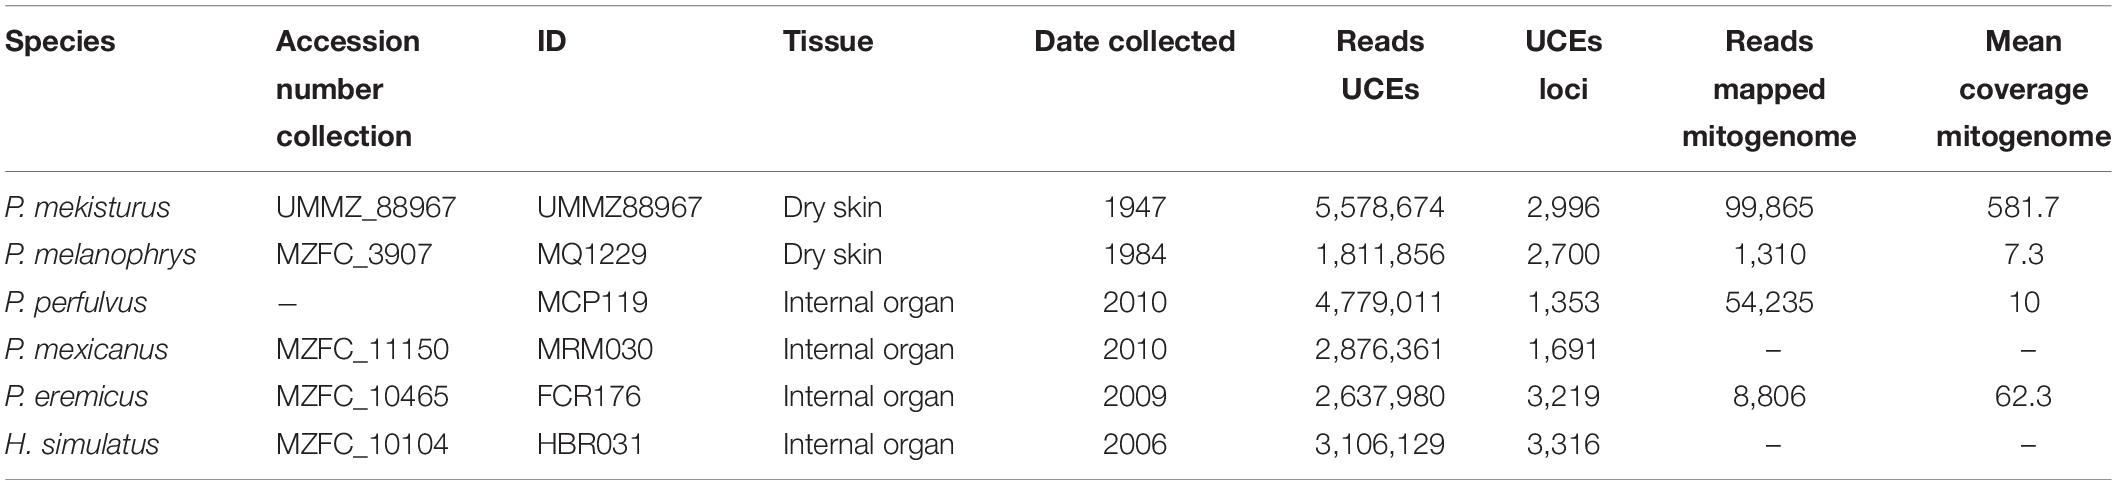
Table 1. Specimens used in this study with corresponding species, Museo de Zoología “Alfonso L. Herrera” Facultad de Ciencias UNAM (MZFC) and University of Michigan Museum of Zoology (UMMZ) accession number collection, ID for this study, tissue type that was destructively sampled, date collected, number of UCE reads after filtering, number of UCE loci, reads mapped to the reference mitogenome and mean coverage mitogenome.
We extracted ethanol-preserved internal organ samples (kidney, liver, or heart) using a DNeasy Blood and Tissue Kit (Qiagen, Valencia, CA, United States) following the manufacturer’s protocol, and visualized on 1% agarose gel to assess quality. Gels were run at 120 volts for 45 min using 1× TBE (Tris-Borate-EDTA) buffer. We quantified each extraction using a Qubit® (Life Technologies) fluorometer with a 1× dsDNA HS assay kit. We extracted dried skin clips using a standard phenol-chloroform protocol in an ancient DNA facility at the CCG following established ancient DNA standards (Pääbo et al., 2004; Willerslev and Cooper, 2005; McDonough et al., 2018). We sheared 100 μl of each DNA extraction, after normalizing concentrations to approximately 400–500 ng/μl, to an average length of ca. 500 bp using a Bioruptor® Pico sonicator (Diagenode) with a pulse of 30 s on/30 s off for 90 cycles. Afterward, we concentrated the samples via centrifugation to 25 μl and cleaned them using 2× solid-phase reversible immobilization (SPRI) magnetic beads (Rohland and Reich, 2012) following the manufacturer’s instructions to remove small fragments. We did not shear, quantify, or clean extractions from dried skin due to the inherent degradation and fragmentation of the DNA.
We prepared each DNA sample (22 μl) as a dual-indexed library using Kapa LTP Library Preparation kit (Kapa Biosystems, Boston, MA, United States) for Illumina® Platforms sequencing following the manufacturer’s protocol (Kapa Biosystems V6.17), with 1/4 reactions. We performed all pre-PCR steps for the skin samples in a laboratory specifically dedicated to processing of ancient DNA. The ancient DNA lab is physically separated from the main laboratory, and no modern tissue/DNA samples or PCR amplifications are allowed. We performed dual indexing PCR with Nextera-style indices (Faircloth and Glenn, 2012) using Kapa HiFi Hotstart Ready Mix (Kapa Biosystems) according to the manufacturer’s protocols, with 14 cycles for organ samples and 18 cycles for skin samples. We purified the resulting indexed libraries using 1.6× SPRI magnetic beads and visualized on a 1% agarose gel (conditions as mentioned above). We quantified library concentrations using Qubit® 1× dsDNA HS assay and we inspected library size-ranges and qualities using a Bioanalyzer 2100 (Agilent Technologies, Santa Clara, CA, United States) with High Sensitivity DNA kits. We pooled libraries equimolarly in pairs for the organ samples; we did not pool the more degraded skin samples. We performed enrichment for UCEs using an in-solution DNA hybridization with synthetic RNA baits. We used the myBaits® UCE Tetrapods 5Kv1 kit (Arbor Biosciences) following the myBaits protocol v3. The P. mekisturus sample was library prepped and enriched twice to confirm the results (data not shown). While both sample enrichments were sequenced, only one of the samples was included in the final analyses upon confirmation that both samples yielded the same results.
To sequence the mitochondrial genome of P. mekisturus, we followed the single tube library preparation method described by Carøe et al. (2017). We performed dual indexing PCR with TruSeq-style indices (Meyer and Kircher, 2010) using Kapa HiFi Uracil + kit (Kapa Biosystems) according to the Carøe et al. (2017) protocol. We performed all steps in duplicate. Prior to the index PCR reaction, we performed a quantitative PCR (qPCR) using SYBR green fluorescence (Kapa Biosystems Illumina Library Quantification kit) in order to determine the number of cycles for library amplification. We used 16 and 20 cycles, and pooled post-PCR products. We then enriched for the mitochondrial genome using the myBaits® Mito kit (Arbor Biosciences) designed for the house mouse, Mus musculus, following the myBaits protocol v4.
We amplified post-enrichment UCE libraries with 14–18 cycles of PCR using universal Illumina primers (see myBaits protocol v3 and v4) and Kapa HiFi Hotstart Ready Mix (Kapa Biosystems) according to the manufacturer’s protocol, and sequenced them on a MiSeq (Illumina, Inc., San Diego, CA, United States) using a 600-cycle Reagent Kit v3 (2 × 300 bp) at the CCG. We split samples into two groups using a different kit for each group. In order to ensure that we would obtain enough coverage for the P. mekisturus sample, we sequenced it at a much deeper coverage compared to the other samples. We amplified the post-enrichment mitogenome library with 18 cycles following the same protocol as above, and we sequenced it using a 2 × 150 bp – PE SP kit on a NovaSeq 6000 (Illumina, Inc., San Diego, CA, United States) at the Vincent J. Coates Genomics Sequencing Laboratory, UC Berkeley (combined with samples from other projects). We evaluated the quantity and quality of each sequencing pool using a Qubit® 1× dsDNA HS assay and a Bioanalyzer 2100 (Agilent Technologies, Santa Clara, CA, United States) before sequencing.
In order to test the reliability of our results based on NGS generated data, we also PCR amplified and Sanger sequenced using aliquots from the same P. mekisturus DNA sample. Because we only had limited amount of DNA extract after conducting the NGS protocols, we decided to only test the first five out of the eight fragments from the Castañeda-Rico et al. (2014) study. In order to ensure that primer stocks used in this assay were free of contamination, we ordered a new set based on the published sequences of these five primer pairs (Integrated DNA Technologies, Inc.). All pre-PCR reactions were prepared in our ancient DNA facility taking same precautions as described above. We amplified DNA in a 25 μl reaction volume containing the following: 9 ng of template DNA, 1 unit of AmpliTaq Gold (Thermo Fisher Scientific), 1.5 mM of MgCl2, 100 μM of deoxynucleoside triphosphate, and 0.25 μM of each primer. Polymerase chain reaction (PCR) conditions were as follow: Taq activation at 95°C for 10 min, followed by 17 cycles at 95°C for 30 s, 50°C annealing temperature for 1 min, and 72°C for 1 min, followed by 27 cycles at 95°C for 30 s, 55°C for 1 min, and 72°C for 1 min with a final extension of 72°C for 5 min. We cleaned PCR products with ExoSAP-IT (Thermo Fisher Scientific), followed by the sequencing reaction using BigDye Terminator v3.1cycle sequencing kit (Thermo Fisher Scientific). We cleaned the sequencing reaction using Sephadex G-50 Fine (GE Healthcare Life Sciences), following the manufacturer’s protocols. Bi-directional Sanger sequencing was performed in an ABI Prism 3130XL Genetic Analyzer (Applied Biosystems, Foster City, CA, United States) at the CCG. To control for contamination, we included negative controls in all amplification reactions and sequenced them. Each fragment was also amplified and sequenced in duplicate to corroborate our results.
In addition to the sequences we generated in our lab, we also reanalyzed previously published data including the following: mitochondrial gene cytochrome b (Cytb) gene sequences from Bradley et al. (2007) and Platt et al. (2015), mitochondrial genes ND3, tRNA-Arg, ND4L, and partial ND4 genes from Castañeda-Rico et al. (2014) and full mitogenomes from Sullivan et al. (2017). A list of these analyzed samples is found in Supplementary Table S1.
Bioinformatic Processing of Ultraconserved Elements and Mitogenomes
Ultraconserved Elements
We demultiplexed samples in FASTQ format using BaseSpace (Illumina, Inc.). We processed raw FASTQ files following the PHYLUCE v1.6.7 bioinformatic pipeline (Faircloth, 2016) with default parameters, available at https://phyluce.readthedocs.io/en/latest/tutorial-one.html (accessed on August 2019). We used Illumiprocessor 2.0.7 (Faircloth, 2013), which allows processing of Illumina sequencing reads using the trimming tool Trim Galore 0.6.51 to clean the data (to remove adapter contamination, barcode regions and low-quality bases). We assembled reads into contigs using Trinity 2.8.5 (Grabherr et al., 2011). Following contig assembly, we identified contigs matching UCE loci in the 5K UCE locus set2. We created a “taxon set” containing all of our samples to query the database generated during UCE contig identification and created a list of UCE loci by sample. We generated a monolithic FASTA file to extract sequences from each sample. We aligned FASTA sequences using MAFFT 7.4 (Katoh and Standley, 2013) and performed internal trimming using Gblocks 0.91b (Castresana, 2000). We quantified informative sites with the phyluce_align_get_informative_sites.py script. We filtered the resulting alignment to create a 75 and 95% complete matrix. All of these analyses were performed on the Smithsonian Institution High Performance Cluster (SI/HPC).
Mitogenomes
In order to obtain mitogenomes as “off-target sequences” from UCE capture sequences, we used cleaned reads (paired P1 and P2, plus singletons) generated by Illumiprocessor (Faircloth, 2013) through the PHYLUCE pipeline. We removed exact duplicates (−derep1,4) using Prinseq-lite v0.20.4 (Schmieder and Edwards, 2011). We mapped the reads to a reference (Peromyscus megalops, GenBank KY707305) using the Geneious algorithm in Geneious Prime® 2019.2.33 with default parameters (Medium-Low sensitivity, Maximum mismatches = 20%, Maximum gaps = 10%). We generated consensus sequences with Geneious, using 5× as the lowest coverage to call a base, a Highest Quality control, and the remaining default parameters, and aligned them using MAFFT 7.4 (Katoh and Standley, 2013). We transferred annotations from P. megalops reference (GenBank KY707305) and translated genes to check for stop codons.
We demultiplexed the sample sequenced on a NovaSeq in FASTQ format using BaseSpace (Illumina, Inc.). We checked sequence read quality using FastQC v0.11.54 (Andrews, 2010). We quality filtered the reads using Trim Galore 0.6.55 to remove adapter sequences and low-quality reads using the default parameters as Phred:20, mean min-len:20. We further filtered the trimmed DNA sequencing reads using Prinseq-lite v0.20.4 (Schmieder and Edwards, 2011) to remove exact duplicates (−derep1,4). We used the resulting high-quality, de-duplicated reads in all subsequent steps, following the steps outlined above. We compared the partial mitogenome obtained from off-target UCE enrichment to the one obtained using mitogenome probes in order to corroborate the P. mekisturus mitogenome sequence using data generated independently.
Sanger Sequencing
We edited and cleaned sequences using BioEdit 7.2.5 (Hall, 1999). We extracted tRNA-Gly, ND3, tRNA-Arg, ND4L, and partial ND4 mitochondrial genes from the P. mekisturus mitogenome. We used MAFFT 7.4 (Katoh and Standley, 2013) in Geneious to align and compare the extracted mitochondrial genes with the new Sanger sequences obtained in this study and the P. mekisturus_KF885810 sequences obtained by Castañeda-Rico et al. (2014).
Peromyscus mekisturus – Mitogenome
We performed three additional analyses for P. mekisturus in order to validate that the mitogenome sequence was not the result of contamination. First, in addition to the mitogenome that we obtained by mapping sequence reads to a reference genome (P. megalops, GenBank KY707305), we performed a de novo assembly using MIRA 4.0 (Chevreux et al., 1999) in Geneious with default paraments, which include an accurate quality level of assembly. Second, we exported from Geneious the reads mapped to the reference genome as FASTQ files and we converted them to FASTA files with seqtk version1.26 (Li, 2013). We used mega-BLAST (in BLAST + version 2.6.0 – Camacho et al., 2009) to align the reads against the nucleotide database (accessed on January 29, 2020). We then used MEGAN version 6.18.4 (Huson et al., 2016) to visualize and analyze the BLAST output, following the default parameters and parsed with the LCA (Lowest Common Ancestor) method. Finally, we used mapDamage2.0 (Jónsson et al., 2013) to examine the patterns of DNA damage sequencing artifacts. We analyzed the reads obtained from the mitogenome enrichment and mapped to the closest reference genome. We used the default parameters in mapDamage2.0.
Phylogenetic Analyses
We performed four independent phylogenetic analyses using: (1) UCE dataset, (2) full mitogenomes, (3) Cytb mitochondrial gene, and (4) ND3, tRNA-Arg, ND4L, and partial ND4 mitochondrial genes.
First, we analyzed the 75% complete UCE matrix using RAxML 8.12 (Stamatakis, 2014) with a GTRGAMMA site rate substitution model and 20 maximum-likelihood (ML) searches for the phylogenetic tree that best fit each set of data. The GTRGAMMA is the most recommended model for ML analyses using RaxML because it represents an acceptable trade-off between speed and accuracy (RAxML 8.12 manual). We generated non-parametric bootstrap replicates using the autoMRE option which runs until convergence is reached. We reconciled the best fitting ML tree with the bootstrap replicate to obtain the final phylogenetic tree. We also analyzed a 95% complete UCE matrix following the protocol above. We ran these analyses on the Smithsonian High-Performance Computing cluster Hydra (SI/HPC). We performed a Bayesian Inference (BI) analysis in MrBayes 3.2.6 (Huelsenbeck and Ronquist, 2001; Ronquist and Huelsenbeck, 2003) on the CIPRES infrastructure (Miller et al., 2010). In order to do it, we first estimated the best evolutionary model of nucleotide substitution in jModelTest 2.1.1 (Guindon and Gascuel, 2003; Darriba et al., 2012) using the Akaike Information Criterion (AIC). The TVM + I model was selected as the best fitting model for the UCE dataset (95% matrix) with the following parameters: base frequencies A = 0.2975, C = 0.2037, G = 0.2038, T = 0.2950; nst = 6; and portion of invariant sites = 0.7730. We used 50 million generations sampling every 1,000 generations with four Markov chains (three heated and one cold). Heating temperature was set at 0.02 to facilitate greater movement between the four Markov chains. We visualized output parameters using Tracer v1.7.1 (Rambaut et al., 2018) to check for convergence between runs and we discarded the first 25% of the trees as burn-in. UCEs are non-coding regions but are likely involved in controlling gene expression (Marcovitz et al., 2016). However, their function is still an area of research (Faircloth et al., 2012, 2015). In addition, its rate of evolution is still not well understood (Faircloth et al., 2015; Tangliacollo and Lanfear, 2018) and therefore, we did not partition this dataset.
We used the mitogenome data to infer the phylogenetic relationships of P. mekisturus in relation to other peromyscine rodents. We included samples generated in this work, as well as samples published previously by Sullivan et al. (2017) and a grasshopper mouse sample, Onychomys leucogaster (GenBank KU168563), which was used as an outgroup by Castañeda-Rico et al. (2014). We aligned sequences using MAFFT 7.4 (Katoh and Standley, 2013) in Geneious. We analyzed the mitogenome data without partitions and we estimated the best evolutionary model of nucleotide substitution in jModelTest 2.1.1 (Guindon and Gascuel, 2003; Darriba et al., 2012) using the Akaike Information Criterion (AIC). The GTR + I + G model was selected as the best fitting model with the following parameters: base frequencies A = 0.3580, C = 0.2801, G = 0.1106, T = 0.2315; nst = 6; rates = gamma with shape parameter (α) = 0.7600; and portion of invariant sites = 0.4740. We also performed model and partition selection using PartitionFinder 2.1.1 (Lanfear et al., 2016), with linked, corrected Akaike Information Criterion (AICc) and greedy parameters, on the SI/HPC cluster. We analyzed two different partitions: (1) by gene and codon position and (2) by codon position, tRNA, rRNA and D-loop. The PartitionFinder analysis detected 34 partitions for the by gene and codon position selection and 6 partitions for the by codon position, tRNA, rRNA and D-loop selection, both results were incorporated in the phylogenetic reconstructions (Supplementary Table S2). We performed a BI analysis in MrBayes 3.2.6 (Huelsenbeck and Ronquist, 2001; Ronquist and Huelsenbeck, 2003) on the CIPRES infrastructure (Miller et al., 2010). We used 50 million generations sampling every 1,000 generations (conditions as mentioned above for the UCE dataset). We visualized output parameters using Tracer v1.7.1 (Rambaut et al., 2018) to check for convergence between runs and we discarded the first 25% of the trees as burn-in. We also performed a ML analysis using RAxML 8.12 (Stamatakis, 2014) with a GTRGAMMA site rate substitution model. Clade support was assessed by bootstrapping with 1,000 replicates.
We analyzed Cytb sequences extracted from the mitogenomes that we generated here and from the mitogenomes published by Sullivan et al. (2017) in order to evaluate the phylogenetic position of P. mekisturus with respect to the genera Peromyscus, Habromys, Megadontomys, Neotomodon, Osgoodomys, Podomys, Isthmomys, Onychomys, and Reithrodontomys. We also used all the sequences published by Bradley et al. (2007) and Platt et al. (2015). By including data from these previous studies, we were able to include representatives of the genera Neotoma, Ochrotomys, Baiomys, Ototylomys, Tylomys, Nyctomys, Oryzomys, and Sigmodon to be used as outgroups.
We re-evaluated the phylogeny proposed by Castañeda-Rico et al. (2014) in order to compare the P. mekisturus sample sequenced by those authors using Sanger sequencing versus the sequence that we obtained here using NGS. We used complete mitochondrial genes ND3, tRNA-Arg, ND4L, and partial ND4 (hereinafter referred as “multiple mitochondrial genes”) sequences published by Castañeda-Rico et al. (2014). We also included sequences of these genes extracted from the mitogenomes that we generated in this study and from the mitogenomes published by Sullivan et al. (2017). Furthermore, we did not use partitions for this dataset so that we could reproduce the methods used by Castañeda-Rico et al. (2014).
We analyzed the Cytb dataset and multiple mitochondrial genes separately as follows: we performed alignment using MAFFT 7.4 (Katoh and Standley, 2013) in Geneious. We estimated the best evolutionary model of nucleotide substitution in jModelTest 2.1.1 (Guindon and Gascuel, 2003; Darriba et al., 2012) using the Akaike Information Criterion (AIC). The TVM + I + G model was selected as the best fitting model for Cytb with the following parameters: base frequencies A = 0.3968, C = 0.3304, G = 0.0467, T = 0.2261; nst = 6; rates = gamma with shape parameter (α) = 0.5968, and portion of invariant sites = 0.4040. The TIM2 + I + G model was recognized as the best fitting model for the multiple mitochondrial genes with the following parameters: base frequencies A = 0.3664, C = 0.2971, G = 0.0708, T = 0.2657; nst = 6; rates = gamma with shape parameter (α) = 1.0390, and portion of invariant sites = 0.4420. We used MrBayes 3.2.6 (Huelsenbeck and Ronquist, 2001; Ronquist and Huelsenbeck, 2003) on CIPRES infrastructure (Miller et al., 2010) to reconstruct the phylogenetic trees. Each analysis included the appropriate model identified by jModelTest 2.1.1 (Guindon and Gascuel, 2003; Darriba et al., 2012), 50 million generations, and a sample frequency of every 1,000 generations. We used Tracer v1.7.1 (Rambaut et al., 2018) to check for convergence between runs, and the first 25% of the trees were discarded as burn-in. We also performed a ML analysis for both datasets, using RAxML 8.12 (Stamatakis, 2014) with a GTRGAMMA site rate substitution model. Clade support was assessed by bootstrapping with 1,000 replicates. All phylogenetic trees were visualized in FigTree 1.4.47.
We aligned and compared sequences obtained by Castañeda-Rico et al. (2014) [P. mekisturus_KF885810 and P. perfulvus_KF885791] and one unpublished sequence (P. melanophrys_MQ1229 – GenBank accession number MT078 814) using Sanger sequencing versus the multiple mitochondrial genes extracted from the mitogenome of P. mekisturus_UMMZ8 8967, P. perfulvus_MCP119, and P. melanophrys_MQ1229 obtained in this study to corroborate the sequences. We compared sequences derived from the same individuals, where the sample of P. melanophrys was an ethanol-preserved internal organ, and for P. perfulvus and P. mekisturus, the sample was dried skin.
Results
We successfully sequenced UCEs from all samples processed. Illumina reads were archived in GenBank under BioProject: PRJNA606805. On average, we generated 3.5 million reads per UCE-enriched library, yielding 2,545 UCE loci per sample (Table 1). The 75% matrix of aligned loci contained 2,436 UCEs of 3,512 total with an average length of 547 bp and 1.03 informative sites, with the minimum number of taxa per locus n = 4. The 95% matrix contained 1,010 UCEs of 3,512 with an average length of 514 bp, and 1.6 informative sites with the minimum number of taxa per locus n = 5. The unrooted trees obtained with both datasets showed the same topology and bootstrap values, where P. melanophrys and P. perfulvus cluster in a monophyletic group, and P. mexicanus is the sister species of this group. P. mekisturus is the sister species to the clade encompassing P. mexicanus, P. perfulvus, and P. melanophrys (Figure 1). All of these phylogenetic relationships are strongly supported, with high bootstrap values of 100. In this phylogenetic analysis, we included members of three out of the 13 Peromyscus species groups. P. mekisturus yielded long branch lengths using both 75 and 95% matrices (Figure 1). This suggests this long branch is not the result of missing data. However, it could be related to the high heterogeneity of P. mekisturus with respect to the other taxa included in the tree. This is most likely caused by limited taxon sampling and likely could be resolved by including more taxa in the analysis, as it has been suggested in other studies (Bergesten, 2005; Phillippe et al., 2005; Wiens, 2005). The BI tree (Figure 1) showed the same topology as the ML analyses with high posterior probability values of 1.
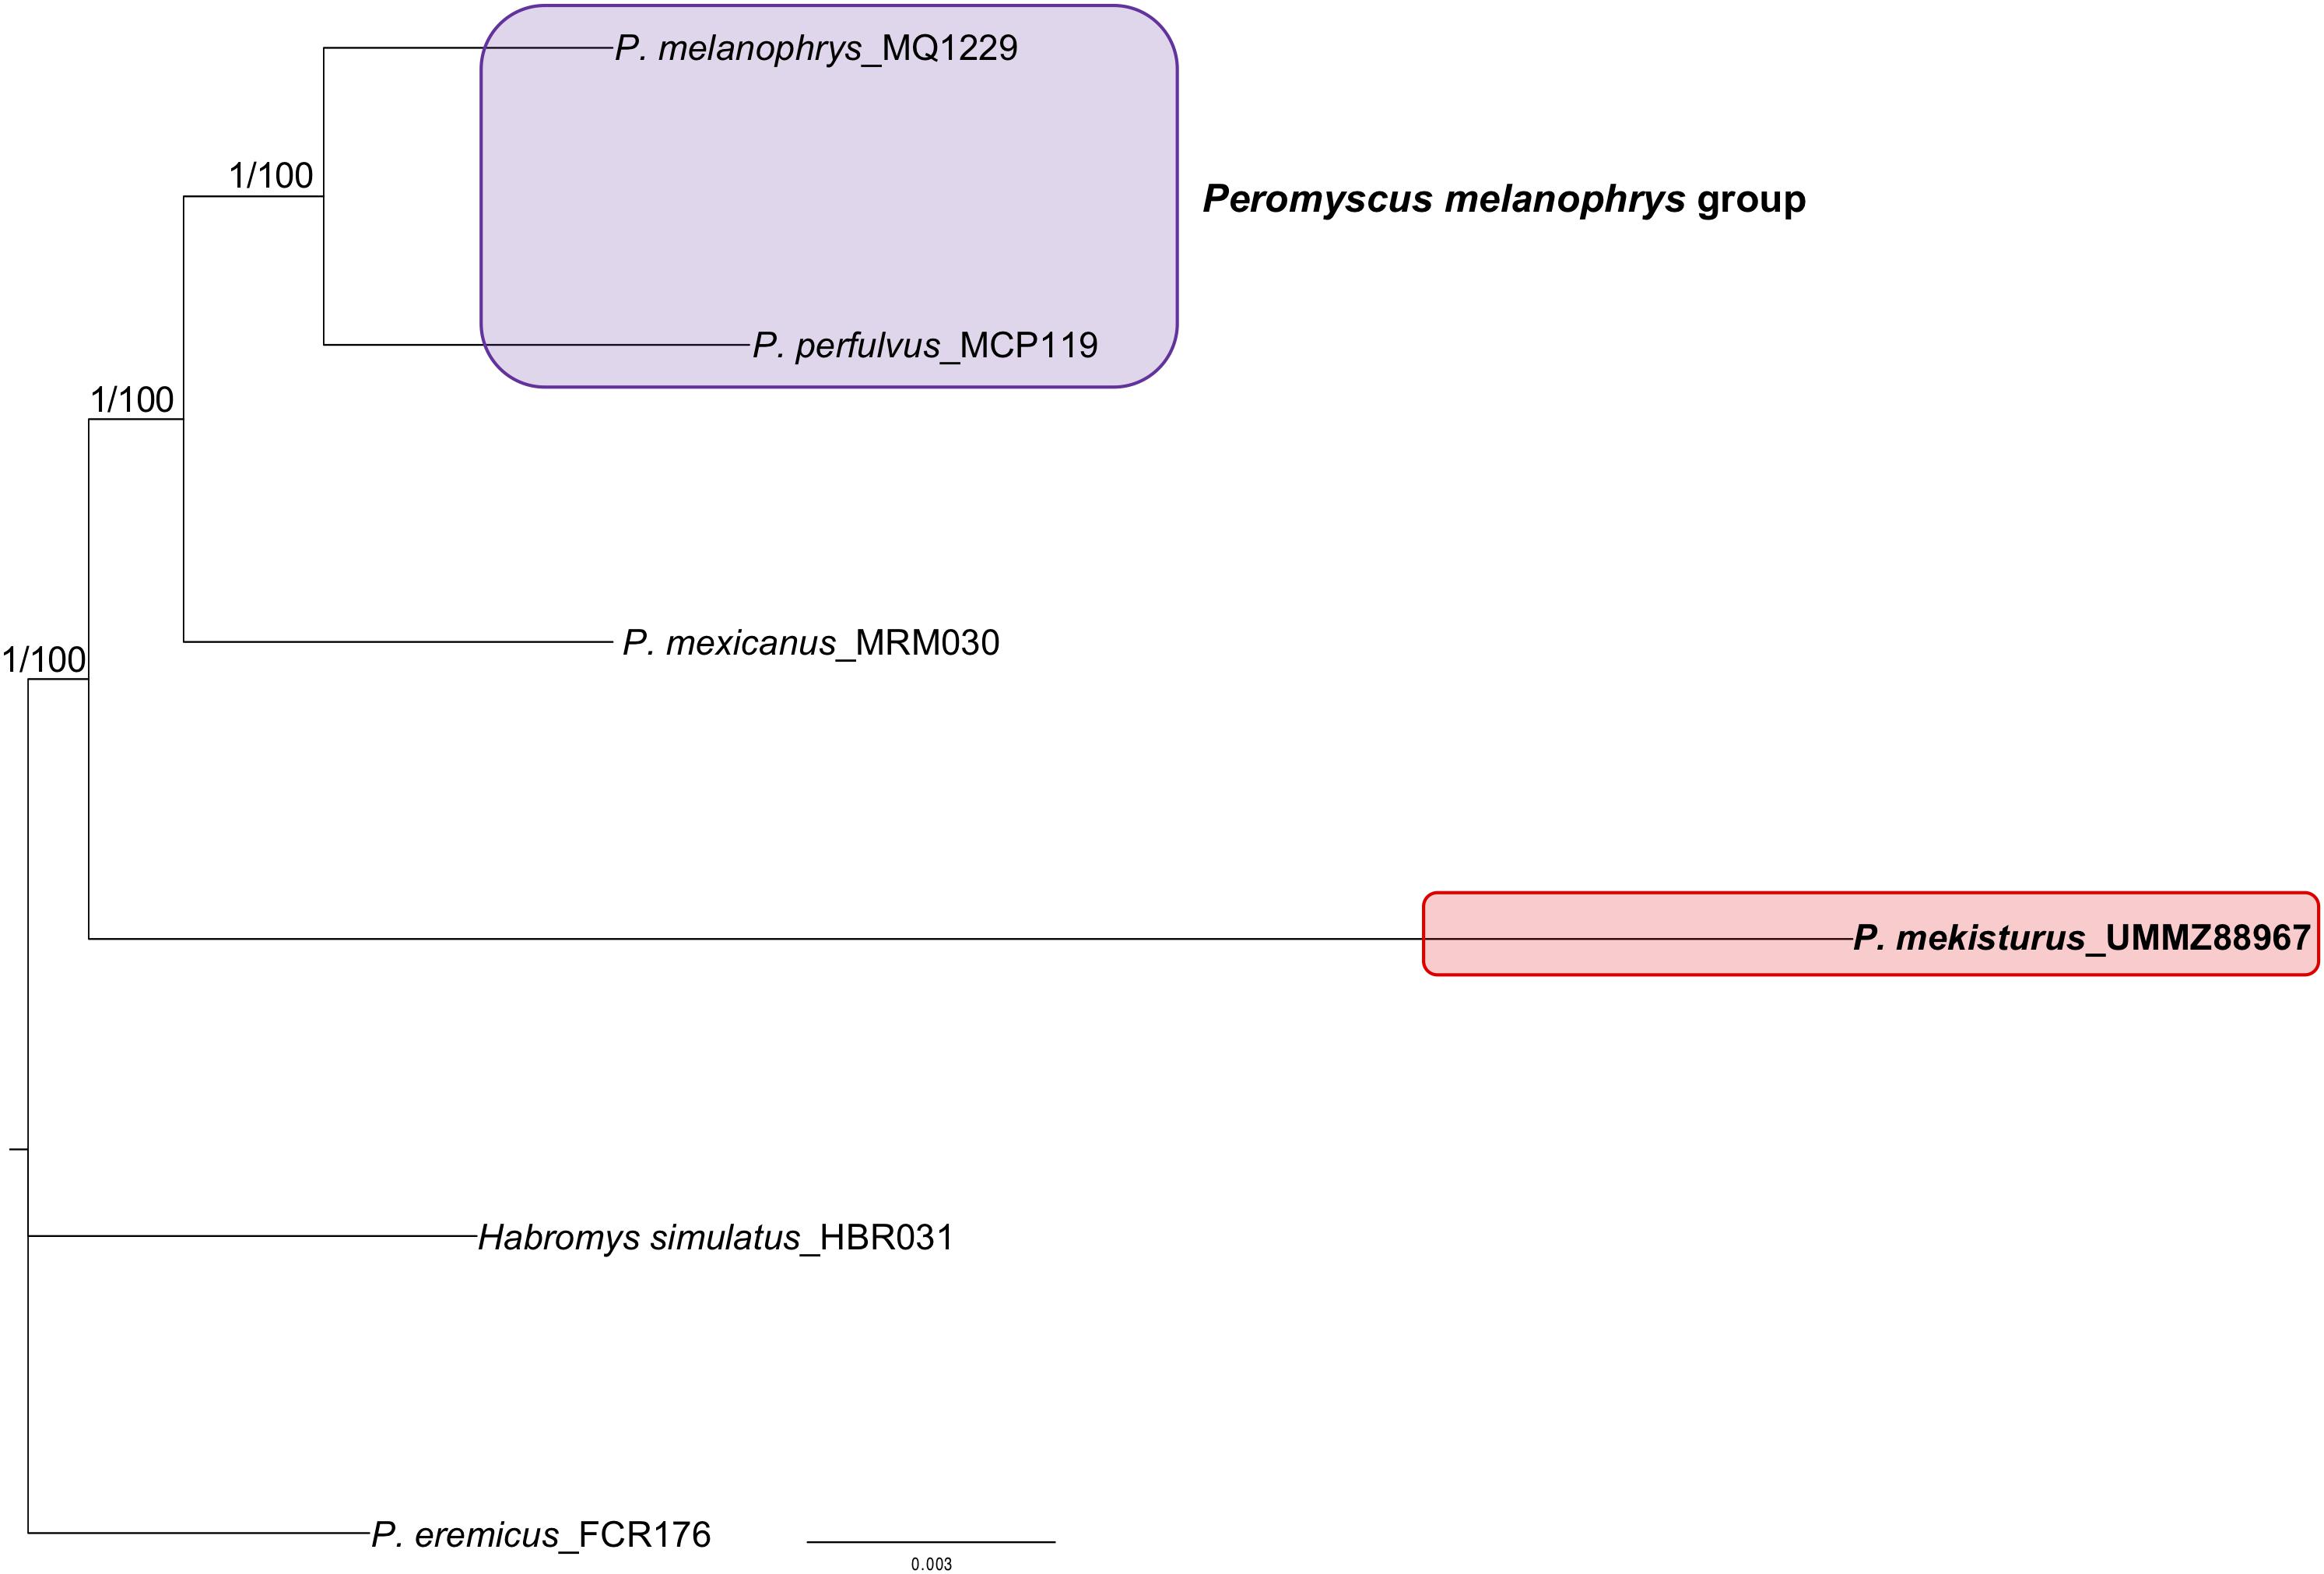
Figure 1. Maximum Likelihood unrooted phylogeny based on a 75% UCE matrix with 2,436 loci and Maximum Likelihood and Bayesian Inference unrooted phylogenies based on a 95% UCE matrix with 1,010 loci from six species. Nodal support is provided with posterior probability/bootstrap values. The purple block shows the composition of the Peromyscus melanophrys species group and the red block highlights the phylogenetic position of P. mekisturus.
For several samples, we obtained mitogenome sequences from “bycatch” from the UCE enrichment with no need for mtDNA-specific baits. We were able to recover near-complete (>95% of the reference genome covered) mitogenome sequences for P. melanophrys, P. perfulvus, and P. eremicus. We did not include the rest of the samples in the analyses because of the low percentage of mitogenome obtained (35–50%). We also obtained the complete mitogenome of P. mekisturus (GenBank accession number MT078818) using the myBaits® Mito kit designed for M. musculus. The number of reads mapped and average coverage are shown in Table 1. Comparison of the P. mekisturus partial mitogenome (ca. 5,200 bp and mean coverage = 13×) obtained as off-target sequences and the complete mitogenome (15,975 bp and mean coverage = 581.7×) obtained using myBaits kit showed a perfect sequence match distributed along 2 rRNA, 7 tRNA, 9 protein coding regions and the D-loop region.
The comparison between the sequences from the same specimen obtained by Sanger sequencing in Castañeda-Rico et al. (2014) versus NGS showed that of a total of 1,307 bp, only 2 bp were different for P. perfulvus and 20 bp for P. melanophrys. For P. perfulvus, changes were found in ND3 and ND4L genes whereas for P. melanophrys in ND4L and ND4 genes. These represent a pairwise identity of 99.85% for P. perfulvus and 98.5% for P. melanophrys. However, for P. mekisturus we found 162 bp differences distributed along the ND3, tRNA-Arg, ND4L, and partial ND4 genes. The pairwise identity between the two P. mekisturus sequences was 87.61%. To resolve the discrepancy between the previous published sequences and those out the NGS analysis, we Sanger sequenced five fragments from Castañeda-Rico et al. (2014) for the P. mekisturus sample, but only three were successfully amplified. The total length of the sequenced fragment was 545 bp (tRNA-Gly – 39 bp, ND3 – 329 bp, and ND4L – 177 bp; GenBank accession number MT078814). The 545 bp fragment sequenced matched 100% with the homologous gene sequences obtained with NGS. On the other hand, when we compared these newly generated Sanger sequences with the ones generated by Castañeda-Rico et al. (2014) we found that only 489 bp (89.7%) matched.
Furthermore, the mitogenome obtained using a de novo assembly (mean coverage = 22.3×) matched completely with the one obtained mapping to reference genome. However, the de novo mitogenome assembly had ca. 9% missing data. Based on completeness and higher coverage (Table 1), we decided to use the mitogenome obtained from mapping for all the analyses. MEGAN analysis allowed us to identify three taxonomic levels within the reads analyzed as follows: family Cricetidae (53.1%), subfamily Neotominae (40.1%), and genus Peromyscus (6.8%). The result of mapDamage2 analysis showed a weak signal of damage patterns typical of ancient DNA (Supplementary Figure S1).
The final dataset for our mitogenome phylogenetic analysis contained 20 mitogenomes from different species including members of the subfamily Neotominae, with at least one representative of eight out of the 13 Peromyscus species groups, and Sigmodontinae. The phylogenetic tree (Figure 2) showed that P. melanophrys and P. perfulvus form a monophyletic group which is the sister clade of the P. mexicanus + P. megalops clade. However, P. mekisturus is sister to Reithrodontomys mexicanus and it is more closely related to Isthmomys pirrensis than to any other member of the genus Peromyscus. The closer phylogenetic relationship of P. mekisturus to R. mexicanus is strongly supported (posterior probability value = 1 and bootstrap value = 99). The split between P. mekisturus and other members of the genus Peromyscus is strongly supported with BI analysis (posterior probability value = 1) but not with ML analysis (bootstrap value = 54). The BI mitogenome phylogenetic trees obtained using: (1) no partitions, (2) by gene and codon position, and (3) by codon position, tRNA, rRNA and D-loop showed a similar topology with high posterior probability values. The only differences among them were the position of O. leucogaster, P. crinitus, P. polionotus, and the P. floridanus + N. alstoni clade. However, the phylogenetic relationship between P. mekisturus + R. mexicanus and I. pirrensis remained highly supported (Figure 2 and Supplementary Figures S2, S3). The BI tree with no partitions and the ML tree showed the same topology (Figure 2).
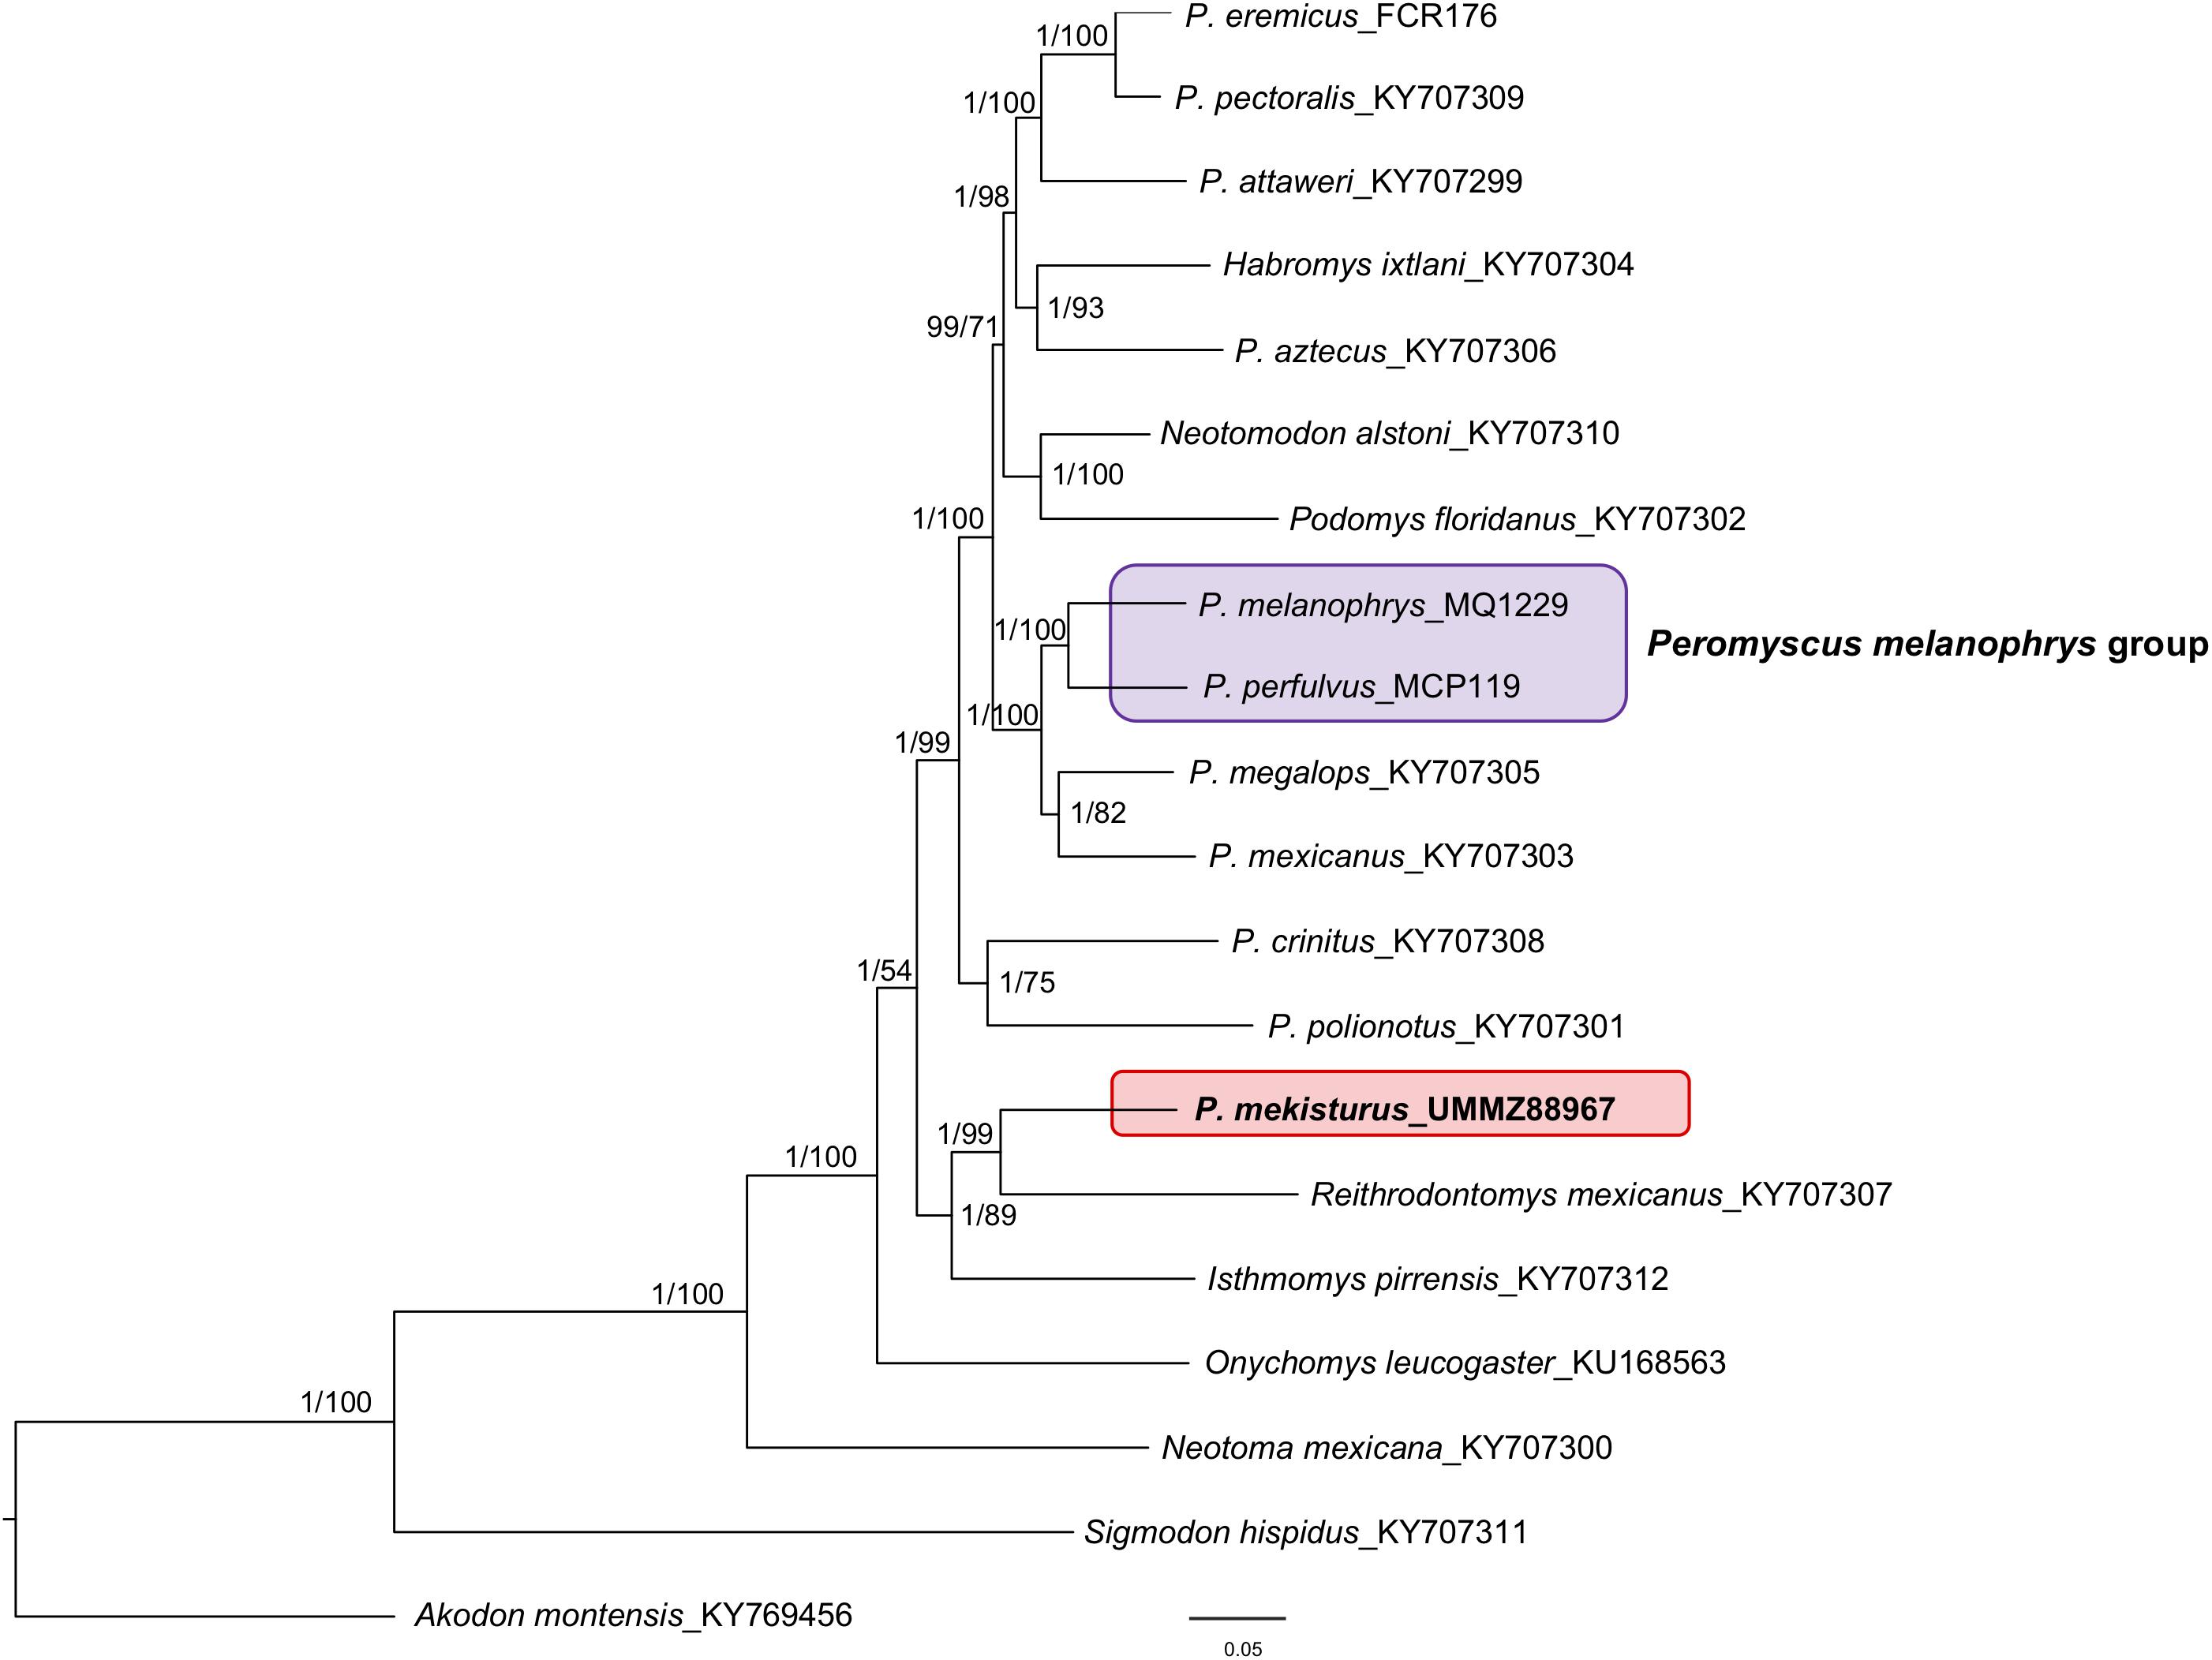
Figure 2. Bayesian Inference and Maximum Likelihood phylogeny based on mitogenomes from 20 species. Nodal support is provided with posterior probabilities/bootstrap values. The purple block shows the composition of the Peromyscus melanophrys species group and the red block highlights the phylogenetic position of P. mekisturus.
The phylogenetic analyses of the Cytb gene allowed us to include representatives from all 13 Peromyscus species groups in order to test the position of P. mekisturus with respect to a denser taxon sampling of the group, as well as additional members of the subfamilies Neotominae and Sigmodontinae. We analyzed a total of 138 sequences from a total of 67 different rodent taxa. We found some minor changes between the topology obtained from BI and ML analyses. However, the result of both of these analyses confirmed that P. mekisturus is more closely related to the genera Reithrodontomys and Isthmomys than to Peromyscus (Figures 3, 4). Although the relationships among the genera Reithrodontomys and Isthmomys and P. mekisturus are not well resolved here (low posterior probability and bootstrap values), the Cytb topology agrees with the phylogeny based on mitogenomes, and places P. mekisturus as the sister species of the genus Reithrodontomys.
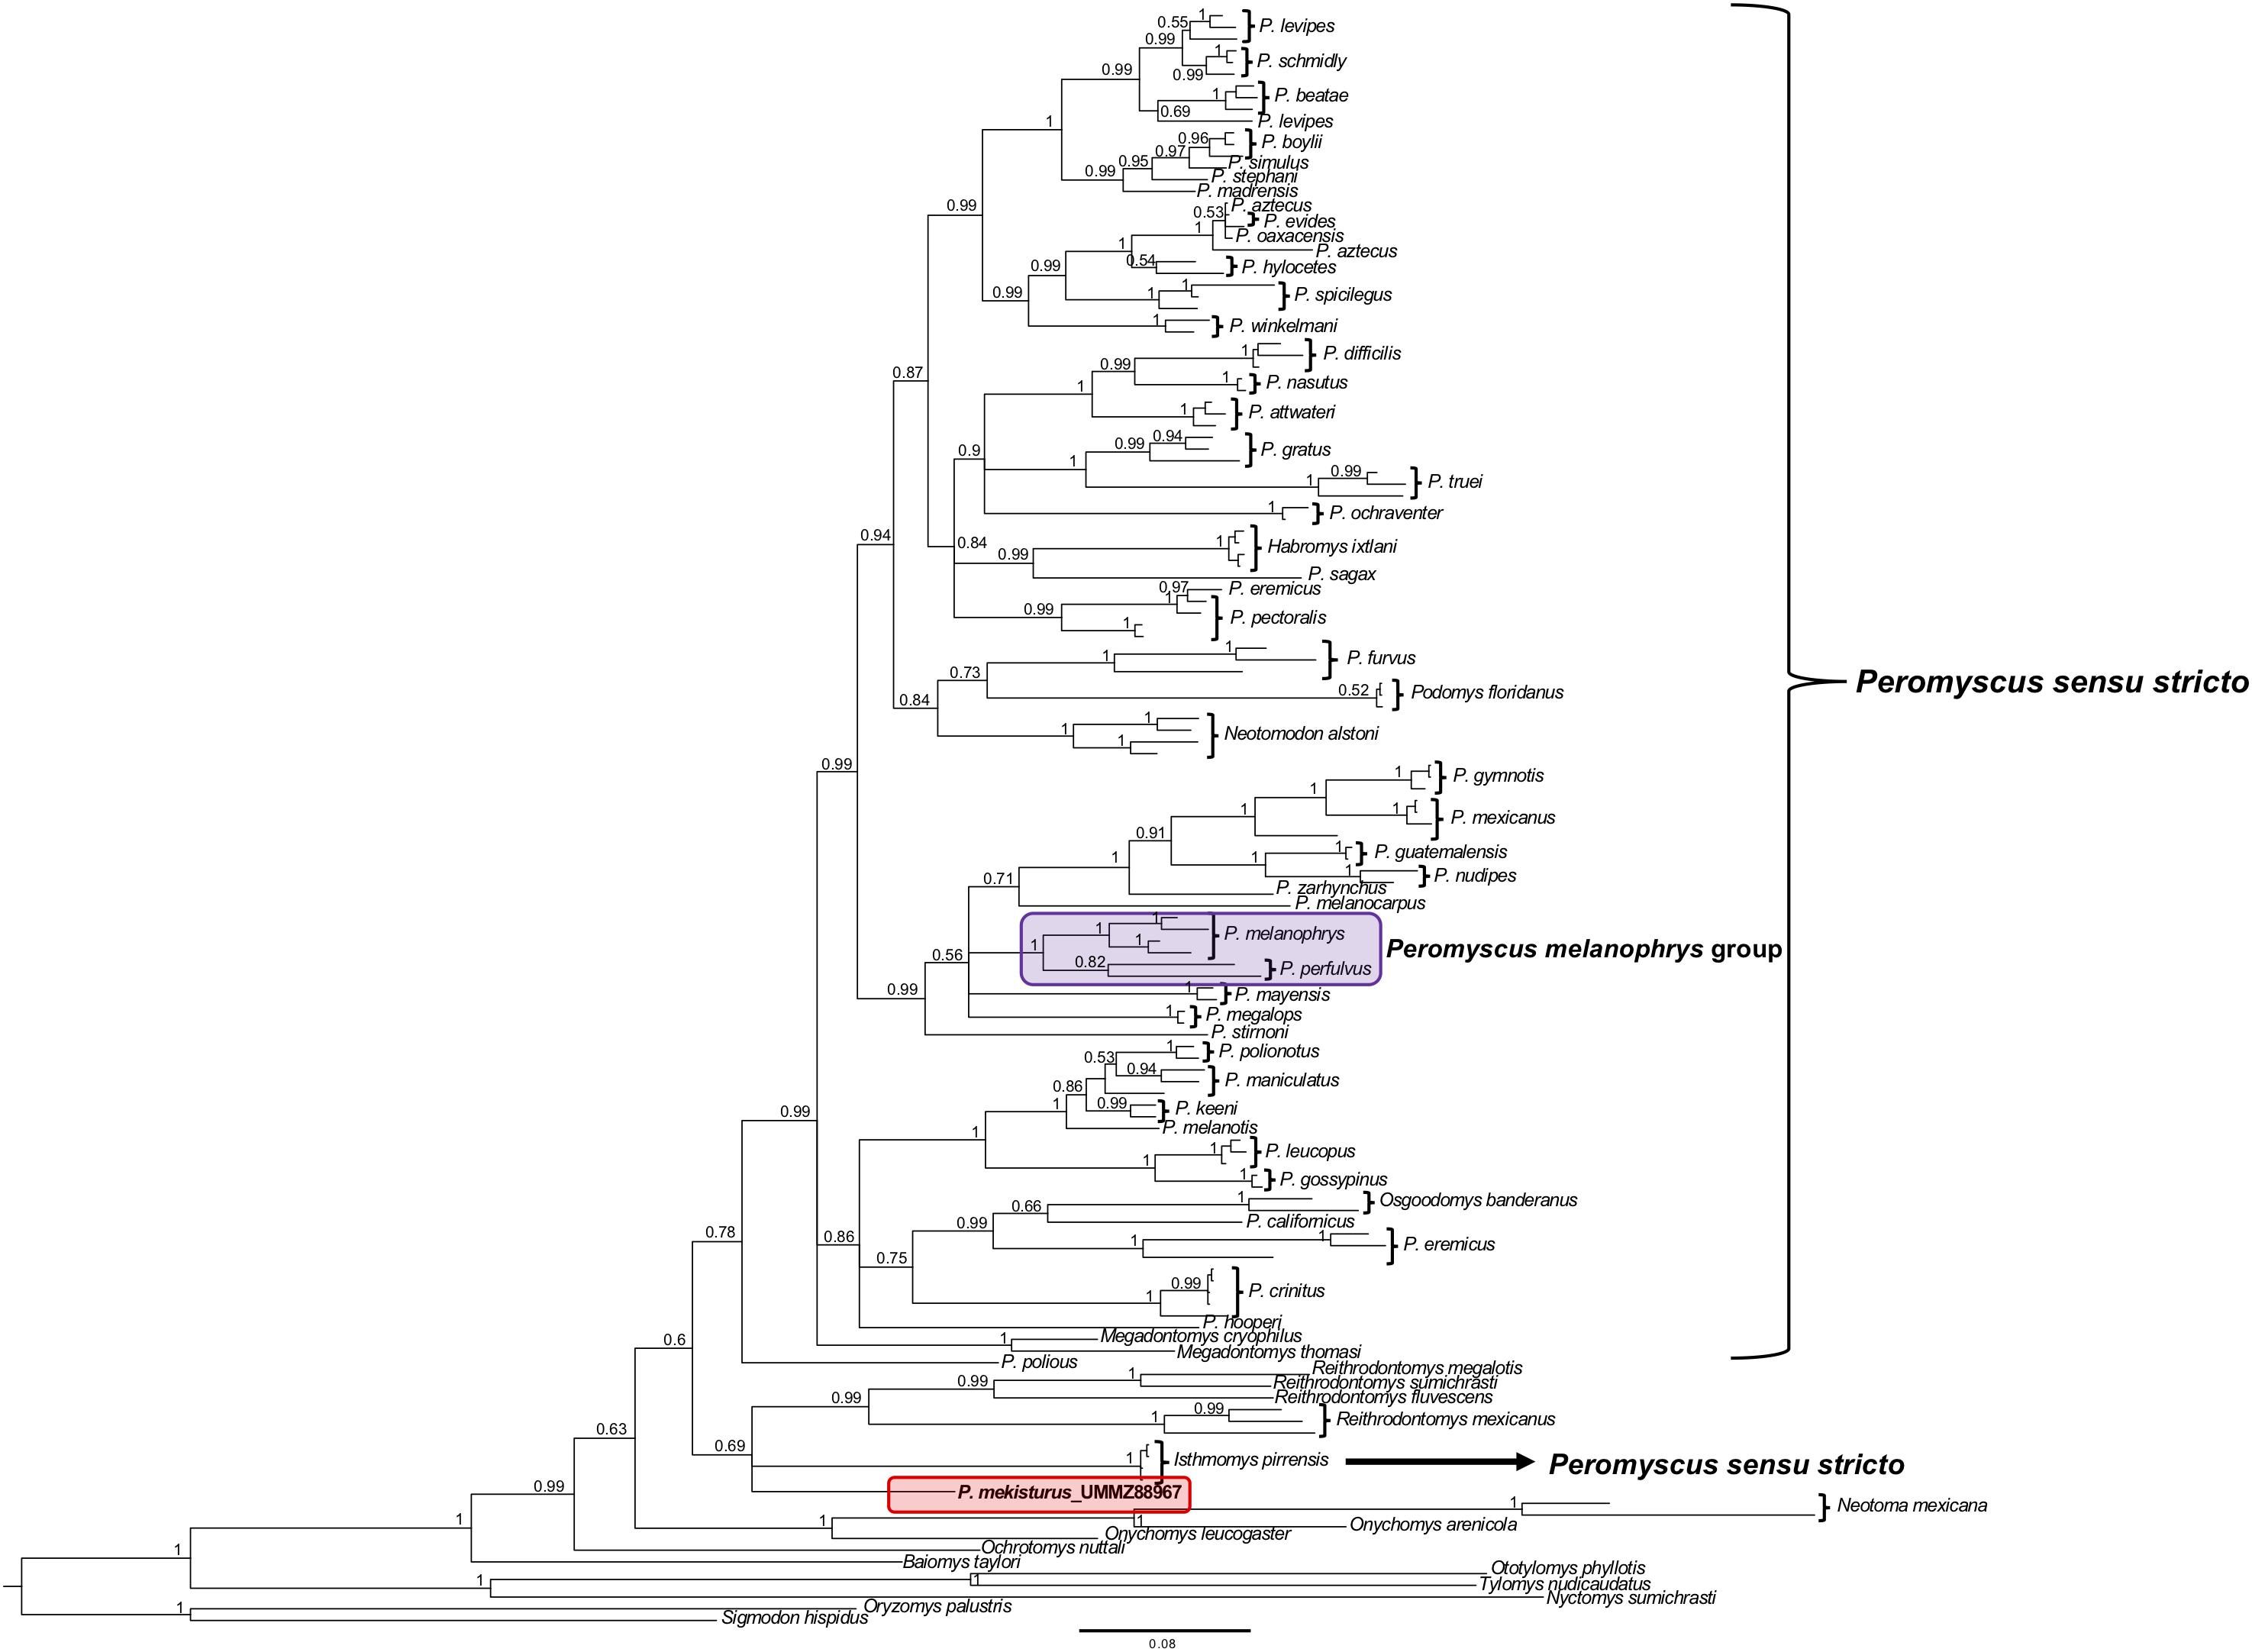
Figure 3. Bayesian Inference phylogeny based on the Cytb gene from 64 species. Nodal support is provided with posterior probabilities values. The purple block shows the composition of the Peromyscus melanophrys species group and the red block highlights the phylogenetic position of P. mekisturus.
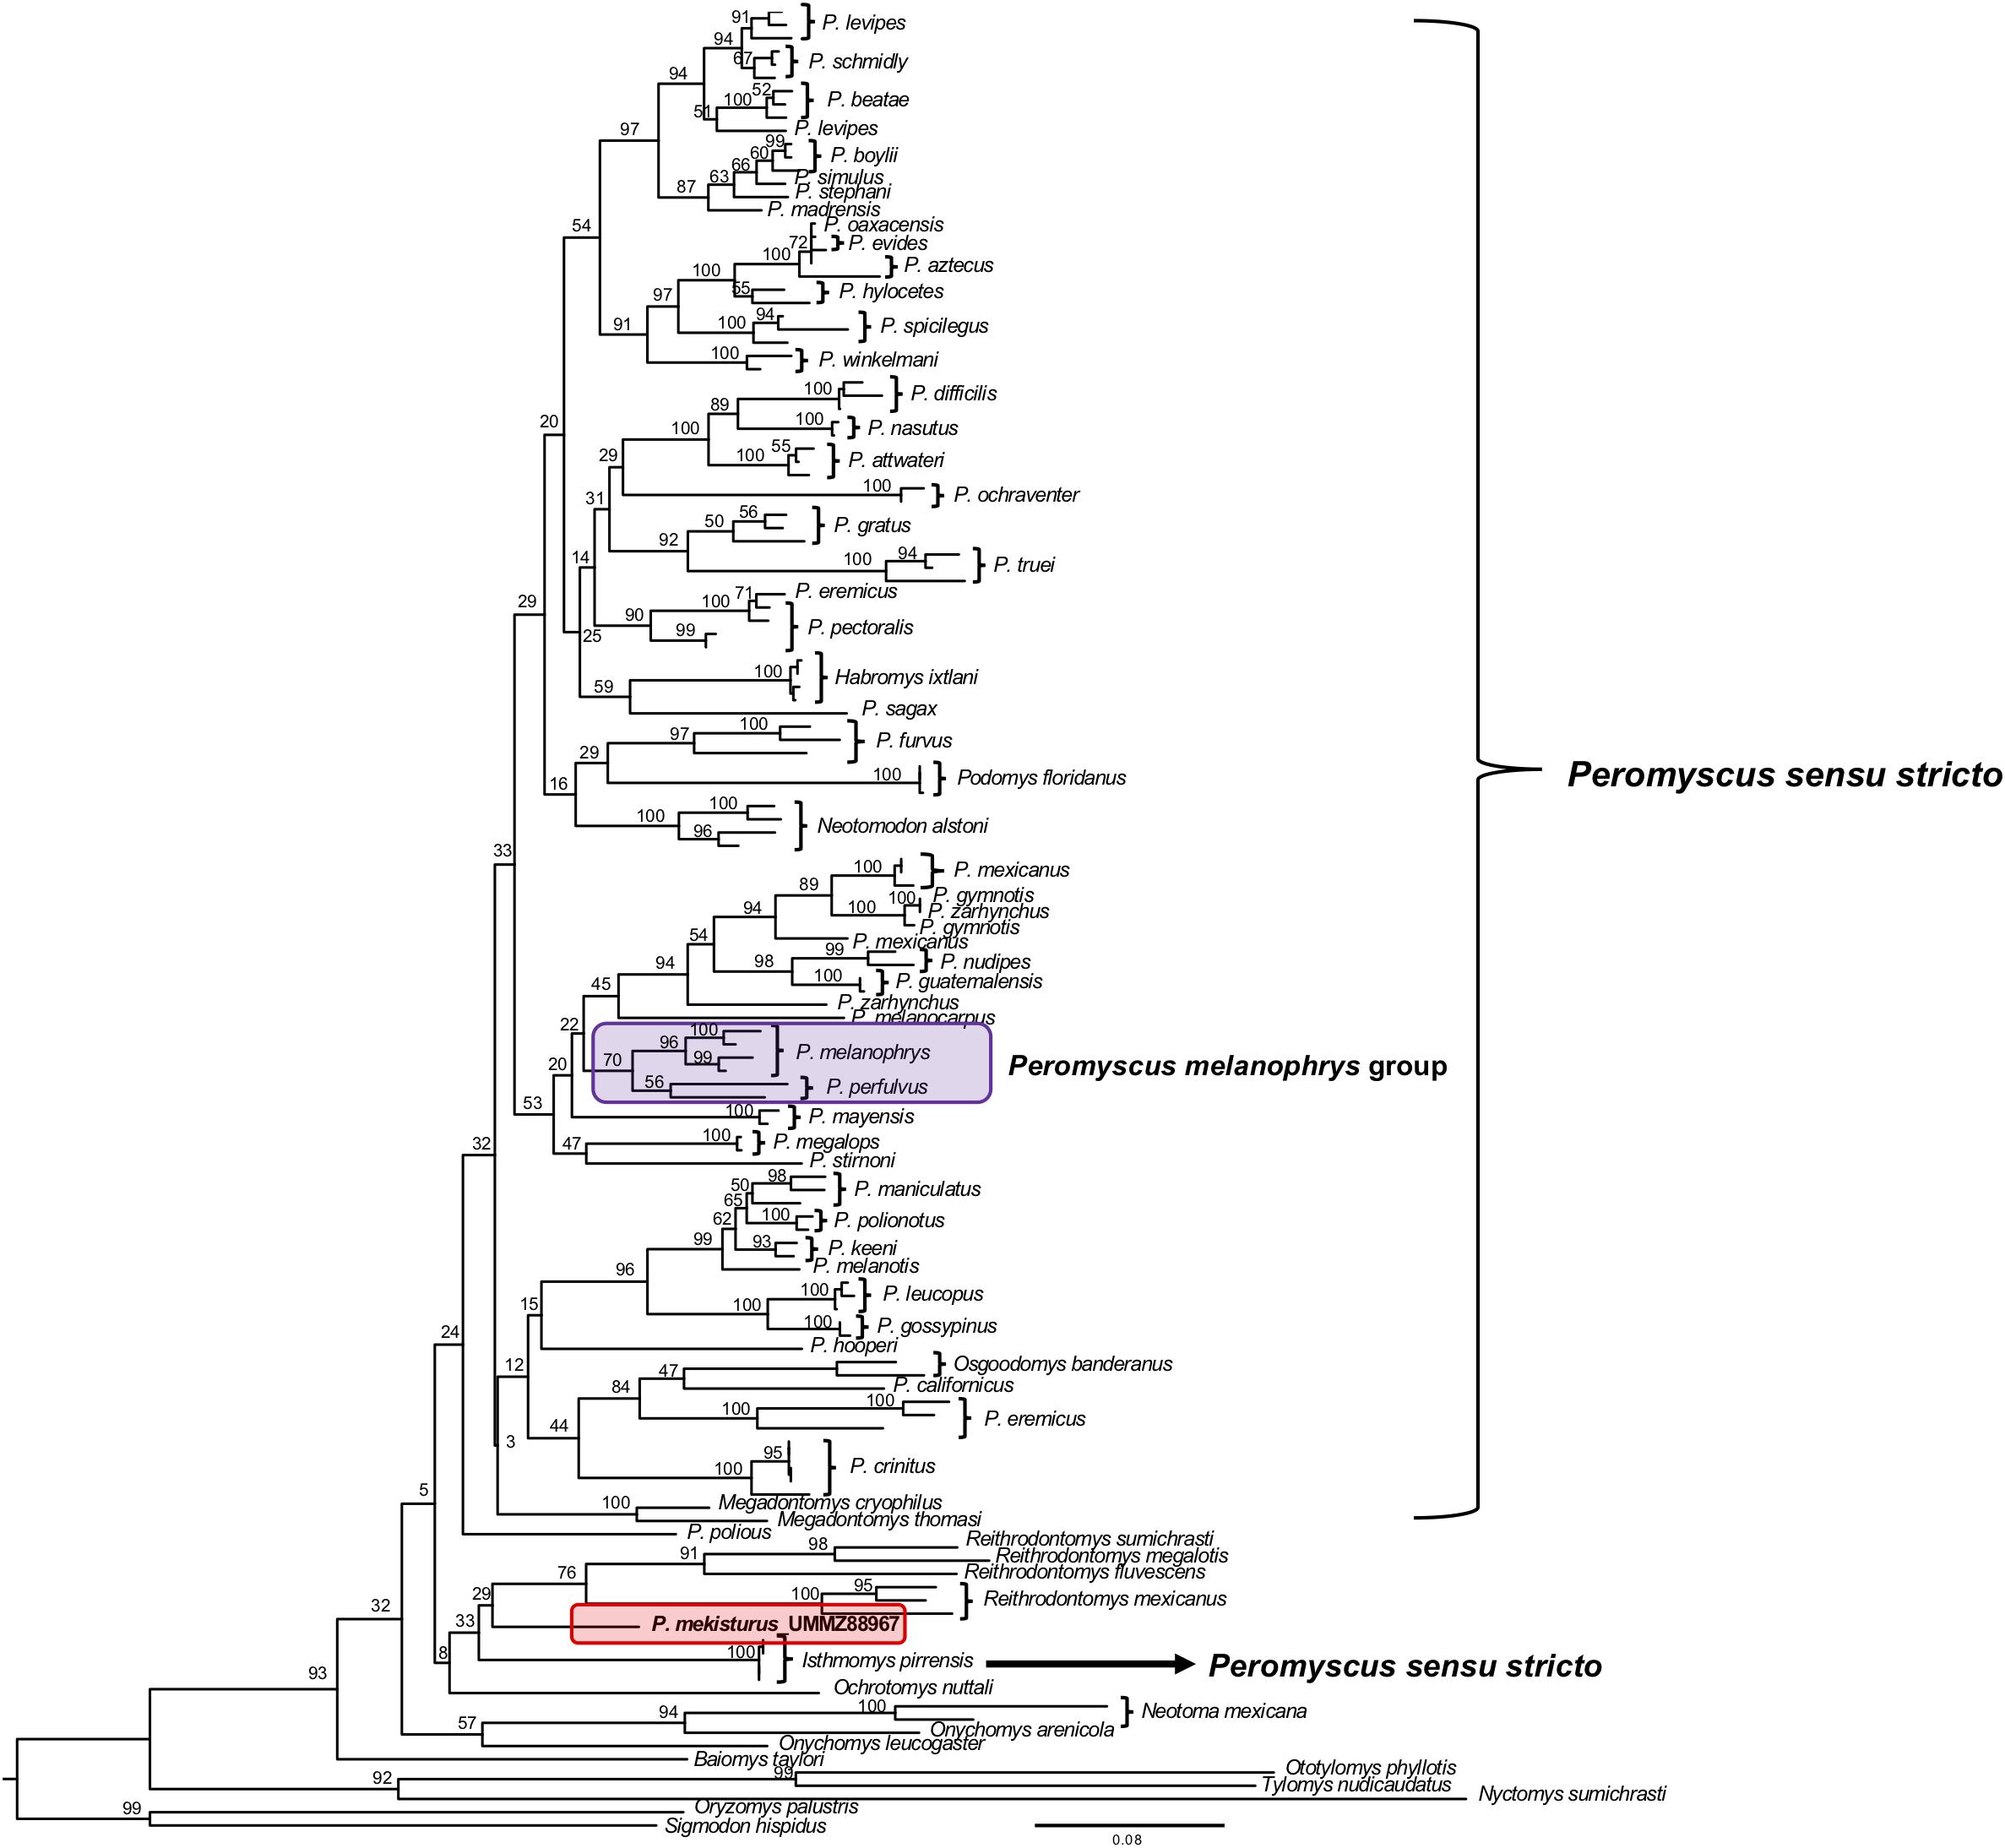
Figure 4. Maximum Likelihood phylogeny based on the Cytb gene from 64 species. Nodal support is provided with bootstrap values. The purple block shows the composition of the Peromyscus melanophrys species group and the red block highlights the phylogenetic position of P. mekisturus.
The BI and ML analyses using multiple mitochondrial genes included a total of 119 sequences from a total of 22 different rodent taxa (Figures 5, 6), including the P. mekisturus sequence generated using Sanger sequencing (P. mekisturus_KF885810, Castañeda-Rico et al., 2014) and the sequence generated in this study with NGS (P. mekisturus_UMMZ88967). This dataset also included at least one individual from eight out of the 13 Peromyscus species groups, and additional samples of the subfamilies Neotominae and Sigmodontinae. The phylogenetic tree (Figures 5, 6) confirmed the position of P. mekisturus_KF885810 within one of the clades of P. melanophrys as Castañeda-Rico et al. (2014) previously showed. However, the new sample generated with NGS was placed as the sister species of Reithrodontomys mexicanus. Although the posterior probability value (0.8628, Figure 5) and the bootstrap value (39, Figure 6) of this node are not high, P. mekisturus_UMMZ88967 is more closely related to the genera Reithrodontomys and Isthmomys than to any other member of the genus Peromyscus. The ML tree shows, in general, low support values and slightly different topologies compared to the BI tree. However, the phylogenetic relationship between P. mekisturus and Reithrodontomys is the same.
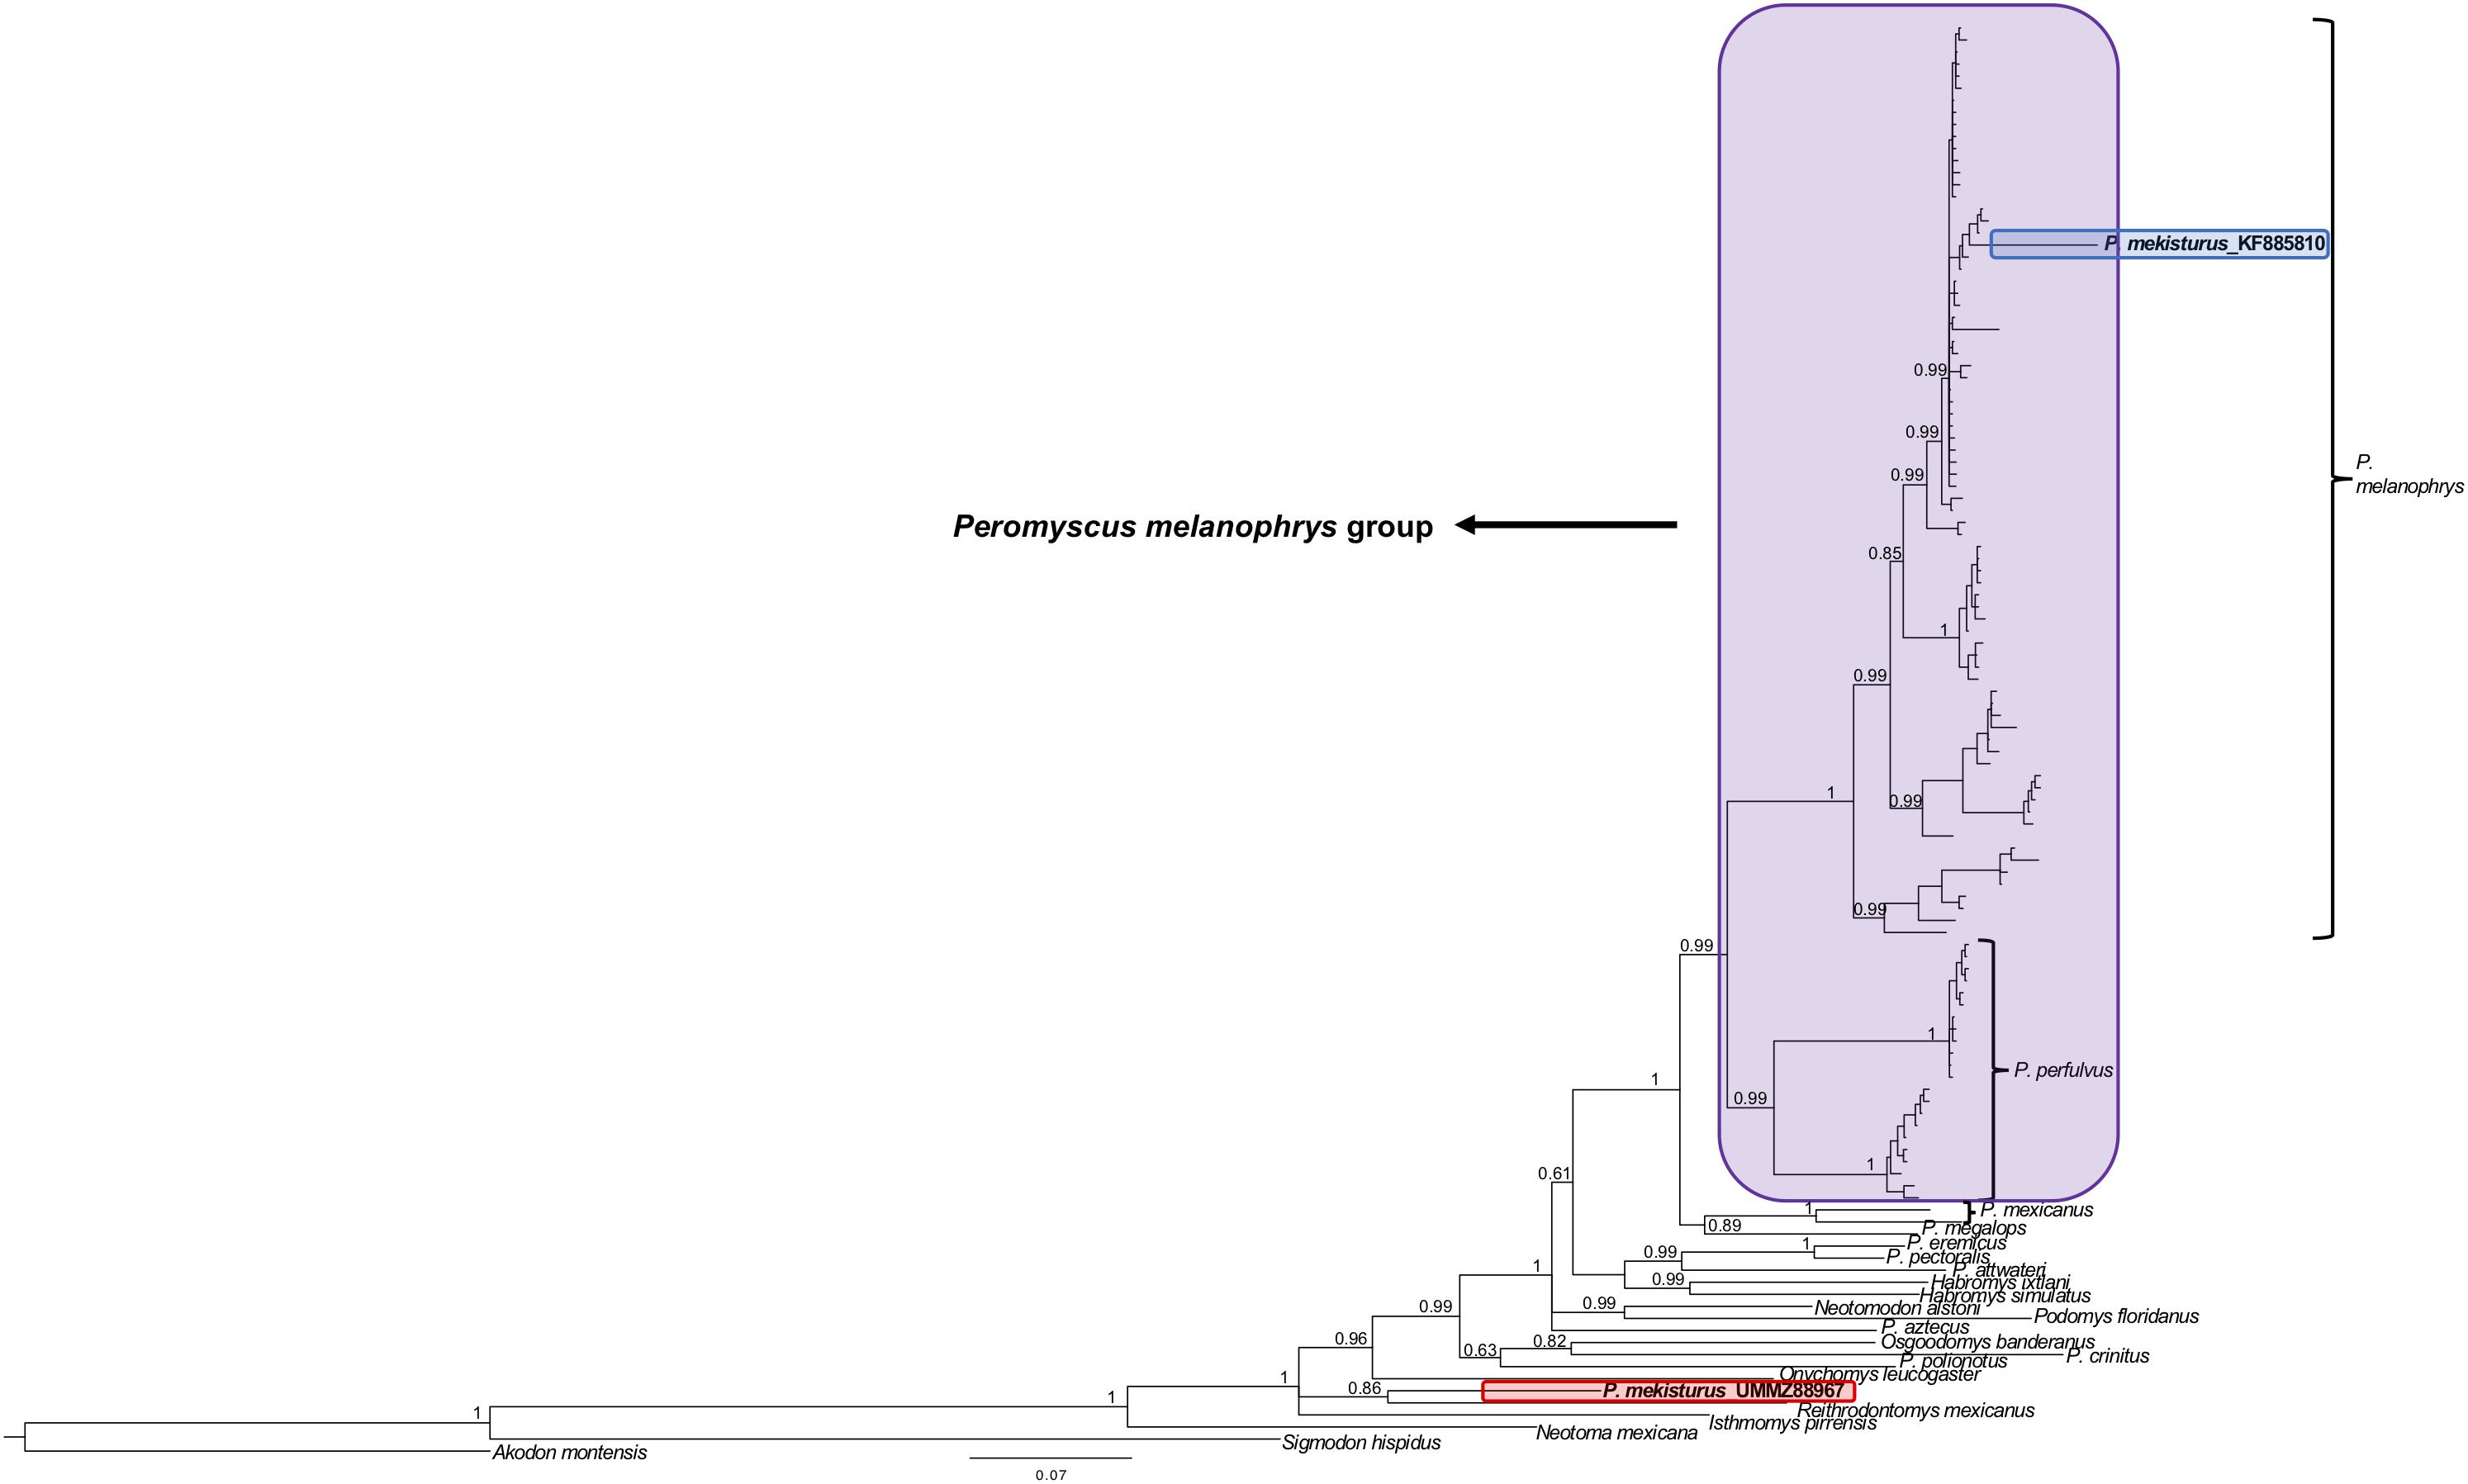
Figure 5. Bayesian Inference phylogeny based on ND3, tRNA-Arg, ND4L and partial ND4 genes (referred in the text as “multiple mitochondrial genes”) from 23 species. Nodal support is provided with posterior probabilities values. The purple block shows the composition of the Peromyscus melanophrys species group, the red block highlights the phylogenetic position of P. mekisturus_UMMZ88967 (sequence obtained by next-generation sequencing), and the blue block shows the placement of P. mekisturus_KF885910 (sequence obtained by Sanger sequencing).
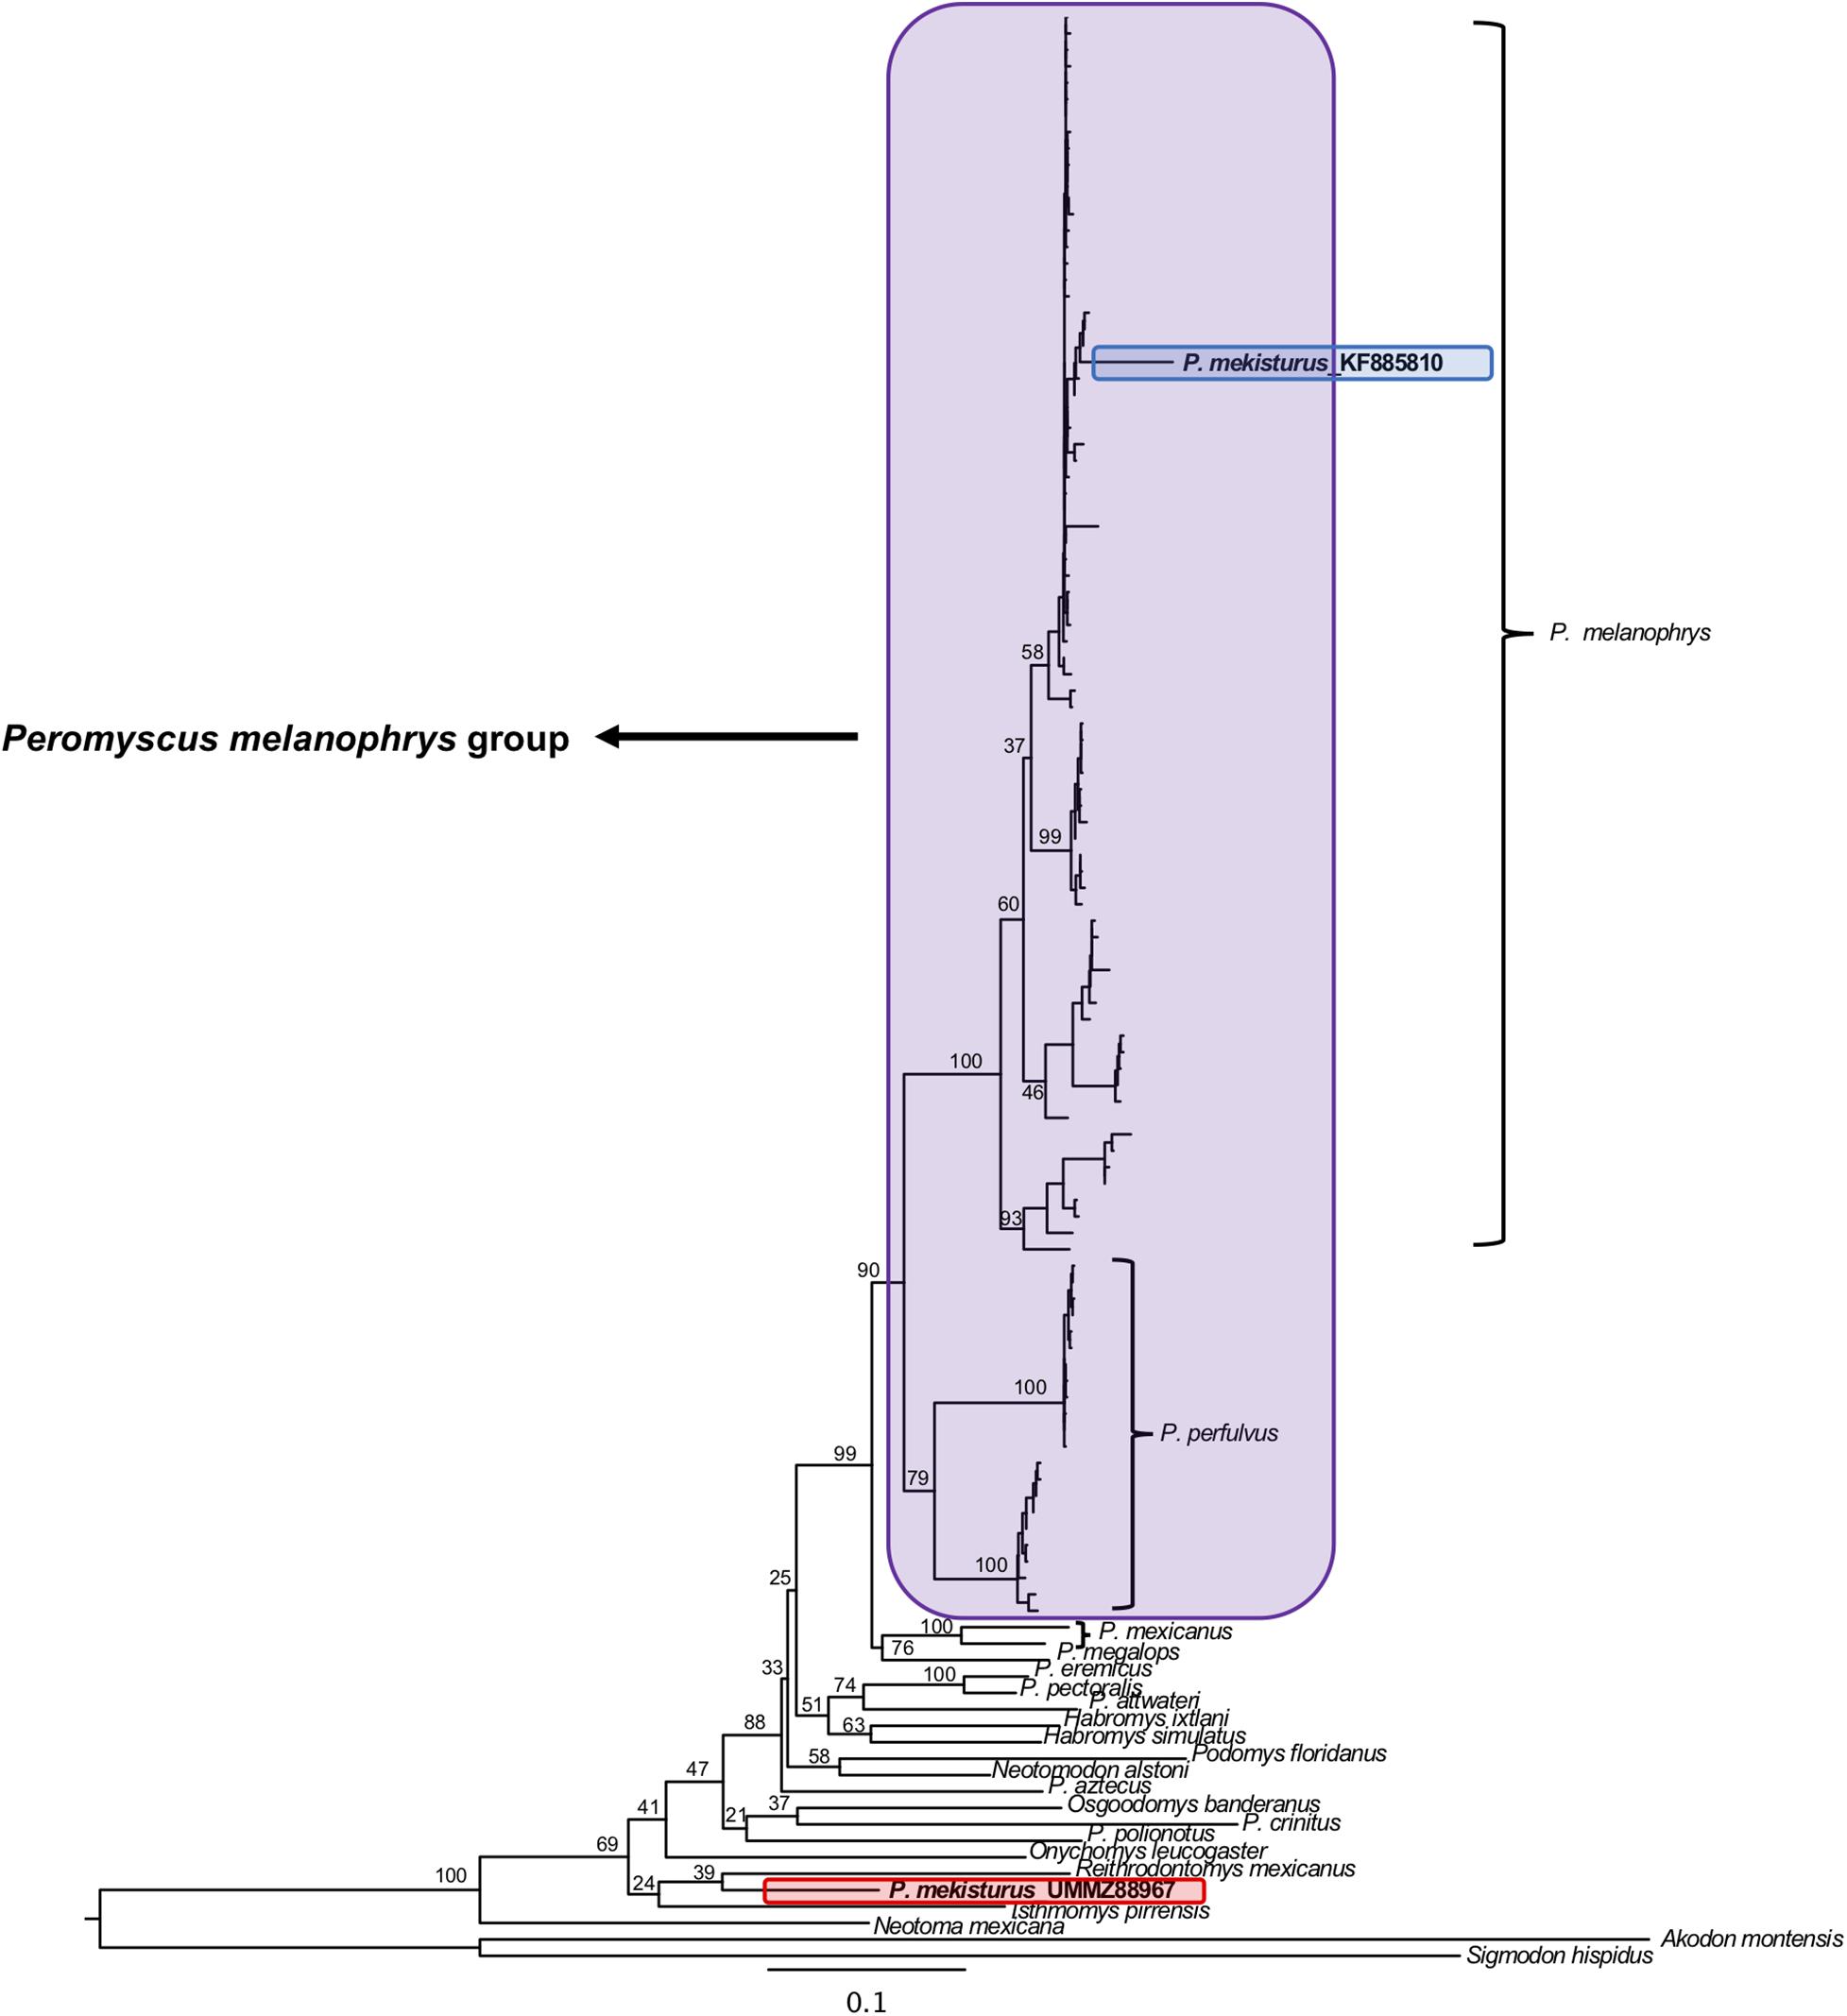
Figure 6. Maximum Likelihood phylogeny based on ND3, tRNA-Arg, ND4L and partial ND4 genes (referred in the text as “multiple mitochondrial genes”) from 23 species. Nodal support is provided with bootstrap values. The purple block shows the composition of the Peromyscus melanophrys species group, the red block highlights the phylogenetic position of P. mekisturus_UMMZ88967 (sequence obtained by next-generation sequencing), and the blue block shows the placement of P. mekisturus_KF885910 (sequence obtained by Sanger sequencing).
Discussion
Phylogenetic Inferences
Here, we used recent developments in NGS technology and ancient DNA protocols to help resolve the controversial phylogenetic position of the critically endangered Puebla deer mouse P. mekisturus. In doing so, we provide the first genomic study to generate nuclear data for P. mekisturus, and the first to include all members in the Peromyscus melanophrys species group recognized to date. We analyzed the same sample of P. mekisturus that Castañeda-Rico et al. (2014) used in their study (Hooper’s record collected in 1947), where they sequenced mitochondrial genes by traditional Sanger sequencing. We did not perform a total evidence analysis, using UCEs and mitogenomes, because the rate of evolution of UCEs is still not well understood and it remains an area of research (Faircloth et al., 2015; Tangliacollo and Lanfear, 2018). In addition, the rate of evolution of between UCEs and mitogenomes would likely be very different and consequently these data would be partitioned anyway. Therefore, we analyzed and discussed nuclear and mitochondrial data independently. Our nuclear phylogenetic analysis using UCEs and mitogenomes (Figures 1, 2) confirmed the monophyly of P. melanophrys and P. perfulvus, which had been previously proposed based on morphological characters and a few mitochondrial genes (Osgood, 1909; Hall and Kelson, 1952; Hooper and Musser, 1964; Hooper, 1968; Carleton, 1989; Bradley et al., 2007; Castañeda-Rico et al., 2014). However, contrary to previous hypotheses placing P. mekisturus in the Peromysus melanophrys species group (Osgood, 1909; Carleton, 1989; Musser and Carleton, 1993, 2005; Castañeda-Rico et al., 2014), we found that both UCEs and mitogenomes (Figures 1, 2) place P. mekisturus outside of the monophyletic clade containing the other putative members of the Peromyscus melanophrys species group (P. melanophrys and P. perfulvus). Furthermore, our more densely taxonomically sampled mitochondrial DNA (mtDNA) phylogenies (Figures 2–6) support the placement of P. mekisturus as the sister species of Reithrodontomys and closely related to Isthmomys. We conclude that P. mekisturus is not part of the Peromyscus melanophrys species group (supported by nuclear and mitochondrial data) and it is placed as the sister species of the genus Reithrodontomys and closely related to the genus Isthmomys (supported by mitochondrial data) contrary to the findings of previous morphological and genetic studies (Osgood, 1909; Hall and Kelson, 1952; Hooper and Musser, 1964; Hooper, 1968; Carleton, 1989; Musser and Carleton, 1993, 2005; Bradley et al., 2007; Castañeda-Rico et al., 2014).
Given that some Peromyscus species groups were somewhat underrepresented in the mitogenome dataset (we were only able to include members of eight of 13 groups), we sought to further confirm the phylogenetic position of P. mekisturus using the Cytb gene to reconstruct a more complete phylogeny including members of all 13 Peromyscus species groups as well as representatives of the more distantly related neotomine and sigmodontine rodents (Figures 3, 4). Although more weakly supported (i.e., with low posterior probabilities and bootstrap values for some clades), the Cytb phylogeny confirmed our well-supported mitogenome phylogeny, resulting in the placement of P. mekisturus as more closely related to the genera Reithrodontomys and Isthmomys than to any other species of Peromyscus. Furthermore, we note that our near-complete mitogenome phylogeny and Cytb phylogeny are consistent with previous published phylogenies that did not sample P. mekisturus (e.g., mitogenome phylogeny: Sullivan et al., 2017; Sanger phylogenies using a few genes: Bradley et al., 2007; Miller and Engstrom, 2008; Platt et al., 2015).
This is the first time that any kind of published evidence suggests that P. mekisturus is the sister species of the genus Reithrodontomys. However, more analyses are needed to determine how the P. mekisturus + Reithrodontomys and Isthmomys clade should be classified, and where it sits in the phylogeny. It is important to mention that no other phylogenetic analysis has ever suggested that the genus Reithrodontomys should be nested within Peromyscus (Sullivan et al., 2017) despite the close relationship between Reithrodontomys and Isthmomys (Hooper and Musser, 1964; Bradley et al., 2007; Miller and Engstrom, 2008; Platt et al., 2015; Sullivan et al., 2017). However, Isthmomys is recognized at the generic (sensu stricto) or subgeneric (sensu lato) level within Peromyscus (Figures 5, 6). Therefore, P. mekisturus could be in the same position as Isthmomys, i.e., still considered part of the genus Peromyscus (sensu lato or sensu stricto) but suggesting paraphyly as several previous studies have shown (Bradley et al., 2007; Miller and Engstrom, 2008; Platt et al., 2015; Sullivan et al., 2017).
A taxonomic revision of P. mekisturus is clearly warranted. We recommend that nuclear genetic data (UCEs) from more representatives of the subfamily Neotominae be incorporated in order to conclusively resolve the phylogenetic position of P. mekisturus. Given our striking and unexpected results, we also recommend that the taxonomic revision incorporates a morphological re-evaluation for P. mekisturus.
Sanger Sequencing and Next-Generation Sequencing of Ancient DNA: The Case of Peromyscus mekisturus
Phylogenetic results obtained for P. mekisturus based on Sanger sequencing in a previous study (P. mekisturus_KF885810: Castañeda-Rico et al., 2014) and NGS sequencing in this study (P. mekisturus_UMMZ88967: this study) were strikingly different. Our re-analysis using only the mitochondrial genes sequenced by Castañeda-Rico et al. (2014) (Figures 5, 6) but including additional members of the subfamily Neotominae clearly showed that the Sanger-based and NGS-based sequences of P. mekisturus do not cluster together. The previously published Sanger sequence (P. mekisturus_KF885810) was again placed within a clade where all the other samples are considered to be P. melanophrys (same result as Castañeda-Rico et al., 2014), while our novel NGS sequence (P. mekisturus_UMMZ88967) was placed as the sister species of R. mexicanus, in agreement with the mitogenome and Cytb phylogenies (Figures 2–4). Thus, we can reject the limited number of members of the subfamily Neotominae in Castañeda-Rico et al. (2014) as the cause for the differences between the Sanger- and NGS-based phylogenetic hypotheses.
Instead, we propose that this discrepancy is most likely due to the different protocols and conditions used to obtain sequences from each sample of P. mekisturus (i.e., the use of a modern DNA facility vs. a dedicated ancient DNA facility and Sanger sequencing vs. NGS) better explain the phylogenetic discrepancies that we found. To clarify this, we investigated how the sequences (ca. 1,315 bp) in Castañeda-Rico et al. (2014) were generated. The P. perfulvus sample (P. perfulvus_MCP119) was an ethanol-preserved internal organ, therefore DNA was of sufficient quality and quantity to sequence it in two fragments, each with an average length of 700 bp (Castañeda-Rico et al., 2014). The two P. perfulvus sequences, from this study and from Castañeda-Rico et al. (2014) were nearly identical (P. perfulvus_KF885791 and P. perfulvus_MCP119). Samples from P. melanophrys and P. mekisturus were obtained from dried skin and dried skin + turbinate bones, respectively. Because of DNA degradation, sequences were amplified using specific primers designed to amplify an average of 217 bp for each fragment, from a total of eight separate PCR reactions (Castañeda-Rico et al., 2014). In this case, the comparison of the sequences yielded by the two sequencing methods showed more differences between the sequences (20 bp for P. melanophrys and 162 bp for P. mekisturus). Although the samples of P. melanophrys and P. mekisturus were both dried skins (in this study), the P. melanophrys specimen was collected in 1984 and the P. mekisturus in 1947, almost 40 years earlier. We were not able to determine whether the relative ages of the specimens affected the resulting sequence data or if it was due to other characteristics of the specimens (e.g., preservation method). Nevertheless, the few differences detected in P. melanophrys were not enough to influence the phylogenetic signal, but the P. mekisturus sequences had enough differences to affect the phylogenetic reconstruction resulting in conflicting hypotheses. Additionally, the fact that the partial mitochondrial sequence (545 bp) that we generated here using Sanger sequencing was a perfect match to the same fragments generated by NGS allowed us to further corroborate that the correct sequence for P. mekisturus was generated in this study (P. mekisturus_UMMZ88967). Therefore, we can conclude that the discrepancies found between the Sanger sequence (P. mekisturus_KF885810) from Castañeda-Rico et al. (2014) and the NGS sequences generated in this study can be attributed primarily to the use of an ancient DNA facility and rigorous protocols designed to control contamination which were not followed in Castañeda-Rico et al. (2014), and not to the use of Sanger sequencing vs. NGS methodologies. However, we should point out that it is much more challenging to obtain sequences using traditional Sanger method from museum specimens, and the use of specialized aDNA extraction and sequencing protocols should be carefully considered.
For decades, Sanger sequencing has been the gold standard sequencing technology (Berglund et al., 2011; Liu et al., 2012). However, in recent years the use of NGS technologies has dramatically increased owing to its higher throughput, reduced cost, and benefits of obtaining sequences from highly degraded ancient DNA samples (Berglund et al., 2011; Liu et al., 2012). Both Sanger and NGS are accurate, though some studies have disagreed on which is more accurate for the detection of low frequency mutations (e.g., Ihle et al., 2014; Arsenic et al., 2015; Beck et al., 2016). Most of the studies comparing sequences derived from the two methods show a high correlation between the two methodologies (Gunnarsdottir et al., 2011; Arsenic et al., 2015; Arias et al., 2018). Critically, all of these studies have been focused on clinical research using fresh samples (e.g., blood, organ tissues, etc.) and thus do not assess the additional difficulties and peculiarities that can affect the validity and quality of ancient DNA sequences obtained from both Sanger and NGS protocols. Ancient DNA samples are characterized and defined by their low yield and poor quality associated with damage accumulated over time. This results in the progressive fragmentation of DNA molecules into shorter fragments, and cytosines deaminating to uracils. There is also a high risk of contamination of samples with modern DNA (Pääbo et al., 2004; Fortes and Paijmans, 2015) and a low ratio of endogenous versus environmental and contaminant DNA (Knapp and Hofreiter, 2010; Fortes and Paijmans, 2015). The analysis of ancient samples is therefore particularly challenging, and for many years has been more focused on mtDNA which is expected to be better preserved and to provide higher endogenous content than nuclear DNA because of its higher copy numbers (Rowe et al., 2011; Fortes and Paijmans, 2015). Further contributing to these issues is the unpredictable preservation of DNA in ancient DNA sources. Several studies have proposed that the quality and quantity of the DNA is related to specimen age (Pääbo et al., 1990; Ellegren, 1994), the manner in which a specimen was prepared and stored during and after collection (Wandeler et al., 2007; Mason et al., 2011; Guschanski et al., 2013; McCormack et al., 2016; McDonough et al., 2018), and the difference of tissue type used to extract ancient DNA (Casas-Marce et al., 2010; McDonough et al., 2018). An additional challenge is that preservation is frequently intended to ensure long-term integrity of the museum specimen rather than its DNA (McDonough et al., 2018), thus affecting the success of genetic and genomic studies.
Sanger sequencing DNA from museum specimens is not an easy process. The degraded fragments of ancient DNA require numerous independent PCR amplifications of overlapping short fragments (Knapp and Hofreiter, 2010; Rowe et al., 2011), and many sets of novel primers need to be designed. Because they are designed to target variable regions to the organism under study, the primers often lose their universality, which is one of their principal benefits (McCormack et al., 2017). Additional problems include that ancient DNA extract is often limited in quantity. Sanger approaches using PCR will only target a tiny fraction of the molecules at the very top end of the fragment length distribution, thereby greatly increasing the risk of starting amplifications from single molecules. This effect can introduce contamination of the resulting sequences and even small overall amounts of contamination can lead to erroneous sequences (Gilbert et al., 2005; Knapp and Hofreiter, 2010). Traditional PCR amplification and Sanger sequencing of historical specimens require considerable resources and strict protocols and controls to obtain reliable results. Even if PCR is successful, it often succeeds from only one or a small number of DNA template copies and thus can propagate postmortem mutations into the resulting sequence trace (Rowe et al., 2011). Overall, NGS technology represents the best option for the analysis of ancient DNA (Rizzi et al., 2012; Lemmon and Lemmon, 2013; McCormack et al., 2017; Webster, 2018) as it favors short DNA fragments and genomic library preparation targets the entire DNA extract by ligating adapters to each end of a single DNA fragment. This means that species-specific primers are no longer necessary, effectively allowing all fragments present in the extraction to be sequenced (Fortes and Paijmans, 2015). Additionally, NGS capture or target enrichment methods allow us to target specific regions within the whole genome (Burrell et al., 2015), increasing the chances to target genes or regions of interest for specific studies.
We have shown with our own data that while NGS and Sanger methods can provide accurate and consistent results for modern tissue samples (here, an ethanol preserved organ sample of P. perfulvus) independent of the kind of DNA facility used for the study. However, our results suggest that there is a poor correlation between Sanger and NGS sequences obtained from ancient DNA samples (i.e., our dried skin and bones from prepared museum specimens of P. melanophrys and P. mekisturus) that were Sanger sequenced in a facility with other modern tissue samples. In contrast, we found that NGS and Sanger methods are accurate for ancient DNA samples, when the study is performed following strict protocols to control for contamination in a dedicated ancient DNA facility. In particular, it is apparent that the Sanger sequence P. mekisturus_KF885810 sample obtained in Castañeda-Rico et al. (2014) was affected by the inherent problems associated with Sanger sequencing of ancient DNA (i.e., low DNA quantity and quality, several independent PCR amplifications in small fragments, use of specific primers, high susceptibility to modern DNA contamination, etc.) magnified by the lack of an ancient DNA facility and protocols. Specifically, we conclude that some of the factors that caused the erroneous P. mekisturus_KF885810 Sanger sequence were: (i) cross-contamination of other Peromyscus samples processed in that same lab during extraction and/or PCR steps, (ii) a chimera sequence formation by recombining different template molecules (jumping PCR) during PCR reactions, and (iii) a high risk of contamination from the environment when not working in a dedicated ancient DNA facility. Notably, some of our historical samples are not affected by contamination nor show excessive discrepancies between sequences obtained using different methods of sequencing (e.g., P. melanophrys_MQ1229). This could be due to better quality and quantity of DNA compared to other samples (e.g., P. mekisturus_UMMZ88967). All of these issues have been suggested in other studies as problems when using Sanger sequencing to work with ancient DNA (Meyerhans et al., 1990; Pääbo et al., 1990; Lahr and Katz, 2009; Kircher et al., 2012).
Here, we reiterate that extreme caution and validation are necessary to ensure accurate results when sequencing ancient DNA derived from museum specimens (dried skin, bones, cartilage, osteoclasts, hair, teeth, claws, etc.). Controlling for contamination can be problematic, particularly without comparing sequences obtained by different sequencing methods or based on independent replicates preferably obtained in different laboratories. Even when negative controls appear to be free of contamination, as was the case of P. mekisturus_KF885810 in Castañeda-Rico et al. (2014), a chimeric sequence could be obtained. Therefore, we strongly recommend the use of a dedicated ancient DNA facility with strict protocols for dealing with contamination when working with museum specimens, especially with those for which few or no modern samples exist in scientific collections or can no longer be found in the wild.
Conservation Implications
A large part of the earth’s biodiversity is still unknown to science, and a frequent misconception of the discovery process is that new species are only recognized as new when they are discovered in the field (Fontaine et al., 2012). However, this is not always the case. In fact, scientific collections can act as a reservoir of potential new species that are waiting to be discovered and described (Green, 1998; Bebber et al., 2010; Fontaine et al., 2012). An additional challenge is that most of these new species are cataloged as rare and they are represented by singletons (species only known from a single specimen), uniques (species that have only been collected once), or doubletons (species with a new singleton specimen being discovered in the process of additional sampling) (Fontaine et al., 2012; Lim et al., 2012). Rarity is not a new phenomenon and its commonness has been demonstrated in the description of many singleton species in the literature (Lim et al., 2012). The description of the olinguito (Bassaricyon neblina) by Helgen et al. (2013) is an example of the description of a species new to science using ancient DNA and museum specimens.
With a biodiversity crisis that predicts massive extinctions and an increase in time between discovery and description of new species, taxonomists will increasingly be describing species that are already extinct in the wild from museum collections (Fontaine et al., 2012). The study of extinct or highly endangered species, and extirpated populations or species, is an important application of NGS to museum specimens because no high-quality DNA will likely ever be available for many of these species (Rowe et al., 2011; McCormack et al., 2017), and their knowledge can contribute to studies of biodiversity loss, conservation and population genetics (Roy et al., 1994; Pichler et al., 2001; Martinez-Cruz et al., 2007; Peery et al., 2010; Rowe et al., 2011).
Our study demonstrates that ancient DNA approaches with appropriate rigorous protocols using museum specimens combined with high-throughput sequencing offers an opportunity to re-evaluate previous phylogenetic hypotheses. These new studies can validate previous results with additional data (e.g., complete mitogenomes and nuclear data) or reveal new conclusions, resulting in different phylogenetic hypotheses. This new evidence could offer a robust and reliable resolution of the evolutionary history and taxonomic status of species, resulting in the re-evaluation of previous conservation strategies or the establishment of new conservation programs in order to better protect and manage biodiversity. Information used to decide if a species is at risk of extinction and its threat category are usually based on ecological and demographic data such as the number of known individuals, current or projected declines in population size and the extent of occurrence or distribution (IUCN, 2014; Carneiro Muniz et al., 2019). However, for rare species where little additional information is available, genetic data is extremely important (Carneiro Muniz et al., 2019).
The case of the Puebla deer mouse, P. mekisturus, is very surprising. This species has always been recognized as a valid taxon since it was first described (Merriam, 1898; Osgood, 1909; Hooper, 1947; Carleton, 1989; Musser and Carleton, 1993, 2005; Álvarez-Castañeda and González-Ruiz, 2008) and there is no available evidence to suggest that the pattern that we observed was the result of hybridization or any other artifact. Furthermore, this species is only known from two specimens and two localities – Merriam’s (1898) holotype from Chalchicomula, and Hooper’s (1947) record from Tehuacán, both in the state of Puebla, Mexico. Therefore, little is known about its biology and information relevant to determining its conservation status remains incomplete. Despite this lack of information, this species falls into the Critically Endangered (CR) category of extinction risk in the IUCN and the Threatened category (A) in the Mexican Official Norm NOM-059-SEMARTNAT-2010 (Secretaría de Medio Ambiente y Recursos Naturales [SEMARNAT], 2010). Sánchez-Cordero et al. (2005) estimated that only ca. 41.66% of its habitat (pine-oak forest and arid zones) remains untransformed. That result was calculated more that 14 years ago; therefore, we suspect that the current remaining habitat is even smaller in area. Additionally, this species has not been detected or recorded in the wild for more than 70 years. The placement of this species within an Extinct (EX) category would definitely represent a loss of biodiversity. However, if our results are confirmed with morphological and additional nuclear data, we would be facing the extinction of a unique lineage of rodents. This would be a tremendous loss of evolutionary uniqueness and distinctiveness. P. mekisturus is a great example of how new efforts and studies are needed in order to discover and preserve our biodiversity. These results could be used by conservation managers and policymakers to minimize the impact of anthropogenic development on Earth’s biodiversity and help design urgent conservation strategies for pine-oak forest and arid zones.
Data Availability Statement
The raw data generated for this study can be found in the GenBank under BioProject: PRJNA606805 and under GenBank accession numbers given in Supplementary Table S1.
Ethics Statement
Ethical review and approval was not required for the animal study because we used only museum specimens deposited in scientific collections for this study. We obtained DNA from those specimens. Also, we used some published data available on GenBank.
Author Contributions
SC-R, CE, and JM secured funding. SC-R, LL-P, CE, and JM designed the study. SC-R performed the specimen sampling and lab experiments, analyzed and archived the data, and produced the figures, and wrote the manuscript with contributions from all co-authors. All authors read and approved the submitted version.
Funding
SC-R received a fellowship from the Consejo Nacional de Ciencia y Tecnología (CONACyT) for a postdoctoral stay at the Smithsonian Conservation Biology Institute and a Fellowship from Smithsonian-Mason School of Conservation and George Mason University.
Conflict of Interest
The authors declare that the research was conducted in the absence of any commercial or financial relationships that could be construed as a potential conflict of interest.
Acknowledgments
We thank the specimen collectors, collection managers, and the curators of the Museo de Zoología “Alfonso L. Herrera”, Facultad de Ciencias, UNAM (MZFC) and the University of Michigan Museum of Zoology (UMMZ) that granted sample loans. We specially thank Philip Myers (UMMZ) for the loan of P. mekisturus sample to the first author during the fulfillment of her Ph.D. dissertation research. We thank Rob C. Fleischer, Nancy R. McInerney, Lillian D. Parker, and Michael G. Campana for support of this research at the CCG; Sabina M. Lindley from the FDA-Center for Food Safety and Nutrition for donated MiSeq kits used in this study; and Lillian D. Parker, Madhvi X. Venkatraman, Anna M. Kearns, and the CCG writing group for comments that greatly improved this manuscript. This research was conducted using the Smithsonian Institution High Performance Cluster (SI/HPC). We wish to thank the Associate Editor Michael Knapp and two reviewers for their careful and insightful comments that greatly improved the quality of our manuscript.
Supplementary Material
The Supplementary Material for this article can be found online at: https://www.frontiersin.org/articles/10.3389/fevo.2020.00094/full#supplementary-material
Footnotes
- ^ https://github.com/FelixKrueger/TrimGalore
- ^ https://github.com/faircloth-lab/uce-probe-sets
- ^ https://www.geneious.com
- ^ http://www.bioinformatics.babraham.ac.uk/projects/fastqc
- ^ https://github.com/FelixKrueger/TrimGalore
- ^ https://github.com/lh3/seqtk
- ^ http://tree.bio.ed.ac.uk/software/figtree/
References
Allentoft, M. E., Collins, M., Harker, D., Haile, J., Oskam, C. L., Hale, M. L., et al. (2012). The half-life of DNA in bone: measuring decay kinetics in 158 dated fossils. Proc. R. Soc. B 279, 4724–4733. doi: 10.1098/rspb.2012.1745
Andrews, S. (2010). FastQC: A Quality Control Tool For High Throughput Sequence Data. Available online at: http://www.bioinformatics.babraham.ac.uk/projects/fastqc
Arias, A., López, P., Sánchez, R., Yamamura, Y., and Rivera-Amill, V. (2018). Sanger and next-generation sequencing approaches to evaluate HIV-1 virus in blood compartments. Int. J. Environ. Res. Public Health 15:1697. doi: 10.3390/ijerph15081697
Arsenic, R., Treue, D., Lehmann, A., Hummel, M., Dietel, M., Denkert, C., et al. (2015). Comparison of targeted next-generation sequencing and Sanger sequencing for the detection of PIK3CA mutations in breast cancer. BMC Clin. Pathol. 15:20. doi: 10.1186/s12907-015-0020-6
Álvarez-Castañeda, S., and González-Ruiz, N. (2008). “Análisis preliminar de las relaciones filogenéticas entre los grupos de especies del género Peromyscus,” in Avances en el estudio de los mamíferos de México II, eds C. Lorenzo, E. Espinoza, and J. Ortega (México: CIB. Universidad Veracruzana), 5–26.
Bebber, D. P., Carine, M. A., Wood, J. R. I., Wortley, A. H., Harris, D. J., Prance, G. T., et al. (2010). Herbaria are a major frontier for species discovery. Proc. Natl. Acad. Sci. U.S.A. 107, 22169–22171. doi: 10.1073/pnas.1011841108
Beck, T. F., Mullikin, J. C., and Biesecker, L. G. (2016). Systematic evaluation of Sanger validation of next-generation sequencing variants. Clin. Chem. 62, 647–654. doi: 10.1373/clinchem.2015.249623
Bergesten, J. (2005). A review of long-branch attraction. Cladistics 21, 163–193. doi: 10.1111/j.1096-0031.2005.00059.x
Berglund, E. C., Kiialainen, A., and Syvänen, A. C. (2011). Next-generation sequencing technologies and applications for human genetic history and forensics. Ivestig. Genet. 2:23. doi: 10.1186/2041-2223-2-23
Bradley, R. D., Durish, N., Rogers, D., Millar, J., Engstrom, M., and Kilpatrick, W. (2007). Toward a molecular Phylogeny for Peromyscus: evidence from mitochondrial cytochrome-b sequences. J. Mamm. 88, 1146–1159. doi: 10.1644/06-mamm-a-342r.1
Buerki, S., and Baker, W. J. (2016). Collections-based research in the genomic era. Biol. J. Linn. Soc. 117, 5–10. doi: 10.1111/bij.12721
Burrell, A. S., Disotell, T. R., and Bergey, C. M. (2015). The use of museum specimens with high-throughput DNA sequencers. J. Hum. Evol. 79, 35–44. doi: 10.1016/j.jhevol.2014.10.015
Camacho, C., Coulouris, G., Avagyan, V., Ma, N., Papadopoulos, J., Bealer, K., et al. (2009). BLAST+: architecture and applications. BMC Bioinformatics 10:421. doi: 10.1186/1471-2105-10-421
Carleton, M. D. (1989). “Systematics and evolution,” in Advances in the study of Peromyscus (Rodentia), eds G. L. Kirkland and J. Layne (Lubbock, TX: Texas Tech University Press), 7–141.
Carneiro Muniz, A., Lemos-Filho, J. P., Santiago de Oliveira Buzatti, R., Correa Ribeiro, P. C., Moreira Fernandes, F., and Lovato, M. B. (2019). Genetic data improve the assessment of the conservation status based only on herbarium records of a Neotropical tree. Sci. Rep. 9:5693. doi: 10.1038/s41598-019-41454-0
Carøe, C., Gopalakrishnan, S., Vinner, L., Mark, S. S. T., Sinding, M. H. S., Samaniego, J. A., et al. (2017). Single-tube library preparation for degraded DNA. Methods Ecol. Evol. 9, 410–419. doi: 10.1111/2041-210x.12871
Casas-Marce, M., Revilla, E., and Godoy, J. A. (2010). Searching for DNA in museum specimens: a comparison of sources in a mammal species. Mol. Ecol. Resour. 10, 502–507. doi: 10.1111/j.1755-0998.2009.02784.x
Castañeda-Rico, S., León-Paniagua, L., Vázquez-Domínguez, E., and Navarro-Sigüenza, A. G. (2014). Evolutionary diversification and speciation in rodents of the Mexican lowlands: the Peromyscus melanophrys species group. Mol. Phylogenet. Evol. 70, 454–463. doi: 10.1016/j.ympev.2013.10.004
Castresana, J. (2000). Selection of conserved blocks from multiple alignments for their use in phylogenetic analysis. Mol. Biol. Evol. 17, 540–552. doi: 10.1093/oxfordjournals.molbev.a026334
Chevreux, B., Wetter, T., and Suhai, S. (1999). Genome sequence assembly using trace signals and additional sequence information. Comput. Sci. Biol. 99, 45–56.
Darriba, D., Taboada, G. L., Doallo, R., and Posada, D. (2012). jModelTest 2: more models, new heuristics and parallel computing. Nat. Methods. 9:772. doi: 10.1038/nmeth.2109
Dawson, W. (2005). “Peromyscine biogeography, Mexican topography and pleistocene climatology,” in Contribuciones Mastozooloìgicas en Homenaje a Bernardo Villa, eds V. Saìnchez-Cordero and R. Medelliìn (Meìxico: UNAM-CONABIO), 145–156.
Ellegren, H. (1994). “Genomic DNA from museum bird feathers,” in Ancient DNA, eds B. Herrmann and two methodologies S. Hummel (New York, NY: Springer), 211–217. doi: 10.1007/978-1-4612-4318-2_15
Faircloth, B. C. (2013). Illumiprocessor: a Trimmomatic wrapper for parallel adapter and quality trimming. doi: 10.6079/J9ILL
Faircloth, B. C. (2016). PHYLUCE is a software package for the analysis of conserved genomic loci. Bioinformatics 32, 786–788. doi: 10.1093/bioinformatics/btv646
Faircloth, B. C., Branstetter, M. G., White, N. D., and Brady, S. G. (2015). Target enrichment of ultraconserved elements from arthropods provides a genomic perspective on relationships among Hymenoptera. Mol. Ecol. Resour. 15, 489–501. doi: 10.1111/1755-0998.12328
Faircloth, B. C., and Glenn, T. C. (2012). Not all sequence tags are created equal: designing and validating sequence identification tags robust to indels. PLoS One 7:e42543. doi: 10.1371/journal.pone.0042543
Faircloth, B. C., McCormack, J. E., Crawford, N. G., Harvey, M. G., Brumfield, R. T., and Glenn, T. C. (2012). Ultraconserved elements anchor thousands of genetic markers spanning multiple evolutionary timescales. Syst. Biol. 61, 717–726. doi: 10.1093/sysbio/sys004
Fontaine, B., Perrard, A., and Bouchet, P. (2012). 21 years of shelf life between discovery and description of new species. Curr. Biol. 22, 943–944. doi: 10.1016/j.cub.2012.10.029
Fortes, G. G., and Paijmans, J. L. A. (2015). “Analysis of whole mitogenomes from ancient samples,” in Whole Genome Amplification: Methods and Protocols, ed. T. Kroneis (US: Human Press), 1–17.
Gilbert, M. T. P., Bandelt, H. J., Hofreiter, M., and Barnes, I. (2005). Assessing ancient DNA studies. Trends Ecol. Evol. 20, 541–544. doi: 10.1016/j.tree.2005.07.005
Grabherr, M. G., Haas, B. J., Yassour, M., Levin, J. Z., Thompson, D. A., Amit, I., et al. (2011). Full-length transcriptome assembly from RNA-seq data without a reference genome. Nat. Biotechnol. 29, 644–652. doi: 10.1038/nbt.1883
Green, S. V. (1998). The taxonomic impediment in orthopteran research and conservation. J. Insect Conserv. 2, 151–159.
Guindon, S., and Gascuel, O. (2003). A simple, fast and accurate method to estimate large phylogenies by maximum-likelihood. Syst. Biol. 52, 696–704. doi: 10.1080/10635150390235520
Gunnarsdottir, E. D., Li, M., Bauchet, M., Finstermeier, K., and Stoneking, M. (2011). High-throughput sequencing of complete human mtDNA genomes from the Philippines. Genome Res. 21, 1–11. doi: 10.1101/gr.107615.110
Guschanski, K., Krause, J., Sawyer, S., Valente, L. M., Bailey, S., Finstermeier, K., et al. (2013). Next-generation museomics disentangles one of the largest primate radiations. Syst. Biol. 62, 539–554. doi: 10.1093/sysbio/syt018
Hall, E. R., and Kelson, K. R. (1952). Comments on the taxonomy and geographic distribution of some North American rodents. Univ. Kans. Publ. Mus. Nat. Hist. 5, 343–371.
Hall, T. A. (1999). BioEdit: a user-friendly biological sequence alignment editor and analysis program for Windows 95/98/TN. Nucleic Acids Symp. Ser. 41, 95–98. doi: 10.1007/0-387-27604-1_8
Hawkins, M. T. R., Hofman, C. A., Callicrate, T., McDonough, M. M., Tsuchiya, M. T. N., Gutiérrez, E. E., et al. (2016a). In-solution hybridization for mammalian mitogenome enrichment: pros, cons and challenges associated with multiplexing degraded DNA. Mol. Ecol. Resour. 16, 1173–1188. doi: 10.1111/1755-0998.12448
Hawkins, M. T. R., Leonard, J. A., Helgen, K. M., McDonough, M. M., Rockwood, L. L., and Maldonado, J. E. (2016b). Evolutionary history of endemic Sulawesi squirrels constructed from UCEs and mitogenomes sequenced from museum specimens. BMC Evol. Biol. 16:80. doi: 10.1186/s12862-016-0650-z
Helgen, K. M., Pinto, C. M., Kays, R., Helgen, L. E., Tsuchiya, M. T. N., Quinn, A., et al. (2013). Taxonomic revision of the olingos (Bassaricyon), with description of a new species, the Olinguito. ZooKeys 324, 1–83. doi: 10.3897/zookeys.324.5827
Hogan, K., Heding, M., Koh, S., Davis, K., and Greenbaum, I. (1993). Systematic and taxonomic implications of karyotypic, electrophoretic and mitochondrial DNA variation in Peromyscus from the Pacific Northwest. J. Mamm. 74, 819–831. doi: 10.2307/1382420
Hooper, E. T. (1968). “Classification,” in Biology of Peromyscus (Rodentia), ed. J. A. King (USA: American Society of Mammalogist Special Publication), 27–74.
Hooper, E. T., and Musser, G. G. (1964). Notes on classification of the rodent genus Peromyscus. Occas. Pap. Mus. Zool. Univ. Mich. 635, 1–13.
Huelsenbeck, J. P., and Ronquist, F. (2001). MRBAYES: bayesian inference of phylogeny. Bioinformatics 17, 754–755. doi: 10.1093/bioinformatics/17.8.754
Huson, D. H., Beier, S., Flade, I., Górska, A., El-Hadidi, M., Mitra, S., et al. (2016). MEGAN Community Edition - Interactive exploration and analysis of large-scale microbiome sequencing data. PLoS Comput. Biol. 12:e1004957. doi: 10.1371/journalpcbi.1004957
Ihle, M. A., Fassunke, J., König, K., Grünewald, I., Schlaak, M., Kreuzberg, N., et al. (2014). Comparison of high resolution melting analysis, pyrosequencing, next generation sequencing and immunohistochemistry to conventional Sanger sequencing for the detection of p.V600E and non-p.V600E BRAF mutations. BMC Cancer. 14:13. doi: 10.1186/1471-2407-14-13
Jónsson, H., Ginolhac, A., Schubert, M., Johnson, P., and Orlando, L. (2013). mapDamage2.0: fast approximate Bayesian estimates of ancient DNA damage parameters. Bioinformatics 13, 1682–1684. doi: 10.1093/bioinformatics/btt193
Katoh, K., and Standley, D. M. (2013). MAFFT multiple sequence alignment software version 7: improvements in performance and usability. Mol. Biol. Evol. 30, 772–780. doi: 10.1093/molbev/mst010
Kircher, M., Sawyer, S., and Meyer, M. (2012). Double indexing overcomes inaccuracies in multiplex sequencing on the Illumina platform. Nucleic Acids Res. 40:e3. doi: 10.1093/nar/gkr771
Knapp, M., and Hofreiter, M. (2010). Next generation sequencing of ancient DNA: requirements, strategies and perspectives. Genes 1, 227–243. doi: 10.3390/genes1020227
Lahr, D. J., and Katz, L. A. (2009). Reducing the impact of PCR-mediated recombination in molecular evolution and environmental studies using a new-generation high-fidelity DNA polymerase. Biotechniques 47, 857–866. doi: 10.2144/000113219
Lanfear, R., Frandsen, P. B., Wright, A. M., Senfeld, T., and Calcott, B. (2016). PartitionFinder 2: new methods for selecting partitioned models of evolution for molecular and morphological phylogenetic analyses. Mol. Biol. Evol. 34, 772–773. doi: 10.1093/molbev/msw260
Lemmon, E. M., and Lemmon, A. R. (2013). High-Throughput genomic data in systematics and phylogenetics. Annu. Rev. Ecol. Evol. Syst. 44, 99–121. doi: 10.1146/annurev-ecolsys-110512-135822
Li, H. (2013). Seqtk: A Fast and Lightweight Tool for Processing FASTA or FASTQ Sequences. Available online at: https://github.com/lh3/seqtk/
Lim, G., Balke, M., and Meier, R. (2012). Determining species boundaries in a world full of rarity: singletons, species delimitation methods. Syst. Biol. 61, 165–169. doi: 10.1093/sysbio/syr030
Liu, L., Li, Y., Li, S., Hu, N., He, R., et al. (2012). Comparison of Next-Generation Sequencing Systems. J. Biomed. Biotechnol. 2012, 1–11. doi: 10.1155/2012/251364
Marcovitz, A., Jia, R., and Bejerano, G. (2016). “Reverse genomics” predicts function of human conserved noncoding elements. Mol. Biol. Evol. 33, 1358–1369. doi: 10.1093/molbev/msw001
Martinez-Cruz, B., Godoy, J. A., and Negro, J. J. (2007). Population fragmentation leads to spatial and temporal genetic structure in the endangered Spanish imperial eagle. Mol. Ecol. 16, 477–486. doi: 10.1111/j.1365-294x.2007.03147.x
Mason, V. C., Li, G., Helgen, K. M., and Murphy, W. J. (2011). Efficient cross-species capture hybridization and next-generation sequencing of mitochondrial genomes from noninvasively sampled museum specimens. Genome Res. 21, 1695–1704. doi: 10.1101/gr.120196.111
McCormack, J. E., Rodríguez-Gómez, F., Tsai, W. L. E., and Faircloth, B. C. (2017). “Transforming museum specimens into genetic resources,” in The Extended Specimen: Emerging Frontiers in Collections-Based Ornithological Research, ed. M. S. Webster (Boca Raton, FL: CRC Press), 143–156.
McCormack, J. E., Tsai, W. L., and Faircloth, B. C. (2016). Sequence capture of ultraconserved elements from bird museum specimens. Mol. Ecol. Resour. 16, 1189–1203. doi: 10.1111/1755-0998.12466
McDonough, M. M., Parker, L. D., Rotzel, N., Campana, M. G., and Maldonado, J. E. (2018). Performance of commonly requested destructive museum samples for mammalian genomic studies. J. Mamm. 99, 789–802. doi: 10.1093/jmammal/gyy080
Merriam, C. H. (1898). Description of twenty new species and a subgenus of Peromyscus from Mexico and Guatemala. Proc. Biol. Soc. Wash. 12, 115–125.
Meyer, M., and Kircher, M. (2010). Illumina sequencing library preparation for highly multiplexed target capture and sequencing. Cold Spring Harb. Protoc. 2010:pdb.prot5448. doi: 10.1101/pdb.prot5448
Meyerhans, A., Vartanian, J. P., and Wain-Hobson, S. (1990). DNA recombination during PCR. Nucleic Acids Res. 18, 1687–1691. doi: 10.1093/nar/18.7.1687
Miller, J. R., and Engstrom, M. D. (2008). The relationships of major lineages within peromyscine rodents: a molecular phylogenetic hypothesis and systematic reappraisal. J Mamm. 89, 1279–1295. doi: 10.1644/07-mamm-a-195.1
Miller, M. A., Pfeiffer, W., and Schwartz, T. (2010). “Creating the CIPRES Science Gateway for inference of large phylogenetic trees,” in Proceedings of the Gateway Computing Environments Workshop (GCE), New Orleans, LA, 1–8.
Musser, G., and Carleton, M. D. (1993). “Family muridae,” in Mammal Species of the World: A Taxonomic and Geographic Reference, eds D. E. Wilson and M. Reeder (Washington DC: Smithsonian Institution Press), 501–755.
Musser, G., and Carleton, M. D. (2005). “Superfamily muridae,” in Mammal Species of the World: A Taxonomic and Geographic Reference, eds D. E. Wilson and M. Reeder (Baltimore, MD: Johns Hopkins University Press), 894–1531.
Osgood, W. (1909). Revision of the mice of the American genus Peromyscus. North Am. Fauna 28, 1–285. doi: 10.3996/nafa.28.0001
Pääbo, S. (1989). Ancient DNA: extraction, characterization, molecular cloning, and enzymatic amplification. Proc. Natl. Acad. Sci. U.S.A. 86, 1939–1943. doi: 10.1073/pnas.86.6.1939
Pääbo, S., Irwin, D. M., and Wilson, A. C. (1990). DNA damage promotes jumping between templates during enzymatic amplification. J. Biol. Chem. 265, 4718–4721.
Pääbo, S., Poinar, H., Serre, D., Jaenicke-Després, V., Hebler, J., Rhohland, N., et al. (2004). Genetic analyses from ancient DNA. Annu. Rev. Genet. 38, 645–679.
Peery, M. Z., Hall, L. A., Sellas, A., Beissinger, S. R., Moritz, C., Bérubé, M., et al. (2010). Genetic analyses of historic and modern marbled murrelets suggest decoupling of migration and gene flow after habitat fragmentation. Proc. R. Soc. B Biol. Sci. 277, 697–706. doi: 10.1098/rspb.2009.1666
Phillippe, H., Zhou, Y., Brinkmann, H., Rodrigue, N., and Delsuc, F. (2005). Heterotachy and long-branch attraction in phylogenetics. BMC Evol. Biol. 5:50. doi: 10.1186/1471-2148-5-50
Pichler, F. B., Dalebout, M. L., and Baker, C. S. (2001). Nondestructive DNA extraction from sperm whale teeth and scrimshaw. Mol. Ecol. Notes. 1, 106–109. doi: 10.1046/j.1471-8278.2001.00027.x
Platt, R. N. II., Amman, A. M., Keith, M. S., Thompson, C. W., and Bradley, R. D. (2015). What is Peromyscus? Evidence from nuclear and mitochondrial DNA sequences suggests the need for a new classification. J Mamm. 96, 708–719. doi: 10.1093/jmammal/gyv067
Rambaut, A., Drummond, A. J., Xie, D., Baele, G., and Suchard, M. A. (2018). Posterior summarization in Bayesian phylogenetics using Tracer 1.7. Syst. Biol. 67, 901–904. doi: 10.1093/sysbio/syy032
Riddle, B., Hafner, D., and Alexander, L. (2000). Phylogeography and systematics of the Peromyscus eremicus species group and the historical biogeography of North American Warm Regional deserts. Mol. Phylogenet. Evol. 17, 145–160. doi: 10.1006/mpev.2000.0841
Rizzi, E., Lari, M., Gigli, E., De Bellis, G., and Caramelli, D. (2012). Ancient DNA studies: new perspectives on old samples. Genet. Sel. Evol. 44:21. doi: 10.1186/1297-9686-44-21
Rohland, N., and Reich, D. (2012). Cost-effective, high-throughput DNA sequencing libraries for multiplexed target capture. Genome Res. 22, 939–946. doi: 10.1101/gr.128124.111
Ronquist, F., and Huelsenbeck, J. P. (2003). MRBAYES 3: bayesian phylogenetic inference under mixed models. Bioinformatics 19, 1572–1574. doi: 10.1093/bioinformatics/btg180
Rowe, K. C., Singhal, S., Macmanes, M. D., Ayroles, J. F., Morelli, T., Rubidge, M., et al. (2011). Museum genomics: low-cost and high-accuracy genetic data from historical specimens. Mol. Ecol. Resour. 11, 1082–1010.
Roy, M. S., Girman, D. J., Taylor, A. C., and Wayne, R. K. (1994). The use of museum specimens to reconstruct the genetic-variability and relationships of extinct populations. Experientia 50, 551–557. doi: 10.1007/bf01921724
Sánchez-Cordero, V., Illoldi-Rangel, P., Linaje, M., Sarkar, S., and Peterson, T. A. (2005). Deforestation and extant distribution of Mexican endemic mammals. Biol. Conserv. 126, 465–473. doi: 10.1016/j.biocon.2005.06.022
Sawyer, S., Krause, J., Guschanski, K., Savolainen, V., and Pääbo, S. (2012). Temporal patterns of nucleotide misincorporations and DNA fragmentation in ancient DNA. PLoS One 7:e34131. doi: 10.1371/journal.pone.0034131
Schmieder, R., and Edwards, R. (2011). Quality control and preprocessing of metagenomic datasets. Bioinformatics 27, 863–864. doi: 10.1093/bioinformatics/btr026
Secretaría de Medio Ambiente y Recursos Naturales [SEMARNAT] (2010). Norma Oficial Mexicana NOM-059-SEMARNAT-2010. Protección Ambiental, Especies Nativas de Flora y Fauna Silvestres de México, Categorías de Riesgo y Especificaciones Para su Inclusión, Exclusión o Cambio, y Lista de Especies en Riesgo. Diario Oficial de la Federación, 30 de diciembre de 2010, Segunda Sección. México: SEMARNAT.
Stamatakis, A. (2014). RAxML Version 8: a tool for phylogenetic analysis and post-analysis of large phylogenies. Bioinformatics 30, 1312–1313. doi: 10.1093/bioinformatics/btu033
Sullivan, K. A. M., Platt, R. N. II., Bradley, R. D., and Ray, D. A. (2017). Whole mitochondrial genomes provide increased resolution and indicate paraphyly in deer mice. BMC Zool. 2:11. doi: 10.1186/s40850-017-0020-3
Tangliacollo, V. A., and Lanfear, R. (2018). Estimating improved partitioning schemes for ultraconserved elements. Mol. Biol. Evol. 35, 1798–1811. doi: 10.1093/molbev/msy069
Wandeler, P., Hoeck, P. E., and Keller, L. F. (2007). Back to the future: museum specimens in population genetics. Trends Ecol. Evol. 22, 634–642. doi: 10.1016/j.tree.2007.08.017
Webster, M. S. (2018). “The extended specimen,” in The Extended Specimen: Emerging Frontiers in Collections-Based Ornithological Research, ed. M. S. Webster (Boca Raton, FL: CRC Press), 1–9.
Wiens, J. J. (2005). Can incomplete taxa rescue phylogenetic analyses from long-branch attraction? Syst. Biol. 54, 731–742. doi: 10.1080/10635150500234583
Keywords: biodiversity, diversification, mitogenomes, Peromyscus mekisturus, phylogenomics, Sanger sequencing, scientific collections, ultraconserved elements
Citation: Castañeda-Rico S, León-Paniagua L, Edwards CW and Maldonado JE (2020) Ancient DNA From Museum Specimens and Next Generation Sequencing Help Resolve the Controversial Evolutionary History of the Critically Endangered Puebla Deer Mouse. Front. Ecol. Evol. 8:94. doi: 10.3389/fevo.2020.00094
Received: 16 November 2019; Accepted: 24 March 2020;
Published: 15 April 2020.
Edited by:
Michael Knapp, University of Otago, New ZealandReviewed by:
Alicia Grealy, Australian National University, AustraliaKieren James Mitchell, The University of Adelaide, Australia
Copyright © 2020 Castañeda-Rico, León-Paniagua, Edwards and Maldonado. This is an open-access article distributed under the terms of the Creative Commons Attribution License (CC BY). The use, distribution or reproduction in other forums is permitted, provided the original author(s) and the copyright owner(s) are credited and that the original publication in this journal is cited, in accordance with accepted academic practice. No use, distribution or reproduction is permitted which does not comply with these terms.
*Correspondence: Susette Castañeda-Rico, susetteazul@gmail.com; castanedaricos@si.edu