Evaluating the Utility of Species Distribution Models in Informing Climate Change-Resilient Grassland Restoration Strategy
 Nicholas J. Lyon
 Diane M. Debinski
 Imtiaz Rangwala
- 1Department of Ecology, Evolution, and Organismal Biology, Iowa State University, Ames, IA, United States
- 2Department of Ecology, Montana State University, Bozeman, MT, United States
- 3Cooperative Institute for Research in Environmental Sciences, University of Colorado, Boulder, CO, United States
- 4Physical Sciences Division, Earth System Research Laboratory (NOAA), Boulder, CO, United States
- 5Department of Interior North Central Climate Science Center, Fort Collins, CO, United States
Tallgrass prairie ecosystems in North America are heavily degraded and require effective restoration strategies if prairie specialist taxa are to be preserved. One common management tool used to restore grassland is the application of a seed-mix of native prairie plant species. While this technique is effective in the short-term, it is critical that species' resilience to changing climate be evaluated when designing these mixes. By utilizing species distribution models (SDMs), species' bioclimatic envelopes–and thus the geographic area suitable for them–can be quantified and predicted under various future climate regimes, and current seed-mixes may be modified to include more climate resilient species or exclude more affected species. We evaluated climate response on plant functional groups to examine the generalizability of climate response among species of particular functional groups. We selected 14 prairie species representing the functional groups of cool-season and warm-season grasses, forbs, and legumes and we modeled their responses under both a moderate and more extreme predicted future. Our functional group “composite maps” show that warm-season grasses, forbs, and legumes responded similarly to other species within their functional group, while cool-season grasses showed less inter-species concordance. The value of functional group as a rough method for evaluating climate-resilience is therefore supported, but candidate cool-season grass species will require more individualized attention. This result suggests that seed-mix designers may be able to use species with more occurrence records to generate functional group-level predictions to assess the climate response of species for which there are prohibitively few occurrence records for modeling.
Introduction
Prairies in the United States are among the most degraded habitats in the world (Larson et al., 2011), and as such, have necessitated active restoration, particularly for the plant communities historically found in these systems (Vogel et al., 2007; Debinski et al., 2011; Pillsbury et al., 2011; Delaney et al., 2015). The addition of native plant seeds via seed-mixes is one restoration tool used to speed the re-colonization of degraded prairies by native prairie plant species (Dickson and Busby, 2009; Larson et al., 2011). However, the composition of seed-mixes can be limited by seed availability, cost of seeds from rare plants, or even a focus on particular seed ecotypes, thus restricting the possible combinations of species in a seed-mix used for a given area. The number of different species and relative abundance of seeds included in a given seed-mix must then be considered from ecological, economic, and logistical perspectives, and the success of the end-product is often judged years after the seed-mix is first implemented (Dickson and Busby, 2009). Given the need for viable restoration strategies in prairies, it is imperative that restoration efforts be successful in longer timeframes than is usually feasible for empirical monitoring. Modeling approaches can serve as a valuable tool in this regard, especially when the input data are easily collected or publicly available.
In particular, species distribution models (SDMs) can be used relatively easily (Kane et al., 2017) to assess how the effectiveness of species in a restoration seed-mix will change under different future climate predictions, and seed-mix composition can then be modified in the present without the need to wait years for experimental results. SDMs are used to predict the environmental suitability of a continent or landscape for individual species both in present conditions and under a variety of future climate change scenarios (Soberón and Nakamura, 2009; Elith et al., 2011). These models correlate current occurrence records of a species with the temperature and precipitation in that area to generate a prediction of the bioclimatic envelope for individual species, which can then be projected across a current or future landscape (Pearson and Dawson, 2003; Araújo and Guisan, 2006; Soberón and Nakamura, 2009; Elith et al., 2011). Climate data alone are sufficient predictors at macro-ecological scales (Pearson and Dawson, 2003), which increases the potential utility of these models to managers and researchers working with limited resources. These models are generally considered to generate robust predictions even in the absence of data on biotic factors, land-use, and soil type (Thuiller et al., 2004; Pearson et al., 2007), making them especially useful for species for which publicly available data are sparse or for projects where it is not feasible to collect occurrence records prior to model construction. By employing SDMs on prairie plant species used in a seed-mix currently in use in southern Iowa, the impact of possible climatic futures can be quantified and the utility of SDMs in recommending changes to seed-mix composition may be assessed. In addition, including multiple species from each of several functional groups (e.g., cool-season grasses, warm-season grasses, forbs, and legumes) can allow the conservation of response within functional group to be examined. This functional group-level response is especially relevant given the potential for functional group predictions to be used as a proxy for species without prerequisite data for their own models.
We hypothesized that (1) plant functional groups will show relatively conserved responses to changing climate and (2) most modeled species will show increasing suitability in the northern extent of their range and decreasing suitability in the southern edges of their range regardless of how conserved the response is within functional group.
Materials and Methods
Species Selection
To best assess the relevance of this modeling approach to managers, we retrieved publicly available occurrence records for all 26 tallgrass prairie plant species in a seed-mix currently used in the American Midwest. Of this initial pool, only 14 species were selected for modeling based on sufficient occurrence records. These species represent four functional groups: cool-season (C3) grasses, warm-season (C4) grasses, forbs (here defined as non-leguminous flowering plants), and legumes (Table 1). While this functional group approach leaves three of the functional groups presented here with relatively few included species, the limited number of species with enough occurrence records to model is likely to be a constraint encountered by managers using this approach, so modeling proceeded despite the reduced representation in some groups. Species occurrence records across North America were obtained from the Global Biodiversity Information Facility, the University of California Berkeley's Eco Engine, and the BISON database from United States Geological Survey via their packages in the R statistical environment—version 3.3.1—, “rgbif,” “ecoengine,” and “rbison” respectively (Chamberlain, 2016; Chamberlain et al., 2016; Ram, 2016). Only data that met Darwin Core standards (Wieczorek et al., 2012) were used. Records from outside of the tallgrass prairie region were included to ensure that the full range of environmental conditions each species has been observed to exist in was represented in our models.
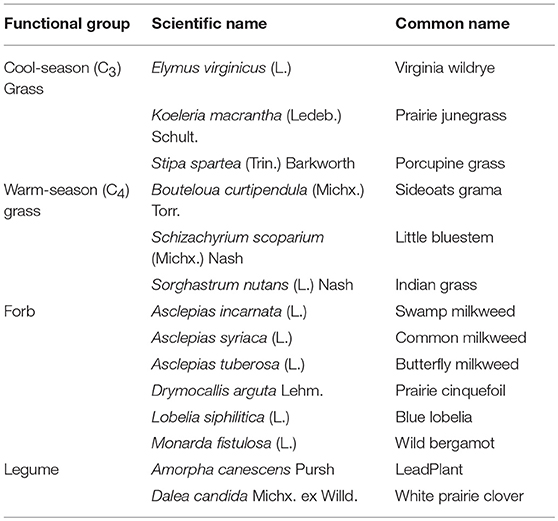
Table 1. Functional groups of modeled species.
Predictor Selection
All data for the climate-predictor variables were obtained from the WorldClim Global Climate Dataset—version 1.4—at a 2.5 min resolution (an area of ~5 km2 at the equator) using the same latitude and longitude bounds as those used for species occurrence data. This broad scale (both in terms of pixel size and spatial extent of model) was selected to prevent inappropriately fine interpretation of model outputs, as this has been indicated as an area of concern in projects utilizing presence-only modeling (Yackulic et al., 2013). WorldClim uses data from a large number of surface meteorological stations and applies an interpolation algorithm to generate spatially gridded data (Hijmans et al., 2005). Initially, all models are informed by eight bioclimatic (BIOCLIM) variables: mean temperature for the wettest (BIO8), driest (BIO9), warmest (BIO10), and coldest (BIO11) quarters averaged from 1960 to 1990 as well as the mean precipitation for the same quarters (BIO16 through 19 respectively). These variables were selected because they are the finest temporal BIOCLIM variables and are thus most likely to represent the intra-annual climatic variation species must tolerate. Only BIOCLIM variables with a Pearson correlation coefficient of < 0.7 with the other BIOCLIM variables at occurrence locations were included in training each model; this value was reduced from the 0.75 threshold used by Kane et al. (2017) due to the use of a greater number of predictor variables. Correlation was assessed on a per-species basis (Pearson and Dawson, 2003; Elith et al., 2010). The predictor variables used for each species are found in Table S1.
SDMs for the mid-Twenty first century (2041–2060) were built with the projected climate from the National Center for Atmospheric Research (United States) CCSM4 global climate model (GCM) in two Representative Concentration Pathway (RCP) emissions scenarios (RCP 4.5 and 8.5). The CCSM4 GCM predicts an average increase of 2.5°C across North America for RCP 4.5 and a 4.4°C average increase for RCP 8.5, and neither predicted future shows an average change of more than 1 cm in rainfall. Hereafter RCP 4.5 is referred to as the “moderate” future and RCP 8.5 as “extreme” future. The CCSM4 GCM is thus an ideal candidate for suitability response comparisons between possible future conditions because of the effective standardization of most variables other than temperature. This GCM also shows relatively low error frequency when compared to the observed climate for parts of North America (Rupp et al., 2013). Additionally, by using only RCPs from the same GCM, we control for any differences in model convention in the construction of these climate datasets, and therefore eliminate suitability prediction differences that are mere artifacts of GCM construction.
Modeling Methods
Current and future SDMs for each of the selected species were created with the modeling software MaxEnt version 3.3.3k (Elith et al., 2011) through its interface with the R statistical environment. Occurrence records were thinned in multivariate environmental space to account for potential oversampling of environmental conditions following from geographic sampling bias (de Oliveira et al., 2014) via principal components analysis (PCA) of the predictor variables associated with each occurrence record. The points were plotted against PC1 and PC2 and one record was randomly selected wherever multiple records overlapped. All models constructed had 40 or more occurrence records after environmental thinning (Table S1), to stay well above the recommended 25 minimum number of occurrence records (Pearson et al., 2007).
For each species, corrected Akaike Information Criterion (AICc) values were compared between models with MaxEnt's regularization parameter (β) set at 0.5, 1, 2, 3, 4, or 5, and the model with the lowest AICc was selected (Warren and Seifert, 2011). After each species' current distribution model was generated, projections into each predicted future were conducted for each species. In order to limit extrapolation, all models constructed used the default “clamping” option within MaxEnt such that climate values outside of those used to train the model are treated as if they were the end of the training range (Elith et al., 2011). All suitability predictions are made in the logistic output format such that predictions range from 1 (100% probability of presence) to 0 (0% probability of presence) on a continuous scale (Phillips and Dudík, 2008).
All models were evaluated by the area under the receiver-operator characteristic curve (AUC) (Merow et al., 2013; Kane et al., 2017). Cross-validation by resampling k-folds (k = 5) was performed to obtain a more discriminant AUC value, and for all models mean AUC was >0.82, indicating robust model performance for all species distribution models (Table S1). While AUC has been criticized as a method of model evaluation (Fourcade et al., 2018), our use of relatively few BIOCLIM variables (average of five predictor variables across all 14 species), coupled with our restriction of interpretation to climatic suitability rather than realized distribution both minimizes inflation of AUC and allows for relaxed predictor selection at the outset.
Due to our interest in the similarity of response of species within the same functional group rather than the response of particular species—and the high number of species-specific output models generated as a result of this process (42 total)—only composite maps are presented here to facilitate evaluation of functional group response. Composite maps demonstrate the number of modeled species that performed at or better than a given threshold of suitability. Composite maps presented here use 50% as that threshold such that each map demonstrates high suitability explicitly while allowing for equal interpretation of low suitability (e.g., if two species are doing well in a given area that means that the remainder of the species are not above the suitability threshold). A limitation of this approach is the loss of much of the gradient of suitability response but given the dramatic increase in interpretability to non-specialist audiences and likely relevance of such interpretability to managers, we continued in this vein.
Results
Cool-Season Grasses
Cool-season grasses did not exhibit a conserved response to either predicted future (Figure 1). All three cool-season grass species were predicted to have >50% suitability in only small and isolated areas outside of the American Midwest. However, in the RCP 8.5 predicted future, bioclimatic suitability for two of the three species was above the threshold throughout much of Iowa, Nebraska, and Kansas. There were areas in the Southeast and Northern Midwest for which all three species had low predicted suitability, so this offers partial support for this functional group sharing certain conditions that are unsuitable while the specific tolerances to less negative conditions vary by species. Interestingly, agreement between species of this group increased from present conditions to moderate future and increased further from the moderate to extreme future.
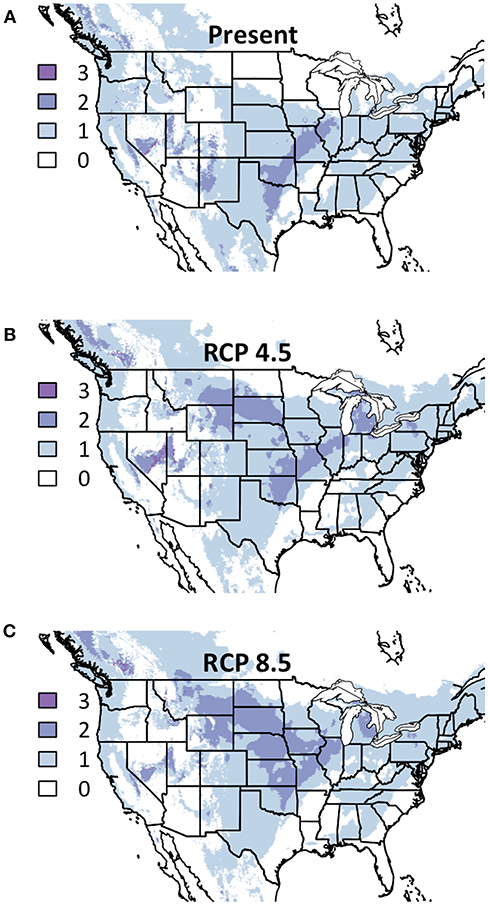
Figure 1. Composite Map of Cool-Season Grass (A) Current Distribution and Response to (B) RCP 4.5 and (C) RCP 8.5. Colors indicate the number of species where suitability is predicted to ≥50%. Darker colors indicate areas where bioclimatic suitability is above the threshold for more species. Included species are Elymus virginicus, Koeleria macrantha, and Stipa spartea. Time period is identified in the top of each panel.
Warm-Season Grasses
In contrast to the apparent lack of consensus in cool-season grass response, warm-season grasses tended to respond similarly in both future conditions (Figure 2). Not only did all three species show >50% future suitability throughout the vast majority of the American Midwest, for much of the Eastern half of the nation, two species remained above that threshold. Additionally, all three species showed below 50% suitability in the American southeast, and this area of low suitability remained consistent between the two RCPs. The area of overlapping suitability nearly doubled in size from present conditions to the moderate future though remained largely static between the two future predictions.
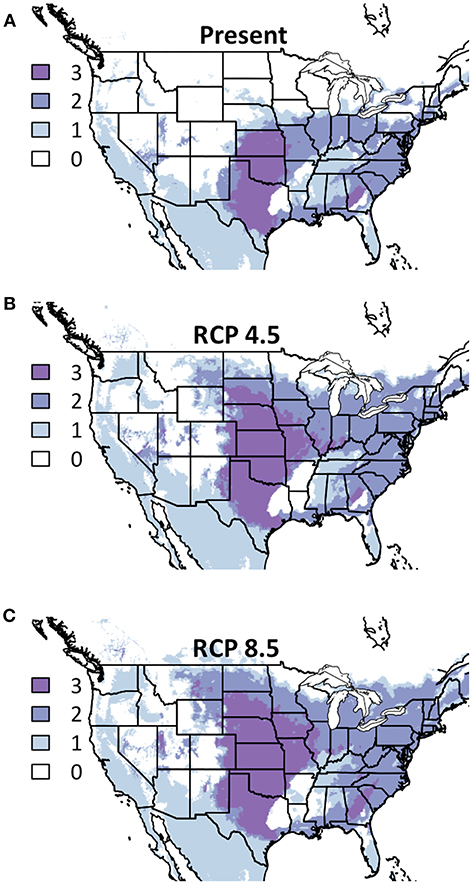
Figure 2. Composite Map of Warm-Season Grass (A) Current Distribution and Response to (B) RCP 4.5 and (C) RCP 8.5. Colors indicate the number of species where suitability is predicted to ≥50%. Darker colors indicate areas where bioclimatic suitability is above the threshold for more species. Included species are Bouteloua curtipendula, Schizachyrium scoparium, and Sorghastrum nutans. Time period is identified in the top of each panel.
Forbs
More forb species were modeled than any other functional group in this project, making the observed conservation of response among those species even more striking. Not only does the area of above 50% suitability overlap for nearly all modeled species; most species are also below the threshold when any one is (Figure 3). Areas of suitable conditions are largely in the American Northeast and most of that area is projected to be suitable for at least five of the six modeled forb species. While in RCP 4.5 very little of the American Midwest is suitable for even one species, in RCP 8.5 this area is projected to be suitable for at least one species (and in many areas as many as three).
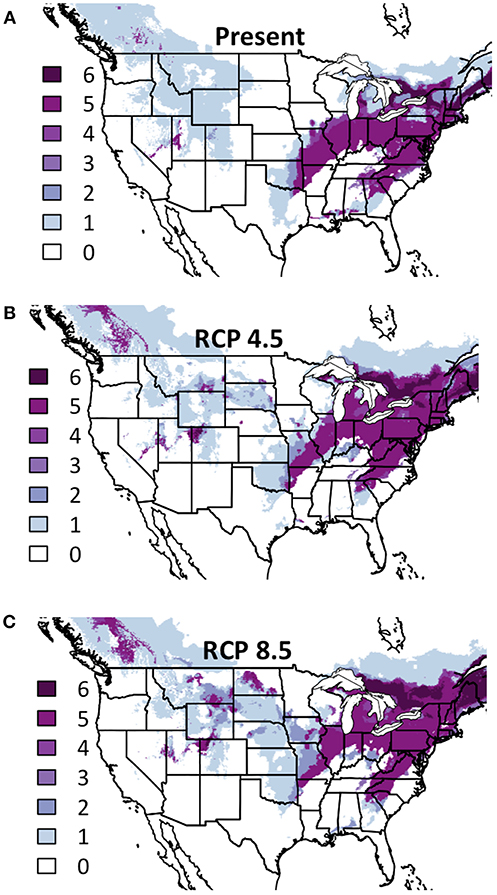
Figure 3. Composite Map of Forb (A) Current Distribution and Response to (B) RCP 4.5, and (C) RCP 8.5. Colors indicate the number of species where suitability is predicted to ≥50%. Darker colors indicate areas where bioclimatic suitability is above the threshold for more species. Included species are Asclepias incarnata, A. syriaca, A. tuberosa, Drymocallis arguta, Lobelia siphilitica, and Monarda fistulosa. Time period is identified in the top of each panel.
Legumes
While only two legume species had sufficient occurrence records for modeling, and our inferential abilities are therefore limited, the areas of consensus are of note. The American Midwest is projected to be suitable for both legume species in both futures (Figure 4), though the specific area is somewhat north of the suitable area for warm-season grasses and west of forb areas. As with warm-season grasses, the area in present conditions predicted to be suitable for all modeled legumes virtually only expands from present to either future condition, indicating that some groups may be sufficiently climate-resilient that they can be maintained in current areas while also introduced into previously inhospitable areas.
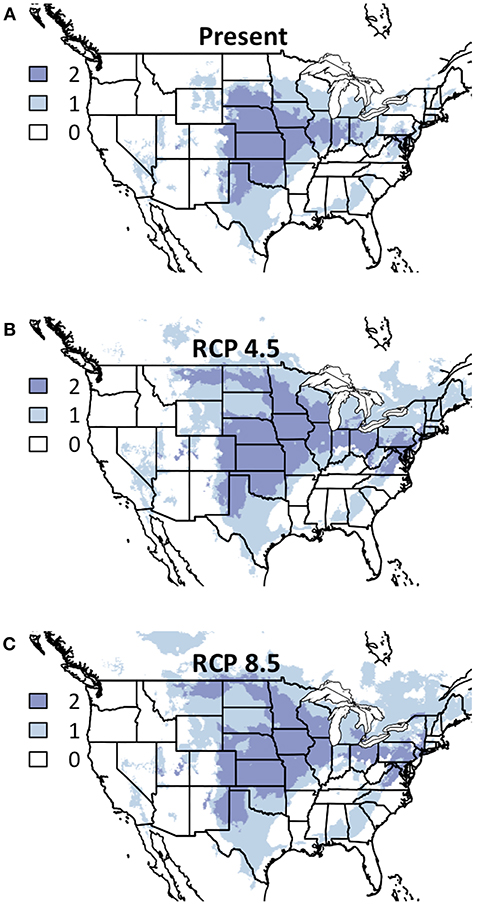
Figure 4. Composite Map of Legume (A) Current Distribution and Response to (B) RCP 4.5 and (C) RCP 8.5. Colors indicate the number of species where suitability is predicted to ≥50%. Darker colors indicate areas where bioclimatic suitability is above the threshold for more species. Included species are Amorpha canescens and Dalea candida. Time period is identified in the top of each panel.
Discussion
While we hypothesized that species within each functional group would have conserved responses to changing climate, this appears to only be partially true; while forb response was highly conserved, warm-season grass and legume response were less so and there were very fewer areas of consensus among cool-season grasses. This indicates that while functional group may be a good predictor for climate response for some functional groups, there are some limitations. The relatively few species per functional group is particularly limiting to our assessment of the value of functional group as a predictor of species' response, though is likely to be equally limiting to managers using SDMs to inform restoration strategy. Additionally, though we hypothesized that all species would likely shift northwards (i.e., suitability would decline in the southern-most areas and increase in the northern-most areas) only forbs exhibited this response. Given these findings, it is clear that functional group is not an equally good predictor of response to climate change across the four functional groups used here. Further exploration of functional group response to climate change—particularly with a greater number of modeled species per group—will lend valuable insight into the climate-resiliency of different groups. An alternative avenue to merely increasing the number of species per group would be to use the physiological tolerances of each species to define more ecologically relevant groups for modeling. Such an approach would be extremely valuable to improving the relevance of SDMs and would also dramatically increase the precision of management recommendations from such models.
For Midwestern restorations using seed-mixes, warm-season grasses and legumes can be expected to have some resilience to changing climate because these groups show high suitability in the Midwest in both future conditions (Figures 2, 3). This response makes them better candidates for inclusion in seed-mixes than many cool-season grass or forb species. However, it should be noted that both of those less-resilient functional groups do have members for whom the Midwest remains suitable (Figures 1, 4), so some species-specific modeling may be valuable. Also, for restorations being conducted in the southern or eastern Midwest, even under the most severe predicted future all functional groups (and virtually all modeled species) have predicted suitability above 50%, indicating that responses to climatic change may be less extensive in those areas, at least in the near-term.
The variability in suitability response between the two grass functional groups may be explained by the current prevalence of warm-season grasses in areas of hotter conditions. Moderately increasing surface temperatures appear to remain within the tolerance of warm-season grasses—at least initially—in a way that is less expected for cool-season grasses. This would also help explain the northward expansion of warm-season suitability insofar as unsuitable (i.e., cold) conditions in the northern United States would become more suitable (i.e., warmer) in the future. One caveat particularly relevant to the discussion of the two grass functional groups' responses is that the terms “warm-season” and “cool-season,” while useful, should not be taken to be absolute predictors of thermal tolerance. As brought up earlier, quantification of true physiological responses of these species will invariably lead to increased quality of result and should be pursued in future studies.
A factor that is left unconsidered here but is likely to affect distributions and suitability for these functional groups in particular is the impact of changing atmospheric CO2 levels on the different photosynthetic modes of cool and warm-season grasses (C3 and C4 photosynthesis respectively). C4 photosynthesis allows for more carbon concentration, and hence more chemically efficient photosynthesis reactions in low CO2 environments, than does C3 photosynthesis (Taiz et al., 2014). This physiological difference is likely to affect the response of grasses to anthropogenic climate change (Griffith et al., 2017), and could exacerbate the projected responses of these functional groups. However, it is improbable that a functional group or species predicted to experience extremely low suitability in a given area because of some combination of temperature and rainfall will be able to surmount these constraints if the concentration of atmospheric CO2 becomes more advantageous for its photosynthetic mode.
In contrast to the grass species, and despite the larger number of forb species included, suitability changes were highly consistent across species (Figure 3). This was also the case for both warm-season grass and legume response, but the consensus among forb species is particularly noteworthy because it is conserved in a novel area and included many more species than other functional groups. It is also valuable to consider that the number of species for which suitability is predicted to be above 50% increases in the Midwest from present conditions to moderate future and even further from moderate to extreme future, though never to the extent of agreement found in the Northeast.
Given that only two legume species included in the seed-mix drawn from here had numerous enough occurrence records for model construction, generalizations about this functional group are especially limited. That being said, areas suitable for one species tended to be suitable for both across the majority of the modeled landscape, and the same was true for unsuitable conditions (Figure 4). The legume functional group also exhibited very little change between the two future conditions, which may be indicative of at least some resilience of this functional group to changing climate. This seems particularly the case when considering that the suitable area only increases from present to either futures' predicted conditions.
The results presented here demonstrate that warm-season grasses, forbs, and legumes may be expected to show some consistency in responding to a warming world. Therefore, when species from within these functional groups are being evaluated for inclusion in seed-mixes, modeling of other members of the functional group—either individually or collectively as shown here—may provide valuable insights. Desired cool-season grasses may require more of a single-species approach because generalization across the functional group does not appear to be supported. Additionally, our results indicate that the general assumption of northern range shifts in response to climate change may not always be robust for these plant species. It is important however to reiterate that given the constraints of the limited number of species in each functional group, the strength of our inferences is correspondingly reduced. In assessing the potential utility of these models to informing restoration plans, choosing species for modeling from only those in use in a particular seed-mix is likely to dramatically reduce the scope of conclusions that can be drawn. For restoration planners interested in using this type of modeling approach, it will likely be more effective to either model species of interest individually or choose functional groups of interest and then model many species within those groups (regardless of whether or not those species are typically in a seed-mix).
In interpreting these results, it is also important to note that our models make no attempt to include soil, current land-use, biotic interactions, or other known biologically relevant factors in informing the predictions of current and future habitat suitability. In some cases, scientists and managers may be interested in predicting climate-change induced distribution changes at a finer spatial scale or including these variables. A microhabitat model is more appropriate for delving into this type of question than is a MaxEnt-style SDM (Araújo and Guisan, 2006; Araújo and Luoto, 2007). Likewise, a more mechanistically specific model will be better able to clarify how photosynthetic mode (e.g. C3 vs. C4) may buffer against or increase susceptibility to changing climate (Griffith et al., 2017). A more specific model is also likely to be able to evaluate the relative importance of each of these factors and potentially account for changes to the species-environment relationship that MaxEnt assumes to be constant. Nonetheless, the results presented here can serve to indicate areas where microhabitat models may be most profitably applied. Future models specific to the American southeast, Northern Great Plains, and upper Midwest could assist in understanding the potential microhabitat-scale impacts of climate change for these important prairie species.
The ability of SDMs to create continent-scale models from relatively few occurrence records, as demonstrated here, is remarkably useful as a complement to experimental restoration approaches and finer-scale modeling methods. By including both modeling and on-the-ground techniques, restoration projects will be better informed and will be more likely to restore and conserve the habitats and communities that will exist into the future, rather than solely replicating those communities that existed without consideration for the effects of a changing climate.
Author Contributions
DD and NL designed the research. NL performed the modeling and wrote the manuscript. NL, DD, and IR edited the manuscript.
Conflict of Interest Statement
The authors declare that the research was conducted in the absence of any commercial or financial relationships that could be construed as a potential conflict of interest.
Acknowledgments
We would like to thank Dr. Danielle Christianson and Dr. Adam Smith for their invaluable SDM workshop at the 2016 North American Congress for Conservation Biology (NACCB), as well as Dr. Kristin Kane for her advice on MaxEnt modeling conventions. This work would not have been possible without the generous support of the Leopold Center for Sustainable Agriculture (XP2016-07A), the North Central Climate Science Center, and the Center for Global and Regional Environmental Research (CGRER).
Supplementary Material
The Supplementary Material for this article can be found online at: https://www.frontiersin.org/articles/10.3389/fevo.2019.00033/full#supplementary-material
References
Araújo, M. B., and Guisan, A. (2006). Five (or so) challenges for species distribution modelling. J. Biogeogr. 33, 1677–1688. doi: 10.1111/j.1365-2699.2006.01584.x
Araújo, M. B., and Luoto, M. (2007). The importance of biotic interactions for modelling species distributions under climate change. Glob. Ecol. Biogeogr. 16, 743–753. doi: 10.1111/j.1466-8238.2007.00359.x
Chamberlain, S., Barve, V., and Mcglinn, D. (2016). rgbif: Interface to the Global ‘Biodiversity' Information Facility ‘API'.
de Oliveira, G., Rangel, T. F., Lima-Ribeiro, M. S., Terribile, L. C., and Diniz-Filho, J. A. F. (2014). Evaluating, partitioning, and mapping the spatial autocorrelation component in ecological niche modeling: a new approach based on environmentally equidistant records. Ecography 37, 637–647. doi: 10.1111/j.1600-0587.2013.00564.x
Debinski, D. M., Moranz, R. A., Delaney, J. T., Miller, J. R., Engle, D. M., Winkler, L. B., et al. (2011). A cross-taxonomic comparison of insect responses to grassland management and land-use legacies. Ecosphere 2, 1–16. doi: 10.1890/ES11-00226.1
Delaney, J. T., Jokela, K. J., and Debinski, D. M. (2015). Seasonal succession of pollinator floral resources in four types of grasslands. Ecosphere 6, 1–14. doi: 10.1890/ES15-00218.1
Dickson, T. L., and Busby, W. H. (2009). Forb Species establishment increases with decreased grass seeding density and with increased forb seeding density in a Northeast Kansas, U.S.A., experimental prairie restoration. Restor. Ecol. 17, 597–605. doi: 10.1111/j.1526-100X.2008.00427.x
Elith, J., Kearney, M., and Phillips, S. (2010). The art of modelling range-shifting species. Methods Ecol. Evol. 1, 330–342. doi: 10.1111/j.2041-210X.2010.00036.x
Elith, J., Phillips, S. J., Hastie, T., Dudík, M., Chee, Y. E., and Yates, C. J. (2011). A statistical explanation of MaxEnt for ecologists. Divers. Distrib. 17, 43–57. doi: 10.1111/j.1472-4642.2010.00725.x
Fourcade, Y., Besnard, A. G., and Secondi, J. (2018). Paintings predict the distribution of species, or the challenge of selecting environmental predictors and evaluation statistics. Glob. Ecol. Biogeogr. 27, 245–256. doi: 10.1111/geb.12684
Griffith, D. M., Cotton, J. M., Powell, R. L., Sheldon, N. D., and Still, C. J. (2017). Multi-century stasis in C3 and C4 grass distributions across the contiguous United States since the industrial revolution. J. Biogeogr. 44, 2564–2574. doi: 10.1111/jbi.13061
Hijmans, R. J., Cameron, S. E., Parra, J. L., Jones, P. G., and Jarvis, A. (2005). Very high resolution interpolated climate surfaces for global land areas. Int. J. Climatol. 25, 1965–1978. doi: 10.1002/joc.1276
Kane, K., Debinski, D. M., Anderson, C., Scasta, J. D., Engle, D. M., and Miller, J. R. (2017). Using regional climate projections to guide grassland community restoration in the face of climate change. Front. Plant Sci. 8:730. doi: 10.3389/fpls.2017.00730
Larson, D. L., Bright, J. B., Drobney, P., Larson, J. L., Palaia, N., Rabie, P. A., et al. (2011). Effects of planting method and seed mix richness on the early stages of tallgrass prairie restoration. Biol. Conserv. 144, 3127–3139. doi: 10.1016/j.biocon.2011.10.018
Merow, C., Smith, M. J., and Silander, J. A. (2013). A practical guide to MaxEnt for modeling species' distributions: what it does, and why inputs and settings matter. Ecography 36, 1058–1069. doi: 10.1111/j.1600-0587.2013.07872.x
Pearson, R. G., and Dawson, T. P. (2003). Predicting the impacts of climate change on the distribution of species: are bioclimate envelope models useful? Glob. Ecol. Biogeogr. 12, 361–371. doi: 10.1046/j.1466-822X.2003.00042.x
Pearson, R. G., Raxworthy, C. J., Nakamura, M., and Peterson, A. T. (2007). ORIGINAL ARTICLE: Predicting species distributions from small numbers of occurrence records: a test case using cryptic geckos in Madagascar. J. Biogeogr. 34, 102–117. doi: 10.1111/j.1365-2699.2006.01594.x
Phillips, S. J., and Dudík, M. (2008). Modeling of species distributions with Maxent: new extensions and a comprehensive evaluation. Ecography 31, 161–175. doi: 10.1111/j.0906-7590.2008.5203.x
Pillsbury, F. C., Miller, J. R., Debinski, D. M., and Engle, D. M. (2011). Another tool in the toolbox? using fire and grazing to promote bird diversity in highly fragmented landscapes. Ecosphere 2, 1–14. doi: 10.1890/ES10-00154.1
Ram, K. (2016). ecoengine: Programmatic Interface to the API Serving UC Berkeley's Natural History Data.
Rupp, D. E., Abatzoglou, J. T., Hegewisch, K. C., and Mote, P. W. (2013). Evaluation of CMIP5 20th century climate simulations for the Pacific Northwest, U. S. A. J. Geophys. Res. 118:2013JD020085. doi: 10.1002/jgrd.50843
Soberón, J., and Nakamura, M. (2009). Niches and distributional areas: concepts, methods, and assumptions. Proc. Natl. Acad. Sci. U.S.A. 106 (Suppl. 2), 19644–19650. doi: 10.1073/pnas.0901637106
Taiz, L., Zeiger, E., Møller, I. M., and Murphy, A. (2014). Plant Physiology and Development. Sunderland, MA: Sinauer.
Thuiller, W., Araújo, M. B., and Lavrovel, S. (2004). Special paper: do we need land-cover data to model species distributions in Europe? J. Biogeogr. 31, 353–361. doi: 10.1046/j.0305-0270.2003.00991.x
Vogel, J. A., Debinski, D. M., Koford, R. R., and Miller, J. R. (2007). Butterfly responses to prairie restoration through fire and grazing. Biol. Conserv. 140, 78–90. doi: 10.1016/j.biocon.2007.07.027
Warren, D. L., and Seifert, S. N. (2011). Ecological niche modeling in Maxent: the importance of model complexity and the performance of model selection criteria. Ecol. Appl. 21, 335–342. doi: 10.1890/10-1171.1
Wieczorek, J., Bloom, D., Guralnick, R., Blum, S., Döring, M., Giovanni, R., et al. (2012). Darwin core: an evolving community-developed biodiversity data standard. PLoS ONE 7:e29715. doi: 10.1371/journal.pone.0029715
Keywords: seed-mixtures, functional group, climate change, species distribution (niche) model, bioclimatic envelope
Citation: Lyon NJ, Debinski DM and Rangwala I (2019) Evaluating the Utility of Species Distribution Models in Informing Climate Change-Resilient Grassland Restoration Strategy. Front. Ecol. Evol. 7:33. doi: 10.3389/fevo.2019.00033
Received: 26 November 2018; Accepted: 28 January 2019;
Published: 15 February 2019.
Edited by:
Anouschka R. Hof, Wageningen University & Research, NetherlandsReviewed by:
Bernd Panassiti, Laimburg Research Centre, ItalyJaime A. Collazo, North Carolina State University, United States
Copyright © 2019 Lyon, Debinski and Rangwala. This is an open-access article distributed under the terms of the Creative Commons Attribution License (CC BY). The use, distribution or reproduction in other forums is permitted, provided the original author(s) and the copyright owner(s) are credited and that the original publication in this journal is cited, in accordance with accepted academic practice. No use, distribution or reproduction is permitted which does not comply with these terms.
*Correspondence: Nicholas J. Lyon, njlyon@iastate.edu