The Multidimensional Stoichiometric Niche
 Angélica L. González1*
  Olivier Dézerald1
  Pablo A. Marquet2,3,4
  Gustavo Q. Romero5 Diane S. Srivastava6
- 1Biology Department, Center for Computational and Integrative Biology, Rutgers University, Camden, NJ, United States
- 2Departamento de Ecología, Pontificia Universidad Católica de Chile, Santiago, Chile
- 3Institute of Ecology and Biodiversity, Santiago, Chile
- 4The Santa Fe Institute, Santa Fe, NM, United States
- 5Departamento de Biologia Animal, Instituto de Biologia, Universidade Estadual de Campinas, Campinas, Brazil
- 6Department of Zoology, Biodiversity Research Centre, University of British Columbia, Vancouver, BC, Canada
The niche concept is essential to understanding how biotic and abiotic factors regulate the abundance and distribution of living entities, and how these organisms utilize, affect and compete for resources in the environment. However, it has been challenging to determine the number and types of important niche dimensions. By contrast, there is strong mechanistic theory and empirical evidence showing that the elemental composition of living organisms shapes ecological systems, from organismal physiology to food web structure. We propose an approach based on a multidimensional elemental view of the ecological niche. Visualizing the stoichiometric composition of individuals in multivariate space permits quantification of niche dimensions within and across species. This approach expands on previous elemental characterizations of plant niches, and adapts metrics of niche volume, overlap and nestedness previously used to quantify isotopic niches. We demonstrate the applicability of the multidimensional stoichiometric niche using data on carbon, nitrogen, and phosphorus of terrestrial and freshwater communities composed by multiple trophic groups. First, we calculated the stoichiometric niche volumes occupied by terrestrial and freshwater food webs, by trophic groups, by individual species, and by individuals within species, which together give a measure of the extent of stoichiometric diversity within and across levels of organization. Then we evaluated complementarity between these stoichiometric niches, through metrics of overlap and nestedness. Our case study showed that vertebrates, invertebrates, and primary producers do not overlap in their stoichiometric niches, and that large areas of stoichiometric space are unoccupied by organisms. Within invertebrates, niche differences emerged between freshwater and terrestrial food webs, and between herbivores and non-herbivores (detritivores and predators). These niche differences were accompanied by changes in the covariance structure of the three elements, suggesting fundamental shifts in organismal physiology and/or structure. We also demonstrate the sensitivity of results to sample size, and suggest that representative sampling is better than rarefaction in characterizing the stoichiometric niche occupied by food webs. Overall, our approach demonstrates that stoichiometric traits provide a common currency to estimate the dimensionality of stoichiometric niches, and help reduce and rationalize the number of axis required to characterize communities.
Introduction
The niche concept is fundamental to ecology. The idea of the ecological niche has been central to most theory explaining how biotic and abiotic factors affect the abundance and distribution of species, and how species utilize, modify and compete for resources in the environment. However, the ecological niche has been defined multiple times through the history of ecology (Leibold, 1995; Chase and Leibold, 2003). Grinnell (1917) defined a species' niche in terms of the match between the species' traits and its habitat, whereas Elton (1927) considered the niche to be a qualitative description of the resource requirements for species persistence, as well as the impacts of species on their environment. By contrast, the Hutchinsonian niche (Hutchinson, 1957) represents a more quantitative description of all biotic resources and abiotic conditions (i.e., multiple n-dimensions) that affect the fitness of a species. More recently, trait-based approaches have merged the Hutchinson n-dimensional niche perspective with the Eltonian niche to quantify a species' niche based on multiple functional traits. The main premise of trait-based ecology is that the niche can be characterized by the phenotypic space occupied by a group of organisms. Quantification of this functional trait space has provided insights into understanding the ecological and evolutionary processes that structure functional diversity, and the relationship between functional diversity and ecosystem processes (Carmona et al., 2016).
An alternative to trait based or Hutchinsonian niches are niches based on the chemical composition of organisms. As energy and material acquisition, storage and exchange are essential to life, and because the chemical composition of an organism has been shown to shape its ecology, it has been argued that biochemistry represents a key aspect of a species' niche (Sterner and Elser, 2002; Elser et al., 2003; Newsome et al., 2007; Carnicer et al., 2015). The chemical composition of an organism (isotopic, elemental, and molecular) is determined by the resources it consumed and the environmental conditions it experienced, as constrained by its nutritional and metabolic requirements. Importantly, these nutritional and metabolic requirements can often be expressed in only a few well-established dimensions, potentially resolving some of the ambiguity in selecting traits. In particular, isotopic ecology (Layman et al., 2007; Newsome et al., 2007; Jackson et al., 2011; Cucherousset and Villéger, 2015; Swanson et al., 2015), the geometric framework of nutrition (Simpson and Raubenheimer, 1993; Raubenheimer and Simpson, 2004; Raubenheimer et al., 2009, 2015; Kearney et al., 2010; Raubenheimer, 2011), and ecological stoichiometry (Elser et al., 2000; Peñuelas et al., 2008, 2010) have all represented the ecological niche using the chemistry of living organisms.
A number of metrics originally developed by functional ecologists to quantify trait functional diversity have been repurposed and applied in stable isotope ecology research (Rigolet et al., 2015; Comte et al., 2016). Like traditional traits, isotopic traits can be fit with a convex hull, the size of which has been extensively used as a proxy of the size of the trophic niche occupied by a group of individuals (Layman et al., 2007, 2012; Cucherousset and Villéger, 2015). Similarly, the geometric framework of nutrition (NGF) has been used to build multidimensional models of animal macronutrient budgets (i.e., multidimensional nutritional niche) in which information on food macronutrient contents (i.e., proteins, carbohydrates, lipids), animal macronutrient requirements, and animal nutritional processes such as macronutrient intake, growth and macronutrient use, are integrated, modeled and visualized as three macronutrient axes (Raubenheimer et al., 2015; Machovsky-Capuska et al., 2016. Although this approach has been extremely useful to improve our understanding of the foraging behavior, post-ingestion allocation of macronutrients, and the dietary niche breath of a large diversity of animals, it is a data hungry approach and some of the required nutritional descriptors are restricted to specific taxonomic groups—such as animals but not plants. Further, it does not allow for a formal empirical or theoretical application of the laws of conservation of matter to link the chemical niche of individual organisms to ecosystem-level processes (Sperfeld et al., 2016, 2017). This imposes some limitations on the use of NGF to integrate and describe entire ecological communities, and to identify links between chemical phenotypes and ecosystem processes (Sperfeld et al., 2016). Here we propose a new way to chemically describe the niche—the multidimensional stoichiometric niche, based on ecological stoichiometry theory—which may be even more useful.
The Multidimensional Stoichiometric Niche
All living organisms share biochemistry based on carbon (C), nitrogen (N), phosphorus (P), and other chemical elements (Elser et al., 2000; Sterner and Elser, 2002). However, organisms differ widely in the proportion of these elements in their biomass, both across taxonomic groups and trophic groups (Elser et al., 2000; Sterner and Elser, 2002). Ecological stoichiometry (henceforth ES: Sterner and Elser, 2002) studies the balance of energy and multiple chemical elements in ecological interactions, and assumes that the elemental composition of living organisms reflects their demands for chemical elements and the degree of elemental homeostasis. The demands of chemical elements largely depend on the individual investment in structural resources such as C-rich cellulose and lignin by plants, C-and N-rich chitin and muscle by arthropods, and P-rich bones by vertebrates, but are also influenced by physiological processes such as growth and reproduction (Sterner and Elser, 2002; Elser et al., 2003; Leal et al., 2017). Similarly, the different degrees of elemental homeostasis among living organisms (e.g., plants and animals) can determine important variation in organismal stoichiometry (Sterner and Elser, 2002; Persson et al., 2010). Therefore, stoichiometric traits are defined here as the composition, assimilation, allocation, or excretion of elements at the individual level, quantities that are usually assessed by the elemental content or elemental ratios of living organisms (Leal et al., 2017). Overall, stoichiometric trait variation, just like variation in any other trait, can be scaled-up from individuals to entire communities (Violle et al., 2007).
As with other quantitative traits, elemental composition and variation can be represented in a multivariate space (Sterner and Elser, 2002). Thus, each axis can represent the quantity (e.g., proportion) of a chemical element in the body of an organism, which allows a hypervolumetric visualization and analysis of the niche and trait distribution at multiple scales (groups of individuals, entire communities or regional pools of species; see Villéger et al., 2008; Cucherousset and Villéger, 2015; Carmona et al., 2016). This elemental view of a living organism has been called the elemental phenotype, which could include the ~25 elements composing the biomass of living organisms (Jeyasingh et al., 2014; Leal et al., 2017). Each of these chemical elements play key roles in the chemistry of life ranging from biomolecules and organelle structure to its life history (Sterner and Elser, 2002), and consequently the elemental phenotype is thought to be shaped by the variation in classic traits (e.g., growth rates, body size) related to the structural and functional demands of individuals (Sterner and Elser, 2002; Hessen et al., 2013; Jeyasingh et al., 2014). Although the elemental phenotype approach goes beyond the mere quantification of the elemental composition of an organism, it relates to the niche by considering an integrated and multidimensional view of the elemental make-up of life. This multiscale approach—from individuals within a species to entire communities—allows ecologists to determine how much different levels of biological organization contribute to overall trophic and resource diversity.
The ES focus on chemical elements has significant advantages over the nutritional niche framework for analyses of ecological niches. The ES perspective provides a common currency that facilitates comparisons across diverse taxonomic groups, ecological levels of organization (individuals, populations, communities or regional pools of species), and habitats (e.g., terrestrial, freshwater), and links the elemental phenotype to community and ecosystem-level processes. The elemental phenotype view is not new; in fact plant ecologists previously described it as the “biogeochemical niche” (Peñuelas et al., 2008, 2010). The biogeochemical niche represents a species position in multivariate space as defined by elemental content (sensu Peñuelas et al., 2008). Much of the progress done by plant ecologists on this topic has been made possible because elemental traits in plants show strong responses to environmental gradients, with consequences for plant fitness. As with isotopic niches, biogeochemical niches have been quantified for individual species, based on the mean value of plant elemental traits (Peñuelas et al., 2008, 2010; Violle and Jiang, 2009), and scaled-up to describe entire plant communities (Kerkhoff and Enquist, 2006). Although the elemental composition of living organisms (plants, animals and microorganisms) is known to shape their ecology and influence the structure and functioning of ecological systems (Hall, 2009; Hawlena et al., 2012), similar analyses of the elemental niche of entire communities, including their size and overlap, remain largely unexplored. Therefore, further progress can be made by the development of an approach that allows the description and comparison of the biogeochemical niche across all taxa (e.g., bacteria, fungi, plants, and animals) and habitats (e.g., aquatic and terrestrial), as well as across observational gradients or experimental manipulation conditions.
Borrowing some ideas from the “biogeochemical niche” as defined by Peñuelas et al. (2008) and Sardans and Peñuelas (2013), and adapting metrics developed for the analysis of stable isotope data and functional trait diversity (Layman et al., 2007; Cucherousset and Villéger, 2015), we develop here the multidimensional stoichiometric niche approach for ecological stoichiometric research. Our approach expands from Peñuelas et al. (2008) who described and analyzed the “biogeochemical niche” for plants entirely based on the position of species in multivariate space using principal component analysis (PCA). We define the stoichiometric niche as the region of multivariate niche space occupied by a group of individuals where the axes represent their elemental content, but the stoichiometric niche could also be extended to incorporate nutrient recycling rates (Table 1). Incorporating element fluxes and transformation rates as additional or alternative axes describing the multidimensional stoichiometric niche, can provide a more complete picture of the relative importance of species redundancy in elemental cycling at the ecosystem level (Table 1).
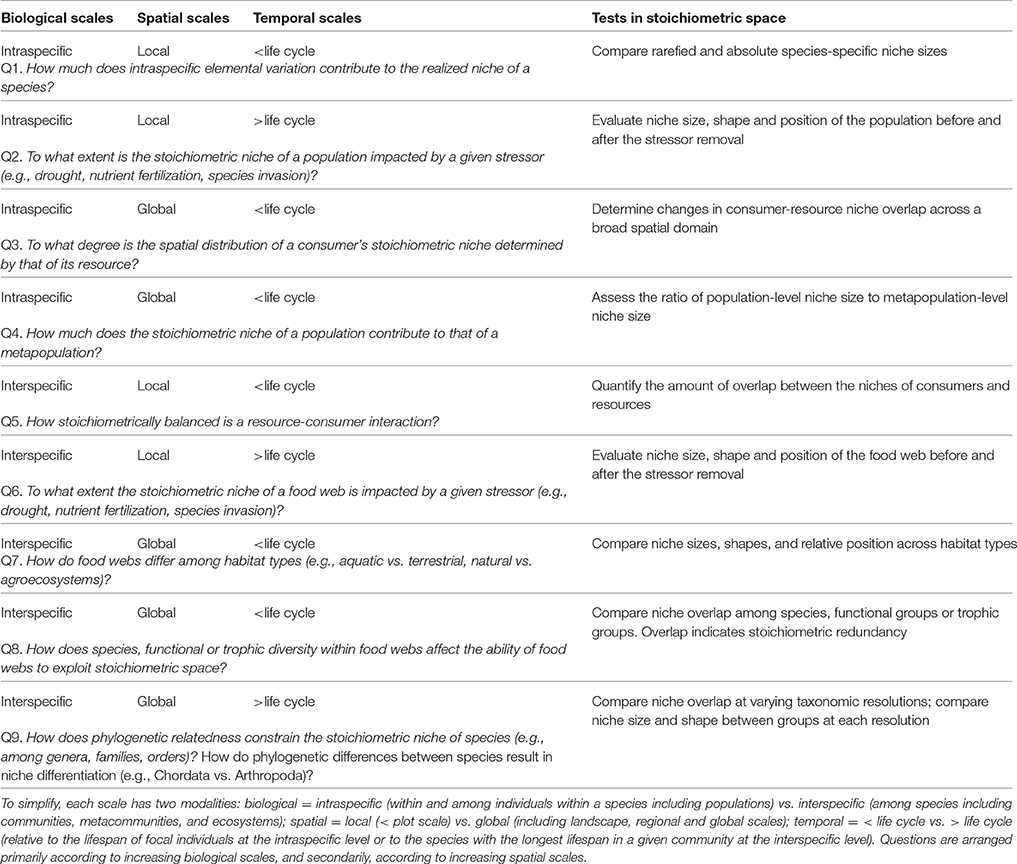
Table 1. Examples of questions that could be addressed using the multidimensional stoichiometric niche approach, including the biological, spatial and temporal scales involved, and the associated tests to be conducted.
We propose that the multidimensional stoichiometric niche offers a powerful and unified framework to perform analyses of elemental composition data across taxa and habitats in ecological stoichiometry. Importantly, this concept allows researchers to examine how different levels of biological organization affect the stoichiometric trait space occupied by entire food webs, how organisms differ in their stoichiometric niches based on ecological role (functional group, trophic level), and how entire food webs are affected by habitat and exposure to stressors (see section Discussion and Perspectives, Table 1). Here we convert some metrics developed earlier for stable isotope and functional trait data (mainly based on traditional traits such as growth, survival, photosynthetic rate; Violle et al., 2007) into a set of stoichiometric metrics based on the elemental content of individuals or groups of individuals within communities, which together describe the multidimensional stoichiometric niche. These metrics are as follows:
(i) Stoichiometric niche volume: Also known as convex hull volume, this metric measures the amount of elemental space filled by a group of organisms. This space represents the stoichiometric diversity of a group of organisms within a population, functional group or whole community. For example, a small stoichiometric niche volume would indicate that individuals of a particular group (e.g., species, trophic group) exhibit low intra-group variation regarding their elemental traits.
(ii) Stoichiometric niche overlap and nestedness: Both of these indices allow comparison of the position and size of the stoichiometric niches between groups of organisms. Basically, they provide information about how similar (i.e., redundant) organisms or groups of organisms are in terms of their stoichiometry. While stoichiometric niche overlap can reveal the degree to which certain elemental composition may be displayed by only few individuals or group of individuals in a community, stoichiometric nestedness allows differentiating between two potential stoichiometric niche overlap patterns. These two patterns are: (1) the overlap that occurs when groups or organisms share a similar portion of the stoichiometric niche volume; and (2) the overlap that occurs when one group of organisms occupies a subset of the stoichiometric volume occupied by the other group (see Carmona et al., 2016). For instance, a low overlap and/or nestedness between two groups of organisms indicate that they differ in their elemental traits (i.e., high elemental complementarity).
(iii) Stoichiometric niche shape: This refers to the contribution of variation in each of C, N and P to the stoichiometric niche of a group of organisms, and can be assessed by ordination techniques like PCA. When there is strong covariance between two elements, and the collinearity of these elements is important in defining niche shape (e.g., both elements load together on one PCA axis), the dimensionality of the niche may be reduced from three to two. For example, ES theory suggests that organisms have constrains in their elemental ratios, which would induce such collinearity. Thus, stoichiometric niche shape may be underlain by fundamental biological constraints. This metric reflects the “biogeochemical niche”approach developed by Peñuelas et al. (2008).
To illustrate the applicability of the multidimensional stoichiometric niche approach, we used data on C, N, and P content of several terrestrial and freshwater communities composed by multiple trophic groups (from primary producers and detritivores to carnivores) and species. We use these data to answer Questions 1, 7, 8, and 9 in Table 1. First, we calculated the niche volumes in stoichiometric trait space occupied by the aquatic and terrestrial food webs, trophic groups, and individual morphospecies (hereafter “species”). Then we evaluated several aspects of the stoichiometric niche space (i.e., niche size, niche overlap and nestedness), which provide information of the stoichiometric complementarity within and among these groups. Finally, we identify key limitations of this approach, and discuss perspectives that may facilitate the development of quantitative intra and interspecific comparisons, and food-web approaches using stoichiometric data.
Multidimensional Stoichiometric Niche in Practice: Demonstration Analysis Using Terrestrial and Aquatic Food Webs
As an example of the multidimensional stoichiometric niche, we analyzed entire terrestrial and aquatic food webs. The whole data set includes 73 species (35 families and 18 orders) belonging to multiple trophic positions along three axes: C, N, and P content. The terrestrial and aquatic food webs include, respectively, 33 and 40 species, 20 and15 families, and 13 and 7 orders.
Terrestrial invertebrates and vertebrates associated with Tillandsia bromeliads were collected from four sites in the coastal zone of the Atacama Desert (Chile; 20°13′S, 70°8′W) in 2007 and 2009 (González et al., 2011a). Low mean annual rainfall characterizes this area, as the only source of moisture is associated with fog events (Cereceda et al., 2008). The increased air moisture and nutrient deposition in the fog zone permits the development of isolated vegetation “islands.” These “islands” are dominated by several terrestrial bromeliad species of the genus Tillandsia, which depend exclusively on fog inputs as their primary water source (Pinto et al., 2006), and sustain a diverse community of terrestrial invertebrates (e.g., Coleoptera, Araneae, Solifugae) and vertebrates (e.g., Squamata). At each of the four sites, we collected arthropods and lizards, which compose the terrestrial food webs associated with Tillandsia (see González et al., 2011a for sampling details).
Aquatic invertebrates were sampled from tank bromeliads from one site in each of two countries: Estacion Biologica Pitilla (Costa Rica; 10°59′N, 85°26′W), and Cardoso Island (Brazil; 25°03′S, 47°53′W) in 2012 and 2013. Costa Rica is dominated by primary and secondary tropical rain forests with sparse open clearings whereas Cardoso Island corresponds to a “resting” ecoregion (i.e., coastal vegetation located on nutrient-poor sand deposits; Magnago et al., 2012). Tank bromeliads are flowering plants that accumulate rainwater in their leaf rosettes creating an aquatic habitat—from a few milliliters up to several liters of water per plant—for a diverse community of macroinvertebrates (e.g., Diptera, Coleoptera, Haplotaxida, Ostracoda; Dézerald et al., 2013). Macroinvertebrates were sampled from tank bromeliads in each study site either by dissection of the plant or with a large-mouthed pipette.
Sample Preparation and Chemical Analyses
The guts of the aquatic and terrestrial invertebrates were not removed prior to chemical analyses due to their small size; therefore we kept them alive overnight to allow gut clearance (Evans-White et al., 2005). In contrast, we removed the digestive tract of the lizards prior to analyses. Before chemical analyses, the individuals were counted and identified to the species or morphospecies level (hereafter, “species”). We also classified all organisms by trophic groups (e.g., invertebrate detritivores, vertebrate predators) using information from the literature and field observations (Merritt et al., 2008; Dézerald et al., 2013). Most aquatic organisms were collected as larvae as this is the most common stage of invertebrates living inside tank bromeliads (except for holobiotic organisms: Ostracoda, Arhynchodbellida, and Haplotaxida) whereas terrestrial larvae/juveniles and adults were included in the analyses.
We determined dry mass of individuals using an electronic balance (±0.1 μg). We measured the phosphorus content on whole invertebrates (aquatic and terrestrial), and whole lizards, using the persulfate digestion and ascorbic acid methods (APA, 1992). Prior to digestion, we gently crushed samples with a Teflon-coated rod. Tissue C and N contents were measured with an elemental analyzer that involves complete combustion of samples (Model Carlo Erba NC2500). For smaller macroinvertebrates (<0.5 mg dry mass), we performed CN analyses on whole individuals. For larger individuals (invertebrates and lizards), we analyzed CN levels in homogenized subsamples from dried individuals that were first crushed with a mortar and pestle. CN analyses were conducted at the Stable Isotope Laboratory at Cornell University, Ithaca, NY. We determined the percent recovery in P assays in aquatic and terrestrial organisms by comparison to apple leaf and bovine muscle standards, respectively, from the National Institute of Standards and Technology, US (NIST-1515/8414). We performed all P analyses using a flow solution auto-analyzer. We use the term “C (or N or P) content” to describe C (or N or P) content as a percent of dry body mass. The C, N, and P contents of primary producers were estimated following the same protocols as described above for invertebrates and lizards.
Elemental-Body Size Scaling Relationships
Because all three elements (C, N, and/or P) could not be consistently obtained for small-sized individuals and/or species, we interpolated missing values using our own body size scaling relationships. About 31% of C-values (513/1,673), 29% of N-values (483/1,673), and 35% of P-values (589/1,673) were estimated, whereas the rest of the C, N, P values (~75%) were directly measured. To estimate these elemental values, we performed ordinary least square regressions on each element (i.e., C, N, or P) and the log-transformed body size (mg dry mass) of individuals from any given species (Legendre, 2014; Finkel et al., 2016). Only significant relationships were used to interpolate missing values (Supplementary Tables S1–S3). When scaling relationships were not significant and/or the species had less than five individuals, we used significant coefficient estimates from higher taxonomic levels (e.g., genus, family).
Individual-Based Analysis of Stoichiometric Niches
To evaluate the stoichiometric niche of species, trophic groups, and food-web types (aquatic vs. terrestrial), we calculated the respective convex hull volumes or stoichiometric niche volumes using individual-based coordinates in the multidimensional stoichiometric trait space. Specifically, we used a three-dimensional space constituted by three traits or axes, namely, C, N, and P contents. The relative size of niche volumes in functional space has broad ecological implications (Cornwell et al., 2006; Villéger et al., 2011). For instance, small niche volumes indicate that individuals are constrained to a limited range of the functional space and only represent a subset of all traits in the community or food-web type. In the context of stoichiometric niches, this would mean that those individuals exhibit low variation regarding their elemental content. In a three-dimensional stoichiometric space, as in our study, the convex hull volume of a stoichiometric niche may be represented as a polygon where individuals with extreme coordinates define its edges, vertices, faces and overall shape. However it is difficult to visually detect differences in polygon volumes when they also differ in shape (e.g., elongated vs. rectangular polygons). Instead, we chose to depict the convex hull volumes as spheres with volumes equal to those of the polygons, which are centered on the average coordinates of all individuals within a given group (e.g., trophic group, food web type).
We evaluated the redundancy of stoichiometric niches, between species, trophic groups, and food-web types, by measuring the percent overlap among niches (Villéger et al., 2011; Brandl and Bellwood, 2014). Specifically, niche overlap between two groups was calculated as the ratio of the niche volume in common to the combined unique niche volume (i.e., sum of the two niche volumes minus the volume of the intersection). Thus, individuals will have complementary niches (i.e., low redundancy), if they display a low percent overlap. A low percent overlap can, however, result from two large niche volumes overlapping marginally (pattern 1) or from a small volume being nested within a larger niche volume (pattern 2). Although in both cases the niche overlap may be low, the ecological implications of these two patterns are not. In pattern 1, most individuals of the two groups display dissimilar trait values, and only few individuals of each group share their traits values, suggesting that the groups do not need to compete for the same resources. In contrast, in pattern 2, most individuals of the group with the smaller niche size (group A) fill only a subset of the volume occupied by the group with the larger niche size (group B). This implies that individuals of group A display only a fraction of the trait values exhibited by the individuals of group B, suggesting that A displays less intraspecific trait variance. To discriminate between patterns 1 and 2, the nestedness of two niche volumes can be calculated as the ratio between the overlapped niche volume and the minimal niche volume occupied by a group (Villéger et al., 2013). The nestedness component varies between 0 and 1, where 0 means that niche volumes do not overlap, and tends to 1 when a given niche volume is nested and occupies a small portion of a larger niche volume displayed by a second group.
Finally, the last step in describing stoichiometric niche volumes is to assess which traits (C, N, P axes of the multidimensional stoichiometric space) or combination of traits drive variation in the overall shape of those niche volumes. We thus performed Principal Component Analyses (PCA) on the individuals of each species, functional feeding groups, and food webs. PCA allows multivariate data compression into its main orthogonal features by displaying the data into a lower dimensional space (Janžekovi and Novak, 2012). In other words, PCA axes are defined by the stoichiometric traits that best explain the niche shape in the multidimensional space. We thus expected spherical niche shapes to display an equal contribution of each axis to the overall variance in stoichiometric composition of a group. In contrast, other niche shapes could be driven by one or a combination of stoichiometric traits, which suggests that these organisms may have an increased allocation of a particular element or a combination of elements to structural or physiological processes (trait trade offs).
Intraspecific Analyses of Stoichiometric Niches
To further exemplify our approach, we repeated all analyses described above at the intraspecific level. To this end, we selected the most abundant morphospecies in our dataset (Arachnida, Solifugae, Ammotrechidae sp.; N = 141 individuals). This species is a terrestrial predator of ground-dwelling arthropods in arid environments, and so its elemental composition may reflect that of the food web below it. This species is also widespread, having been captured in all four sampled sites in the coastal Atacama Desert (northern Chile; see González et al., 2011a,b for site details). Ammotrechidae sp. thus presents ideal characteristics to evaluate variations in stoichiometric niches at the intraspecific level: high abundance and four geographically distinct populations. First, we determined whether the stoichiometric niche size of Ammotrechidae sp. significantly differs from random. Random niche volumes were generated by subsampling the elemental content (C, N, and P) of 141 individuals from the total pool of invertebrates, and by calculating the resulting niche volumes using 999 randomized permutations. Therefore, null models reflected the natural abundance of Ammotrechidae sp. (see next section). The observed niche volume was then compared to the cumulative distribution of the 999 random niche volumes and considered not significantly different from random if it fell between the 2.5 and 97.5th percentiles of that distribution. Second, we calculated all stoichiometric niche metrics (i.e., size, nestedness, and shape) for each of the four populations of Ammotrechidae sp., as previously described, in order to examine intraspecific variation in stoichiometric niches.
Effect of Sample Sizes on Niche Volumes
The total niche volume of a given species or functional group or food web is influenced by the number of individuals with the most extreme positions in the multidimensional stoichiometric space. Theoretically, an increase in the number of randomly sampled individuals is associated with a higher probability of finding individuals with extreme positions, and thus of estimating the “true” population-level niche volumes of that species (Brandl and Bellwood, 2014). This may occur until a threshold number of individuals or is reached, after which randomly sampling individuals does not further influence the niche volume. Whether this threshold is common or unique to species remains unresolved, and is central to debates on the importance of intraspecific trait variation (Q1 in Table 1). Yet, the importance of sample size must be addressed as species in nature differ according to their relative abundances. A common method to account for different sample sizes among species is to sample a given subset of individuals (e.g., 30 individuals) and to calculate the resulting niche volume using 999 randomized permutations within each species (Brandl and Bellwood, 2014). This rarefaction method may, however, underestimate the hypothetically “true” niche volume (e.g., all individuals within a population) of more abundant species compared to species with fewer individuals. To tackle this issue, we first evaluated, with linear regression, whether the number of individuals in each species was positively correlated to the log-transformed niche volumes of species. It is important to note that we sampled species proportionally to their natural abundances, so the niche volumes uncorrected for sample size are our best estimate of population-level niche volume. Second, we subsampled an increasing number of individuals at regular intervals (e.g., every 20, 40, and 100 individuals from each species, trophic group, and food webs, respectively), and calculated the resulting niche volumes using 999 randomized permutations. We repeated this procedure until nearly all individuals from a species (or trophic group or food web) were sampled. We then quantified the range of variation in randomized niche volumes using 95% confidence interval (i.e., within ~ 2 Standard Deviations from the mean of randomized permutations), and compared this range with the population-level niche volume based on all sampled individuals. Statistical analyses were performed using the packages vegan, geometry, car, coin and the function CHVintersect (Villéger et al., 2013) in the R-software V3.2.1 (R Development Core Team, 2015). Data from our case of study and all code (statistics and graphics) used to quantify the multidimensional stoichiometric niche is provided in the Supplementary Information to allow reproduction of our approach.
Results of a Case Study: Multidimensional Stoichiometric Niche in Practice
Stoichiometric Niches of Primary Producers, Macroinvertebrates, and Vertebrates
We first examined phylogenetic effects on the stoichiometric niche (Q9 in Table 1). Primary producers, macroinvertebrates, and vertebrates occupied <1.0, 22.5, and 3.3% of the total niche volume, respectively, with ~74.0% of the total elemental space being unoccupied by any group. The total stoichiometric niche volume was here calculated as the total convex hull volume encompassing all individuals regardless of taxonomic identity, trophic group and food web type (aquatic vs. terrestrial). This large amount of unoccupied space was due to the individuals being highly aggregated within each trophic group with no stoichiometric overlap among primary producers, macroinvertebrates, and vertebrates (Figure 1). Although we approximated niche volumes as spheres in Figure 1, there are a number of points that fall outside these spheres, especially for primary producers, so we used separate PCA analyses of each group to explore which elements determined the actual shape of niches. PCA analyses indicate that the stoichiometric niche volume of primary producers was driven by C and N content, which varied in opposite directions along Axis 1 (47.7% of explained variance), and by P content, which correlated with Axis 2 (Figure 2; Axis 2 = 30.9% of explained variance). For invertebrates, the niche volume was mainly driven by variation in N and P content (both negatively correlated to Axis 1), and by C content along the Axis 2 (Axis 1 and 2 = 44.9% and 31.8% of explained variance; Figure 2). In contrast, for vertebrates, both C and N content were negatively correlated to Axis 1 (61.8% of explained variance), while P content was positively correlated to Axis 2 (28.2% of explained variance; Figure 2).
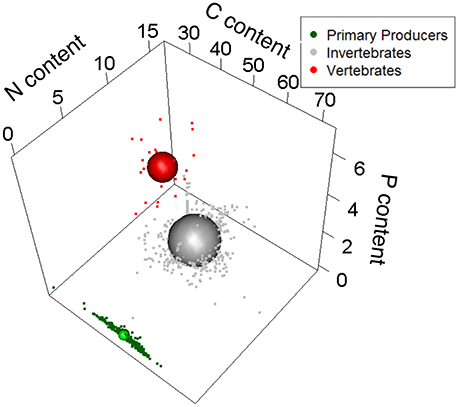
Figure 1. Relative size of stoichiometric niche volumes of primary producers, invertebrates, and vertebrates (combining multiple terrestrial and aquatic food webs from bromeliads). Sphere sizes depicts the volumes of the stoichiometric niches, and are centered around the average C, N, and P contents of all individuals from those variables. Dots are individual coordinates and show the variability within a given stoichiometric niche. Axes represent each element as a percentage of dry body mass.
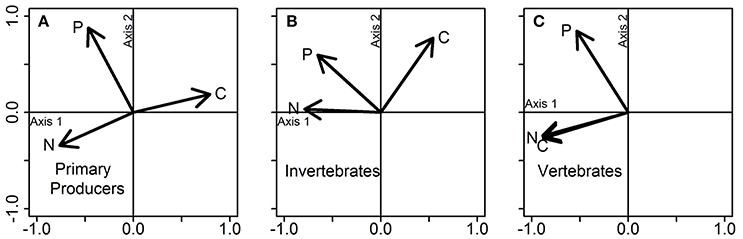
Figure 2. PCA on the stoichiometric traits of (A) primary producers, (B) invertebrates, and (C) vertebrates. Each plot represents a PCA conducted separately for each group of organisms, using the data displayed jointly in Figure 1. Vectors show the influence of the three stoichiometric traits (C, N, and P contents) on each PCA axis.
Stoichiometric Niches of Terrestrial vs. Aquatic Food Webs
To compare niche volumes among terrestrial and aquatic food webs (Q7 in Table 1), subsequent analyses were focused on invertebrate individuals. In this study, terrestrial organisms spend their entire life cycle on land. Aquatic organisms are represented by species that either spend their entire life cycle within the water or have complex life cycles (i.e., involving an aquatic larval stage and a terrestrial adult). For the later, we only have stoichiometric data for the aquatic stages. Hereafter, the total stoichiometric niche space refers to the total niche space occupied by all invertebrates regardless of taxonomic identity, trophic group and food-web type (aquatic or terrestrial). We found that terrestrial and aquatic invertebrate food webs shared ca. 38.0% of the volume occupied by their respective niches, where terrestrial individuals occupied a slightly larger volume (57.1%) of the total stoichiometric niche space than aquatic ones (50.0%; Figure 3). The low nestedness value (= 0.038, with 1 representing full nestedness and 0 no nestedness) between terrestrial and aquatic invertebrate food webs further confirms their relatively high complementarity in stoichiometric traits. In addition, the niche volume of terrestrial invertebrates was driven by covariation in N and P contents (both negatively correlated to Axis 1; 49.1% and Axis 2; 32.0% of total variance explained), while C and N content explained most of the variation in the stoichiometric composition of aquatic invertebrates (positively and negatively correlated to Axis 1; 53.2% and Axis 2; 32.7% of total explained variance; Figure 4).
Figure 3. Relative size of stoichiometric niche volumes of terrestrial and aquatic food webs (only invertebrates included). Sphere sizes depicts the volumes of the stoichiometric niches, and are centered around the average C, N, and P contents of all individuals from those variables. Dots are individual coordinates and show the variability within a given stoichiometric niche. Axes represent each element as a percentage of dry body mass.
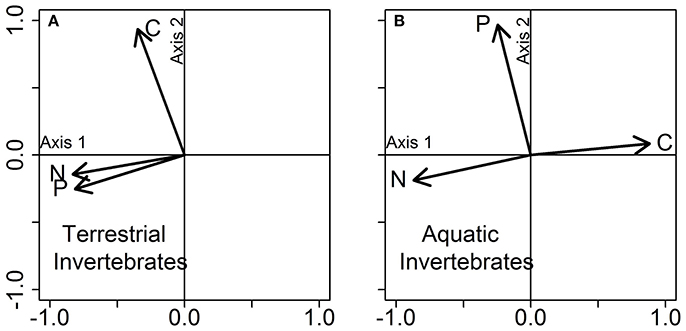
Figure 4. PCA on the stoichiometric traits of (A) terrestrial and (B) aquatic food webs (only invertebrates included). Each plot represents a PCA conducted separately for each group of organisms, using the data displayed jointly in Figure 3. Vectors show the influence of the three stoichiometric traits (C, N, and P contents) on each PCA axis.
Stoichiometric Niches of Invertebrate Trophic Groups
Our third example question concerns the contribution of trophic diversity to food web stoichiometric niches (Q8 in Table 1). Averaging over food-web type, the stoichiometric niche of herbivores (30.7% of total stoichiometric niche space) was smaller than the niche of detritivores (47.0%), while invertebrate predators displayed the highest niche volume (54.1%) (Figure 5). The highest percent overlap in stoichiometric niches was found between detritivores and predators (61.5%), while detritivores and herbivores shared 32.0% and herbivores and predators shared 29.1% of their niche space. Nestedness was low between the three trophic groups, with nestedness values between 0.07 and 0.16. Herbivores differed from detritivores and predators in their niche shape. The niche shape of herbivores was defined by correlations of C and N content with Axis 1 (51.5% of explained variance), while P content was positively correlated to the Axis 2 (28.7% of explained variance) (Figure 6). By contrast, the niche shape of detritivores and predators were driven primarily by the positive and negative correlations of C and N content, respectively, with Axis 1 (49.8 and 51.6% of explained variance for detritivores and predators respectively), and secondarily by P content (Axis 2; 33.3% and 26.0% of explained variance for detritivores and predators respectively).
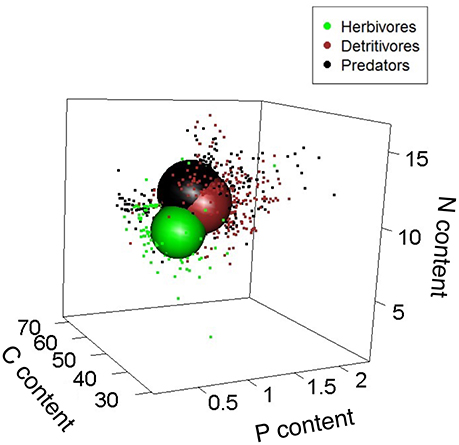
Figure 5. Relative size of stoichiometric niche volumes of trophic groups (only invertebrates included). Sphere sizes depicts the volumes of the various grouping variables, and are centered around the average C, N, and P contents of all individuals from those variables. Dots are individual coordinates and show the variability within a given grouping variable. Axes represent each element as a percentage of dry body mass.
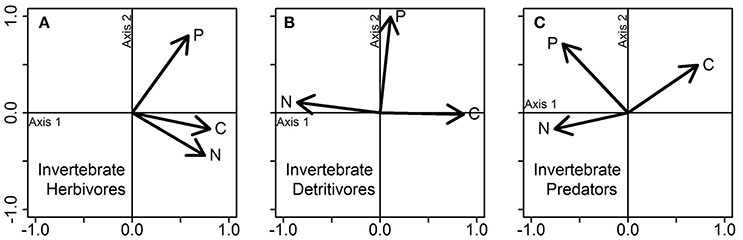
Figure 6. PCA on the stoichiometric traits of (A) invertebrate herbivores, (B) invertebrate detritivores, and (C) invertebrate predators. Each plot represents a PCA conducted separately for each group of organisms, using the data displayed jointly in Figure 5. Vectors show the influence of the three stoichiometric traits (C, N, and P contents) on each PCA axis.
Similar patterns were seen when we examined trophic groups within each food-web type (Figure 7). Overall, each trophic group in the various food-web types shared ca. one third of its stoichiometric niche with any other trophic group (mean pairwise percent overlap ± SE = 35.0 ± 2.6) and displayed relatively low nestedness values (mean pairwise nestedness values ± SE = 0.08 ± 0.02). Within the terrestrial food web, herbivores (30.7%) and detritivores (18.3%) displayed the largest and smallest niche, respectively. Terrestrial detritivores and predators had the most niche overlap (51.1%) and the highest value of nestedness (0.28), indicating that most individuals of the former group fill only a subset of the space occupied by the latter (Figure 7). Within the aquatic food web, predators had larger niches (28.6%) than detritivores (26.1%); predators and detritivores shared 28.1% of their niche and more were weakly nested (nestedness value = 0.02) compared to their terrestrial counterparts.
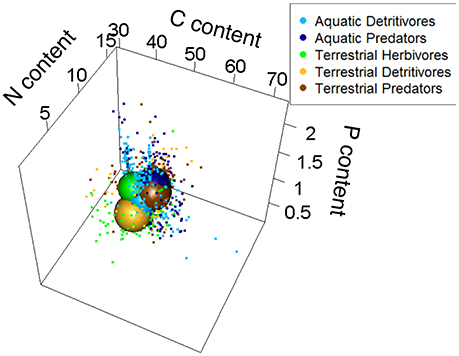
Figure 7. Relative size of stoichiometric niche volumes of aquatic and terrestrial trophic groups (only invertebrates included). Sphere sizes depicts the volumes of the various grouping variables, and are centered around the average C, N, and P contents of all individuals from those variables. Dots are individual coordinates and show the variability within a given grouping variable. Axes represent each element as a percentage of dry body mass.
Our analyses further indicate that the trophic groups could be divided into three groups according to the stoichiometric traits that best explained their differences in niche volumes. The first group is constituted by aquatic detritivores and aquatic predators, whose niche shapes were primarily driven by covarying C and N content, which both correlated negatively with Axis 1 (58.2% and 62.4.1 of the variance for detritivores and predators respectively), and secondarily by P content (32.7 and 24.4% of the variance, positively correlated to Axis 2; Figures 8A,B). The terrestrial detritivores and terrestrial predators composed the second group (Figures 8C,D). The niche shapes of both functional feeding groups were driven primarily by the positive correlations of N and P content with Axis 1 (43.1 and 40.1% of explained variance respectively for detritivores and predators), and secondarily by C content (Axis 2; 32.1 and 31.9% of explained variance respectively). Note that the niches of the first two groups (aquatic detritivores and predators, and terrestrial detritivores and predators) and the niches of the aquatic and terrestrial food webs are driven by similar stoichiometric traits. The third group was represented by terrestrial herbivores (Figure 6A). The niche shape of this group was defined by correlations of C and N content with Axis 1 (51.5% of explained variance), while P content was positively correlated to the Axis 2 (28.7% of explained variance).
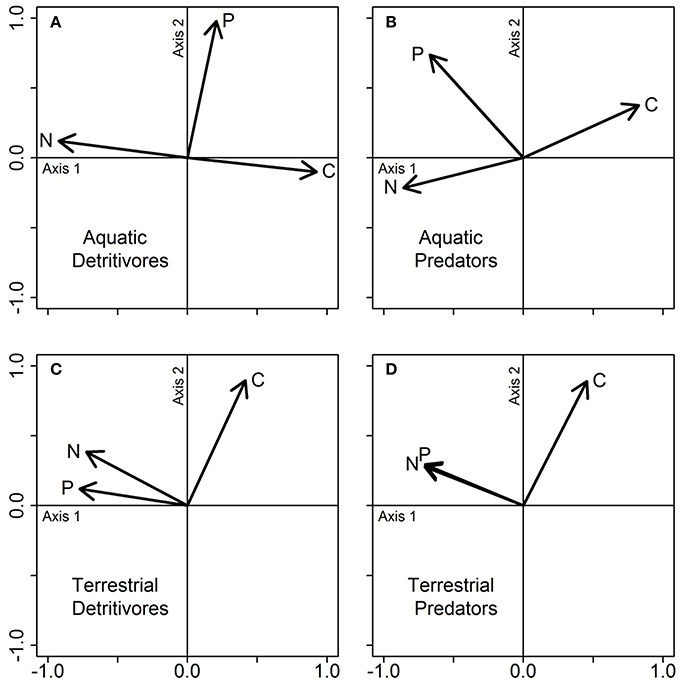
Figure 8. PCA on the stoichiometric traits of aquatic (A,B) and terrestrial (C,D) detritivores, and predators. Note that terrestrial herbivores are displayed in Figure 6. Each plot represents a PCA conducted separately for each group of organisms, using the data displayed jointly in Figure 7. Vectors show the influence of the three stoichiometric traits (C, N, and P contents) on each PCA axis.
Stoichiometric Niche Volumes of Individual Species
We next query the contribution of species diversity to the exploitation of stoichiometric space by food webs (Q8 in Table 1). Analyses at the species level were conducted on 37 invertebrate species (N = 22 and 15 terrestrial and aquatic species, respectively) for which we have > 4 individuals (> number of axes in the stoichiometric trait space). Of this 37 species dataset, any two species shared 5.0 ± 0.3% (mean pairwise percent overlap ± SE) of the total volume of their respective stoichiometric niches. The overlap was slightly but significantly higher within terrestrial (6.2 ± 0.7%) than within aquatic (5.7 ± 0.6%) species (permutation-based Wilcoxon and Mann-Whitney test: Z = 2.86, P = 0.004). Individual species niche volumes varied between <1% and 11.4% of the total stoichiometric niche space occupied by all invertebrates (2.4 ± 0.4% on average), and were not significantly different between terrestrial and aquatic food webs (permutation-based Wilcoxon and Mann-Whitney test: Z = −0.35; P = 0.74). These relatively small niche volumes are in accordance with a low mean nestedness between any two species (0.11 ± 0.009), suggesting high stoichiometric complementarity among species. Our PCA analyses did not show any consistent patterns in the main drivers of species-level stoichiometric niches.
Intraspecific Analyses of Stoichiometric Niches
Together, all individuals of Ammotrechidae sp. occupied 11.4% of the total stoichiometric niche space. This observed volume was significantly lower than niche volumes generated by chance as it fell outside the range between the 2.5 and 97.5th percentiles of the cumulative distribution of 999 random niche volumes (20.3 and 48.4% for the two percentiles, respectively). Each of the four populations of Ammotrechidae sp. occupied 1.4–3.6% of the total stoichiometric niche space (for populations in Guanacos and Huantajaya, respectively; 2.6 ± 0.47%, mean ± SE; Figure 9). These geographically distinct populations of Ammotrechidae sp. shared only ca. 26% of the volume occupied by their respective niches. Nestedness values among populations ranged from 0.04 to 0.26, indicating a wide range of complementarity of these populations in stoichiometric traits (0.12 ± 0.04, mean ± SE).
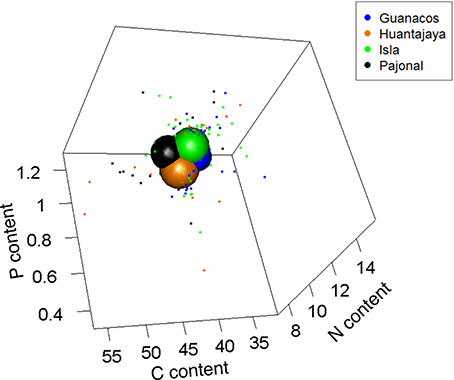
Figure 9. Relative size of stoichiometric niche volumes of four geographically distinct populations of a predatory species (Arachnida, Solifugae, Ammotrechidae sp.). Sphere sizes depicts the volumes of the four populations, and are centered around the average C, N, and P contents of all individuals from those populations. Dots are individual coordinates and show the variability within a given population. Populations are labeled according to the sites where they were collected (Guanacos, Huantajaya, Isla, and Pajonal). Axes represent each element as a percentage of dry body mass.
Finally, the niche volumes of all four populations were driven by different combinations of stoichiometric traits. For instance, N content was always correlated to the PCA Axis 1 of all populations, and explained most of the variations in stoichiometric composition of Huantajaya, Isla, and Pajonal populations (Axis 1: 55.4, 38.9, and 41.8% of total explained variance, for the three sites respectively), whereas the Guanacos population was driven by C content (Axis 1: 49.8% of total explained variance). In addition, P content was correlated with PCA Axis 2 in all but the Isla population, and, therefore, explained a large part of the total variance in those sites (Axis 2: 40.5, 33.0, and 32.5% in Guanacos, Huantajaya, and Pajonal populations, respectively). In contrast, C content of the Isla population was correlated to the PCA Axis 2, and this element explained 35.8% of the total variance (Figure 10).
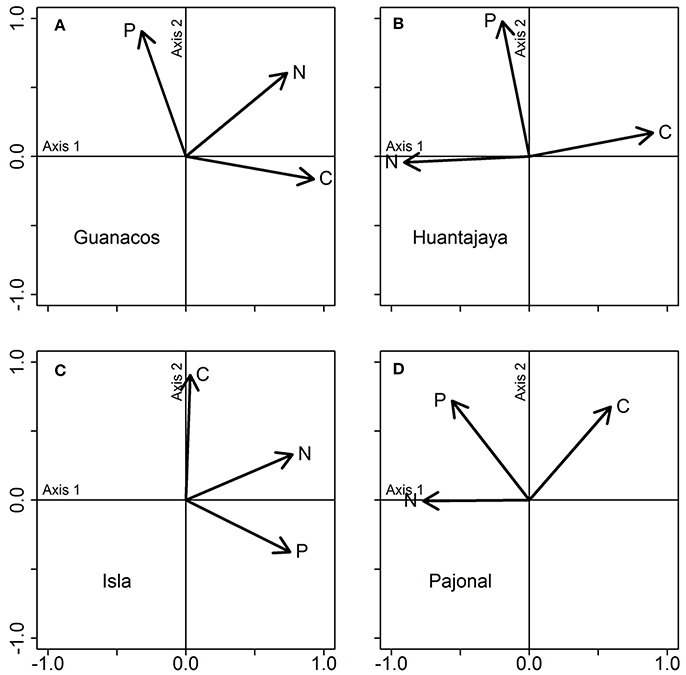
Figure 10. PCA on the stoichiometric traits of four geographically distinct populations of a predatory species (Arachnida, Solifugae, Ammotrechidae sp.). Each plot represents a PCA conducted separately for each population, using the data displayed jointly in this figure. As in this figure, populations are labeled according to the sites where they were collected: Guanacos (A), Huantajaya (B), Isla (C), and Pajonal (D). Vectors show the influence of the three stoichiometric traits (C, N, and P contents) on each PCA axis.
Effect of Sampling Size on Niche Volumes
The population-level niche volume of any species is the result of both intraspecific niche differences as well as the number of individuals, and our last question concerns the relative importance of these two factors (Q1 in Table 1). The 35 species in our analyses were represented by a variable number of individuals (4–141 individuals/species). Our analyses showed that the number of individuals had a significant and positive influence on the log-transformed species niche volumes (F = 34.23; df = 38; P < 0.0001). This relationship is strongly influenced by species with very few (<19, Nsp = 15) or many (>120, Nsp = 1) individuals, as removing such species rendered the relationship insignificant (Nsp = 24; F = 3.9; df = 22; P = 0.06) despite a six-fold difference in the number of individuals. Our randomized permutation procedure further demonstrates that considering the number of individuals is crucial when evaluating the relative contribution of a set of species (or functional feeding group or habitat) to the total stoichiometric niche volumes. This can be seen as a reorganization of the rank order of groups in terms of niche volume as the number of sampled individuals increases toward the full sample (Figure 11). For instance, if we compare the species Mecistogaster modesta and Lepisma sp. by subsampling 20 individuals from each, we find that the average niche contribution of the former was larger than that of the latter (i.e., no overlap at 95% CI; Figure 11A). However, if we base the comparison on all samples (Lepisma sp. is more abundant than M. modesta, so there are more samples of the former), this difference is erased. In contrast, Lepisma sp. contributed more to the total stoichiometric niche space than Salticidae sp. despite having fewer individuals (N = 91 and 111, respectively; Figure 11B). Finally, the thresholds (i.e., minimum numbers of individuals beyond which the range of variation in randomized niche volumes always included the total volume) were different for every species (Figure 11A). Similar effects of sample size were not only found at the species but also at the level of functional feeding groups (Figure 11B) and food web types (Figure 11C) thus highlighting the importance of basing samples sizes on the natural variation in species abundances.
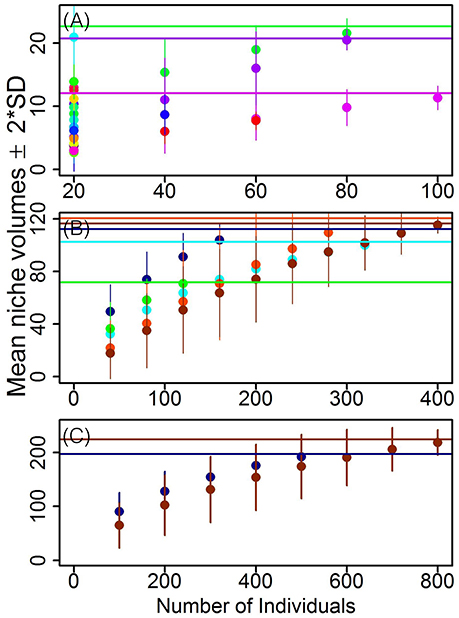
Figure 11. Mean niche volumes (±2*SD ~ 95% CI) after 999 randomized permutations on increasing number of individuals of: (A) species; (B) trophic groups: aquatic detritivores (light blue) and predators (dark blue), terrestrial herbivores (green), detritivores, (red) and predators (dark brown); and (C) aquatic (dark blue) and terrestrial (dark brown) habitats. Horizontal lines indicate the total niche volume of a given grouping variable (i.e., species, trophic groups, habitats). Note that for the sake of visual clarity in (A) total niche volumes were shown only for three species that have >80 individuals (i.e., Lepisma sp.—green, Salticidae sp.—light purple, and Pysogaster sp.—dark purple). In addition, Mecystogaster modesta is in light blue (topleft in A; cf main text).
Discussion and Perspectives
The elemental composition of living organisms is of fundamental importance for population dynamics, consumer-resource interactions, food web structure, and nutrient cycling (i.e., effect traits) (Sterner and Elser, 2002; Hall, 2009; Yamamichi et al., 2015), and can mediate eco-evolutionary responses to environmental change (i.e., response traits) (Jeyasingh et al., 2014; Leal et al., 2017). Stoichiometric traits, have been measured for a large number of very different species: primary producers (Reich and Oleksyn, 2004; Peñuelas et al., 2008, 2010; Reich, 2014), phytoplankton (Klausmeier et al., 2004; Litchman and Klausmeier, 2008; Quigg et al., 2011), microorganisms (Mouginot et al., 2014; Godwin and Cotner, 2015), invertebrates (Fagan et al., 2002; Woods et al., 2004; Hambäck et al., 2009; González et al., 2011a; Wiesenborn, 2011, 2013; Lemoine et al., 2014), and vertebrates (Torres and Vanni, 2007; González et al., 2011a), allowing across-species comparisons. For plants, studies on functional traits have revealed the existence of adaptive trait continua, which describes the phenotypic space of trait variation produced by evolutionary processes (Donovan et al., 2011; Carnicer et al., 2015; Diaz et al., 2016). The observed inter-specific variation in stoichiometric traits (i.e., C, N, and P contents) along these trait continua has shown strong trait co-variation between N and P (Carnicer et al., 2015). However, lacking in this framework are studies of whole communities focused on the relationships between major axes of variation in stoichiometric traits.
The multidimensional stoichiometric niche approach proposed here extends Hutchinson's (1957) concept of niches as n-dimensional hypervolumes in order to describe and compare the stoichiometry of groups of organisms at different scales using data from observational or experimental approaches. Overall, stoichiometric traits provide a common currency to estimate the dimensionality of trophic niche space, and help reduce the number of axis required to characterize community structures. All organisms interacting in an ecological community are composed by the same chemical elements, and these common currencies enable us to estimate trait similarities or differences across taxonomic groups. Several lines of evidence support the idea that differences in the elemental composition of living organisms reflect the evolution of internal and external structures (e.g., muscular, skeletal), as well as differences in organism life histories (e.g., Reiners, 1986; Sterner and Elser, 2002), and these stoichiometric differences exert strong influences on individual fitness, ecological interactions and ecosystem functioning (Hall, 2009; Leal et al., 2017). For example, the fitness of consumers can be directly related to the mismatch between their body's own elemental composition and that of their resources (Sterner and Elser, 2002). This mismatch can be elegantly encapsulated as the distance and consequent low overlap between the stoichiometric niches of consumers and resources (Q5 in Table 1). The multidimensional stoichiometric niche also provides a means of defining the elemental composition of an entire food web in more than one dimension, thereby capturing both the independent and interactive effects of nutrients on living organisms. This allows us to compare food webs in different habitats, locations, or points in time, in terms of their stoichiometric niches, specifically niche position, size and overlap (Q3, 4, 7, in Table 1). For example, Cross et al. (2007) reported the effects of experimental nutrient enrichment on biomass production and pathways of C, N, and P in a detritus-based stream food web. The multidimensional stoichiometric niche approach developed here could be used to re-analyze these and other data from experimental manipulations and evaluate the extent at which a particular or multiple stressors impact the stoichiometric niche (i.e., niche size, shape and position) of the food web in treated and reference systems. Importantly, this approach provides a novel way to quantitatively assess changes an ecosystem has experienced as a function of global change drivers, and to link such changes to shifts in the biogeochemical processes carried out by organisms (Q2 and Q6 in Table 1).
The idea of a multivariate description of the relative elemental content of organisms has been previously suggested and applied in plant ecology (Peñuelas et al., 2008, 2010), providing insights into plant trait differentiation and climate change responses. Here, we expand on those original ideas to describe the stoichiometric niche of entire communities from contrasting ecosystem types (i.e., aquatic vs. terrestrial) and trophic groups. Further, our approach includes novel ways to estimate the stoichiometric niche by borrowing and adapting metrics developed by isotopic ecologists to measure trophic niche (Layman et al., 2007; Jackson et al., 2011; Cucherousset and Villéger, 2015). These metrics have enabled us to compare the size, shape and position of the stoichiometric niche at different ecological levels, from a species niche to communities. We propose that this direct quantification of a multidimensional niche across ecological scales is possible from a set of elemental measurements of the individuals composing ecological communities, regardless of their taxonomic identity. Further, as stoichiometric differences within and between species are widely recognized, this approach enables us to quantify the stoichiometric niche of a single species up to that of entire communities.
Although the primary purpose of the case study was to demonstrate the use of the multidimensional stoichiometric niche approach, it also provides some insights into the concept of stoichiometric niche as a tool to describe and compare the stoichiometry of organisms at different scales. The questions we have addressed with this approach include those at the scales of individual morphospecies (intraspecific variation), trophic groups and food-web types, as well as questions that cross scales. Our analyses showed that species-level stoichiometric niches are relatively small and do not overlap much with each other. This suggests that species within terrestrial and aquatic systems exhibit large complementary in their stoichiometric niches. In addition, our analyses at the intraspecific level revealed similar patterns of small niche sizes, low overlap, and different niche shapes among geographically distinct populations of a predatory species (Ammotrechidae sp.). The observed variability in the elemental composition of those populations could be related to the fog nutrient supply that broadly varies across the coastal desert sites, thus affecting primary producers in those areas (González et al., 2011b), and potentially influencing the elemental composition of consumer populations such as Ammotrechidae sp. Finally, the niche size of Ammotrechidae sp. was significantly smaller than expected by chance, suggesting that strong deterministic factors may constrain the elemental composition of those organisms (including biological, environmental, and phylogenetic factors; Elser et al., 2000).
Our analyses also revealed that, although the terrestrial and aquatic food webs differ in both habitat and geographic location, the two food webs shared more than one third of their total niche volume. Thus, as with other quantitative traits, there are both gaps and crowded regions in the elemental space. The gaps suggest that there are fundamental constraints to stoichiometric evolution (Kay et al., 2005; Jeyasingh, 2007); macroscopic life (or at least that subset we sampled) may have only evolved a restricted set of morphological, physiological and cellular strategies for exploiting elemental resources. By contrast, the packed regions of phenotypic space suggest that certain trait combinations may have evolved either repeatedly or deep within phylogenetic trees (Pigliucci, 2007; Donovan et al., 2011). Interestingly, our findings are in agreement with recent worldwide studies on vascular plants, in which the trait hypervolume occupied by these plants is highly constrained within a relatively small plane, representing a small set of successful trait combinations (Diaz et al., 2016). We also found that the size of the terrestrial and aquatic niche volumes are driven by contrasting stoichiometric traits, this is, by covariance in N and P for terrestrial food webs and opposing effects of C and N for aquatic food webs. Although previous analyses have shown differences in elemental compositions between aquatic and terrestrial primary producers (Elser et al., 2000; Cebrian and Lartigue, 2004), our results are remarkable in that aquatic invertebrate food webs in bromeliads are largely fueled by allochthonous inputs of terrestrial leaf litter (Farjalla et al., 2016). Therefore, despite both depending on terrestrial plants, aquatic and terrestrial invertebrates in bromeliads still show large differences in their stoichiometric niches. However, we caution that the terrestrial and aquatic food webs we examined also differ in terms of biome (desert vs. forest), ontogenetic stage (mostly larvae for aquatic and mostly adults for terrestrial) and geographic location (Pacific vs. Atlantic side of the Americas); we hope that the method we demonstrate here will inspire more detailed studies that compare terrestrial and aquatic food webs in the same location. Our analyses also showed that terrestrial herbivores represent a unique group in terms of their stoichiometric niche, distinct from animals that consume detritus or other animals. The differences in stoichiometric niche between herbivores and detritivores are curious, given that both groups consume vascular plants, but may reflect the importance of detrital-based bacteria and fungi in the diet of detritivores (terrestrial and aquatic), plus opportunistic consumption of dead or live animals by detritivores. Potential animal matter consumption by detritivores may explain the large stoichiometric overlap between them and predators.
Our findings also demonstrate that subsampling abundant species may substantially underestimate the actual (population-level) stoichiometric niche occupied by such species in food webs. We thus strongly recommend integrating the natural interspecific variability in abundances rather than trying to standardize the number of individuals per species, as the latter could lead to erroneous estimates of population-level niches and thus misleading estimates of species contributions to the niche of the entire community. This suggestion is contingent on researchers sampling species proportionally to their natural abundance. However, once species differences in stoichiometric niches are established, the role of intraspecific variation in determining niche differences could then be assessed by rarefying samples.
In our case study, we focused on the three elements (C, N, P) that have consistently been shown to constrain species interactions and limit production in ecological communities (Sterner and Elser, 2002). However, if other elements (e.g., Ca, K, S, Fe, Mg) or other physiological (e.g., growth and reproductive rates) and behavioral (e.g., microhabitat preferences) traits are found to further define particular ecological communities, then other dimensions would need to be considered. Hypervolumes that appear to overlap in low dimensions (e.g., C, N, P) may not overlap if more dimensions are included, and conversely, with the addition of extra redundant dimensions, estimates of overlap may be falsely inflated. We could thus expand our current method and include more elements by calculating our metrics in the PCA space. With this approach we can reduce any set of n elements to only three principal components, which usually explain most of the variance in the data (i.e., the first three PCA axes) and would allow the calculation of our metrics. The resulting metrics could, then, be compared across studies and ecosystem types if the same set of elements is used to construct the reduced PCA space. Therefore, our focus on C, N and P dimensions provides a useful starting point for broad comparisons.
We think these insights show only a fraction of the potential of possible applications of the stoichiometric niche in ecological stoichiometric research, and that the multidimensional stoichiometric niche can be a general approach for assessing and comparing stoichiometric variation within and among species, populations and communities (Table 1). There are numerous potential applications of stoichiometric data to understand trophic structures especially when used in combination with other trophic-related functional traits, such as body size or with community-level properties such as species numerical abundances. This may offer a powerful and unified framework to assess niche partitioning and food web structures across contrasting ecosystem types and broad biogeographic scales. Such approaches could also be applied to explore individual specialization (Bolnick et al., 2002; Araujo et al., 2011), and to assess how populations and different genotypes vary in their fitness within a multidimensional stoichiometric space (Leal et al., 2017).
Recent research in ecological stoichiometry has highlighted the large intraspecific variation in elemental composition of plants and animals (e.g., González et al., 2011a; El-Sabaawi et al., 2012; Borer et al., 2013; Ebel et al., 2015). Within-species variation in stoichiometric traits can be driven by differences in morphological, physiological, behavioral, and life history traits, as well as predation pressure and spatial-temporal environmental heterogeneity in the quality of resources (Jeyasingh et al., 2014; Leal et al., 2017). The magnitude and origin of stoichiometric trait variation (i.e., phenotypic plasticity or genetic) within populations can be used to link the fitness of any population to changes in resource quality (Leal et al., 2017). For example, if directional selection is acting on stoichiometric traits to reduce elemental mismatches between a population and its resources, we should expect a high overlap between the stoichiometric niches of a consumer and its resources. In contrast, if fluctuating selection is acting upon stoichiometric traits along spatial or temporal variation in resource quality, then the stoichiometric niches of a population should reflect this variation by displaying a larger niche volume. Following Leal et al. (2017), we envision the assessment of how different genotypes vary in their fitness within a multidimensional space, in which stoichiometric trait axes determine the functional space.
Another exciting area of research in niche ecology is the analysis and mapping of stoichiometric niche-environment (i.e., elemental availability of resources) relationships, which can help understand and predict how well the stoichiometric niches of individuals are predicted by environmental gradients. The integration of stoichiometric models and outcomes from the multidimensional stoichiometric niche could expand and strengthen predictions derived from traditional approaches linking stoichiometry traits to fitness consequences to trophic interactions. Further, as nutrient dynamics are tightly linked to the stoichiometry of living organisms, analyses of niche overlap in the multidimensional space can provide insights into species functional redundancy or complementarity in ecosystem function (e.g., nutrient recycling rates). The stoichiometric niche is therefore a concept with the potential to unify physiological, ecological and ecosystem approaches to understanding the biogeochemical role of life.
Ethics Statement
Procedures involving animals were approved by the ethics committee of the Pontificia Universidad Católica de Chile and by the Chilean Agriculture and Livestock Service (SAG).
Author Contributions
AG developed the concept, designed of the manuscript, and wrote the manuscript. OD contributed on the development of the ideas presented here, analyzed the data, and helped writing the manuscript. PM, GR, and DS contributed to the writing of the manuscript. All authors made substantial contributions to the development of the ideas presented here and commented critically on drafts of the manuscript. This is a contribution of the Bromeliad Working Group.
Conflict of Interest Statement
The authors declare that the research was conducted in the absence of any commercial or financial relationships that could be construed as a potential conflict of interest.
Acknowledgments
PM acknowledges support from Grants ICM-MINECON, P05-002 IEB and CONICYT PFB-0023 (Chile). DS acknowledges support from an NSERC E.W.R. Steacie Memorial Fellowship, the field assistance of S. Amundrud, T. Amundrud, P. Corvalan, and L. Zornig, and the logistical support of the Área de Conservación Guanacaste. OD received a postdoctoral fellowship provided by the Biology Department at Rutgers University-Camden. The authors thank the editors for inviting this contribution and the reviewers for helpful comments that improved the manuscript. The authors thank members of the Bromeliad Working Group who aided in sample collection.
Supplementary Material
The Supplementary Material for this article can be found online at: https://www.frontiersin.org/article/10.3389/fevo.2017.00110/full#supplementary-material
References
APA (1992). Standard Methods for the Examination of Water and Wasterwater, 18th Edn. Washington, DC: APHA Press.
Araujo, M. S., Bolnick, D. I., and Layman, C. A. (2011). The ecological causes of individual specialization. Ecol. Lett. 14, 948–958. doi: 10.1111/j.1461-0248.2011.01662.x
Bolnick, D. L., Yang, L. H., Fordyce, J. A., Davis, J. M., and Svanbäck, R. (2002). Measuring individual-level resource specialization. Ecology 83, 2936–2941. doi: 10.1890/0012-9658(2002)083[2936:MILRS]2.0.CO;2
Borer, E. T., Bracken, M. E. S., Seabloom, E. W., Smith, J. E., Cebrian, J., Cleland, E. E., et al. (2013). Global biogeography of autotroph chemistry: is insolation a driving force? OIKOS 122, 1121–1130. doi: 10.1111/j.1600-0706.2013.00465.x
Brandl, S. J., and Bellwood, D. R. (2014). Individual-based analyses reveal limited functional overlap in a coral reef fish community. J. Anim. Ecol. 83, 661–670. doi: 10.1111/1365-2656.12171
Carmona, C. P., de Bello, F., Wason, N. W. H., and Leps, J. (2016). Traits without borders: integrating functional diversity across scales. Trends Ecol. Evol. 31, 382–394. doi: 10.1016/j.tree.2016.02.003
Carnicer, J., Sardans, J., Stephanescu, J. S., Ubach, A., Bartrons, M., Asensio, D., et al. (2015). Global biodiversity, stoichiometry and ecosystem function responses to human-induced C–N–P imbalances. J. Plant Physiol. 172, 82–91. doi: 10.1016/j.jplph.2014.07.022
Cebrian, J., and Lartigue, J. (2004). Patterns of herbivory and decomposition in aquatic and terrestrial ecosystems. Ecol. Monogr. 74, 237–259. doi: 10.1890/03-4019
Cereceda, P., Larrain, H., Osses, P., Farias, M., and Egaña, I. (2008). The spatial and temporal variability of fog and its relation to fog oases in the Atacama Desert, Chile. Atmosph. Res. 87, 312–323. doi: 10.1016/j.atmosres.2007.11.012
Chase, J., and Leibold, M. (2003). Ecological Niches: Linking Classical and Contemporary Approaches. Chicago, IL: University of Chicago Press. doi: 10.7208/chicago/9780226101811.001.0001
Comte, L., Cucherousset, J., Boulêtreau, S., and Olden, J. D. (2016). Resource partitioning and functional diversity of worldwide freshwater fish communities. Ecosphere 7:e01356. doi: 10.1002/ecs2.1356
Cornwell, W. K., Schwilk, D. W., and Ackerly, D. D. (2006). A trait-based test for habitat filtering: convex hull volume. Ecology 87, 1465–1471. doi: 10.1890/0012-9658(2006)87[1465:ATTFHF]2.0.CO;2
Cross, W. F., Wallace, J. B., and Rosemond, A. D. (2007). Nutrient enrichment reduces constraints on material flows in a detritus-based food web. Ecology 88, 2563–2575. doi: 10.1890/06-1348.1
Cucherousset, J., and Villéger, S. (2015). Quantifying the multiple facets of trophic diversity: new integra- tive metrics for stable isotope ecology. Biol. Indicat. 56, 152–160. doi: 10.1016/j.ecolind.2015.03.032
Dézerald, O., Leroy, C., Corbara, B., Carrias, J. F., Pélozuelo, L., Dejean, A., et al. (2013). Food-web structure in relation to environmental gradients and predator-prey ratios in tank-bromeliad ecosystems. PLoS ONE 8:e71735. doi: 10.1371/journal.pone.0071735
Diaz, S., Kattge, J., Johannes, H., Cornelissen, C., Wright, I. J., Lavorel, S., et al. (2016). The global spectrum of plant form and function. Nature 529, 167–171. doi: 10.1038/nature16489
Donovan, L. A., Maherali, H., Caruso, C. M., Huber, H., and de Kroon, H. (2011). The evolution of the worldwide leaf economics spectrum. Trends Ecol. Evol. 26, 88–95. doi: 10.1016/j.tree.2010.11.011
Ebel, J. D., Leroux, S. J., Robertson, M. J., and Dempson, J. B. (2015). Ontogenetic differences in Atlantic salmon phosphorus concentration and its implications for cross ecosystem fluxes. Ecosphere 6, 1–18. doi: 10.1890/ES14-00516.1
El-Sabaawi, R. W., Zandonà, E., Kohler, T. J., Marshall, M. C., Moslemi, J. M., Travis, J., et al. (2012). Widespread intraspecific organismal stoichiometry among populations of the Trinidadian guppy. Funct. Ecol. 26, 666–676. doi: 10.1111/j.1365-2435.2012.01974.x
Elser, J. J., Acharya, K., Kyle, M., Cotner, J., Makino, W., Markow, T., et al. (2003). Growth-rate stoichiometry couplings in diverse biota. Ecol. Lett. 6, 936–943. doi: 10.1046/j.1461-0248.2003.00518.x
Elser, J. J., Fagan, W. F., Denno, R. F., Dobberfuhl, D. R., Folarin, A., Huberty, A., et al. (2000). Nutritional constraints in terrestrial and freshwater food webs. Nature 408, 578–580. doi: 10.1038/35046058
Evans-White, M. A., Stelzer, R. S., and Lamberti, G. A. (2005). Taxonomic and regional patterns in benthic macroinvertebrate elemental composition in streams. Freshwater Biol. 50, 1786–1799. doi: 10.1111/j.1365-2427.2005.01455.x
Fagan, W. F., Siemann, E., Mitter, C., Denno, R. F., Huberty, A. F., Woods, A. H., et al. (2002). Nitrogen in insects: implications for trophic complexity and species diversification. Am. Nat. 160, 784–802. doi: 10.1086/343879
Farjalla, V. F., González, A. L., Céréghino, R., Dézerald, O., Marino, N. A. C., Piccoli, G. C. O., et al. (2016). Terrestrial support of aquatic food webs depends on light inputs: a geographically-replicated test using tank bromeliads. Ecology 97, 2147–2156. doi: 10.1002/ecy.1432
Finkel, Z. V., Follows, M. J., and Irwin, A. J. (2016). Size-scaling of macromolecules and chemical energy content in the eukaryotic microalgae. J. Plankton Res. 38, 1151–1162. doi: 10.1093/plankt/fbw057
Godwin, C. M., and Cotner, J. B. (2015). Aquatic heterotrophic bacteria have highly flexible phosphorus content and biomass stoichiometry. ISME J. 9, 2324–2327. doi: 10.1038/ismej.2015.34
González, A. L., Fariña, J. M., Kay, A. D., Pinto, R., and Marquet, P. A. (2011a). Exploring patterns and mechanisms of interspecific and intraspecific variation in body elemental composition of desert consumers. Oikos 120, 1247–1255. doi: 10.1111/j.1600-0706.2010.19151.x
González, A. L., Fariña, J. M., Pinto, R., Pérez, C., Weathers, K. C., Armesto, J. J., et al. (2011b). Bromeliad growth and stoichiometry: responses to atmospheric nutrient supply in fog-dependent ecosystems of the hyper-arid Atacama Desert, Chile. Oecologia 167, 835–845. doi: 10.1007/s00442-011-2032-y
Grinnell, J. (1917). The niche relationships of the California thrasher. Auk 34, 427–433. doi: 10.2307/4072271
Hall, S. R. (2009). Stoichiometrically explicit food webs: feedbacks between resource supply, elemental constraints and species diversity. Annu. Rev. Ecol. Evol. Syst. 40, 503–528. doi: 10.1146/annurev.ecolsys.39.110707.173518
Hambäck, P. A., Gilbert, J., Schneider, K., Martinson, H. M., Kolb, G., and Fagan, W. F. (2009). Effects of body size, trophic mode and larval habitat on Diptera stoichiometry: a regional comparison. Oikos 118, 615–623. doi: 10.1111/j.1600-0706.2008.17177.x
Hawlena, D., Strickland, M. S., Bradford, M. A., and Schmitz, O. J. (2012). Fear of predation slows plant-litter decomposition. Science 336, 1434–1438. doi: 10.1126/science.1220097
Hessen, D., Elser, J. J., Sterner, R. W., and Urabe, J. (2013). Ecological stoichiometry: an elementary approach using basic principles. Limnol. Oceanogr. 58, 2219–2236. doi: 10.4319/lo.2013.58.6.2219
Hutchinson, G. E. (1957). Concluding remarks. Cold Spring Harbor Symp. Quant. Biol. 22, 415–427. doi: 10.1101/SQB.1957.022.01.039
Jackson, A. L., Inger, R., Parnell, A. C., and Bearhop, S. (2011). Comparing isotopic niche widths among and within communities: SIBER—Stable Isotope Bayesian Ellipses in R. J. Anim. Ecol. 80, 595–602. doi: 10.1111/j.1365-2656.2011.01806.x
Janžekovi, F., and Novak, T. (2012). “PCA – a powerful method for analyze ecological niches,” in Principal Component Analysis - Multidisciplinary Applications, eds P. Sanguansat, et al. (InTech), 212. Available online at: http://www.intechopen.com/books/principal-component-analysis-multidisciplinaryapplications/
Jeyasingh, P. D. (2007). Plasticity in metabolic allometry: the role of dietary stoichiometry. Ecol. Lett. 10, 282–289. doi: 10.1111/j.1461-0248.2007.01023.x
Jeyasingh, P. D., Cothran, R. D., and Tobler, M. (2014). Testing the ecological consequences of evolutionary change using elements. Ecol. Evol. 4, 528–538. doi: 10.1002/ece3.950
Kay, A. D., Ashton, I. W., Gorokhova, E., Kerkhoff, A. J., Liess, A., and Litchman, E. (2005). Toward a stoichiometric framework for evolutionary biology. Oikos 109, 6–17. doi: 10.1111/j.0030-1299.2005.14048.x
Kearney, M., Simpson, S. J., Raubenheimer, D., and Helmuth, B. (2010). Modelling the ecological niche from functional traits. Phil. Trans. R. Soc. B 365, 3469–3483. doi: 10.1098/rstb.2010.0034
Kerkhoff, A. J., and Enquist, B. J. (2006). Ecosystem allometry: the scaling of nutrient stocks and primary productivity across plant communities. Ecol. Lett. 9, 419–427. doi: 10.1111/j.1461-0248.2006.00888.x
Klausmeier, C. A., Litchman, E., Daufresne, T., and Levin, S. (2004). Optimal nitrogen-to-phosphorus stoichiometry of phytoplankton. Nature 429, 171–174, doi: 10.1038/nature02454
Layman, C. A., Araujo, M. S., Boucek, R., Hammerschlag-Peyer, C. M., Harrison, E., Jud, Z. R., et al. (2012). Applying stable isotopes to examine food-web structure: an overview of analytical tools. Biol. Rev. 87, 545–562. doi: 10.1111/j.1469-185X.2011.00208.x
Layman, C. A., Arrington, D. A., Montaña, C. G., and Post, D. M. (2007). Can stable isotope ratios provide for community-wide measures of trophic structure? Ecology 88, 42–48. doi: 10.1890/0012-9658(2007)88[42:CSIRPF]2.0.CO;2
Leal, M. C., Seehausen, O., and Matthews, B. (2017). The ecology and evolution of stoichiometric phenotypes. Trends Ecol. Evol. 32, 108–117. doi: 10.1016/j.tree.2016.11.006
Legendre, P. (2014). lmodel2: Model II Regression. R package version 1.7–2. Available online at: http://CRAN.R-project.org/package=lmodel2
Leibold, M. A. (1995). The niche concept revisited: mechanistic models and community context. Ecology 76, 1371–1382. doi: 10.2307/1938141
Lemoine, N. P., Giery, S. T., and Burkepile, D. E. (2014). Differing nutritional constraints of consumers across ecosystems. Oecologia 174, 1367–1376. doi: 10.1007/s00442-013-2860-z
Litchman, E., and Klausmeier, C. A. (2008). Trait-based community ecology of phytoplankton. Annu. Rev. Ecol. Evol. Syst. 39, 615–639. doi: 10.1146/annurev.ecolsys.39.110707.173549
Machovsky-Capuska, G., Senior, A., Simpson, S., and Raubenheimer, D. (2016). The multidimensional nutritional niche. Trends Ecol. Evol. 31, 355–365. doi: 10.1016/j.tree.2016.02.009
Magnago, L. F. S., Martins, S. V., Schaefer, C. E. G. R., and Neri, A. V. (2012). Restinga forests of the Brazilian coast: richness and abundance of tree species on different soils. Anais da Academia Brasileira de Ciências 84, 807–822. doi: 10.1590/S0001-37652012000300023
Merritt, R. W., Cummins, K. W., and Berg, M. B. (2008). An Introduction to the Aquatic Insects of North America, 4th Edn. Kendall Hunt Pub. Co.
Mouginot, C., Kawamura, R., Matulich, K. L., Berlemont, R., Allison, S. D., Amend, A. S., et al. (2014). Elemental stoichiometry of Fungi and Bacteria strains from grassland leaf litter. Soil Biol. Biochem. 76, 278–285. doi: 10.1016/j.soilbio.2014.05.011
Newsome, S. D., Martinez del Rio, C., Bearhop, S., and Phillips, D. L. (2007). A niche for isotopic ecology. Front. Ecol. Environ. 5, 429–436. doi: 10.1890/060150.1
Peñuelas, J., Sardans, J., Llusià, J., Owen, S. M., Carnicer, J., Giambelluca, T. W., et al. (2010). Faster returns on ‘leaf economics’ and different biogeochemical niche in invasive compared with native plant species. Global Change Biol. 16, 2171–2185. doi: 10.1111/j.1365-2486.2009.02054.x
Peñuelas, J., Sardans, J., Ogaya, R., and Estiarte, M. (2008). Nutrient stoichiometric relations and biogeochemical niche in coexisting plant species: effect of simulated climate change. Pol. J. Ecol. 56, 613–622.
Persson, J., Fink, P., Goto, A., Hood, J. M., Jonas, J., and Kato, S. (2010). To be or not to be what you eat: regulation of stoichiometric homeostasis among autotrophs and heterotrophs. Oikos 119, 741–751. doi: 10.1111/j.1600-0706.2009.18545.x
Pigliucci, M. (2007). Finding the way in phenotypic space: the origin and maintenance of constraints on organismal form. Ann. Bot. 100, 433–438. doi: 10.1093/aob/mcm069
Pinto, R., Barría, I., and Marquet, P. A. (2006). Geographical distribution of Tillandsia lomas in the Atacama Desert, Northern Chile. J. Arid. Environ. 65, 543–552. doi: 10.1016/j.jaridenv.2005.08.015
Quigg, A., Irwin, A. J., and Finkel, Z. V. (2011). Evolutionary inheritance of elemental stoichiometry in phytoplankton. Proc. Biol. Sci. 278, 526–534. doi: 10.1098/rspb.2010.1356
R Development Core Team (2015). R: A Language and Environment for Statistical Computing. Vienna: R Foundation for Statistical Computing.
Raubenheimer, D. (2011). Toward a quantitative nutritional ecology: the right-angled mixture triangle. Ecol. Monogr. 81, 407–427. doi: 10.1890/10-1707.1
Raubenheimer, D., Machovsky-Capuska, G., Chapman, C., and Rothman, J. (2015). Geometry of nutrition in field studies: an illustration using wild primates. Oecologia 177, 223–234. doi: 10.1007/s00442-014-3142-0
Raubenheimer, D., and Simpson, S. J. (2004). Organismal stoichiometry: quantifying non-independence among food components. Ecology 85, 1203–1216. doi: 10.1890/02-0248
Raubenheimer, D., Simpson, S. J., and Mayntz, D. (2009). Nutrition, ecology and nutritional ecology: toward an integrated framework. Funct. Ecol. 23, 4–16. doi: 10.1111/j.1365-2435.2009.01522.x
Reich, P. B. (2014). The world-wide'fast-slow' plant economics spectrum: a traits manifesto. J. Ecol. 102, 275–301. doi: 10.1111/1365-2745.12211
Reich, P. B., and Oleksyn, J. (2004). Global patterns of plant leaf N and P in relation to temperature and latitude. Proc. Natl. Acad. Sci. U.S.A. 101, 11001–11006. doi: 10.1073/pnas.0403588101
Reiners, W. A. (1986). Complementary models for ecosystems. Am. Nat. 127, 59–73. doi: 10.1086/284467
Rigolet, C., Thiébaut, E., Brind Amour, A., and Dubois, S. F. (2015). Investigating isotopic functional indices to reveal changes in the structure and functioning of benthic communities. Func. Ecol. 29, 1350–1360. doi: 10.1111/1365-2435.12444
Sardans, J., and Peñuelas, J. (2013). Tree growth changes with climate and forest type are associated with relative allocation of nutrients, especially phosphorus, to leaves and wood. Glob. Ecol. Biogeogr. 22, 494–507. doi: 10.1111/geb.12015
Simpson, S. J., and Raubenheimer, D. (1993). A multi-level analysis of feeding behaviour: the geometry of nutritional decisions. Philos. Trans. R. Soc. Lond. B 342, 381–402. doi: 10.1098/rstb.1993.0166
Sperfeld, E., Halvorson, H. M., Malishev, M., Clissold, F. J., and Wagner, N. (2016). Woodstoich III: integrating tools of nutritional geometry and ecological stoichiometry to advance nutrient budgeting and the prediction of consumer-driven nutrient recycling. Oikos 125, 1539–1553. doi: 10.1111/oik.03529
Sperfeld, E., Wagner, N. D., Halvorson, H. M., Malishev, M., and Raubenheimer, D. (2017). Bridging Ecological Stoichiometry and Nutritional Geometry with homeostasis concepts and integrative models of organism nutrition. Funct. Ecol. 31, 286–296. doi: 10.1111/1365-2435.12707
Sterner, R. W., and Elser, J. J. (2002). Ecological Stoichiometry: The Biology of Elements from Molecules to the Biosphere. Princeton, NJ: Princeton University Press.
Swanson, H. K., Lysy, M., Power, M., Stasko, A. D., Johnson, J. D., and Reist, J. D. (2015). A new probabilistic method for quantifying n-dimensional ecological niches and niche overlap. Ecology 96, 318–324. doi: 10.1890/14-0235.1
Torres, L. E., and Vanni, M. J. (2007). Stoichiometry of nutrient excretion by fish: interspecific variation in a hypereutrophic lake. Oikos 116, 259–270. doi: 10.1111/j.0030-1299.2007.15268.x
Villéger, S., Grenouillet, G., and Brosse, S. (2013). Decomposing functional β-diversity reveals that low functional β-diversity is driven by low functional turnover in European fish assemblages. Glob. Ecol. Biogeogr. 22, 671–681. doi: 10.1111/geb.12021
Villéger, S., Mason, N. W., and Mouillot, D. (2008). New multidimensional functional diversity indices for a multifaceted framework in functional ecology. Ecology 89, 2290–2301. doi: 10.1890/07-1206.1
Villéger, S., Novack-Gottshall, P. M., and Mouillot, D. (2011). The multidimensionality of the niche reveals functional diversity changes in benthic marine biotas across geological time. Ecol. Lett. 14, 561–568, doi: 10.1111/j.1461-0248.2011.01618.x
Violle, C., and Jiang, L. (2009). Towards a trait-based quantification of species niche. J. Plant Ecol. 2, 87–93. doi: 10.1093/jpe/rtp007
Violle, C., Navas, M. L., Vile, D., Kazakou, E., Fortunel, C., Hummel, I., et al. (2007). Let the concept of trait be functional. Oikos 116, 882–892. doi: 10.1111/j.0030-1299.2007.15559.x
Wiesenborn, W. D. (2011). Nitrogen content in riparian arthropods is most dependent on allometry and order. Fla. Entomol. 94, 71–80. doi: 10.1653/024.094.0110
Wiesenborn, W. D. (2013). Phosphorus contents in desert riparian spiders and insects vary among taxa and between flights capabilities. Fla. Entomol. 96, 424–432. doi: 10.1653/024.096.0206
Woods, H. A., Fagan, W. F., Elser, J. J., and Harrison, J. F. (2004). Allometric and phylogenetic variation in insect phosphorus content. Funct. Ecol. 18, 103–109. doi: 10.1111/j.1365-2435.2004.00823.x
Keywords: chemical elements, ecological stoichiometry, food webs, multidimensional space, niche overlap, niche nestedness, traits
Citation: González AL, Dézerald O, Marquet PA, Romero GQ and Srivastava DS (2017) The Multidimensional Stoichiometric Niche. Front. Ecol. Evol. 5:110. doi: 10.3389/fevo.2017.00110
Received: 01 March 2017; Accepted: 01 September 2017;
Published: 20 September 2017.
Edited by:
Robert Warner Sterner, University of Minnesota Duluth, United StatesReviewed by:
Shawn James Leroux, Memorial University of Newfoundland, CanadaJared M. Goos, University of Texas at Arlington, United States
Copyright © 2017 González, Dézerald, Marquet, Romero and Srivastava. This is an open-access article distributed under the terms of the Creative Commons Attribution License (CC BY). The use, distribution or reproduction in other forums is permitted, provided the original author(s) or licensor are credited and that the original publication in this journal is cited, in accordance with accepted academic practice. No use, distribution or reproduction is permitted which does not comply with these terms.
*Correspondence: Angélica L. González, angelica.gonzalez@rutgers.edu