 Stephanie Post
 Galina Karashchuk2
 John D. Wade
 Pierre De Meyts
 Marc Tatar
- 1Department of Molecular Biology, Cell Biology and Biochemistry, Brown University, Providence, RI, United States
- 2Department of Ecology and Evolutionary Biology, Brown University, Providence, RI, United States
- 3Florey Institute of Neuroscience and Mental Health, University of Melbourne, Melbourne, VIC, Australia
- 4School of Chemistry, University of Melbourne, Melbourne, VIC, Australia
- 5LEO Pharma A/S, Ballerup, Denmark
- 6Department of Cell Signalling, de Duve Institute, Brussels, Belgium
- 7Department of Stem Cell Research Novo Nordisk A/S, Måløv, Denmark
Insulin and IGF signaling (IIS) is a complex system that controls diverse processes including growth, development, metabolism, stress responses, and aging. Drosophila melanogaster IIS is propagated by eight Drosophila insulin-like peptides (DILPs), homologs of both mammalian insulin and IGFs, with various spatiotemporal expression patterns and functions. DILPs 1–7 are thought to act through a single Drosophila insulin/IGF receptor, InR, but it is unclear how the DILPs thereby mediate a range of physiological phenotypes. We determined the distinct cell signaling effects of DILP2 and DILP5 stimulation upon Drosophila S2 cells. DILP2 and DILP5 induced similar transcriptional patterns but differed in signal transduction kinetics. DILP5 induced sustained phosphorylation of Akt, while DILP2 produced acute, transient Akt phosphorylation. Accordingly, we used phosphoproteomic analysis to identify distinct patterns of non-genomic signaling induced by DILP2 and DILP5. Across all treatments and replicates, 5,250 unique phosphopeptides were identified, representing 1,575 proteins. Among these peptides, DILP2, but not DILP5, dephosphorylated Ser15 on glycogen phosphorylase (GlyP), and DILP2, but not DILP5, was subsequently shown to repress enzymatic GlyP activity in S2 cells. The functional consequences of this difference were evaluated in adult Drosophila dilp mutants: dilp2 null adults have elevated GlyP enzymatic activity relative to wild type, while dilp5 mutants have reduced GlyP activity. In flies with intact insulin genes, GlyP overexpression extended lifespan in a Ser15 phosphorylation-dependent manner. In dilp2 mutants, that are otherwise long-lived, longevity was repressed by expression of phosphonull GlyP that is enzymatically inactive. Overall, DILP2, unlike DILP5, signals to affect longevity in part through its control of phosphorylation to deactivate glycogen phosphorylase, a central modulator of glycogen storage and gluconeogenesis.
Introduction
Insulin and insulin-like growth factor signaling (IIS) is an extensive network crucial for development, growth, nutrient sensing, aging, and stress responses (1–3). Dysfunction in IIS contributes to metabolic syndrome, diabetes, and cancer (4, 5), yet genetic modification of IIS can extend lifespan in many animals (6–8). Mammalian insulin and IGF ligands each have respective receptors, although each ligand can activate either receptor, receptors can form hybrid dimers, and the receptors themselves activate similar kinase cascades with multiple redundant components (9). It is currently unknown how IIS ligands use common receptors and pathways to produce different cellular and organism phenotypes such as glucose homeostasis for insulin and development and differentiation for IGF. Here, we use Drosophila melanogaster as a model system to understand how various insulin-like peptides [Drosophila insulin-like peptides (DILPs)] function through the fly’s sole insulin/IGF tyrosine kinase receptor (InR) to mediate specific physiological traits.
In Drosophila, ligand-activated InR phosphorylates a single insulin receptor substrate (IRS) chico, the homolog of mammalian IRS1–4, to induce the phosphorylation cascade of phosphoinositide-3-kinase (PI3K), phosphoinositide-dependent-kinase-1, and Akt (protein kinase B) (10). This signal transduction culminates to repress the forkhead transcription factor dFOXO, the homolog of mammalian FOXO1, 3a, and 4 (11). Fly IIS and FOXO mutants affect larval growth, adult size, lipid metabolism, stress responses and aging (8, 12, 13). Data suggest that DILPs have distinct spatial and temporal expression patterns and regulate shared and specific functions (13, 14). For instance, embryos express dilp4, larvae express dilp2, dilp3, and dilp5, and pupae upregulate dilp1 and dilp6 expression (1, 13, 14). In adults, dilp2 modulates adult lifespan and blood sugar (8, 15), dilp5 mediates protein metabolism (16), and dilp3 is suggested to regulate lipid metabolism (17). Given the diversity of these functions, it is poorly understood how specificity can be produced by similar ligands signaling through a common InR receptor.
The unique spatiotemporal expression patterns of DILPs may be sufficient to confer their specific phenotypes. An alternative, but not mutually exclusive model proposes that DILPs differentially activate InR to induce distinct cell signaling patterns that communicate specific downstream phenotypes. Studies from mammalian systems support such a signaling bias model: cells engineered to express only the insulin receptor (IR), IGF-1R, or IGF-2R produce distinct signaling and gene expression patterns in response to insulin, IGF-1, or IGF-2 (18, 19). At a biochemical level, Cieniewicz et al. (20) found that the IR was differentially phosphorylated and dephosphorylated on several individual tyrosine residues when cells were treated with insulin, IGF-1 or IGF-2. Furthermore, the IR but not IGF receptors regulates FKHR phosphorylation, GSK-3 inactivation, and glycogen synthesis (21, 22).
Models of ligand–receptor interaction propose that IR ligands with different receptor-binding kinetics can induce distinct downstream signaling (23, 24). Empirically, Sciacca et al. (25) found that the insulin analogs aspart, lispro, and glulisine produce more sustained Akt phosphorylation than insulin, which generates transient Akt phosphorylation. Analogs such as [B-Asp10] insulin and [A-His8, B-His4, B-Glu10, B-His27] insulin, which have strong receptor-binding affinity, induced sustained receptor phosphorylation and increased mitogenicity (26), and insulin analogs with weaker receptor-binding affinity produced less mitogenic potential (27, 28). Recently, decreased mitogenicity was reported for the insulin analog dicarba where the A6-A11 disulfide bond is replaced with a rigid bridge to reduce flexibility in its receptor interaction (29). Collectively, these data suggest that insulin, IGF, and insulin analogs can differentially bind to receptors to produce distinct signals and generate different downstream phenotypes.
Drosophila insulin-like peptide 2 and DILP5 are two principal hormones made in the insulin-producing cells of the adult Drosophila brain (30). They are thought to regulate sugar and protein metabolism respectively (31), and to uniquely respond to dietary sugar and protein (32). We compared cells stimulated in vitro with DILP2 or DILP5 to determine their cell signaling outputs measured as Akt and InR phosphorylation, transcript profiles and global patterns of protein phosphorylation. In S2 cells, DILP2 and DILP5 regulate highly similar sets of mRNA transcripts and are equally potent in their ability to stimulate Akt phosphorylation. On the other hand, at a given dose DILP2 and DILP5 differentially modulate the kinetics of Akt phosphorylation, with DILP2 producing acute stimulation and DILP5 generating prolonged signal. Expanding this non-genomic view of biased signaling, we used global phosphoproteomic analysis and found substantial qualitative differences between DILP2 and DILP5. In particular, DILP2 uniquely regulates dephosphorylation of glycogen phosphorylase (GlyP) at Ser15, the residue that represses enzymatic activity in mammals and Drosophila (33–35). In concordance, we find that dilp2 mutant flies have elevated GlyP enzymatic activity, and that overexpression of GlyP extended longevity in adults with normal insulin in a GlyP phosphorylation-dependent manner that corresponded with GlyP enzymatic activity. In a complementary way, we infer that the phosphorylation status and enzymatic activity of GlyP contribute to the lifespan extension of dilp2 mutants because expression of phosphonull, inactive GlyP partially rescues extended longevity of dilp2 mutants. Together, these data demonstrate that non-genomic signaling bias at the cellular level plays a role in differential physiological and life history functions of two insulin-like peptides.
Materials and Methods
Cell Culture and DILP Stimulation
S2 cells were cultured in Schneider’s media (Gibco) with 10% FBS (Gibco) and maintained at 28°C with ambient CO2. For overnight serum depletion, cells were held for 16 h in Schneider’s media without FBS, supplemented with 0.5% BSA and 25 mM HEPES. DILP5 peptide (36) stock at 50 μM and DILP2 peptide stock (37) at 100 μM stimulated overnight depleted cells compared with control depleted cells treated in parallel with an equal volume of 0.001 N HCl solvent (vehicle). The dose and duration of DILP stimulation for each experiment is detailed in the figure legend.
RNA-Seq and Data Analysis
S2 cells at a density of ~1 × 10⁷ cells per 100 cm cell culture dish were serum depleted overnight and stimulated with 100 nM DILP2, 100 nM DILP5 or vehicle for 1 h. Cells were washed with sterile, cold PBS and resuspended in lysis buffer (NE BioLabs magnetic mRNA isolation kit # S1550S). mRNA was purified and fragmented (Ambion # AM8740), then reverse transcribed to cDNA (Invitrogen SuperScript III # 18080051). DNA was purified by Agencourt Ampure XP beads and quantified by Qubit. DNA was repaired by End-It DNA Repair Kit (Epicenter, # ER0720) then supplemented with Klenow fragment (NE BioLabs # M0212s). Adapters were ligated using the T4 DNA Ligase Quick Ligase Kit (Enzymatics L603-HC-L) and PCR enriched using Phusion DNA polymerase (NE BioLabs # F-531). Libraries were gel purified, selecting DNA from 200 to 500 bp, and gel extracted (Qiagen Qiaquick # 28704). The selected libraries were sequenced on a HiSeq2500 with 50 bp single-end reads. Fastq files were assembled by Tophat and Bowtie, and assemblies were mapped to D. melanogaster dm3 assembly. In R, transcript counts and RPKM values were computed by the “easyRNASeq” package, and differential expression was calculated by the “edgeR” package. Transcript abundances by RPKM were trimmed to exclude genes with 0 counts to calculate coefficient of variance and determine the top 10% of genes with most variance. All raw RPKM expression data are listed in Table S1 in Supplementary Material.
Quantitative RT-PCR
Adult flies, serum-depleted S2 cells, and DILP-treated S2 cells at a density of about 1 × 10⁶ cells/ml were lysed in Trizol (Invitrogen) by mechanical force with two 3.2 mm steel beads in a Tissuelyser. RNA was Trizol extracted, treated with Turbo DNase (Invitrogen), and quantified on a NanoDrop ND-1000 (Thermo Fisher Scientific Inc.). RNA was reverse transcribed with iScript cDNA synthesis (Bio-Rad Laboratories, Inc.). Quantitative RT-PCR was conducted on an ABI prism 7300 Sequence Detection System (Applied Biosystems) using SYBR green PCR master mix (Applied Biosystems). Relative mRNA levels were calculated relative to RP49 expression by the comparative Ct method. Primer sequences are listed in Table S2 in Supplementary Material.
Western Blots
S2 cells at a density of about 1 × 10⁶ cells/ml were serum-depleted overnight and stimulated with DILP2, DILP5 or vehicle at the indicated concentration for the designated duration. Cells were washed briefly with sterile, cold PBS and resuspended in NP40 lysis buffer (Thermo Scientific # FNN0021) supplemented with 1 mM PMSF, PhosSTOP phosphatase inhibitor cocktail (Roche # 04906837001) and Protease Inhibitor Cocktail (Invitrogen # 78425). Cells were incubated on ice for 30 min, and vortexed every 10 min. Cell lysates were spun down for 10 min at 13K rpm and the supernatant incubated at 70°C with gel loading buffer and reducing reagent. Samples were loaded onto SDS-PAGE gels (Invitrogen NuPAGE # NP0321) and run at 200 V for 45 min. Gels were transferred to nitrocellulose membrane (Whatman # 10401396) and blocked with 5% BSA in TBS-T for 1 h. Membranes were incubated with primary antibody diluted 1:1,000 in 5% BSA in TBS-T overnight at 4°C with gentle rocking. Antibodies for Westerns were purchased from Cell Signaling Technology: Drosophila phospho-Akt Ser505 (# 4054); Pan-Akt (# 4691); Pan-phospho-ERK1/2 Thr202/Tyr204 (# 4370); Pan-ERK (# 9102); Drosophila phospho-S6K (# 9209); Pan-S6K (# 2708); IGF-R Tyr1131 (# 3021); actin (# 4967), or from Phospho-Solutions: Drosophila phospho-Akt Thr342 (# p104-342). Blots were washed for 5 min three times in TBS-T and incubated in horseradish peroxidase conjugated anti-rabbit secondary antibody (Jackson Immunoresearch) diluted 1:5,000 in 1% BSA for 1 h at room temperature. Subsequently, blots were washed for 5 min three times in TBS-T and incubated with ECL reagent (Perkin Elmer # NEL121001EA). Final blots were imaged and volume densitometrically quantified with ImageLab (Bio-Rad).
Phosphopeptides Sample Preparation and Enrichment for LC–MS/MS Analysis
Cell pellets were lysed in urea buffer (8 M urea, 1 mM sodium orthovanadate, 20 mM HEPES, 2.5 mM sodium pyrophosphate, 1 mM β-glycerophosphate, pH 8.0, 20 min, 4°C), sonicated and cleared by centrifugation (14,000 g, 15 min, 4°C). Protein concentration was measured (Pierce BCA Protein Assay, Thermo Fisher Scientific, IL, USA) and a total of 100 µg protein per sample was subjected to trypsin digestion. Tryptic peptides were desalted using C18 Sep-Pak plus cartridges (Waters, Milford, MA, USA) and lyophilized for 48 h to dryness. Phosphopeptides were enriched with Titansphere Phos-TiO tips (GL Sciences, Tokyo Japan) following the manufacturer’s protocol with modifications. We first prepared the condition buffers (containing TFA, CH3CN, and lactic acid) and elution buffers (1% NH4OH in water and 40% CH3CN). Then, the condition buffer was added to the Phos-TiO tips (centrifuge at 3,000 g, 22°C). After conditioning, desalted tryptic peptides from Jurkat total lysates (CD3/4 stimulated or unstimulated) were mixed with a synthetic phosphoserine standard (FQpSEEQQQTEDELQDK, AnaSpec, San Jose, CA, USA) at a ratio of 5 fmol standard: 1 µg sample. The mixture was loaded onto tips using centrifugation at 1,000 g at 22°C. After loading, the column was washed with condition buffers followed by elution buffers. Acetic acid was used to acidify TiO2-enriched samples, which were dried almost to completeness. The dried-eluted phosphopeptides were reconstituted in buffer A (0.1 M acetic acid) at a concentration of 1 µg/µl, and 5 µl was injected for each analysis.
The LC–MS/MS was performed on a fully automated proteomic technology platform (38, 39) with an Agilent 1200 Series Quaternary HPLC system (Agilent Technologies, Santa Clara, CA, USA) connected to a Q Exactive Plus mass spectrometer (Thermo Fisher Scientific, Waltham, MA, USA). The LC–MS/MS workflow follows Ahsan et al. (40). Peptides were separated through a linear reversed-phase 90 min gradient from 0 to 40% buffer B (0.1 M acetic acid in acetonitrile) at a flow rate of 3 µl/min through a 3 µm 20 cm C18 column. Electrospray voltage of 2.0 kV was applied in a split flow configuration, and spectra were collected using a top-9 data-dependent method. Survey full scan MS spectra (m/z 400–1,800) were acquired at a resolution of 70,000 with an AGC target value of 3 × 10⁶ ions or a maximum ion injection time of 200 ms. The peptide fragmentation was performed via higher-energy collision dissociation with the energy set at 28 NCE. The MS/MS spectra were acquired at a resolution of 17,500, with a targeted value of 2 × 10⁴ ions or a maximum integration time of 200 ms. The ion selection abundance threshold was set at 8.0 × 10² with charge state exclusion of unassigned and z = 1, or six to eight ions and dynamic exclusion time of 30 s.
Phosphoproteomics Analysis
Peptide spectrum matching of MS/MS spectra of each file was searched against a species-specific databases (UniProt; downloaded 2/1/2015) using MASCOT v. 2.4 (Matrix Science, Ltd., London, UK). A concatenated database containing “target” and “decoy” sequences was used to estimate the false discovery rate (FDR) (41). Msconvert from ProteoWizard (v. 3.0.5047), using default parameters and the MS2Deisotope filter, was used to create peak lists for Mascot. The Mascot database search was performed with the following parameters: trypsin enzyme cleavage specificity, two possible missed cleavages, 10 ppm mass tolerance for precursor ions, 20 mmu mass tolerance for fragment ions. Search parameters permitted variable modification of methionine oxidation (+15.9949 Da) and static modification of carbamidomethylation (+57.0215 Da) on cysteine. To identify the phosphoresidues, we included additional variable modification of phosphorylation (+79.9663 Da) on serine, threonine, and tyrosine residues. The resulting peptide spectrum matches (PSMs) were reduced to sets of unique PSMs by eliminating lower scoring duplicates. To provide high confidence, the Mascot results were filtered for Mowse Score (>20). Peptide assignments from the database search were filtered down to a 1% FDR by a logistic spectral score as previously described (41, 42). To validate the position of the phosphorylation sites, the Ascore algorithm (43) was applied, and the reported phosphorylation site position reflected the top Ascore prediction.
Relative Quantitation of Phosphopeptides
Phosphopeptide abundance was quantified from selected ion chromatograms (SIC) peak areas. Retention time alignment of individual replicate analyses was performed as described by Demirkan et al. (44). Peak areas were calculated from SICs in R 3.0 based on the Scripps Center for Metabolomics’ XCMS package (version 1.40.0). This approach performed multiple passes through XCMS’ central wavelet transformation algorithm (implemented in the centWave function) over increasingly narrower ranges of peak widths with parameters: mass window of 10 ppm, minimum peak widths ranging from 2 to 20 s, maximum peak width of 80 s, signal to noise threshold of 10 and detection of peak limits via descent on the non-transformed data enabled. SIC peak areas were determined for every phosphopeptide identified by MS/MS. In the case of a missing MS/MS for a particular peptide in one replicate, the SIC peak area was calculated according to the peptide’s isolated mass, and the retention time was calculated from retention time alignment. A minimum SIC peak area equivalent to the typical spectral noise level of 1,000 was required of all data reported for label-free quantitation. Individual SIC peak areas were normalized to the peak area of the standard phosphopeptide DRVpYHPF that was exogenously spiked before phosphopeptide enrichment and reversed-phase elution into the mass spectrometer. Quantitative analysis was applied to five replicate experiments. To select phosphopeptides that show a statistically significant change in abundance between control and treatment cells, q-values for multiple hypothesis tests were calculated based on p-values from two-tailed unpaired Student’s t-tests using the R package QVALUE as described by Storey (2003) and Storey and Tibshirani (45, 46).
Glycogen and Glucose Quantification
Glycogen and glucose were quantified as described by Tennessen et al. (47). Flies were mated for 2 days, and females separated into groups of six flies. Food vials were changed every other day, and at age 8–10 days, flies were briefly anesthetized with light CO2, collected in a microcentrifuge tube and flash frozen in dry ice. With tubes kept on ice, flies were homogenized in 100 μl PBS using a motorized plastic pestle. A 10 μl aliquot was removed for BCA protein quantification, and the remaining 90 µl was heat treated at 70°C for 10 min. Samples were spun down at 14K rpm for 3 min at 4°C, and the supernatant removed to a new tube. Samples were diluted 1:10, and standard curve dilutions for glucose and glycogen were made by diluting stocks to 160 µg/ml, making 1:1 serial dilutions for 80, 40, 20, and 10 µg/ml. 25 µl of each sample was pipetted to four wells of a clear microplate, and 25 µl of each glucose or glycogen standard was pipetted to two wells. Amyloglucosidase enzyme (Sigma, # A1602) was diluted 1.5 µl into 998.5 µl PBS, and 25 µl diluted enzyme was pipetted to the glycogen standards and two sample wells. 25 µl PBS was pipetted to the glucose standards and to the other two sample wells. The plate was wrapped in parafilm and incubated at 37°C for 1 h. 100 µl Glucose Hexokinase Reagent (Thermo Scientific TR15421) was pipetted to each well, and the plate was incubated at room temperature with gentle rocking for 15 min. The absorbance was read at 340 nm on a SpectraMax M5 platereader using Softmax Pro software. The glycogen concentration was quantified by subtracting the glucose absorbance from the total glycogen + glucose absorbance and normalized to total protein content quantified by BCA.
Glycogen Phosphorylase Activity Assay
Activity of glycogen phosphorylase was adapted and modified from protocols used for mammalian cells (48). Five female flies 7–10 days old were harvested in 150 µl NP40 lysis buffer with inhibitors (see Western Blots) without centrifugation. 10 μl lysate was combined with reaction mixture in a 96-well plate on ice. Reaction mixture consisted of 50 mM Na glycerophosphate pH 7.1, 10 mM K2PO4, 5 mM MgCl2, 1 mM DTT, 0.2% glycogen, 0.5 mM NAD+, 1.6 U phosphoglucomutase, and 1.6 U glucose-6-phosphate dehydrogenase in a total reaction of 300 µl. The plate was brought to room temperature (25°C), and fluorescence was measured at excitation 350 nm, emission 470 nm (SpectraMax M5 platereader) for NADH generation. Activity was calculated by determining the fluorescence after 45 min incubation, relative to total protein determined by BCA assay (Thermo Scientific # 23227).
Cloning Drosophila GlyP
GlyP cDNA was obtained from the Drosophila Genomics Resource Center (stock # LD24485) and cloned into pENTR-TOPO Gateway vector (Thermo Fisher). Mutations S15A and S15D were made using the GENEART Site-Directed Mutagenesis System (Invitrogen A13282). Wild-type, S15A, and S15D GlyP coding sequences were sub-cloned into the Drosophila transgene vector pUAST-attB and were submitted to GenetiVision Corporation (Houston, TX, USA) for transgene embryo injection and stock generation.
Fly Husbandry
Flies were reared and maintained at 25°C, 40% relative humidity and 12-h light/dark. Adults were maintained upon agar-based diet with cornmeal (0.8%), sugar (10%), and yeast (2.5%), or upon the same diet supplemented with 200 μM mifepristone (RU486) or ethanol control. Stocks were backcrossed to w1118 for at least five generations.
Lifespan Assays
Two- to three-day-old mated female adult flies reared in density-controlled bottles were collected with light CO2 anesthesia and pooled in 1 l demography cages at a density of 100–125 flies per cage. Three independent cages were used per genotype. Food vials were changed every day for the first 3 weeks, then every 2 days for the remainder of the experiment. Dead flies were removed and recorded every other day. Survival analysis and Cox Proportional Hazard analysis were conducted in R using the “surv” package and “survdiff” function. To adjust for mortality caused by the RU486 covariate independent of genotype, Gompertz mortality models were fit to control genotypes given RU486 or ethanol vehicle using the “flexsurv” package and “flexsurvreg” function. The mortality estimate decreased by RU486 treatment was applied to Gompertz mortality models for test genotypes given RU486 or ethanol vehicle.
Starvation Assays
Two- to three-day-old mated female adult flies reared in density-controlled bottles were collected with light CO2 anesthesia into glass vials containing 1% agar solution at a density of about 15 flies per vial. Eight independent vials were used per genotype. Vials were changed every 2–3 days to ensure flies did not desiccate. Dead flies were counted every 8 h. Data analyzed as in Section “Lifespan Assays.”
Results
Drosophila insulin-like peptides 1–8 have varied physiological functions (8, 49, 50) which may arise from specific amino acid sequences and structures that interact with InR in precise ways. When DILP peptide sequences are aligned with that of human insulin and IGF (Figure 1), the B and A chains of the proposed mature pro-hormones show low sequence identity among DILPs and between DILPs, insulin and IGF, except for cysteine residues required for disulfide bonds connecting the B and A chains (51, 52). In addition, among most ligands there is a highly conserved tyrosine in the A chain and a leucine in the B chain that are proposed to function in ligand–receptor interactions (36). DILP7 and DILP1 are longer than other DILPs and have very unique sequences relative to DILPs 1–6. Human insulin, IGF, and some DILPs contain one or two phenylalanines at the C-terminal tail of the B chain, although these residues are not found in DILP2, DILP6 and DILP7.
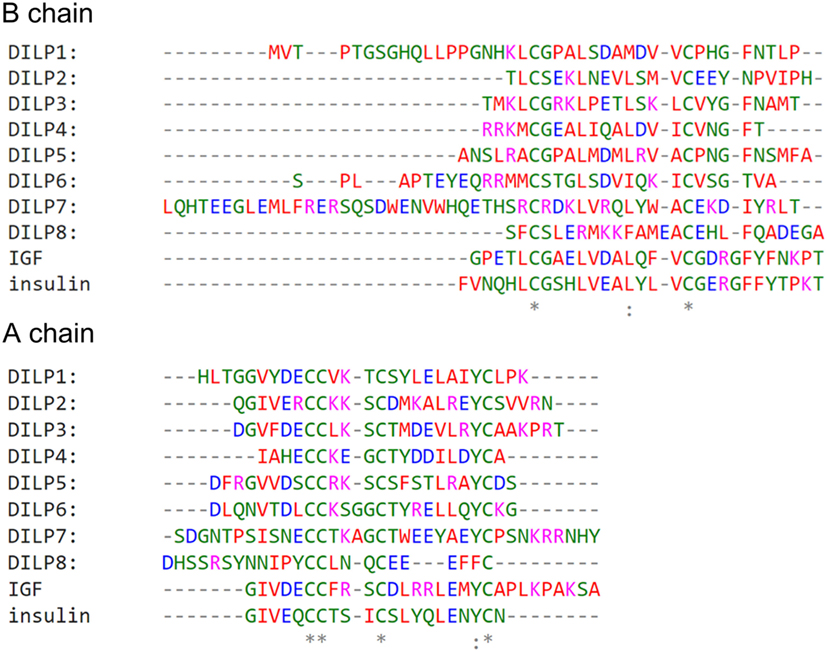
Figure 1. Drosophila insulin-like peptide (DILP) amino acid sequences have a low degree of identity between each other and with human insulin and IGF. DILP B chain and A chain sequences based on predicted cleavage sites. Alignment made using EMBL-EBI Clustal Omega (https://www.ebi.ac.uk/Tools/msa/clustalo/).
Drosophila insulin-like peptide 2 and DILP5 are similarly expressed and released from brain medial secretory neurons in adult Drosophila, yet appear to have distinct roles in glucose and protein metabolism and in aging (8, 16). To understand how these related ligands generate different outcomes in vivo, we treated Drosophila S2 cells in culture with purified synthetic DILP2 (37) and recombinant DILP5 (36). At doses ranging from 0.1 to 100 nM, DILP2 and DILP5 stimulated comparable increases in Akt phosphorylation at Ser505 (Figure 2A), suggesting they have similar potency. Likewise, DILP2 and DILP5 were equally efficient at stimulating InR and Akt phosphorylation in a ligand competition assay (Figure 2B). Finally, DILP2 and DILP5 similarly stimulated phosphorylation of Akt at Thr342, S6K at Thr398, and ERK at Thr202/Tyr204, though S6K phosphorylation is slightly stronger after DILP5 stimulation than DILP2 (Figure 2C). Together, these data suggest that the synthetic DILP2 and recombinant DILP5 reagents have comparable potency and ability to stimulate S2 cell signaling.
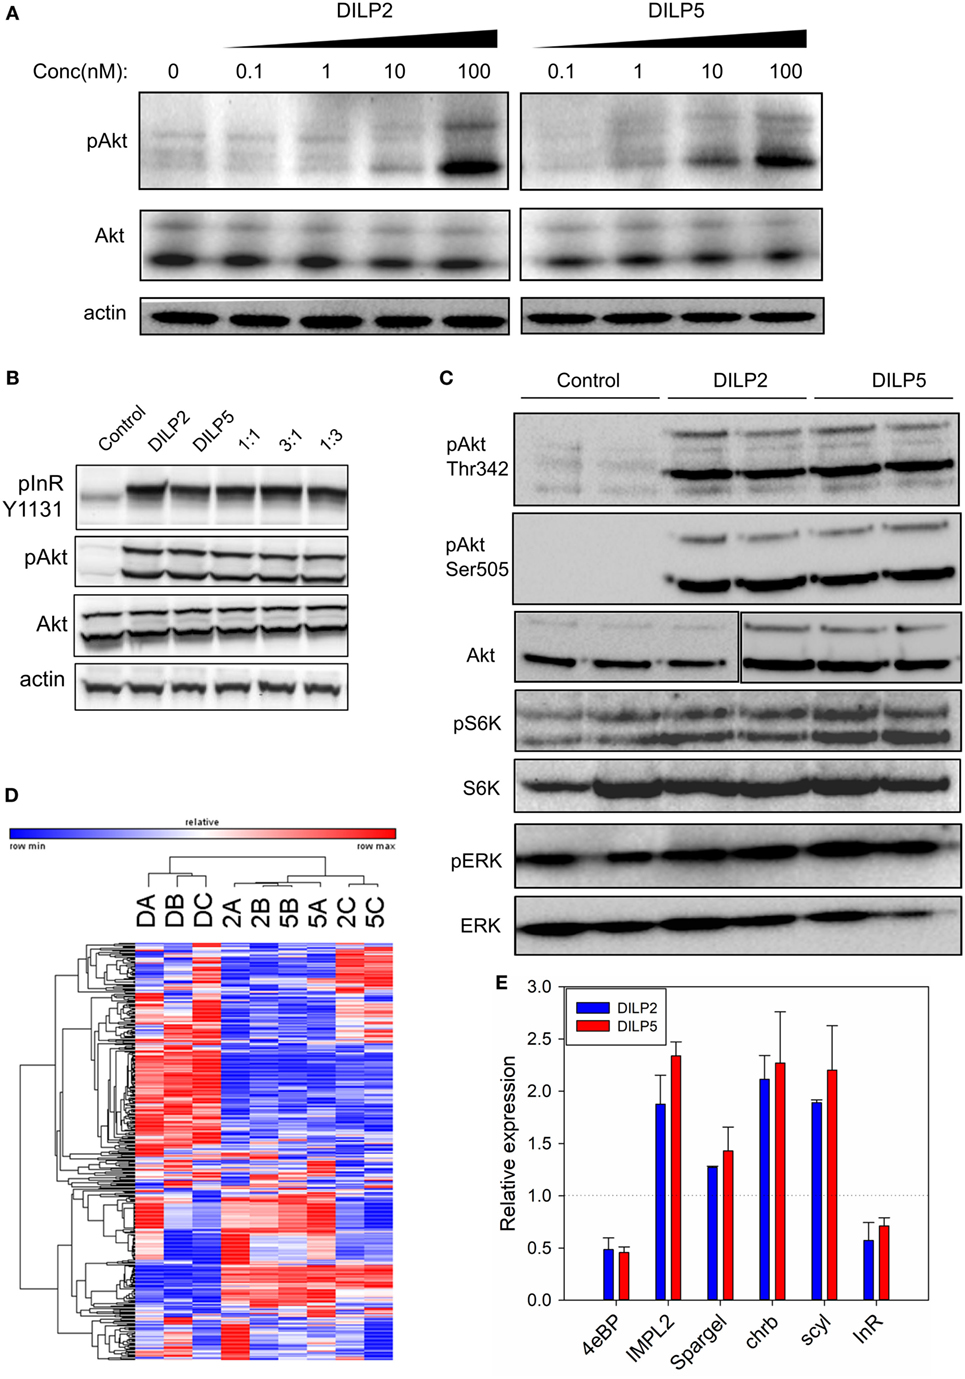
Figure 2. Drosophila insulin-like peptide (DILP) 2 and DILP5 induce similar signaling in S2 cells. (A) DILP2 and DILP5 stimulate Akt phosphorylation with comparable potency. S2 cells were stimulated with DILP2 or DILP5 for 5 min at the specified concentrations. (B) DILP2 and DILP5 activate InR and Akt the same in competition assays, inducing similar phosphorylation each alone, with equal parts each ligand or, with an excess of one ligand. S2 cells stimulated for 5 min with DILP2 or DILP5 at 100 nM, with 50 nM DILP2 and 50 nM DILP5 (“1:1”), with 75 nM DILP2 and 25 nM DILP5 (“1:3”), and with 25 nM DILP2 and 75 nM DILP5 (“1:3”). (C) DILP2 and DILP5 similarly stimulate pAkt, pS6K, and pERK at 100 nM for 5 min. (D) DILP2 and DILP5 at 100 nM for 1 h induce similar gene expression profiles. Heatmap represents the transcript RPKM values with the top 2.5% coefficient of variation between samples: DILP2 (“2”), DILP5 (“5”), or control serum-depletion (“D”). (E) DILP2 and DILP5 at 100 nM for 1 h induce similar changes in gene expression measured by qPCR.
Human insulin and IGF, and Drosophila DILPs regulate activity of FOXO transcription factors to affect downstream pathways through control of gene expression (53–55). To determine whether DILP2 and DILP5 stimulate different or similar gene expression profiles, we conducted RNA-Seq from mRNA of S2 cells stimulated with each DILP at 100 nM for 1 h (Figures 2D,E; Figure S1 and Table S1 in Supplementary Material). Transcript profiles induced by DILP2 and DILP5 were not distinguishable based on hierarchical clustering of the top 2.5% responding genes, while profiles stimulated by DILP2 and DILP5 were clearly distinct from profiles of cells in the absence of DILP (depletion control) (Figure 2D). On the other hand, DILP2, DILP5, and control profiles were mutually distinct based on principle component analysis of all RPKM values (Figure S1B in Supplementary Material). DILP5 stimulation induces and represses more genes overall than DILP2 stimulation. Of the 2,053 genes regulated by DILP5 and 1,646 genes regulated by DILP2 (differentially expressed relative to unstimulated controls, DE, FDR < 0.05), 1,366 genes were shared between DILP2 and DILP5 (Figure S1A in Supplementary Material; Table 1). Several of these shared, differentially expressed genes were validated by qRT-PCR from independent biological samples (Figure 2E). About 33% of DILP5 targets are unique to DILP5 and approximately 16% of DILP2 targets are unique to DILP2 (Table 1; Figure S1A in Supplementary Material). Two of the uniquely DILP2-regulated genes, Hex-C and CG33774, were validated by qRT-PCR from independent biological samples (Figure S1E in Supplementary Material).
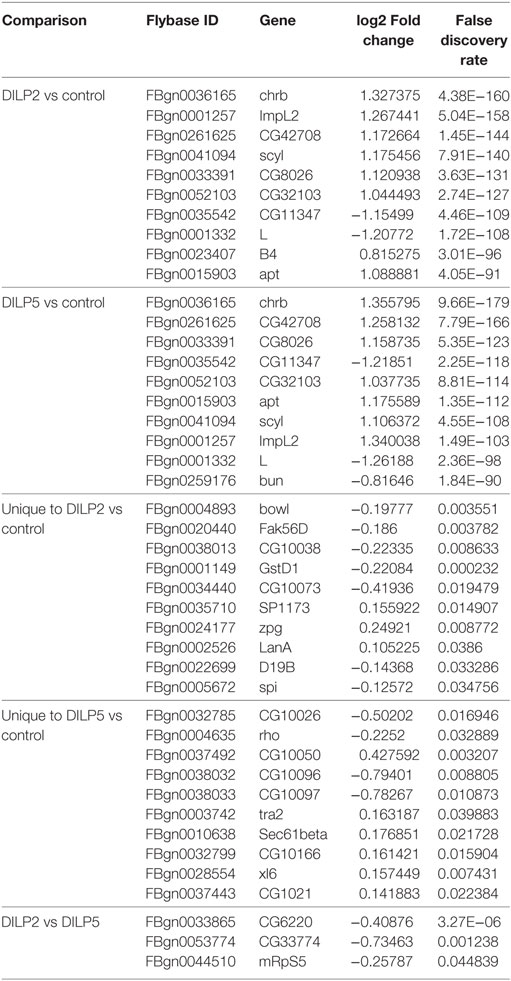
Table 1. DE genes stimulated by Drosophila insulin-like peptide (DILP) 2 and DILP5: top 10 with statistical significance.
The log2 fold changes for genes regulated by either DILP were low overall: most were below twofold although some were up to fourfold for DILP2 stimulation and fivefold change for DILP5 (Figures S1C,D in Supplementary Material). Despite modest effect size, we observed low FDR for most differentially expressed genes (Table 1). However, only three genes showed statistical significance for differential expression between DILP2 and DILP5 (Table 1). Overall, DILP2 and DILP5 appear to have largely similar effects on the transcriptional responses of cells, at least on the time point of 1 h.
In addition to transcription, insulin and IGFs modulate non-genomic cell signaling. In particular, human insulin and IGF ligands can induce specific cell responses by generating different kinetics of phosphorylation upon Akt and the insulin and IGF receptors (20, 25). To explore how DILP2 and DILP5 affect phosphorylation kinetics through a common receptor in Drosophila, we studied the time course of Akt phosphorylation in DILP2- and DILP5-stimulated cells by Western blots (Figure 3A). DILP2 rapidly and transiently induces pAkt, with a peak at 3 min that quickly recedes to baseline. On the other hand, DILP5 stimulates sustained pAkt for at least 1 h (Figure 3A). Such differences could arise from differences in negative feedback that determine signal termination or persistence as receptors are internalized and degraded, maintained in endosomes, or continue to signal from the cell surface (56, 57). To assess InR signaling persistence, we measured InR Tyr1131 phosphorylation over a 1 h time course of DILP2 or DILP5 stimulation. DILP2 and DILP5 stimulate similar, sustained receptor phosphorylation (Figure 3B), suggesting that dynamics of receptor activation alone does not account for the differential kinetics of pAkt in DILP2- and DILP5-stimulated cells.

Figure 3. Drosophila insulin-like peptide (DILP) 2 and DILP5 stimulate distinct patterns of protein phosphorylation. (A) DILP2 and DILP5 at 100 nM stimulate distinct kinetics of phosphorylation upon Akt across 1 h. Representative blot (left) and quantification (right) of band densitometry analyzed in ImageLab (Bio-Rad), two-way ANOVA DILP2 vs DILP5 p < 0.001, post hoc p < 0.05 for t = 3 min, 10, 30, and 60 min. (B) DILP2 and DILP5 at 100 nM stimulate pInR to similar extents over 1 h. Representative blot (top) and quantification (bottom) two-way ANOVA p = 0.482. (C) PCA plot for phosphoproteomic data distinguishes among control, DILP2 stimulation, and DILP5 stimulation. (D) Phosphosites increased or decreased by DILP2 or DILP5 at 100 nM for the designated time points (cutoffs to call phosphosites inferred from data-driven fold-change threshold, see Figure S2 in Supplementary Material). (E) Venn diagram of phosphopeptides changed by DILP2 (top) and by DILP5 (bottom) across time. There are fewer overlapping phosphopeptides among DILP2 stimulation time points than among DILP5 stimulation time points. (F) Heatmap of phosphorylation events regulated by DILP2 and not by DILP5. White dot indicates false discovery rate (FDR) < 0.05 after adjustment for multiple comparison. Glycogen phosphorylase (GlyP) Ser15 FDR = 0.1.
Insulin and IGF stimulate phosphorylation on proteins besides Akt, including GSK3β, MAPK, and mTOR (58, 59). To more fully identify differences that are potentially induced by DILP2 and DILP5 signaling, we conducted an unbiased phosphoproteomic analysis in S2 cells treated with DILP2 or DILP5 at 100 nM for 3, 10, or 30 min (Table S3 in Supplementary Material). Among all samples and replicates, we detected 5,250 unique phosphosites corresponding to 1,575 proteins. Table 2 lists phosphosites significantly changed by DILP2 or DILP5 at individual time points compared with control. Phosphosites altered by DILP2 stimulation but not by DILP5 included Cindr (Ser452), CG6454 (Thr952), and Supervillin (Ser437) (Table 2; Figure 3F). Few phosphosites were significantly altered based on rigorous criteria (FDR < 0.05), likely because technical variation between biological replicates was high (Figure 3C). Nonetheless, principle component analysis reveals that combined time points of DILP2 and DILP5 phosphoproteomes separate from each other and relative to control cells in three dimensions. The first three principle components accounted for approximately 86.21% of the variance in the data. Time points at 3 min were more similar to control samples (data not shown); however, across all time points, DILP2 and DILP5 produce distinct global phosphorylation patterns (Figure 3C, MANOVA p = 0.005).
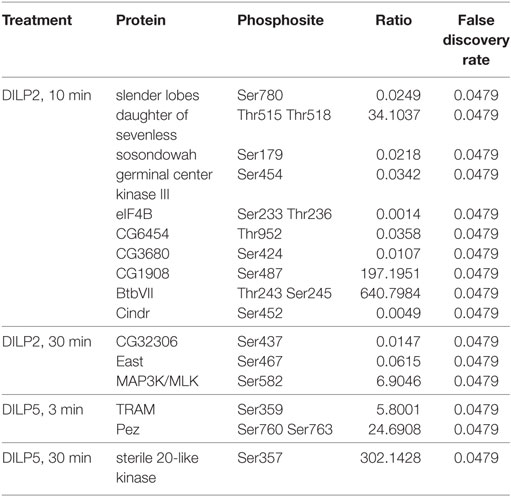
Table 2. Significantly altered phosphosites stimulated by Drosophila insulin-like peptide (DILP) 2 and DILP5.
To further resolve potential differences between the DILP2- and DILP5-stimulated phosphoproteomes, we calculated the inflection point for all phosphopeptide fold changes in each condition as previously described (44, 60). The inflection points assigned conservative fold-change thresholds as criteria for altered phosphosites (Figure S2 and Table S4 in Supplementary Material). Over the time course, DILP5 largely increases phosphorylation at the detected phosphosites, while DILP2 equally increases or decreases phosphorylation (Figure 3D). In addition, the majority phosphosites changed by DILP2 were unique to one time point, but many of the phosphosites affected by DILP5 were observed across two or three time points (Figure 3E), consistent with the patterns of pAkt kinetics we observed by Western blot.
Among several phosphorylation events unique to DILP2 or DILP5 by inflection point analysis (Figure S2 and Table S4 in Supplementary Material), GlyP (Ser15) was greatly decreased in abundance by DILP2 but not by DILP5 (Figure 3F). Glycogen phosphorylase (GlyP) is notable as a conserved glycogen catabolic enzyme and the rate-limiting step in glycogenolysis (35, 48, 61, 62), while glycogen storage is emerging as a potential mediator of aging in several model systems (63, 64). The activity of GlyP is regulated through several mechanisms, including phosphorylation of Ser14 in mammalian phosphorylase (65), the analogous residue to Drosophila GlyP Ser15. Phosphorylation of Ser14 activates GlyP, and mammalian insulin represses this posttranslational modification (65). Our result shows that DILP2, but not DILP5, leads to dephosphorylation of GlyP at Ser15, suggesting that DILP2 specifically inactivates this central enzyme of glucose metabolism.
We conducted metabolic studies to verify that DILP2 specifically modulates glycogen metabolism and GlyP activity. First, DILP2 stimulation decreased GlyP enzymatic activity in S2 cells while DILP5 stimulation did not (Figure 4A). As well, measured from whole adults, GlyP activity was elevated in dilp2 mutants but not in dilp5 mutants (Figure 4D). Second, while dilp2 and dilp5 mutants showed reduced total glycogen content compared with wild-type flies (Figure 4B), dilp5 mutants also have less total glucose (Figure 4C), suggesting that dilp2 and dilp5 mutants differentially modulate glycogen turnover. DILP2 appears to repress GlyP activity, and mutation of dilp2 permits catabolism of glycogen to maintain glucose titers. DILP5 does not directly modulate GlyP activity, and mutation of dilp5 must affect glycogen and glucose levels through an alternative metabolic pathway.
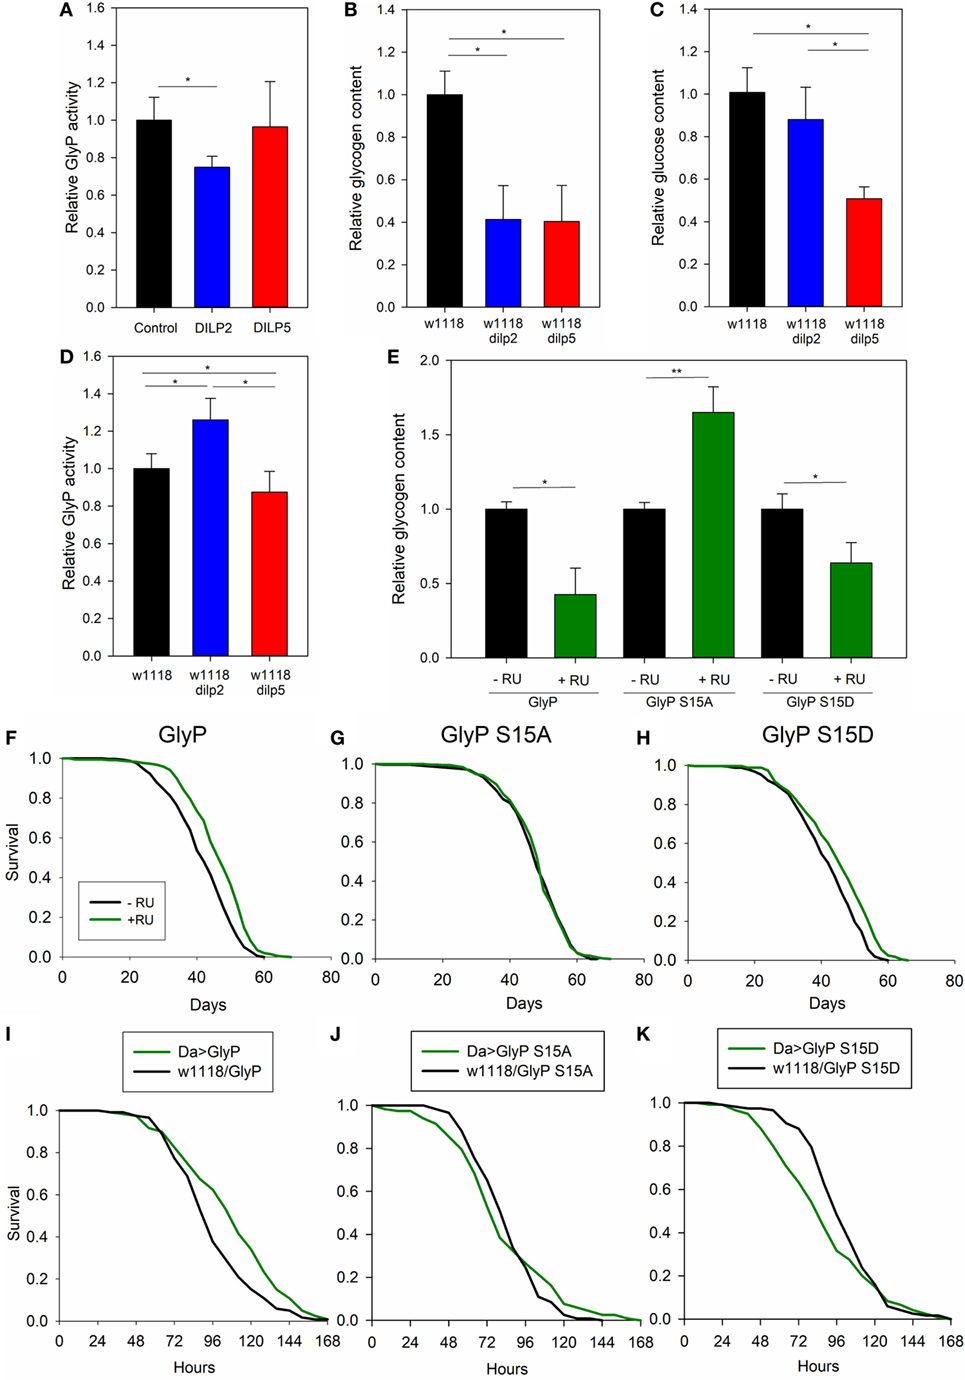
Figure 4. Drosophila insulin-like peptide (DILP) 2 and DILP5 differentially regulate glycogen phosphorylase (GlyP) to modulate lifespan and physiology. (A) DILP2 represses GlyP activity in S2 cells relative to cells in control conditions or those stimulated by DILP5. Serum-depleted S2 cells treated with 100 nM DILP or vehicle for 15 min. ANOVA p = 0.032, n = 6. (B,C) dilp2 and dilp5 mutants have decreased glycogen content, and dilp5 mutants have decreased glucose content, relative to wild type. Each replicate from six female flies, age 10 days post-eclosion and 8–10 biological replicates. Glycogen (B) ANOVA p < 0.001 and glucose (C) ANOVA p < 0.001. (D) dilp2 mutants have increased GlyP activity relative to wild type; dilp5 mutants have decreased activity. Each replicate from 6 female flies, age 10 days post-eclosion, 11 biological replicates, ANOVA, p < 0.001. (E) Whole animal glycogen is affected by overexpressing GlyP with the DaGS-Gal4 driver as a function of Ser15. Each replicate, six female flies, age 10 days post-eclosion, four to five biological replicates. (F–H) Systemic GlyP overexpression extends longevity in a Ser15 dependent manner. DaGS-Gal4 (RU486 inducible) drove: (F) wild-type GlyP (Cox hazard analysis, χ2 = 46.5, p < 0.0001), (G) phosphonull GlyP S15A (Cox hazard analysis, χ2 = 0.1, p = 0.75), (H) phosphomimetic GlyP S15D (Cox hazard analysis, χ2 = 30.5, p < 0.0001). Each genotype cohort n = 348–366 adults. (I–K) Systemic GlyP overexpression regulates starvation resistance in a Ser15 dependent manner. Da-Gal4 drives: (I) GlyP (Cox hazard analysis, χ2 = 10.3, p = 0.001), (J) phosphonull GlyP S15A (Cox hazard analysis, χ2 = 0.2, p = 0.68), (K) phosphomimetic GlyP S15D (Cox hazard analysis, χ2 = 4, p = 0.05). Each genotype cohort n = 115–120 adults.
Unique among Drosophila IIS ligands, mutation of dilp2 is sufficient to extend longevity, and reduced dilp2 expression is consistently observed in various IIS manipulations that slow aging (8, 15, 53). Here, we report that reduced dilp2 activates GlyP. Notably, chronological lifespan is reduced in yeast mutant for glycogen phosphorylase (64), and lifespan is extended in Caenorhabditis elegans deficient in glycogen synthesis (63). Therefore, we tested whether GlyP overexpression extends Drosophila lifespan. Wild-type GlyP, GlyP phosphonull (S15A, inactive enzyme), and GlyP phosphomimetic (S15D, constitutively active) were overexpressed using a systemic, RU486-inducible driver to express transgenes exclusively in adults and to provide exact coisogenic controls. Wild-type GlyP (Figure 4F) and constitutively active GlyP (S15D) (Figure 4H) extended lifespan. Expression of inactive GlyP (S15A) (Figure 4G) had no effect on survival. These data suggest that Drosophila lifespan is modulated by Ser15 phosphorylation of GlyP in response to DILP2. As well, many long-lived IIS mutants are resistant to starvation, and we found that expression of wild-type GlyP similarly improved starvation survival (Figure 4I). Starvation survival was not improved by phosphonull GlyP (Figure 4J), while phosphomimetic GlyP reduced resistance to starvation (Figure 4K). As noted, a recent study in C. elegans revealed that decreased glycogen increased longevity (63). Here, Drosophila longevity is increased by expressing wild-type or constitutively active GlyP, where each decreases total glycogen. Flies that express a phosphonull S15A GlyP have normal lifespan and increased total glycogen (Figure 4E).
Our data suggest that mutation of dilp2 modulates lifespan in part through non-genomic regulation of GlyP. To directly test this hypothesis, we conducted genetic epistasis analysis. With a systemic, RU486-inducible Gal4 driver, we expressed GlyP transgenes in long-lived dilp2 mutant adults. With addition of RU486, we induced variants of GlyP to determine if any modulate the longevity benefit of the dilp2 mutation. RU486 treatment slightly extended lifespan in controls harboring UAS-GlyP transgenes while lacking Gal4 transgenes. To identify mortality effects dependent on GlyP independent of side effects from RU486, life table data were fit to Gompertz survival models by accelerated failure analysis. RU significantly affected the scale parameter (λ, frailty) but not the shape parameter (γ, slope). To account for this effect on mortality in the experimental genotypes, we subtracted the estimated scale coefficient associated with RU alone from the scale parameter estimated in Gal4/UAS genotypes given RU. Using these adjusted scale parameters and the estimated shape parameters, we recalculated life tables, survival plots and inferences on mortality. After adjusting for side effects of RU alone, survival does not differ between dilp2 mutant controls (no RU486) and dilp2 mutants overexpressing wild-type (Figure 5A); S15D (Figure 5C) GlyP (with RU486). As predicted if dilp2 affects lifespan through control of GlyP, longevity is decreased in dilp2 mutants when we overexpress S15A GlyP (Figure 5B). Noting that wild-type and constitutively active GlyP extend longevity in adults with wild-type dilp2, our genetic interaction analysis verifies that dilp2 and GlyP modulate longevity through a common pathway: GlyP activation and phosphorylation at Ser15 is required for mutants of dilp2 to extend lifespan.
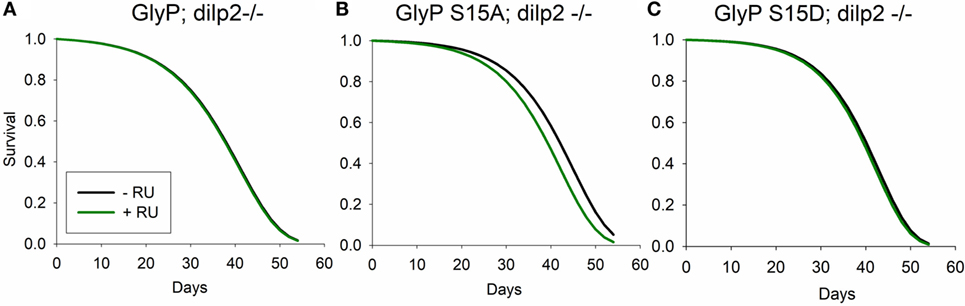
Figure 5. Glycogen phosphorylase (GlyP) phosphorylation is required for longevity conferred by mutation of dilp2. Survival calculated from life tables based on estimated Gompertz mortality parameters for UAS-GlyP expression in a dilp2 mutant background with transgenes driven by systemic DaGS-Gal4. Gompertz mortality scale (l, frailty) parameters of transgene expression genotypes were adjusted for the impact of RU alone upon mortality estimated from control genotypes. (A) Overexpression of wild-type GlyP does not extend longevity (Cox hazard analysis, χ2 = 0.1, p = 0.76), (B) expression of GlyP S15A decreases lifespan (Cox hazard analysis, χ2 = 24.2, p < 0.0001), and (C) expression of GlyP S15D does not extend longevity (Cox hazard analysis, χ2 = 1.2, p = 0.28). Each genotype cohort n = 351–361 adults.
Discussion
Insulin/IGF signaling variously affects animal cells, tissues, and systemic phenotypes through the action of related ligands, similar receptors and shared downstream components (9, 66). Insulin/IGF signaling is notably complex in Drosophila where there are seven insulin-like ligands that interact with a single tyrosine kinase insulin-like receptor, and one relaxin-like ligand associated with a G-protein-coupled receptor (10, 49, 67). Here, we studied how related insulin-like ligands, represented by DILP2 and DILP5, produce distinct phenotypes while signaling through a common tyrosine kinase receptor. The functions of several DILPs have been described by genetic and cellular studies. DILPs have distinct gene expression patterns across development, life stage and tissues [reviewed in Ref. (31)]. The spatiotemporal diversity of DILP expression provides one potential mechanism by which these ligands differentially control phenotypes despite sharing a common receptor. Nevertheless, some DILPs are expressed at the same time and place, such as DILP2, DILP3, and DILP5 in adult IPCs (30), or DILP4 and DILP7 in embryos (1). It seems likely, therefore, that insulin/IGF receptors themselves can differentially signal in response to specific ligands.
Insulin ligand sequence and structure may confer this proposed signaling bias at InR. Primary amino acid sequence varies among DILPs. Some insight on that variation can be gained by noting how DILPs differ from human insulin and IGF. DILPs and insulin/IGF differ at residues thought to be required for the ligands to bind the receptor (36, 68) at insulin binding site 1: Ser B9, Val B10, Tyr B16, and Asn A21; at insulin binding site 2: His B10, Thr A8, and Ile A10. Insulin His B10 is especially interesting because this residue is substituted with Asp to create the fast-acting synthetic insulin analog X10, and because it plays a role in the storage of insulin as hexamers in β-cells (27). The B chain of DILP5, insulin, and IGF contains C-terminal phenylalanines and large aromatic residues, but DILP2 lacks these residues. The phenylalanines and large aromatic residues function in insulin dimerization, negative cooperativity and receptor interaction (69), and their mutation produces diabetes (at human insulin Phe 24 and Phe25, the “insulin Los Angeles” and “insulin Chicago” syndromes) (70, 71). Overall, DILP2 and DILP5 vary in many amino acid residues that could potentially affect receptor binding, and thus differentially modulate receptor conformation and auto-activation. Independent of receptor interactions, DILPs bind circulating factors including acid-labile subunit (dALS), secreted decoy of InR, and IMP-L2 (72–74) which might differentially affect DILP bioavailability and signaling output.
Using synthetic DILP2 and recombinant DILP5, we studied how these related ligands affect cell signaling in a controlled, simplified system: in vitro stimulation of Drosophila S2 cells. Our preparations of DILP2 and DILP5 ligand have equal potency measured by their ability to induce pAkt in a dose-dependent manner. IIS ligands regulate many cellular functions through control of FOXO transcription factors, so we sought to differentiate these ligands by their potentially unique profiles of induced and repressed mRNA. Based on RNA-Seq and quantitative RT-PCR, DILP2 and DILP5 produce strikingly similar changes in gene expression, where differences are marked by the quantity of transcripts, not their identity. FOXO thus appears to be similarly regulated by DILP2 and DILP5. Mammalian insulin and IGFs provide a precedent for this outcome, where these functionally distinct yet similar hormones produce remarkably concordant transcriptional profiles (18, 19). Naturally, insulin and IGF also operate within cells through non-genomic pathways such as repressing glycogen synthesis and GSK3β, inducing glucose transport through GLUT4 and altering protein translation (58). To study such alternatives, we compared how DILP2 and DILP5 affect the kinetics and patterns of protein phosphorylation.
We began with Western analysis of InR and Akt phosphorylation across a time course, using time points previously studied in mammalian insulin/IGF signaling and in Drosophila cells stimulated with human insulin (58, 59). DILP2 and DILP5 stimulate prolonged phosphorylation of InR across the assay period, as seen in rat glial cells when IGF-1 simulates IGF-1R (75, 76). On the other hand, DILP2 induces transient Akt phosphorylation that peaks at 3 min, while DILP5 stimulates prolonged, elevated Akt phosphorylation over the tested 60-min time course. Transient versus prolonged kinetics of Akt phosphorylation resembles the differences seen in mammalian tyrosine kinase receptor signaling where ligand-specific receptor-binding kinetics produce “shout” versus “whisper” transduction dynamics (56) with respective associated metabolic and mitogenic potential (26, 27). In mammalian cell model systems, various insulin and insulin analogs likewise can stimulate transient or sustained dynamics of Akt phosphorylation (25).
The dynamics of IR activation has been modeled based on receptor-binding kinetics induced by specific ligands (23, 24). DILP2 and DILP5 may affect receptor off-rates in distinct due to differences in amino acid sequences that induce unique conformational changes. Conformational changes in receptor extracellular and intracellular domains may subsequently alter receptor auto-activation, trafficking, and turnover (77). Models of mammalian receptor tyrosine kinases propose that different signals may result from trafficking of the receptor when it is ubiquitinated and degraded, recycled to the cell surface, or continuously activated in endosomes (56, 57, 78). Each mechanism may impact how the insulin ligands affect receptor interactions with substrate and adaptor proteins. Drosophila has a single IRS chico, the homolog of mammalian IRS1–4. In our phosphoproteome analysis, DILP2 and DILP5 similarly phosphorylated Chico Tyr470 and Ser471 (see Table S3 in Supplementary Material), suggesting that these sites do not mediate the distinct impact of the ligands on pAkt dynamics. Many additional adaptor proteins are known for mammalian IIS ligands (79) and several are described for Drosophila including Dock, Shc, lnk, and daughter of sevenless (DOS), the homolog of mammalian Gab1 (80). Interestingly, we found that DILP2 increased phosphorylation of the DOS peptide at Thr515 and Thr518 to a greater extent than DILP5. DOS/Gab1 is a scaffold for receptor tyrosine kinase signaling that integrates sevenless signaling, PI3K, and MAPK (81). Future studies may determine if DOS mediates how DILP2 and DILP5 differentially affect the kinetics of pAkt.
Most phosphopeptides affected by DILP stimulation are downstream of the immediate InR substrates. Notably, DILP2, but not DILP5, stimulated dephosphorylation of Cindr, the Drosophila homolog of human CIN85, which is associated with endocytosis and clathrin in mammalian cells (82). Moreover, DILP2 dephosphorylated CG6454, a likely homolog of human C2CD5 that interacts with clathrin to regulate GLUT4 translocation in adipocytes (83, 84). Interestingly, inhibition of clathrin-mediated endocytosis can alter insulin-stimulated PI3K activity and Shc and MAPK phosphorylation (78). Thus, DILP2 in contrast to DILP5 may uniquely regulate dynamics of InR endocytosis, GLUT4 membrane translocation, and cytoskeletal structures.
Among other stimulated proteins, glycogen phosphorylase (GlyP) is dephosphorylated by DILP2 but not by DILP5. To evaluate if DILP2 affects GlyP function in S2 cells, we applied a GlyP enzymatic activity assay for insects, adapting techniques from mammalian biology (48). DILP2 treatment decreases GlyP activity, as predicted from the phosphoproteomic data where DILP2 stimulation dephosphorylated GlyP at Ser15. DILP5 stimulation does not alter GlyP activity, in accordance with the phosphoproteomic data where DILP5 did not alter GlyP Ser15. We also validated that DILP2 uniquely regulates GlyP activity in vivo. Adult dilp2 mutant flies, which are long-lived, have elevated GlyP enzymatic activity relative to wild-type flies, while activity is slightly decreased in dilp5 mutants. Since DILP5 alone does not reduce GlyP Ser15 phosphorylation, the dilp5 mutation may decrease GlyP activity indirectly because loss of dilp5 increases dilp2 expression (data not shown).
dilp2 mutants could in part extend lifespan by its non-genomic control of this glycogen catabolism enzyme, given that DILP2 regulates GlyP Ser15 phosphorylation and that dilp2 mutants have increased lifespan and GlyP activity. We find that overexpression of GlyP in all tissues modestly (12%) but significantly extends lifespan. However, Bai et al. previously found that depletion of GlyP by RNAi in all tissues was sufficient to extend lifespan (53), while in yeast, loss of GlyP shortens chronological lifespan (63). Although GlyP modulates glycogenolysis in many tissues, it is unknown whether glycogen levels may affect aging. Longevity is not correlated with stored glycogen among yeast mutants lacking various genes involved in glucose and glycogen metabolism (64). Human cultured muscle cells overexpressing glycogen phosphorylase had decreased glycogen stores, but also display improved metabolic homeostasis through increased glycogen turnover, elevated lipid storage, and enhanced glucose uptake (85). Thus, GlyP overexpression may enhance overall metabolic homeostasis.
Aside from the impact of GlyP on stored glycogen, Favre et al. suggested that GlyP may regulate aging through AMP-activated protein kinase (AMPK) and oxidative stress resistance (64). The β-subunit of AMPK has a glycogen-binding domain that acts as a glycogen sensor. Allosteric regulation of this domain affects AMPK phosphorylation and subsequent localization and activity (86). Here, we found increased phosphorylation of the AMPK β-subunit (see Table S4 in Supplementary Material), by DILP2 but not by DILP5 suggesting that activation of fly GlyP may affect aging through secondary effects of altered glycogen flux, rather than simply through glycogenolysis and glucose production. Notably, Gusarov et al. recently demonstrated in C. elegans that glycogen modulates longevity by modulating AMPK, superoxide dismutase and oxidative stress resistance, while glycogen phosphorylase deficient worms are short-lived (63). In overwintering insects, glycogen is stored in preparation for diapause and is broken down by glycogen phosphorylase during diapause, a life history state associated with slow to negligible aging (87, 88). Remarkably, GlyP expression is increased during Drosophila diapause (89). Therefore, GlyP is situated at the center of a network that regulates energetics, metabolic homeostasis and stress responses that associate with persistence and longevity.
While mammalian glycogen phosphorylase can be activated by glucagon and protein kinase A (PKA) (90), how insulin inversely represses glycogen phosphorylase is not completely understood. Mammalian insulin is proposed to suppress glycogen phosphorylase by activating protein phosphatase 1 (PP1) to dephosphorylate GlyP Ser15 [reviewed in Ref. (90)]. As well, AMP allosterically enhances glycogen phosphorylase activity while glucose represses its activity. When glucose binds to glycogen phosphorylase, the enzyme allows PP1 to dephosphorylate Ser15 (90). Finally, insulin decreases cellular cAMP levels, which represses PKA. Repressed PKA limits phosphorylase kinase activity that otherwise phosphorylates Ser15 on glycogen phosphorylase. DILP2 may modulate Drosophila GlyP through each of these mechanisms whereas DILP5 should not. Based on this contrast, we note that the unique control of Cindr and CG6454 phosphorylation by DILP2 indicates potential roles for glucose uptake in cells as possible mechanisms by which DILP2 regulates GlyP dephosphorylation. This conclusion is consistent with the association of dilp2 with glucose metabolism compared with the association of dilp5 with protein metabolism (8, 30).
Studies in mammalian insulin/IGF signaling strive to fully understand how these similar ligands can activate varied signaling pathways through similar receptors to produce different phenotypes (19, 79). Furthermore, in humans, insulin and IGF can activate one another’s receptors, as well as IR/IGFR hybrid receptors (9). Consequently, insulin analogs for diabetes treatment can increase mitogenicity and risk of cancer, while manipulating IGF in the treatment of cancer can disrupt glucose homeostasis (91). We demonstrate that DILP2 and DILP5 regulate many parallel cell signaling events, but also uniquely control particular cellular processes to affect distinct organismal physiology. Remarkably, DILP2 uniquely represses GlyP activity, and activation of this enzyme is required for dilp2 mutants to fully extend longevity. Overall, we demonstrate that two related insulin-like ligands have the capacity to regulate unique traits through a single receptor. We propose that Drosophila DILPs bind InR with different kinetics to cause distinct conformational changes in the receptor and effector proteins, and this subsequently produces different signaling output. An explicit comparison of DILP2 and DILP5 receptor-binding kinetics and structures bound to InR will advance how we understand the mechanisms of insulin signaling bias.
Data Availability Statement
The RNA-Seq datasets generated and analyzed in this study can be found in the Gene Expression Omnibus submission GSE111560. The phosphoproteomic datasets generated and analyzed in this study have been deposited in the ProteomeXchange Consortium (http://proteomecentral.proteomexchange.org) via the PRIDE partner repository in the dataset submission PXD009240.
Author Contributions
SP and MT designed the experiments, interpreted results, and wrote the manuscript; SP and GK conducted the experiments; SP analyzed the data; MT, JW, and PM conceived the research; all the authors revised the manuscript.
Conflict of Interest Statement
PM is an external consultant to the Department of Stem Cell Research at Novo Nordisk A/S, 2760 Måløv, Denmark. The remaining authors declare that the research was conducted in the absence of any commercial or financial relationships that could be construed as a potential conflict of interest.
Acknowledgments
We thank Brown Genomics core for RNA-Seq analyses and Jason Wood for help with RNA-Seq bioinformatics analyses and sharing the pUAST vector. We thank the COBRE Center for Cancer Research Development, Proteomics Core Facility at Rhode Island Hospital, Rhode Island which provided the proteomics service. We also thank Philip Gruppuso for critical review of the manuscript and data and members of the Tatar lab for discussion.
Funding
SP, GK, and MT were supported by NIH R37 AG024360. SP was additionally supported by NIH T32 AG 41688-3 and by AFAR GR5290420. JW is an NHMRC (Australia) Principal Research Fellow (APP1117483). Research at the FINMH was also supported by the Victorian Government’s Operational Infrastructure Support Program.
Supplementary Material
The Supplementary Material for this article can be found online at https://www.frontiersin.org/articles/10.3389/fendo.2018.00245/full#supplementary-material.
Figure S1. DILP2 and DILP5 induce similar gene expression by RNA-Seq. (A) Venn Diagram of differentially expressed genes by DILP2 or DILP5 stimulation. (B) PCA plot reveals separation of DILP stimulation from controls and slight separation of DILP2 from DILP5. Volcano plots reveal that DILP2 (C) and DILP5 (D) both stimulate gene expression changes with strong significance but relatively small log2 fold changes. (E) Two differentially expressed genes unique to DILP2 stimulation from RNA-Seq were verified by q-RT-PCR from separate biological samples, n = 3, *p < 0.05, **p < 0.01.
Figure S2. DILP2 and DILP5 stimulate changes in phosphopeptide abundance by phosphoproteomics. (A–F) Volcano plots for phosphopeptides identified in DILP2 (A–C) or DILP5 (D–F) stimulation at the indicated time point. All conditions reveal large log2 fold change values (Log2(FC)) with small significance (Log(Q value)). (G–L) Inflection points were calculated from all phosphopeptide log2 fold changes for each stimulation condition. Dotted lines represent the inflection point y-values selected as cut-offs for fold-change thresholds.
References
1. Brogiolo W, Stocker H, Ikeya T, Rintelen F, Fernandez R, Hafen E. An evolutionarily conserved function of the Drosophila insulin receptor and insulin-like peptides in growth control. Curr Biol (2001) 11:213–21. doi:10.1016/S0960-9822(01)00068-9
2. Teleman AA. Molecular mechanisms of metabolic regulation by insulin in Drosophila. Biochem J (2010) 425:13–26. doi:10.1042/BJ20091181
3. Nässel DR, Vanden Broeck J. Insulin/IGF signaling in Drosophila and other insects: factors that regulate production, release and post-release action of the insulin-like peptides. Cell Mol Life Sci (2016) 73:271–90. doi:10.1007/s00018-015-2063-3
4. Taguchi A, White MF. Insulin-like signaling, nutrient homeostasis, and life span. Annu Rev Physiol (2008) 70:191–212. doi:10.1146/annurev.physiol.70.113006.100533
5. Baserga R, Peruzzi F, Reiss K. The IGF-1 receptor in cancer biology. Int J Cancer (2003) 107:873–7. doi:10.1002/ijc.11487
6. Tatar M, Kopelman A, Epstein D, Tu MP, Yin CM, Garofalo RS. A mutant Drosophila insulin receptor homolog that extends life-span and impairs neuroendocrine function. Science (2001) 292:107–10. doi:10.1126/science.1057987
7. Kenyon C, Chang J, Gensch E, Rudner A, Tabtiang R. A C. elegans mutant that lives twice as long as wild type. Nature (1993) 366:461–4. doi:10.1038/366461a0
8. Gronke S, Clarke DF, Broughton S, Andrews TD, Partridge L. Molecular evolution and functional characterization of Drosophila insulin-like peptides. PLoS Genet (2010) 6:e1000857. doi:10.1371/journal.pgen.1000857
9. Massoner P, Ladurner-Rennau M, Eder IE, Klocker H. Insulin-like growth factors and insulin control a multifunctional signalling network of significant importance in cancer. Br J Cancer (2010) 103:1479–84. doi:10.1038/sj.bjc.6605932
10. Garafolo RS. Genetic analysis of insulin signaling in Drosophila. Trends Endocrinol Metab (2002) 13:156–62. doi:10.1038/sj.bjc.6605932
11. Hwangbo DS, Gershman B, Tu MP, Palmer M, Tatar M. Drosophila dFOXO controls lifespan and regulates insulin signalling in brain and fat body. Nature (2004) 429:562–6. doi:10.1038/nature02549
12. Bohni R, Riesgo-Escovar J, Oldham S, Brogiolo W, Stocker H, Andruss BF, et al. Autonomous control of cell and organ size by CHICO, a Drosophila homolog of vertebrate IRS1-4. Cell (1999) 97:865–75. doi:10.1016/S0092-8674(00)80799-0
13. Slaidina M, Delanoue R, Gronke S, Partridge L, Leopold P. A Drosophila insulin-like peptide promotes growth during nonfeeding states. Dev Cell (2009) 17:874–84. doi:10.1016/j.devcel.2009.10.009
14. Okamoto N, Yamanaka N, Yagi Y, Nishida Y, Kataoka H, O’Connor MB, et al. A fat body-derived IGF-like peptide regulates postfeeding growth in Drosophila. Dev Cell (2009) 17:885–91. doi:10.1016/j.devcel.2009.10.008
15. Bai H, Kang P, Tatar M. Drosophila insulin-like peptide-6 (dilp6) expression from fat body extends lifespan and represses secretion of Drosophila insulin-like peptide-2 from the brain. Aging Cell (2012) 11:978–85. doi:10.1111/acel.12000
16. Broughton SJ, Slack C, Alic N, Metaxakis A, Bass TM, Driege Y, et al. DILP-producing median neurosecretory cells in the Drosophila brain mediate the response of lifespan to nutrition. Aging Cell (2010) 9:336–46. doi:10.1111/j.1474-9726.2010.00558.x
17. Varghese J, Lim SF, Cohen SM. Drosophila miR-14 regulates insulin production and metabolism through its target, sugarbabe. Genes Dev (2010) 24:2748–53. doi:10.1101/gad.1995910
18. Boucher J, Tseng YH, Kahn CR. Insulin and insulin-like growth factor-1 receptors act as ligand-specific amplitude modulators of a common pathway regulating gene transcription. J Biol Chem (2010) 285:17235–45. doi:10.1074/jbc.M110.118620
19. Versteyhe S, Klaproth B, Borup R, Palsgaard J, Jensen M, Gray SG, et al. IGF-I, IGF-II, and insulin stimulate different gene expression responses through binding to the IGF-I receptor. Front Endocrinol (2013) 4:98. doi:10.3389/fendo.2013.00098
20. Cieniewicz AM, Cooper PR, McGehee J, Lingham RB, Kihm AJ. Novel method demonstrates differential ligand activation and phosphatase-mediated deactivation of insulin receptor tyrosine-specific phosphorylation. Cell Signal (2016) 28:1037–47. doi:10.1016/j.cellsig.2016.05.001
21. Park B, Kido Y, Accili D. Differential signaling of insulin and IGF-1 receptors to glycogen synthesis in murine hepatocytes. Biochemistry (1999) 38:7517–23. doi:10.1021/bi9830718
22. Nakae J, Barr V, Accili D. Differential regulation of gene expression by insulin and IGF-1 receptors correlates with phosphorylation of a single amino acid residue in the forkhead transcription factor FKHR. EMBO J (2000) 19:989–96. doi:10.1093/emboj/19.5.989
23. Shymko RM, De Meyts P, Thomas R. Logical analysis of timing-dependent receptor signalling specificity: application to the insulin receptor metabolic and mitogenic signalling pathways. Biochem J (1997) 326:463–9. doi:10.1042/bj3260463
24. Shymko RM, Dumont E, De Meytz P, Dumont JE. Timing-dependence of insulin-receptor mitogenic versus metabolic signalling: a plausible model based on coincidence of hormone and effector binding. Biochem J (1999) 339:675–83. doi:10.1042/bj3390675675
25. Sciacca L, Cassarino MF, Genua M, Pandini G, Le Moli R, Squatrito S, et al. Insulin analogues differently activate insulin receptor isoforms and post-receptor signalling. Diabetologia (2010) 53:1743–53. doi:10.1007/s00125-010-1760-6
26. Hansen BF, Danielson GM, Drejer K, Sorensen AR, Wiberg FC, Klein HH, et al. Sustained signalling from the insulin receptor after stimulation with insulin analogues exhibiting increased mitogenic potency. Biochem J (1996) 315:271–9. doi:10.1042/bj3150271
27. Glendorf T, Knudsen L, Stidsen CE, Hansen BF, Hegelund AC, Sorensen AR, et al. Systematic evaluation of the metabolic to mitogenic potency ratio for B10-substituted insulin analogues. PLoS One (2012) 7:e29198. doi:10.1371/journal.pone.0029198
28. Kurtzhals P, Schaffer L, Sorensen A, Kristensen C, Jonassen I, Schmid C, et al. Correlations of receptor binding and metabolic and mitogenic potencies of insulin analogs designed for clinical use. Diabetes (2000) 49:999–1005. doi:10.2337/diabetes.49.6.999
29. van Lierop B, Ong SC, Belgi A, Delaine C, Andrikopoulos S, Haworth NL, et al. Insulin in motion: the A6-A11 disulfide bond allosterically modulates structural transitions required for insulin activity. Sci Rep (2017) 7:17239. doi:10.1038/s41598-017-16876-3
30. Broughton SJ, Piper MD, Ikeya T, Bass TM, Jacobson J, Driege Y, et al. Longer lifespan, altered metabolism, and stress resistance in Drosophila from ablation of cells making insulin-like ligands. Proc Natl Acad Sci U S A (2005) 102:3105–10. doi:10.1073/pnas.0405775102
31. Kannan K, Fridell YW. Functional implications of Drosophila insulin-like peptides in metabolism, aging, and dietary restriction. Front Physiol (2013) 4:288. doi:10.3389/fphys.2013.00288
32. Post S, Tatar M. Nutritional geometric profiles of insulin/IGF expression in Drosophila melanogaster. PLoS One (2016) 11:e0155628. doi:10.1371/journal.pone.0155628
33. Dombradi V, Matko J, Kiss Z, Kiss L, Friedrich P, Bot G. Structural and functional properties of Drosophila melanogaster phopshorylase: comparison with the rabbit skeletal muscle enzyme. Comp Biochem Physiol (1986) 84B:537–43.
34. Dombradi V, Devay P, Friedrich P, Bot G. Regulation of glycogen phosphorylase in Drosophila melanogaster by reversible phosphorylation-dephosphorylation. Insect Biochem (1986) 16:557–65. doi:10.1016/0020-1790(86)90033-8
35. Johnson LN, Barford D. Electrostatic effects in the control of glycogen phosphorylase by phosphorylation. Protein Sci (1994) 3:1726–30. doi:10.1002/pro.5560031011
36. Sajid W, Kulahin N, Schluckebier G, Ribel U, Henderson HR, Tatar M, et al. Structural and biological properties of the Drosophila insulin-like peptide 5 show evolutionary conservation. J Biol Chem (2011) 286:661–73. doi:10.1074/jbc.M110.156018
37. Lin F, Hossain MA, Post S, Karashchuk G, Tatar M, De Meyts P, et al. Total solid-phase synthesis of biologically active Drosophila insulin-like peptide 2 (DILP2). Aust J Chem (2017) 70:208. doi:10.1071/CH16626
38. Yu K, Salomon AR. PeptideDepot: flexible relational database for visual analysis of quantitative proteomic data and integration of existing protein information. Proteomics (2009) 9:5350–8. doi:10.1002/pmic.200900119
39. Yu K, Salomon AR. HTAPP: high-throughput autonomous proteomic pipeline. Proteomics (2010) 10:2113–22. doi:10.1002/pmic.200900159
40. Ahsan N, Belmont J, Chen Z, Clifton JG, Salomon AR. Highly reproducible improved label-free quantitative analysis of cellular phosphoproteome by optimization of LC-MS/MS gradient and analytical column construction. J Proteomics (2017) 165:69–74. doi:10.1016/j.jprot.2017.06.013
41. Elias JE, Gygi SP. Target-decoy search strategy for increased confidence in large-scale protein identifications by mass spectrometry. Nat Methods (2007) 4:207–14. doi:10.1038/nmeth1019
42. Yu K, Sabelli A, DeKeukelaere L, Park R, Sindi S, Gatsonis CA, et al. Integrated platform for manual and high-throughput statistical validation of tandem mass spectra. Proteomics (2009) 9:3115–25. doi:10.1002/pmic.200800899
43. Beausoleil SA, Villen J, Gerber SA, Rush J, Gygi SP. A probability-based approach for high-throughput protein phosphorylation analysis and site localization. Nat Biotechnol (2006) 24:1285–92. doi:10.1038/nbt1240
44. Demirkan G, Yu K, Boylan JM, Salomon AR, Gruppuso PA. Phosphoproteomic profiling of in vivo signaling in liver by the mammalian target of rapamycin complex 1 (mTORC1). PLoS One (2011) 6:e21729. doi:10.1371/journal.pone.0021729
45. Storey JD, Tibshirani R. Statistical significance for genomewide studies. Proc Natl Acad Sci U S A (2003) 100:9440–5. doi:10.1073/pnas.1530509100
46. Storey JD. The positive false discovery rate: a Bayesian interpretation of the q-value. Ann Stat (2003) 31:2013–35. doi:10.1214/aos/1074290335
47. Tennessen JM, Barry WE, Cox J, Thummel CS. Methods for studying metabolism in Drosophila. Methods (2014) 68:105–15. doi:10.1016/j.ymeth.2014.02.034
48. Zhang T, Wang S, Lin Y, Xu W, Ye D, Xiong Y, et al. Acetylation negatively regulates glycogen phosphorylase by recruiting protein phosphatase 1. Cell Metab (2012) 15:75–87. doi:10.1016/j.cmet.2011.12.005
49. Colombani J, Andersen DS, Leopold P. Secreted peptide Dilp8 coordinates Drosophila tissue growth with developmental timing. Science (2012) 336:582–5. doi:10.1126/science.1216689
50. Tanabe K, Itoh M, Tonoki A. Age-related changes in insulin-like signaling lead to intermediate-term memory impairment in Drosophila. Cell Rep (2017) 18:1598–605. doi:10.1016/j.celrep.2017.01.053
51. Seidah NG, Day R, Marcinkiewicz M, Chretien M. Precursor convertases: an evolutionary ancient, cell-specific, combinatorial mechanism yielding diverse bioactive peptides and proteins. Ann N Y Acad Sci (1998) 15:9–24. doi:10.1111/j.1749-6632.1998.tb10727.x
52. Pauls D, Chen J, Reiher W, Vanselow JT, Schlosser A, Kahnt J, et al. Peptidomics and processing of regulatory peptides in the fruit fly Drosophila. EuPA Open Proteomics (2014) 3:114–27. doi:10.1016/j.euprot.2014.02.007
53. Bai H, Kang P, Hernandez AM, Tatar M. Activin signaling targeted by insulin/dFOXO regulates aging and muscle proteostasis in Drosophila. PLoS Genet (2013) 9:e1003941. doi:10.1371/journal.pgen.1003941
54. Puig O, Marr MT, Ruhf ML, Tjian R. Control of cell number by Drosophila FOXO: downstream and feedback regulation of the insulin receptor pathway. Genes Dev (2003) 17:2006–20. doi:10.1101/gad.1098703
55. Webb AE, Kundaje A, Brunet A. Characterization of the direct targets of FOXO transcription factors throughout evolution. Aging Cell (2016) 15:673–85. doi:10.1111/acel.12479
56. Kermorgant S, Parker PJ. c-Met signalling: spatiotemporal decisions. Cell Cycle (2005) 4:352–5. doi:10.4161/cc.4.3.1596
57. Sadowski L, Pilecka I, Miaczynska M. Signaling from endosomes: location makes a difference. Exp Cell Res (2009) 315:1601–9. doi:10.1016/j.yexcr.2008.09.021
58. Vinayagam A, Kulkarni MM, Sopko R, Sun X, Hu Y, Nand A, et al. An integrative analysis of the InR/PI3K/Akt network identifies the dynamic response to insulin signaling. Cell Rep (2016) 16:3062–74. doi:10.1016/j.celrep.2016.08.029
59. Humphrey SJ, Yang G, Yang P, Fazakerley DJ, Stockli J, Yang JY, et al. Dynamic adipocyte phosphoproteome reveals that Akt directly regulates mTORC2. Cell Metab (2013) 17:1009–20. doi:10.1016/j.cmet.2013.04.010
60. Chen RQ, Yang QK, Lu BW, Yi W, Cantin G, Chen YL, et al. CDC25B mediates rapamycin-induced oncogenic responses in cancer cells. Cancer Res (2009) 69:2663–8. doi:10.1158/0008-5472.CAN-08-3222
61. Maddaiah VT, Madsen NB. Kinetics of purified liver phosphorylase. J Biol Chem (1966) 241:3873–81.
62. Gomez-Foix AM, Coats WS, Baque S, Alam T, Gerard RD, Newgard CB. Adenovirus-mediated transfer of the muscle glycogen phosphorylase gene into hepatocytes confers altered regulation of glycogen metabolism. J Biol Chem (1992) 267:25129–34.
63. Gusarov I, Pani B, Gautier L, Smolentseva O, Eremina S, Shamovsky I, et al. Glycogen controls Caenorhabditis elegans lifespan and resistance to oxidative stress. Nat Commun (2017) 8:15868. doi:10.1038/ncomms15868
64. Favre C, Aguilar PS, Carrillo MC. Oxidative stress and chronological aging in glycogen-phosphorylase-deleted yeast. Free Radic Biol Med (2008) 45:1446–56. doi:10.1016/j.freeradbiomed.2008.08.021
65. Agius L. Role of glycogen phosphorylase in liver glycogen metabolism. Mol Aspects Med (2015) 46:34–45. doi:10.1016/j.mam.2015.09.002
66. Stewart CEH, Rotwein P. Growth, differentiation, and survival: multiple physiological functions for insulin-like growth factors. Physiol Rev (1996) 76:1005–26. doi:10.1152/physrev.1996.76.4.1005
67. Colombani J, Andersen DS, Boulan L, Boone E, Romero N, Virolle V, et al. Drosophila Lgr3 couples organ growth with maturation and ensures developmental stability. Curr Biol (2015) 25:2723–9. doi:10.1016/j.cub.2015.09.020
68. De Meyts P. Insulin/receptor binding: the last piece of the puzzle? What recent progress on the structure of the insulin/receptor complex tells us (or not) about negative cooperativity and activation. BioEssays: news and reviews in molecular. Cell Dev Biol (2015) 37:389–97. doi:10.1002/bies.201400190
69. De Meyts P, Van Obberghen E, Roth J. Mapping of the residues responsible for the negative cooperativity of the receptor-binding region of insulin. Nature (1978) 273:504–9. doi:10.1038/273504a0
70. Shoelson S, Haneda M, Blix P, Nanjo A, Sanke T, Inouye K, et al. Three mutant insulins in man. Nature (1983) 302:540–3. doi:10.1038/302540a0
71. Xu B, Hu S, Chu Y, Wang S, Wang R, Nakagawa SH, et al. Diabetes-associated mutations in insulin identify invariant receptor contacts. Diabetes (2004) 53:1599–602. doi:10.2337/diabetes.53.6.1599
72. Honegger B, Galic M, Kohler K, Wittwer F, Brogiolo W, Hafen E, et al. Imp-L2, a putative homolog of vertebrate IGF-binding protein 7, counteracts insulin signaling in Drosophila and is essential for starvation resistance. J Biol (2008) 7:10. doi:10.1186/jbiol72
73. Arquier N, Geminard C, Bourouis M, Jarretou G, Honegger B, Paix A, et al. Drosophila ALS regulates growth and metabolism through functional interaction with insulin-like peptides. Cell Metab (2008) 7:333–8. doi:10.1016/j.cmet.2008.02.003
74. Okamoto N, Nakamori R, Murai T, Yamauchi Y, Masuda A, Nishimura T. A secreted decoy of InR antagonizes insulin/IGF signaling to restrict body growth in Drosophila. Genes Dev (2013) 27:87–97. doi:10.1101/gad.204479.112
75. Ness J. Insulin-like growth factor I, but not neurotrophin-3, sustains Akt activation and provides long-term protection of immature oligodendrocytes from glutamate-mediated apoptosis. Mol Cell Neurosci (2002) 20:476–88. doi:10.1006/mcne.2002.1149
76. Romanelli RJ, LeBeau AP, Fulmer CG, Lazzarino DA, Hochberg A, Wood TL. Insulin-like growth factor type-I receptor internalization and recycling mediate the sustained phosphorylation of Akt. J Biol Chem (2007) 282:22513–24. doi:10.1074/jbc.M704309200
77. Freed DM, Bessman NJ, Kiyatkin A, Salazar-Cavazos E, Byrne PO, Moore JO, et al. EGFR ligands differentially stabilize receptor dimers to specify signaling kinetics. Cell (2017) 171:683–95.e18. doi:10.1016/j.cell.2017.09.017
78. Ceresa BP, Kao AW, Santeler SR, Pessin JE. Inhibition of clathrin-mediated endocytosis selectively attenuates specific insulin receptor signal transduction pathways. Mol Cell Biol (1998) 18:3862–70. doi:10.1128/MCB.18.7.3862
79. Siddle K. Molecular basis of signaling specificity of insulin and IGF receptors: neglected corners and recent advances. Front Endocrinol (2012) 3:34. doi:10.3389/fendo.2012.00034
80. Li CR, Guo D, Pick L. Independent signaling by Drosophila insulin receptor for axon guidance and growth. Front Physiol (2013) 4:385. doi:10.3389/fphys.2013.00385
81. Humphrey SJ, Azimifar SB, Mann M. High-throughput phosphoproteomics reveals in vivo insulin signaling dynamics. Nat Biotechnol (2015) 33:990–5. doi:10.1038/nbt.3327
82. Quinones GA, Jin J, Oro AE. I-BAR protein antagonism of endocytosis mediates directional sensing during guided cell migration. J Cell Biol (2010) 189:353–67. doi:10.1083/jcb.200910136
83. Xie X, Gong Z, Mansuy-Aubert V, Zhou QL, Tatulian SA, Sehrt D, et al. C2 domain-containing phosphoprotein CDP138 regulates GLUT4 insertion into the plasma membrane. Cell Metab (2011) 14:378–89. doi:10.1016/j.cmet.2011.06.015
84. Gramates LS, Marygold SJ, Santos GD, Urbano JM, Antonazzo G, Matthews BB, et al. FlyBase at 25: looking to the future. Nucleic Acids Res (2017) 45:D663–71. doi:10.1093/nar/gkw1016
85. Baque S, Guinovart JJ, Gomez-Foix AM. Overexpression of muscle glycogen phosphorylase in cultured human muscle fibers causes increased glucose consumption and nonoxidative disposal. J Biol Chem (1995) 271:2594–8. doi:10.1074/jbc.271.5.2594
86. McBride A, Ghilagaber S, Nikolaev A, Hardie DG. The glycogen-binding domain on the AMPK beta subunit allows the kinase to act as a glycogen sensor. Cell Metab (2009) 9:23–34. doi:10.1016/j.cmet.2008.11.008
87. Storey KB. Biochemical adaptation for cold hardiness in insects. Phil Trans R Soc Lond B (1990) 326:635–54. doi:10.1098/rstb.1990.0036
88. Tatar M, Yin CM. Slow aging during insect reproductive diapause: why butterflies, grasshoppers and flies are like worms. Exp Gerontol (2001) 36:723–38. doi:10.1016/S0531-5565(00)00238-2
89. Kucerova L, Kubrak OI, Bengtsson JM, Strnad H, Nylin S, Theopold U, et al. Slowed aging during reproductive dormancy is reflected in genome-wide transcriptome changes in Drosophila melanogaster. BMC Genomics (2016) 17:50. doi:10.1186/s12864-016-2383-1
90. Petersen MC, Vatner DF, Shulman GI. Regulation of hepatic glucose metabolism in health and disease. Nat Rev Endocrinol (2017) 13:572–87. doi:10.1038/nrendo.2017.80
Keywords: insulin, IGF, Drosophila insulin-like peptides, glycogen phosphorylase, glycogen, metabolism, aging, signaling bias
Citation: Post S, Karashchuk G, Wade JD, Sajid W, De Meyts P and Tatar M (2018) Drosophila Insulin-Like Peptides DILP2 and DILP5 Differentially Stimulate Cell Signaling and Glycogen Phosphorylase to Regulate Longevity. Front. Endocrinol. 9:245. doi: 10.3389/fendo.2018.00245
Received: 19 March 2018; Accepted: 02 May 2018;
Published: 28 May 2018
Edited by:
Ian Orchard, University of Toronto Mississauga, CanadaReviewed by:
Gert Jansen, Erasmus University Rotterdam, NetherlandsLeslie Pick, University of Maryland, College Park, United States
Copyright: © 2018 Post, Karashchuk, Wade, Sajid, De Meyts and Tatar. This is an open-access article distributed under the terms of the Creative Commons Attribution License (CC BY). The use, distribution or reproduction in other forums is permitted, provided the original author(s) and the copyright owner are credited and that the original publication in this journal is cited, in accordance with accepted academic practice. No use, distribution or reproduction is permitted which does not comply with these terms.
*Correspondence: Stephanie Post, stephanie_post@brown.edu;
Marc Tatar, marc_tatar@brown.edu