A Global Comparison of Scientific Mobility and Collaboration According to National Scientific Capacities
 Zaida Chinchilla-Rodríguez1,2*
  Lili Miao2
  Dakota Murray2
  Nicolás Robinson-García3
  Rodrigo Costas4,5
  Cassidy R. Sugimoto2,4
- 1Departamento de Ciencia e Innovación, Instituto de Políticas y Bienes Públicos, Consejo Superior de Investigaciones Científicas, Madrid, Spain
- 2School of Informatics, Computing, and Engineering, Indiana University Bloomington, Bloomington, IN, United States
- 3School of Public Policy, Georgia Institute of Technology, Atlanta, GA, United States
- 4Centre for Science and Technology Studies, Leiden University, Leiden, Netherlands
- 5DST-NRF Centre of Excellence in Scientometrics and Science, Technology and Innovation Policy, Stellenbosch University, Stellenbosch, South Africa
This study compares the flows of mobile researchers and the number of publications in international collaboration within the context of scientific and economic capacities. The goal is to identify the convergence or discrepancy of countries in mobility and collaboration and determine the positions and relative influence of countries in both processes. Using affiliation data from scientific publications, we analyze the distributions and networks of collaboration and mobility and their structural differences. The results show that there is a significant relationship between the flow of mobile researchers and the capacity for publishing with foreign partners in the more prolific countries, although mobility is always lower than collaboration. Size matters and scientific relationship are highly resource-dependent. Advanced and Proficient countries accumulate the highest proportion of the mobile authors and international publications with an extremely low representation of mobility in Developing and Lagging countries. In addition, the placement of countries is not always consistent in both networks, revealing distinct roles of mobility and collaboration, with particular instability for lower income countries. The more resources available in a country (both scientific and economic) the greater the likelihood of attracting foreign partners and mobilizing human capital. The policy relevance of these structural differences are described and a brief description of the limitations and future research are provided.
Introduction
Science is an increasingly global activity (Adams et al., 2014). Due to the globalization of the scientific labor market, many countries are implementing policies promoting scientific collaboration and mobility as a means to “internationalize” their scientific system (Organization for Economic Cooperation Development, 2008; European Commission, 2012; Jacob and Meek, 2013; Wagner et al., 2018). It has been argued that international collaboration fosters high-quality knowledge production (Royal Society, 2011) and is necessary to solve complex scientific problems (Sonnenwald, 2007). The benefits accrued from increased internationalization include enhanced productivity (Beaver, 2001) and increased citation (Glanzel, 2001; Gazni et al., 2012). Collaboration for mutual benefit has also gained increasing acceptance, with “partner” selection becoming a strategic priority to enhance one's own production (Chinchilla-Rodríguez et al., 2018a). Collaborative partnerships have been shown to be a product of self-organizing networks, in which coauthorships are determined through preferential attachment to high impact and highly visible authors (Wagner and Leydesdorff, 2005). Collaboration is also influenced by socio-political factors, such as relative size; geographical, historical, linguistic, and thematic proximity; and other socio-economic characteristics (Zitt et al., 2000; Adams et al., 2014; Finardi and Buratti, 2016; Chinchilla-Rodríguez et al., 2018b).
Intimately related with collaboration is the phenomenon of mobility (Abramo et al., 2011). International exchanges of scientists between countries strengthen their scientific capacity and benefit the scientific careers of individual researchers. Mobility has been advocated as key to increasing the efficiency and effectiveness of research (Organization for Economic Cooperation Development, 2008; Scellato et al., 2015) and nations that welcome international researchers and encourage cross-border collaboration tend to produce papers with higher scientific impact (Sugimoto et al., 2017; Wagner and Jonkers, 2017). Most analyses focus on the economic and development impact caused by mobility (Gibson and McKenzie, 2012), while a limited few have utilized bibliometric approaches to study scientific mobility at a large-scale (Moed and Halevi, 2014; Sugimoto et al., 2016; Robinson-Garcia et al., 2018).
Furthermore, no study to-date has compared, at scale, differences between scientific networks created through collaboration and mobility. While these two phenomena are related, little is known regarding the relationship between networks created through mobility flows and scientific collaboration, as well as the scientific relationships within, and among countries of various scientific capacities. Whereas, the analysis of collaboration and mobility usually focuses on more advanced countries (e.g., those included in OECD surveys), many countries fall outside this taxonomy and are understudied. To better comprehend the dynamics of the global system of science we must move to a more comprehensive analysis. Furthermore, we must take into account not only a single lens—typically, collaboration—but study other mechanisms whereby countries establish ties with one another.
The main goal of this study is not only to inform on the position of countries with regard to these two phenomena, but also to better comprehend the relationship between scientific mobility and collaboration. Scientific collaboration and mobility can be viewed as a communications network (Wagner and Leydesdorff, 2005). Using these data as parts of a network structure, we can test whether the structural analysis of their differences and similarities provides an alternative view to better understand the dynamics and intensity of knowledge and human flow. Governments are becoming increasingly concerned with occupying an advantageous position in the global scientific market (Jacob and Meek, 2013). By analyzing the attributions of the nodes in determining country's roles, we can observe convergence or discrepancies in collaboration and mobility networks. These data can inform science policy and the allocation of resources. By understanding potential asymmetries between mobility and collaboration, science policy makers can incentivize and support particularly fruitful partnerships among countries.
Objectives
This study compares the flows of mobile researchers and the number of publications in international collaboration taking into account scientific and economic capacities. The goal is to identify the convergence or discrepancy of countries in mobility and collaboration and determine the relative importance or influence of countries in both processes. We focus on four main research aims:
1. To describe the relationships between percentage of mobile researchers in a country and percentage of internationally co-authored publications (examining variation by scientific and economic capacities).
2. To describe the relationships between the number of countries with which a country has collaborative publications and the number of countries with which that same country has mobility partnerships (examining variation in scientific and economic capacities).
3. To identify differences in the structure of collaboration and mobility networks at the global level.
4. To identify the differences in rank according to mobility and collaboration by countries, grouped by scientific capacity.
We hypothesize that the more resources available in a country (both scientific and economic) the greater the likelihood of attracting foreign partners and mobilizing human capital. We anticipate, therefore, that the main collaboration partners for all groups will be the most scientifically advanced countries. Identifying structural differences is informative in defining research agendas by policy decision-makers.
Data and Methods
Collaboration and Mobility Data
Web of Science was used as the sampling frame for this analysis. We examined all document types and limited to the 13,699,176 distinct documents published between 2008 and 2015. Document metadata was used to extract author affiliation data for each document. These data allowed for the construction of networks on the basis of collaboration (i.e., co-authorship between countries on a given document) and mobility (affiliations held by a single individual either within or across documents). Reprint affiliations were included for both collaboration and mobility data. Within the document set, 20% were the result of international collaborations (n = 2,718,556). The construction of the mobility networks was dependent on preprocessing of the data, utilizing the author disambiguation algorithm developed by Caron and van Eck (2014) and the operationalization of mobility as defined by Robinson-Garcia et al. (2018). In short, countries are linked when an individual has been affiliated with both countries (simultaneously or independently) during the 2008–2015 time period. The dataset was comprised of 15,931,847 disambiguated authors, 595,891 of which were affiliated with more than one country (3.7%).
Country Data
We aggregated the data at the country level using two different classifications. The Scientific and Technological Capacity Index was used as a proxy of scientific capacities (Wagner et al., 2001). This index splits 150 countries into four groups: Advanced (22); Proficient (24); Developing (22), and Lagging (80). In this study, we have added a fifth group called “Others” which was comprised of the 66 countries that were not included in the original classification. For a more comprehensive coverage of countries, we also added the income level group define by the World Bank as a proxy of wealth intensity of countries (World Bank, 2016), which classifies countries in five groups: high income (64); upper middle income (56); lower middle income (52); low income (31); and others (7). These two classifications do not have to be coincident because the first one uses a combination of indicators, among which the income level is included. For example, Kuwait and Saudi Arabia are high-income level but they are classified as Developing and Lagging countries respectively.
Indicators
For each grouping, we analyze affiliated documents and researchers using full counting methods. Our subject of study are the international relationships constructed through mobility and collaboration and the discrepancies between these partnerships. We observe the volume of contacts created by scientists, considering a contact as a link that always has the same value between any two (or more) countries, regardless of the number of participants (Okubo et al., 1992). It can be argued that international collaboration and mobility should be considered as an achievement on both sides, and should thus be honored with a full point (full counting) (Park et al., 2016). Using fractional counting, the two dimensions of connectivity can be considered as a zero-sum game with a negative effect of internationalization on the performance of collaboration and mobility programs thus measured (Leydesdorff, 1988). Therefore, full counts were used to identify the total number of publications per country, total number of mobile researchers per country, number of international publications, number of mobile researchers per country, percentage of publication in international collaboration (% international collaboration), percentage of individuals linked to countries (% mobile authors), number of countries involved in collaboration (#collaboration countries), and number of countries involved in mobility (#mobility countries) (Table 1). The last four indicators were calculated at the global level as well as within each group (i.e., Advanced, Proficient, Developing, and Lagging). For simplicity, we present only the comparative percentages of collaboration and mobility. For example, 27% of the publications from the US are internationally co-authored and 6.7% of researchers in the US were affiliated with more than one country. This would be presented as (27–6.7%). In a similar way, the United States collaborates with 211 countries and has mobile authors associated with 202 countries. This is presented as (211–202).
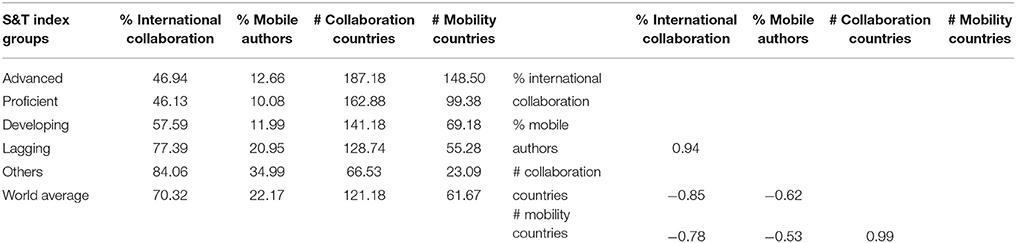
Table 1. Mean average of mobile authors and international publications, and number of countries in collaboration and mobility (left), Pearson coefficient (right).
Network Analysis
We use network analysis to comparatively understand these two dimensions of connectivity. This approach allows us to see global properties in contrast with bibliometric indicators and statistical analyses based only on national collaboration and mobility. We obtained co-occurrence frequencies and generated undirected and unweighted matrices to derive statistical properties of the networks as described by (Chinchilla-Rodríguez et al., 2017). The following classical network measures were employed:
• Betweeness: For a given node, the fraction of the shortest paths among the whole network that passes through the node (Freeman, 1978).
• Density: For a given network, the degree of cohesion that exists among the nodes, revealing whether the network has a thick or thin consistency (Wasserman and Faust, 1999).
• Average degree: Measure of the spread of influence across a given network by summing all degrees and then divided by the total number of nodes in the network (Hanneman and Riddle, 2005).
• Diameter: For a given network, the longest distance between two nodes (De Nooy et al., 2011).
• Clustering coefficient: The proportion of the number of links in the neighborhood of a node and the number of links possible in the entire network (Watts and Strogatz, 1998; Barabási et al., 2002). We use the corrected clustering coefficient that considers two neighborhoods instead of one to avoid nodes with a low degree and highest clustering coefficient (Batagelj and Mrvar, 2011).
• Assortativity: Tendency of nodes to connect to other nodes to a similar degree; measured using the Pearson correlation coefficient of degree between pairs of linked nodes (Newman, 2002).
Results
Collaboration and Mobility Distributions
Figure 1 shows the correlation between the share of mobile scholars and percentage of internationally co-authored papers. There is a moderate relationship between the percentage of publications in international collaboration and the share of mobile researchers overall (Figure 1A). However, there is a strong size-dependence in the relationship: the more prolific countries (i.e., those with more than 1,000 publications in international collaboration) show a significant relationship (R2 = 0.77) between the percent of mobile researchers and the percent of international collaborations (Figure 1C). This is in stark contrast to those countries with <1,000 publications in international collaboration (R2 = 0.12). These countries have lower levels of scientific capacity, high degrees of international collaboration, and high variance in terms of the proportion of mobile authors (Figure 1D). On the other hand, there is a strong relationship (R2 = 0.92) at the global level between the number of countries with which a country is engaged in collaborative publications (degree), and the number of countries with which a country has established mobility links, where the Advanced countries head the ranking of international relationships (Figure 1B).
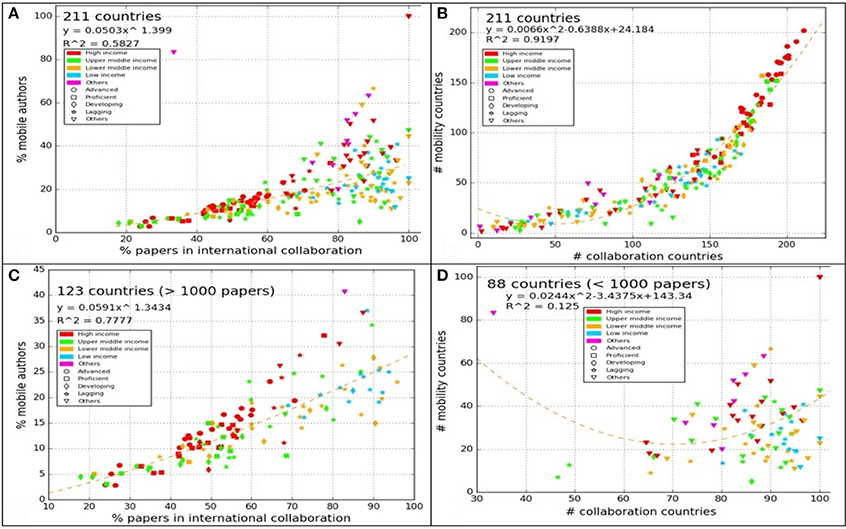
Figure 1. Correlation between percentage of mobile authors and percentage of internationally co-authored publications for (A) all countries, (C) more prolific countries (more than 1,000 papers) (D) less prolific countries (<1,000 papers), and (B) number of countries with which a country has established mobility links by the number of countries with which that country has collaboration co-authored publications.
To further explore the mechanisms underlying international mobility and collaboration, Table 1 shows the mean average for the indicators (left) and the correlations (right) for the four groups according to their S&T index (Wagner et al., 2001). (Figure S1 provides these distributions, fitting the model for each group). On average, Proficient countries have the lowest proportion of mobile authors (10%), in contrast to Lagging (21 %), and “other” (34%) countries. The trends are reversed in terms of collaboration. Proficient and Advanced countries collaborate to a lesser extent than Developing, Lagging, and others: while proficient and Advanced countries publish less than half of their production with international partners, the strong majority of publications (57–84%) from countries with lower scientific capacities are written in international collaborations. However, collaborations take place with fewer countries than for Advanced countries, showing a negative correlation between the share of international papers and the number of collaborating countries (r = −0.8) and, to a lesser extent (r = −0.5), for mobility relationships.
In all cases, the number of countries with which a country has mobility relationships is fewer than the number of countries with collaborative partnerships (Table 1-left). Advanced countries have mobility with 70% of potential collaboration partners, Proficient countries with 47% of collaborating countries, Developing countries with 33%, Lagging countries with 26%, and the “other” category with only 11% of countries. Although the countries in collaboration and in mobility might not be coincident in each group, this suggests that size matters as well as the scientific capacities of countries in reaching partners. This may explain the high correlation (r = 0.94) between the percentage of international papers and mobile authors (Table 1-right). The smaller the country, the more dependence is demonstrated by both mobility and collaboration; whereas, the lower rates of mobility and collaboration of Advanced countries may provide evidence of their autonomy and capacity to retain human capital.
Considering as a unit of analysis all the possible mobile authors at the worldwide level (column Total-Mobility), Table 2 provides a description of the proportion of partnerships between groups of countries. As shown, there is a preference for Advanced countries among all country types, for both mobility, and collaboration. This is relatively true for Proficient countries as well, though there is also some degree of affinity for partnerships between Developing and Lagging countries. The Lagging countries tend to share researchers among them in 13 and 14.6% respectively.
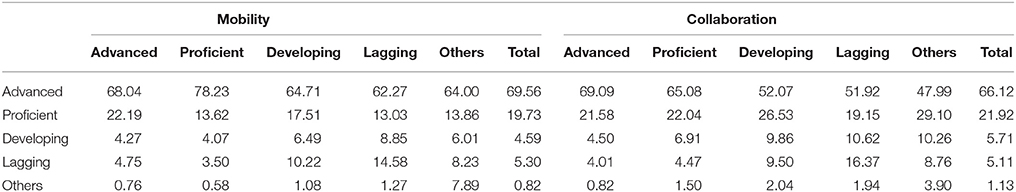
Table 2. Distributions of international collaboration and mobility according to the S&T Capacity Index.
Group-Specific Analysis
Despite the within-group preferences, the patterns of international collaboration and mobility present large variations within groups. Figure 2 show the position of countries according to four indicators (Table 1 -left side). In each figure, we provide the distributions of percentages of papers in international collaboration (x-axis) and of mobile authors (y-axis), and the number of countries involved in collaboration (x-axis) and in mobility (y-axis) in the right. The central axes show the mean average of percentages and number of countries in each group.
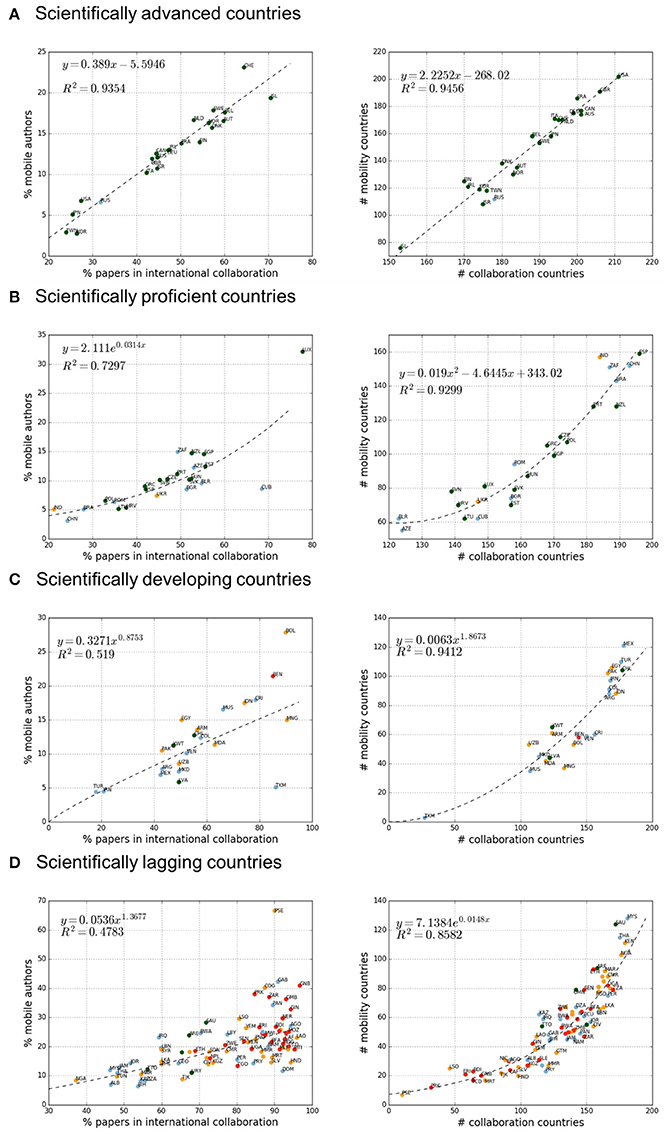
Figure 2. Share (left) and number of countries (right) in international mobility and in collaboration among (A) Advanced, (B) Proficient, (C) Developing, and (D) Lagging countries. Colors refer to income level: Green: high; Blue: upper-middle; Orange: low-middle; Red: low; Pink: others.
In the group of Advanced countries, the percentage of mobility ranges between 2.8 and 23%, and in collaboration between 24 and 70% (Figure 2A-left). Switzerland and Iceland show the highest percentages in mobility and collaboration, along with the Nordic countries, Belgium, and Austria, although the proportions are quite different (always lower in mobility than in collaboration). Close to the average are Ireland, Germany, Canada, Australia, and France; whereas, Taiwan, South Korea, and Japan show the lowest shares in both dimensions, followed by Russia and the United States. However, the USA collaborates and has mobile researchers with the maximum number of countries (Figure 2A-right), followed by the UK. The positions of Japan and Italy deserve mention: these countries partner with a high number of countries in spite of their relatively low percentages (especially for Japan), in contrast with Iceland, Ireland, and Israel. Russia is the only country with upper-middle income among the scientifically advanced countries, with all of the rest at a high-income level.
We observe strong differences (of more than 40%) between rates of collaboration and mobility for some European countries (i.e., Iceland, Austria, Belgium, Denmark, and Switzerland). This demonstrates that these countries are publishing with foreign partners to a much higher degree than they share mobile researchers. Stronger relationships between rates of collaboration and mobility are observed in the US, Japan, Taiwan, and South Korea. In the number of countries, larger variations (more than 66 countries) show that less balanced positions take place in Iceland, Israel, and Russia. Countries with a more symmetrical relation between their collaboration and mobility patterns include the US, France, United Kingdom, Italy, Canada, and Germany.
For Proficient countries, the variety of income level increases and the number of partner countries decreases. Excluding Luxembourg (which has the highest shares in both dimensions) and Cuba (with the highest shares in collaboration), the share of mobile scholars ranges between 3 and 15%, and between 21 and 60% in the case of co-authored publications. The biggest countries (in terms of publications), such as India and China, show the lowest shares of mobility and collaboration along with Brazil (all of them classified as emergent countries under the acronym of BRICS). However, South Africa (one of the BRICS countries) has larger shares in both dimensions, surpassing the average of the group, along with Singapore and New Zealand (with the highest shares of publications in international collaboration). Countries positioned below average come mostly from South and Eastern Europe, with the exception of Spain and Greece.
The large variations (more than 40%) in the percentage between international collaboration and mobility are generally in: Cuba, Singapore, and some small European countries such as Luxembourg and Eastern European countries (Belarus, Estonia, Bulgaria, Hungary, Slovakia, Azerbaijan); whereas, the lesser differences (<25%) are in India, China and Brazil. While in the number of countries, the large variations (more than 75 countries) are in Eastern European countries. On the other hand, the most balanced countries in the number of countries partners (around 40 countries of difference) are India, South Africa, Spain, and China.
In the group of Developing countries, there are only three countries with high-income levels (Chile, Kuwait, and Latvia), ten with upper-middle income, eight with low-middle income and Benin (low-income level), mostly formed by Latin-American and Middle East countries. Shares of publications and mobile authors are more dispersed than for previous groups, with values in mobility ranging between 4.5 and 28%, and between 18 and 90% for collaboration. We observe different patterns by countries. For instance, Turkey and Iran show the lowest percentages of collaboration and mobility, but they partner with a relatively high number of countries. Mexico, Turkey, Egypt, Chile, and Pakistan collaborate and have mobility links with more than 100 countries. Iran, Colombia, Indonesia, and Argentina, are also above average in both dimensions, in contrast to Costa Rica, Venezuela, Benin, and Bolivia that collaborate with more than 140 countries but only have mobility with 60 countries. Regarding the values of percentages, the biggest differences (more than 60%) are observed in Turkmenistan, Mongolia, Benin, Bolivia, and Costa Rica.
The Lagging group shows the highest number of countries (80) and the biggest dispersion in all indicators and by income level. Only five countries are classified as having a high-income level (Saudi Arabia, United Arab Emirates, Oman, Uruguay, and Trinidad and Tobago). Twenty-one countries have an upper middle income level, 29 have low middle income, and 25 have a low-income level. This group is mostly composed by African (40), Asian (14), Latin American (13), and Middle East (9) countries, plus one from the Pacific Region. The share of mobile scholars ranges between 6.5 and 67%, and between 37 and 77% for collaboration. Nigeria shows the lowest percentage of international collaboration, whereas, Bosnia-Herzegovina and Albania are lowest in mobility. Regarding the number of partners, Malaysia, Saudi Arabia, Thailand, Kenya, and Nigeria collaborate with more than 180 countries and their mobile scholars are linked to more than 100 countries. This group of countries has the largest variations in rankings, demonstrating a high distinction between international collaboration and mobility.
Network Analysis
Table 3 displays a set of basic structural indicators to analyze the structural properties of the collaboration and mobility networks. The number of countries linked to other countries is the same in both networks. The number of edges denotes the number of ties between countries, where there is a significant difference between the two networks, thus reflected in the density, and average degree. Density allows us to determine the degree of cohesion that exists among the nodes, revealing whether the network has a thick or thin consistency and the extent of connectivity among nations (Wasserman and Faust, 1999). The average degree measures the spread of influence across the networks (Hanneman and Riddle, 2005). Larger figures are expected in the collaboration network, in comparison with the mobility network, as international coauthorship tends to be more frequent than international mobility.
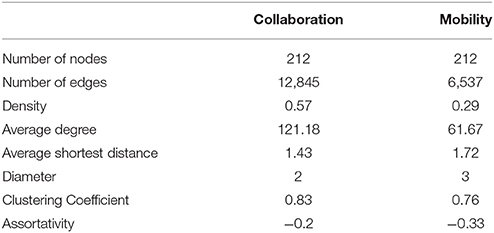
Table 3. A summary of the topological statistics of the two networks.
Our results show that, at the international level, the collaboration network has a higher density than the mobility network. This suggests that countries collaborate internationally to a much higher degree than they exchange human capital. A similar pattern is observed in the number of countries with which a country connects (average degree). Nodes in the collaboration network have two times higher average degree than nodes in the mobility network. Partially, these results are in accordance with the extent and growth of the international collaboration network analyzed by Wagner et al. (2015) where they demonstrated that global co-authorship networks are highly interconnected with most nations connected to all other nations by some path (probably many paths) of intermediate coauthors. In the comparison of collaboration and mobility networks, the average shortest distance varies slightly. It implies that both networks are cohesively connected.
However, distinct differences are observed according to the diameter of each network. The diameter measures the longest distance between a pair of countries (De Nooy et al., 2011). Its low value in the collaboration network suggests that the network is tightly linked together. However, in the case of mobility networks, the diameter is equal to 3, which means that the steps are bigger, and the two networks are structurally different.
These structural differences can be measured and supported by the clustering coefficient that indicates how dense the relations in the realm of collaboration and mobility of a given node are. The clustering coefficient is high in both networks, which shows that both networks formed tightly knit groups, but the slightly higher rates in collaboration suggest that two countries who have common neighbor would have a little bit higher possibility to collaborate than having common mobile researchers. To a certain extent, both networks are characterized by a high level of local clustering and a small average number of steps between actors, which fits with the model of the small world defined by Watts and Strogatz (1998). Negative values of assortativity indicate that countries with small degrees tend to connect with countries with higher degrees in both networks, which mean that less advanced countries tend to collaborate and/or have mobile researchers with other more scientifically advanced countries. This heterogeneous phenomenon is more significant in the mobility network than in the collaboration network.
Although leading research economies tend to attract more researchers in terms of collaborative papers and mobility, the results suggest that there are complex patterns of knowledge circulation. The representation of the two networks also displays interesting drivers that reveal affinities between different economies based on linguistic, historical as well as political and cultural linkages. In both networks, collaboration (Figure 3) and mobility (Figure 4), the geographical proximity is one of the first observations in the topology of the network. Linguistic and cultural relationships can also be observed: such as the connection between France and former colonies, the relationship between former Yugoslavian countries, and other European countries, and the affinities between Spain and Latin American countries. While advanced countries occupy the center, there are notable places of prominence for countries such as India, Taiwan, Singapore, Malaysia, and South Africa—countries which have engaged in policies and practices that encourage international partnerships.
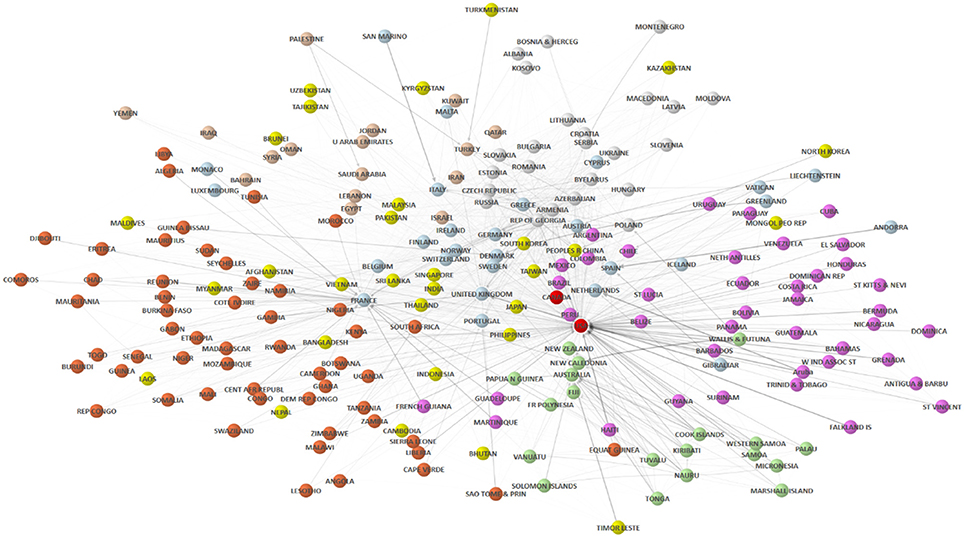
Figure 3. Network of international collaboration.
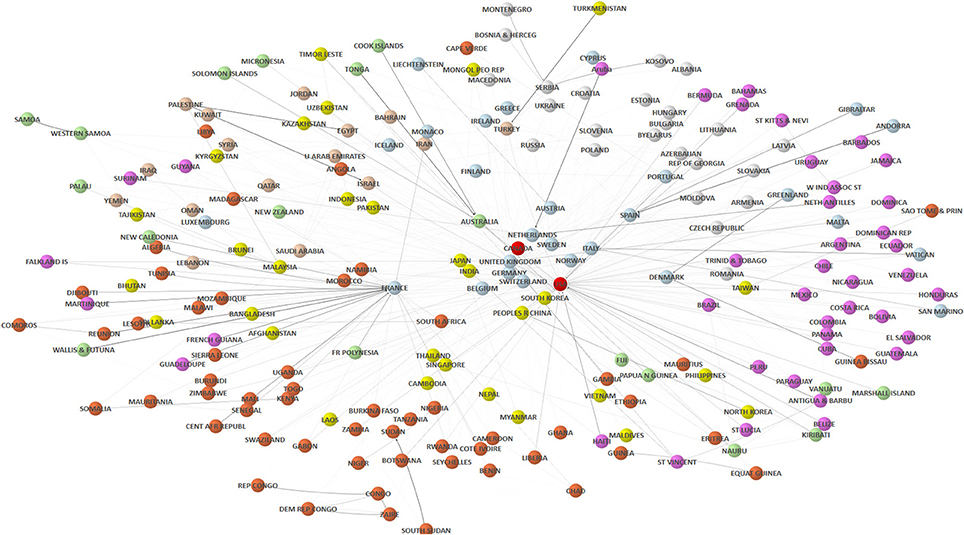
Figure 4. Network of international mobility.
The Role of Countries in Collaboration and Mobility Networks by Group
To study the attributions of the nodes in determining countries' roles, we analyzed, and compared classical measures of network centrality, specifically betweenness and the clustering coefficient as measures of knowledge transfer and of cohesion. We excluded the analysis of closeness due to their high relationship with the degree centrality (Table S1), analyzed in previous figures. The following (Figures 5–8), grouped according to their scientific and technological capacities, show the difference between the betweenness (left) and the clustering coefficient (right) for each group in the two networks and their position in relation to the group and in the worldwide ranking. Countries are labeled by their ranks in both networks, for example, in betweenness, Switzerland (8) (10) means that Switzerland ranks the 8th position in the collaboration network and the 10th in the mobility network. For each indicator, the left panel shows the ranking in collaboration network and the right one, the ranking in the mobility network. In addition, we provide the values of these indicators in Table S2.
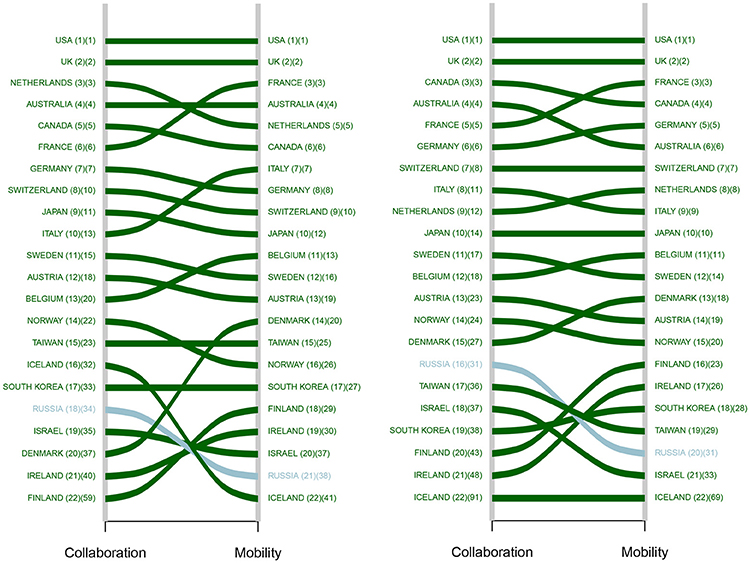
Figure 5. Betweenness and clustering coefficient for advanced countries. The colors of lines represent the income levels of countries: green represents high-income countries; blue represents upper-middle.
The main characteristic of the group of Advanced countries (Figure 5) is their stability in the ranking of each indicator, which indicates they have relatively similar abilities to both establish collaboration and mobility linkages. Notable deviations are observed with Russia and, to a lesser extent, Canada, Sweden, and Norway, all of which are ranked higher in collaboration than in mobility.
Among the group of Proficient countries (Figure 6), the positions fluctuate moderately, with some more extreme differences between the rankings. For example, India and Slovenia both see higher rankings in mobility than collaboration. New Zealand and Estonia, on the other hand, are ranked much higher in collaboration than mobility. However, this group of countries begins to show some of the instability between the measurements: the rankings and difference between mobility and collaboration are often inverted when comparing between results obtained by betweenness centrality and the clustering coefficient.
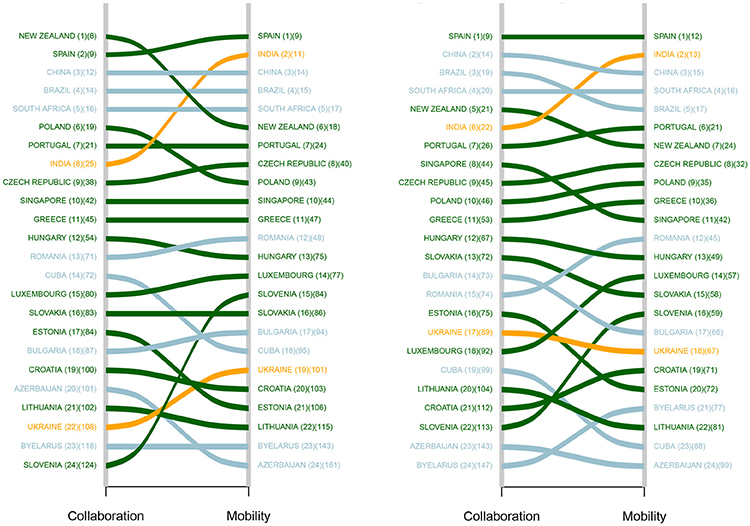
Figure 6. Betweenness and clustering coefficient for Proficient countries. The colors of lines represent the income levels of countries: green represents high-income countries; blue represents upper-middle income countries; orange represents lower-middle income countries and red represents low-income countries.
An increasing amount of difference between collaboration and mobility can be observed among Developing countries (Figure 7). Mexico, Turkey, Chile, and Indonesia are the most central on both lists. Chile presents more collaboration than mobility; whereas, Turkey is more prone to mobility than collaboration (in relative terms). Egypt, Kuwait, and Armenia have higher ranks in betweenness in mobility, which suggests that they have stronger roles in linking researchers to foreign institutions than in collaboration with foreign countries. Another striking case is Pakistan, which ranks among the top positions by the clustering coefficient in the mobility network while in the lowest position in betweenness, suggesting that it forms a relatively tight collaboration relationship with its partners compared with other countries in this group, but it has not an important role as a bridge in the network.
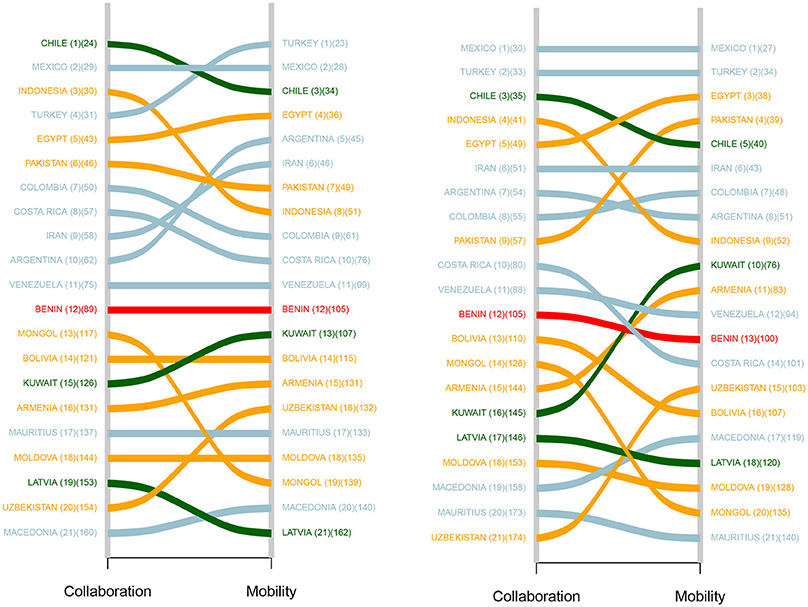
Figure 7. Betweenness and clustering coefficient for Developing countries. The colors of lines represent the income levels of countries: green represents high-income countries; blue represents upper-middle income countries; orange represents lower-middle income countries and red represents low-income countries.
The group of Lagging countries is the most numerous (80 countries) and for visualization purposes, we only show the top 30 for each indicator, which explains the lack of correspondence among the appearance of countries (Figure 8). Saudi Arabia and the United Arab Emirates (two of the higher income countries) both show stronger rankings in mobility than collaboration. Kenya and Nigeria are stronger in terms of collaboration. In general, many countries' position changes dramatically which indicates their positions and roles in collaboration network are vastly different from the mobility network. The rank of positions in clustering coefficient reveals that smaller and lowest income level countries form tightly relationship with their partners, despite the position change dramatically in collaboration and in mobility network.
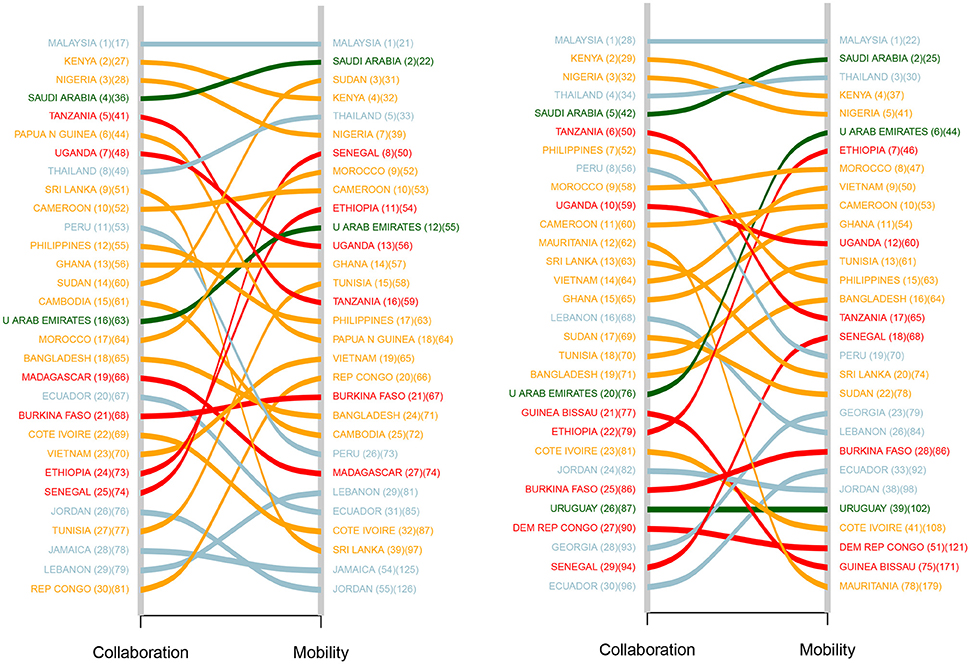
Figure 8. Betweenness and clustering coefficient for Lagging countries. The colors of lines represent the income levels of countries: green represents high-income countries; blue represents upper-middle income countries; orange represents lower-middle income countries and red represents low-income countries.
Discussion
This work presents a preliminary comparison of the diversity and complexity in establishing international relationships in terms of collaborative papers and the flow of mobile researchers. The results show that there is a significant relationship between the flow of mobile researchers and the capacity for publishing with foreign partners in the more prolific countries. The number of countries in collaboration and mobility is significantly related and it is expected that the increase (or decrease) of countries with mobility will be proportional to that in the number in international collaboration.
Size matters and scientific relationship are highly resource-dependent. In general, the more countries differ in scientific size, the larger the difference in relative terms (Luukkonen et al., 1993). Less developed countries present the highest ratios of collaboration and as opposed to the most advanced ones. However, the Advanced and Proficient countries accumulated more than 70% of mobile authors and international publications with an extremely low representation of mobility in Developing and Lagging countries. This could be explained by some political actions. Policies such as the European framework programs and Marie Curie grants have helped to promote collaboration, institutionalize mobility with the objective of spreading skills, and create regional and international scientific networks of different generations of researchers. This is in keeping with the aims of the European Union, which seeks to open the world1 by requiring international collaboration between researchers in different EU Member States (European Commission, 2012), although they are also open to other non-EU Member States through Science & Technology agreements2. There is also increasing evidence to suggest that many emerging economies are imitating the EU models in this regard (Jacob and Meek, 2013). Developing and Lagging countries may be using regional collaboration as a means to improve their national scientific infrastructure whilst still not having access to elite networks formed by Advanced and Proficient countries (Woolley et al., 2017).
To a certain extent, both networks are characterized by a high level of local clustering and a small average number of steps between actors. In all cases, mobility is lower than collaboration. Advanced countries serve as the main partners, especially for Proficient, and Developing countries, while the Lagging countries tend to share mobile researchers among themselves. These findings fit partly with previous studies that observed that about 77% of students enrolled outside their country were enrolled in OECD countries, with only five countries (Australia, France, Germany, the UK and USA) enrolling more than 50% of all foreign countries in 2008 (Organization for Economic Cooperation Development, 2010). Although other destinations such as Latin America, Oceania, and Asia are increasingly growing since 2005 (Organization for Economic Cooperation Development, 2012). Other studies noted that most scientific articles in low-income countries and lower-middle-income countries were the fruit of international collaborations, in contrast with high-income countries (UNESCO, 2015).
From a policy perspective, the increased interest in international collaboration and mobility as a route to building research capacity in countries in all income brackets has become imperative to understand the formation and maintenance of knowledge/research networks (Jacob and Meek, 2013). At the same time, the possibilities to reach foreigner partners depends on the policies and capacities of countries. To this end, the distribution of the number of partners in collaboration and mobility could be an important variable in determining the extent to which the internationalization process takes place among a different set of countries or to reveal the gap between those countries that have a high presence in one dimension and low in the other one. The discrepancy between collaboration and mobility could be an indicator of potential opportunities for scientific mobility programs. Our results show that despite the low volume of international publications and mobile researchers for many countries, the number of countries reached is relatively high, while in other countries there exist a huge disparity between collaboration and mobility. That could provide evidence for creating scientific mobility programs with those countries with a high proportion of collaboration but a low proportion of mobility.
Governments are becoming increasingly concerned—for economic and political purposes—with occupying an advantageous position in the international knowledge market (Jacob and Meek, 2013). However, a country's position is not always consistent in both networks, revealing that roles of countries in terms of collaboration and mobility may differ. Where stability between the networks exists, it is mostly associated with high-income countries, while upper-middle, lower middle, and low-income countries are more likely change positions. Unlike countries in the Advanced group that function as hub nodes, the role of Lagging countries is unstable in both networks. However, the stability of a small subset of countries as bridge nodes, not belonging to the core of the Advanced ones, such as India, Malaysia, Turkey and South Korea, builds stronger connections in the mobility network. That could be interpreted as that their relational capacities and some political actions encouraging internationalization and mobility allow them to reach countries more advanced that can have benefited them through the access to resources and knowledge diffusion. These capacities rely on the attractiveness as a partner, the infrastructure, and the policies among funding agencies to allowing their grants to move across borders may be part of the explanation that in the mobility network is spread around the world, especially in the case of Malaysia and South Korea (UNESCO, 2015). We also confirm the important role of Kenya and Nigeria, as noted in previous studies relating to collaboration networks (Adams et al., 2014).
Limitations and Further Research
This analysis serves as a foundation for developing future analysis, where we will seek to overcome some of the limitations, and respond to other important questions related to the capacities and influences of countries in networking science. For example, the analysis of mobility in Web of Science has an inflationary effect on the traditional measurements of collaboration based on affiliations creating some overlaps when we are comparing collaboration and mobility. There is a major general limitation of collaboration analysis based on author affiliations and further analysis should be done to minimize this effect (Hottenrott and Lawson, 2017). Therefore, we will complement our analysis with a time component, allowing us to analyze the evolving relationships between countries and explore how these more fine-grained temporal networks compare to the entire network presented here. At the methodological level, approaches with different counting methods (Park et al., 2016; Perianes-Rodriguez et al., 2016) will be analyzed to calibrate the effect of attributing coauthored publications as a full publication to each country or rather proportionally, as well as for exploring the results of weighted networks. Future work should also seek to update the classification of countries by capacities and extend to various levels of analysis.
We will explore different approaches to community detection in networks to identify the core and groups of vertices having the highest probability of holding a great deal of influence over the organization of the periphery of the network, as well as the generation of directed networks. We plan to analyze not just mobility, but also leadership, including changes in the positions that authors occupy in the bylines of co-authorship, their impact, the institutional reputation of destinations, and the capacity to develop or reinforce thematic research into their institutions and countries. In addition, the analysis of other factors that would influence the mobility and collaboration of researchers such as cultural, linguistic, and geographical proximities will be analyzed.
Finally, one of the limitations of connectivity relationship lies in the heterogeneous contexts of developing research and establishing partnerships in each country that bias performance and capacity. However, our analysis aims to provide a more nuanced picture by considering distinct scientific capacities and phases of development demonstrating the potential utility of combining collaboration and mobility indicators to identify and calibrate the balance in the position the countries. This empirical analysis is necessary to construct a more robust framework to better support the assessment of different scientific systems (Moed, 2016) and will be useful for science policy analysts and decision-makers seeking to invest in programs that will foster mobility and international partnerships.
Author Contributions
ZC-R: conceived of the study, participated in its design and coordination, and drafted the manuscript; LM: generated figures; DM: generated figures; NR-G: gathered and standardized data from source and helped draft the manuscript; RC: gathered data from source, generated mobility indicators, and helped draft the manuscript; CS: participated in its design and helped draft the manuscript. All authors read and approved the final manuscript.
Conflict of Interest Statement
The authors declare that the research was conducted in the absence of any commercial or financial relationships that could be construed as a potential conflict of interest.
Acknowledgments
Financial support from Mobility Program Salvador de Madariaga 2016 (PR2016-00479) and State Programme of Research, Development and Innovation oriented to the Challenges of the Society (Ref. CSO2014-57770-R) funded by the Ministry of Economy and Competitiveness of Spain, the Science of Science Innovation and Policy program of the National Science Foundation in the United States (NSF #1561299), and the South African DST-NRF Centre of Excellence in Scientometrics and Science, Technology and Innovation Policy (SciSTIP) is also acknowledged.
Supplementary Material
The Supplementary Material for this article can be found online at: https://www.frontiersin.org/articles/10.3389/frma.2018.00017/full#supplementary-material
Footnotes
1. ^European Commission. Policy framework: The policies underpinning international cooperation in research and innovation. http://ec.europa.eu/research/iscp/index.cfm?pg=policy
2. ^Countries with EU International agreements on Science and technology.
References
Abramo, G., D'Angelo, C. A., and Solazzi, M. (2011). The relationship between scientists' research performance and the degree of internationalization of their research. Scientometrics 86, 629–643. doi: 10.1007/s11192-010-0284-7
Adams, J., Gurney, K., Hook, D., and Leydesdorff, L. (2014). International collaboration clusters in Africa. Scientometrics 98, 547–556. doi: 10.1007/s11192-013-1060-2
Barabási, A. L., Jeong, H., Néda, Z., Ravasz, E., Schubert, A., and Vicsek, T. (2002). Evolution of the social network of scientific collaborations. Physica A 311, 590–614. doi: 10.1016/S0378-4371(02)00736-7
Batagelj, V., and Mrvar, A. (2011). Pajek. Program for Analysis and Visualization of Large Networks. Available online at: http://vlado.fmf.uni-lj.si/pub/networks/pajek/doc/pajekman.pdf (Accessed December 1, 2016).
Beaver, D. D. (2001). Reflections on scientific collaboration (and its study): past, present and future. Scientometrics 52, 365–377. doi: 10.1023/A:1014254214337
Caron, E., and van Eck, N. J. (2014). “Large-scale author name disambiguation using rule-based scoring and clustering,” in Proceedings of the 19th International Conference on Science and Technology Indicators (Leiden), 79–86.
Chinchilla-Rodríguez, Z., Miao, L., Murray, D., Robinson-García, N., Costas, R., and Sugimoto, C. R. (2017). “Networks of international collaboration and mobility: a comparative study,” in Proceedings of the 16th International Conference on Scientometrics & Informetrics, ISSI 2017. Wuhan.
Chinchilla-Rodríguez, Z., Miguel, S., Perianes-Rodríguez, A., and Sugimoto, C. R. (2018a). Dependencies and autonomy in research performance: examining nanoscience and nanotechnology in emerging countries. Scientometrics. doi: 10.1007/s11192-018-2652-7. [Epub ahead of print].
Chinchilla-Rodríguez, Z., Bu, Y., Robinson-García, N., Costas, R., and Sugimoto, C. R. (2018b). Travel bans and scientific mobility: utility of asymmetry and affinity indexes to inform science policy. Scientometrics 1–22. doi: 10.1007/s11192-018-2738-2
De Nooy, W., Mrvar, A., and Batagelj, V. (2011). Exploratory Social Network Analysis with Pajek. Cambridge: Cambridge University Press.
European Commission (2012). Enhancing and focusing EU International Cooperation in Research and Innovation: a Strategic Approach. Brussels, COM (2012) 497 final. Available online at: http://ec.europa.eu/research/iscp/pdf/policy/com_2012_497_communication_from_commission_to_inst_en.pdf#view=fit&pagemode=none
Finardi, U., and Buratti, A. (2016). Scientific collaboration framework of BRICS countries: an analysis of international co-authorship. Scientometrics 109, 433–446. doi: 10.1007/s11192-016-1927-0
Freeman, L. C. (1978). Centrality in social networks conceptual clarification. Soc. Networks 1, 215–239. doi: 10.1016/0378-8733(78)90021-7
Gazni, A., Sugimoto, C. R., and Didegah, F. (2012). Mapping world scientific collaboration: authors, institutions, and countries. J. Am. Soc. Inform. Sci. Technol. 63, 323–335 doi: 10.1002/asi.21688
Gibson, J., and McKenzie, D. (2012). The economic consequences of “Brain Drain” of the best and brightest: microeconomic evidence from five countries. Econ. J. 122, 339–375. doi: 10.1111/j.1468-0297.2012.02498.x
Glanzel, W. (2001). National characteristics in international scientific co-authorship relations. Scientometrics 51, 69–115 doi: 10.1023/A:1010512628145
Hanneman, R. A., and Riddle, M. (2005). Introduction to Social Network Methods. Riverside, CA: University of Riverside.
Hottenrott, H., and Lawson, C. (2017). A first look at multiple institutional affiliations: a study of authors in Germany, Japan and the UK. Scientometrics 111, 285–295 doi: 10.1007/s11192-017-2257-6
Jacob, M., and Meek, L. (2013). Scientific mobility and international research networks: trends and policy tools for promoting research excellence and capacity building. Stud. High. Educ. 38, 331–334. doi: 10.1080/03075079.2013.773789
Leydesdorff, L. (1988). Problems with the ‘measurement’ of national scientific performance. Sci. Public Policy 15, 149–152
Luukkonen, T., Tijssen, R. J. W., Persson, O., and Sivertsen, G. (1993). The measurement of international scientific collaboration. Scientometrics 28, 15–36. doi: 10.1007/BF02016282
Moed, H. F. (2016). Iran's scientific dominance and the emergence of South-East Asian countries in the Arab Gulf Region. Scientometrics 108, 305–314. doi: 10.1007/s11192-016-1946-x
Moed, H., and Halevi, G. (2014). A bibliometric approach to tracking international scientific migration. Scientometrics 101, 1987–2001. doi: 10.1007/s11192-014-1307-6
Newman, M. E. J. (2002). Assortative mixing in networks. Phys. Rev. Lett. 89:208701 doi: 10.1103/PhysRevLett.89.208701
Organization for Economic Cooperation and Development, OECD. (2008). The Global Competition for Talent: Mobility of the Highly Skilled. OECD Publications.
Organization for Economic Cooperation and Development, OECD. (2010). Education at a Glance 2010. Paris: OECD.
Organization for Economic Cooperation and Development, OECD. (2012). How many students study abroad and where do they go? In Education at a glance 2012. Paris: OECD Publishing.
Okubo, Y., Miquel, J. F., Frigoletto, L., and Doré, J. C. (1992). Structure of international collaboration in science: typology of countries through multivariate techniques using a link indicator. Scientometrics 25, 321–351 doi: 10.1007/BF02028090
Park, H. W., Yoon, J., and Leydesdorff, L. (2016). The normalization of co-authorship networks in the bibliometric evaluation: the government stimulation programs of China and Korea. Scientometrics 109, 1017–1036 doi: 10.1007/s11192-016-1978-2
Perianes-Rodriguez, A., Waltman, L., and Van Eck, N. J. (2016). Constructing bibliometric networks: a comparison between full and fractional counting. J. Inform. 10, 1178–1195. doi: 10.1016/j.joi.2016.10.006
Robinson-Garcia, N., Sugimoto, C. R., Murray, D., Yegros-Yegros, A., Larivière, V., and Costas, R. (2018). The Many Faces of Mobility: Using Bibliometric Data to Track Scientific Exchanges. arxiv:1803.03449 [Cs]. Available online at: http://arxiv.org/abs/1803.03449
Royal Society (2011). Knowledge, Networks and Nations: Global Scientific Collaboration in the 21st Century. London: Elsevier.
Scellato, G., Franzoni, C., and Stephan, P. (2015). Migrant's scientists and international networks. Res. Policy 44, 108–120. doi: 10.1016/j.respol.2014.07.014
Sonnenwald, D. H. (2007). Scientific collaboration. Ann. Rev. Inform. Sci. Technol. 41, 643–681 doi: 10.1002/aris.2007.1440410121
Sugimoto, C. R., Robinson-Garcia, N., and Costas, R. (2016). “Towards a global scientific brain: indicators of researcher mobility using co-affiliation data,” in OECD Blue Sky III Forum on Science and Innovation Indicators, Ghent. Available online at: http://arxiv.org/abs/1609.06499
Sugimoto, C. R., Robinson-García, N., Murray, D. R., Yegros-Yegros, A., Costas, R., and Lariviere, V. (2017). Scientists have most impact when they are free to move. Nature 32, 29–31 doi: 10.1038/550029a
Wagner, C., and Leydesdorff, L. (2005). Network structure, self-organization, and the growth of international collaboration in science. Res. Policy 34, 1608–1618 doi: 10.1016/j.respol.2005.08.002
Wagner, C. S., Brahmakulam, I., Jackson, B., Wong, A., and Yoda, T. (2001). Science and Technology Collaboration: Building Capacities in Developing Countries. Santa Monica, CA: RAND.
Wagner, C. S., and Jonkers, K. (2017). Open countries have strong science. Nature 32, 32–33 doi: 10.1038/550032a
Wagner, C. S., Park, H. W., and Leydesdorff, L. (2015). The continuing growth of global cooperation networks in research: a conundrum for national governments. PLoS ONE 10:e0131816. doi: 10.1371/journal.pone.0131816
Wagner, C., Whetsell, T., Baas, J., and Jonkers, K. (2018). Openness and impact of leading scientific countries. Front. Res. Anal. doi: 10.3389/frma.2018.00010
Wasserman, S., and Faust, K. (1999). Social Network Analysis Methods and Applications. Cambridge: Cambridge University Press.
Watts, D. J., and Strogatz, S. H. (1998). Collective dynamics of'small-world' networks. Nature 393, 440–442.
Woolley, R., Robinson-Garcia, N., and Costas, R. (2017). Global research collaboration: Networks and Partners in South East Asia. ArXiv:1712.06513 [Cs]. Available online at: http://arxiv.org/abs/1712.06513
World Bank (2016). World Development Indicators. Available online at. http://wdi.worldbank.org/tables/ on Oct 26, 2016.
Keywords: scholarly communication, mobility, international collaboration, scientific capacity, science policy, research and development
Citation: Chinchilla-Rodríguez Z, Miao L, Murray D, Robinson-García N, Costas R and Sugimoto CR (2018) A Global Comparison of Scientific Mobility and Collaboration According to National Scientific Capacities. Front. Res. Metr. Anal. 3:17. doi: 10.3389/frma.2018.00017
Received: 14 January 2018; Accepted: 25 April 2018;
Published: 23 May 2018.
Edited by:
Loet Leydesdorff, University of Amsterdam, NetherlandsReviewed by:
Jonathan Adams, King's College London, United KingdomKoen Jonkers, European Commission, Luxembourg
Copyright © 2018 Chinchilla-Rodríguez, Miao, Murray, Robinson-García, Costas and Sugimoto. This is an open-access article distributed under the terms of the Creative Commons Attribution License (CC BY). The use, distribution or reproduction in other forums is permitted, provided the original author(s) and the copyright owner are credited and that the original publication in this journal is cited, in accordance with accepted academic practice. No use, distribution or reproduction is permitted which does not comply with these terms.
*Correspondence: Zaida Chinchilla-Rodríguez, zaida.chinchilla@csic.es