
Designing a floor plan using aircraft seat comfort knowledge by aircraft interior experts
Abstract
BACKGROUND:
Recent research indicated that an 18′′ ×30′′ aircraft seat resulted in nearly the same level of comfort as a 17′′ ×34′′ seat. However, it took less space in the floor plan.
OBJECTIVES:
This study explores seat layouts preferred by experts regarding different criteria. Those results of the experts are later compared to layouts produced by computational algorithms to evaluate the advantages of each method.
METHODS:
Eighty-eight experts in the field of aircraft interior were invited to make a floor plan of a part of a Boeing 777 aircraft where comfort was one of the main goals. Participants worked in groups of 3 and are given the freedom to design a section of the cabin between economy and first-class (5.87 m wide and 3.7 m long), where besides these two types of seats, an old business-class size seat of 20′′ ×36′′ was introduced as well for more flexibilities in design. Computational algorithms were also applied with the same inputs and constraints to generate layouts as a comparison.
RESULTS:
In total, 29 floor-plans were made, and these plans were analysed to compare against the complexity of the operations, the number of passengers on board, the revenue of the airline, and the width of the aisle. Results showed that 14 groups opted for the economy seats, while the rest utilized a hybrid setup where the business class seats were used in the configuration. These results are compared to the 126 computerized layouts generated.
CONCLUSIONS:
Among all layouts designed by experts, a combination of 28 18′′ ×30′′ seats and 20 17′′ ×34′′ seats had the highest potential revenue of US$21,984. This floor plan fits the regulations with an aisle width of 0.93 m. The computerized layout had a better outcome in maximizing profit of US$22,416 with 32 18′′ ×30′′ seats and 16 20′′ ×36′′ seats. However, the comfort of such results was to be explored as some seats were rotated 90 degrees.
1Introduction
The airline industry is a competitive market where passengers demand comfort at a low price. Airlines are adding different comfort features in order to be chosen by customers, but they also need to maintain a certain level of revenues for a sustainable business. Therefore, between choices of offering maximum comfort to all passengers and making this an upgrade service feature, most airlines opt to the latter option, especially the low-cost carriers (LCCs) as 1) the fares are low regardless of their service quality; and 2) by adding additional features, LCCs can get a revenue stream of 8–13% from service features [1]. Furthermore, this upgrade feature is also recommended for full-service carriers (FSCs), as it will affect passenger choice by giving an option to increase comfort for passengers who are willing to pay more [2].
Additional seat space is one of the highlighted upgrade features that is offered by airlines. Some airlines choose to provide longer seat pitches throughout their economy class, while others have a special class between business and economy, usually called premium economy. This class is placed in-between business class and economy with various labels e.g. Premium Economy, Elite Class, Economy Comfort, Economy Comfort, Club Economy, or Premium [3]. Airlines also have various dimensions for their seat space in this class. Lee and Luengo-Prado [4] found that having a larger seat space only for this in-between class more profitable for the airline. This is because not all customers were willing to pay more for upgraded legroom, as the price was the first selection criteria for most aeroplane passengers [5]. Such premium economy concept was also seen as an additional revenue stream for long-haul LCCs since 4–6% of passengers were willing to upgrade their standard seat to a seat with extra space e.g. seats located at exit doors or at bulkheads for € 25–30 [1], which is a primary factor for passengers to opt for premium economy [6]. Espino et al. [7] also found that passengers flying for 2.5–3 hours were even willing to pay € 38 for this extra seat space. This willingness to upgrade to economy plus class increased for medium-haul flights and was even higher for long-haul flights [6]. Moreover, researchers also identified that the demands for the premium economy class had grown quickly, causing several airlines expanding the size of this cabin [8].
Anjani et al. [9] found that comfort increases when increasing seat pitch. This study was later compared to increased comfort when extending seat width of 1 inch [10]. Comparison of the results indicated that increasing the width by 1 inch increases comfort more than increasing the pitch by 2 inches, though both require the same additional space in the floor plan. And for reaching the same level of the comfort score of this additional 1 inch in width, 4-inch-increase in pitch direction is needed. Meanwhile, passengers were willing to pay an additional € 22 for 1.5 extra inches of seat pitch and € 29 for 3 to 6 extra inches of seat width from the basic 17-inch-wide 28-inch-pitch seat for a 4.5–5.5 hour flight, though these additions correlated negatively meaning that they were not willing to pay for both additions simultaneously [11]. Joen and Lee [12] also did a willingness-to-pay study for premium economy passengers travelling from Korea and found that passengers are willing to pay US$15.5, US$48.1 and US$114.0 for increased seat pitch or US$24.4, US$61.6 and US$144.4 for increased seat width for short-haul, medium-haul and long-haul flights, respectively. It is worth mentioning that passengers also said this might differ from really buying the extras.
Experts in the field usually will make the decision to choose between layouts. The knowledge and experience of these people is a worthwhile input for the management team’s decision. Besides the scientific discoveries mentioned, experts who design the floor plan should also consider the complexity of the operations, the number of passengers on boards, the revenue of the airline, and aviation regulations (e.g. aisle width). All of these contribute to the complexity of designing the floor plan and selecting the types of seats for the premium economy class. On the other hand, advanced computational algorithms could optimize this layout which might be a better option. This leads to the research questions of this paper: 1) Which seat layout is more preferred by experts for the economy class in their view? 2) Which choice is more beneficial? And 3) How are the results of the seat layout by experts compared to the layout produced by the computational algorithms?
2Literature review
For airlines, it is important to differentiate from other airlines also within the cabin [13]. One way of differentiating is adding premium economy or just a good economy class. In the assignment, the good economy class is described and, in this literature, review the focus is on premium economy class. Premium economy class was introduced to prevent business passengers from downgrading too much and giving an option to high-income leisure passengers to upgrade [8]. It provides a choice as an answer to most passenger dissatisfaction, which is seat comfort and legroom, luggage/flight disruptions and staff behaviours which occur in both LCCs and FSCs [14]. Moreover, Kim and Lee [15] found that intention to repurchase of premium economy passengers will increase when they think premium economy service is well worth experiencing, where perceived service quality (e.g. in-flight service, wide and comfortable seats, and overall service quality) has the highest impact. The demand for the premium economy class in 2019 has increased from 2014 for all international markets, where an airline could charge at least 80% more of the cost of economy, and even four times higher for several routes [16]. Furthermore, domestic airlines in the United States of America are actively adding a premium economy class to their fleet after discovering its revenue-generating potential [17].
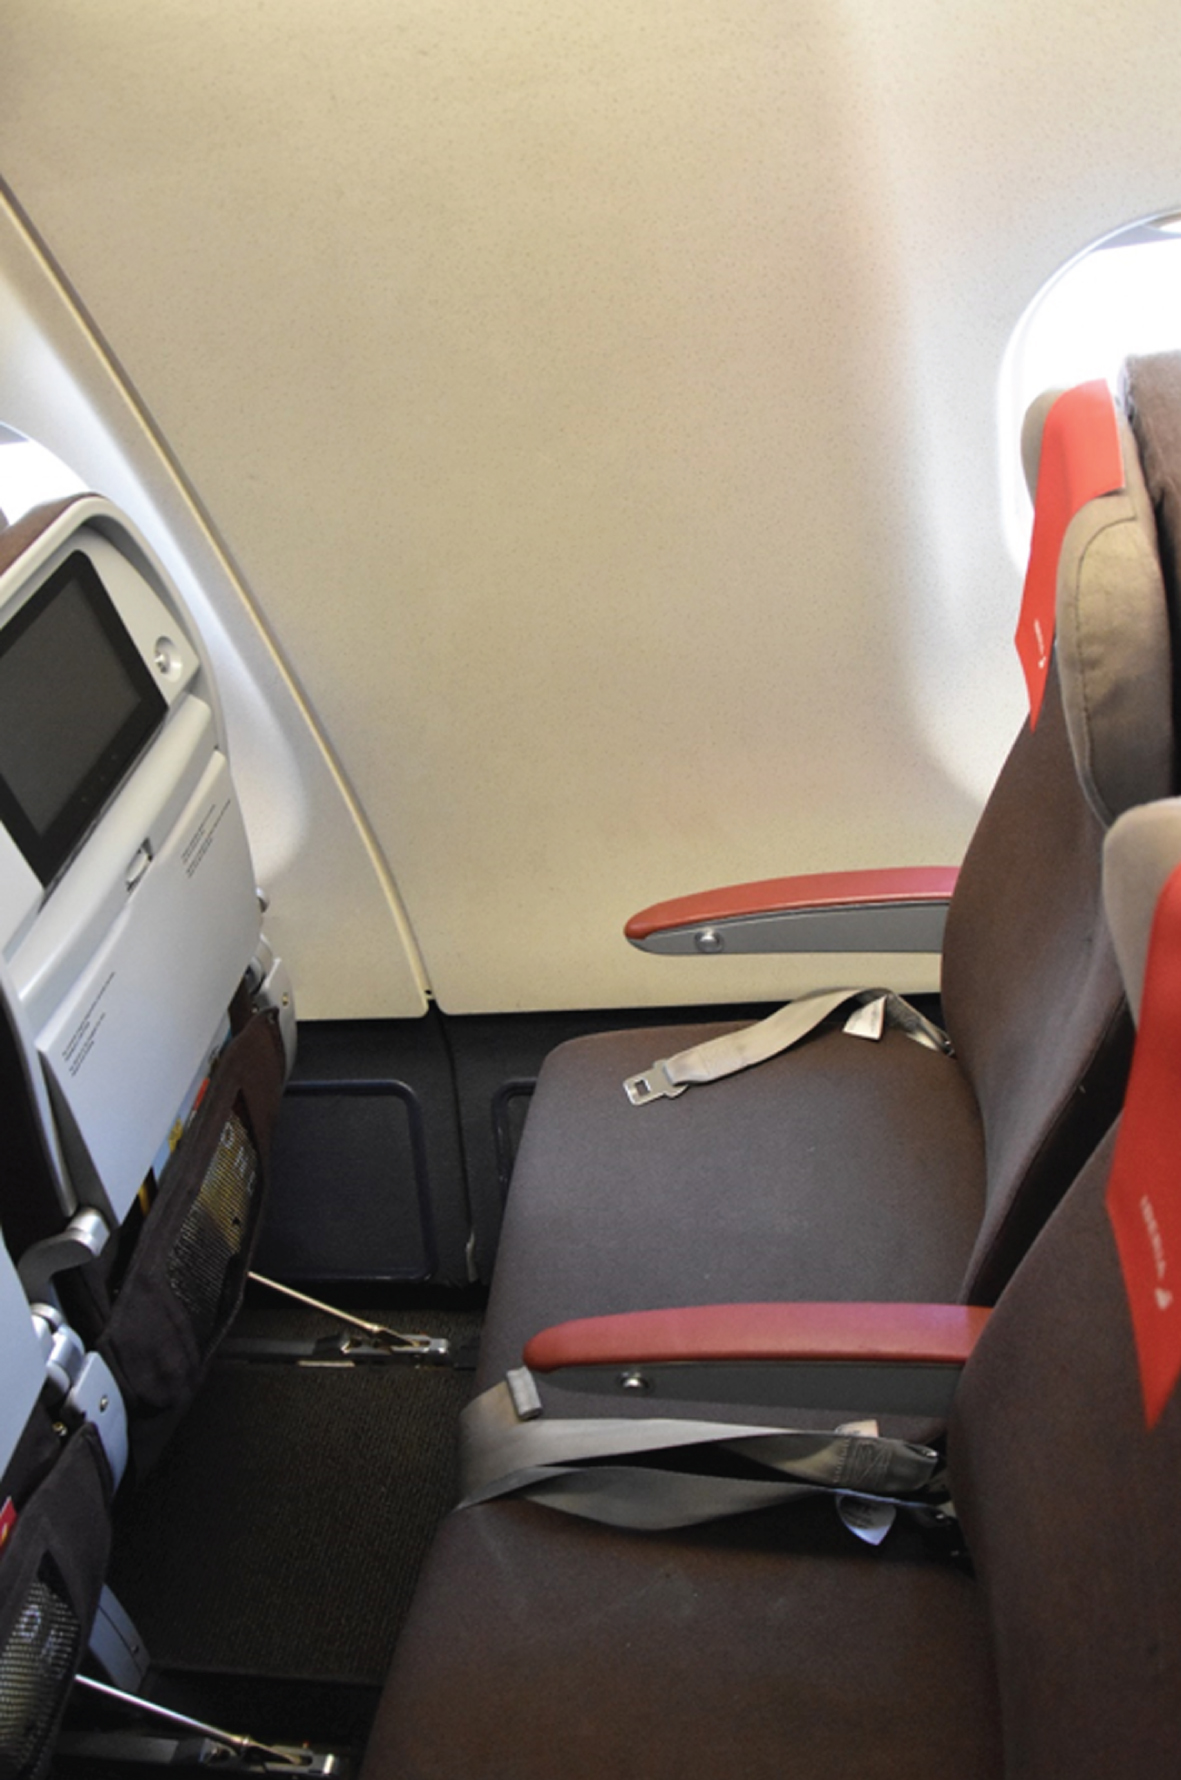
Adding a premium economy class itself adds complexity to the operation of the airliner. A differentiation needs to be made not only in the seats but also in other services provided by the airline [8, 18]. These pictures of a business class (Fig. 1), premium economy (Fig. 2) and economy class (Fig. 3) seat are examples of the seat differentiation of each class for long-haul flights. Adding two types of economy class options will increase this complexity further as it needs two different types of seats. Even though Boeing introduced open architecture which gives flexibility in the interior with lots of seat combinations, it cost two years of planning before installing, and a considerable amount of man-hours were needed as well [19].
Fig. 1
Example of a business class seat in a Boeing 777.
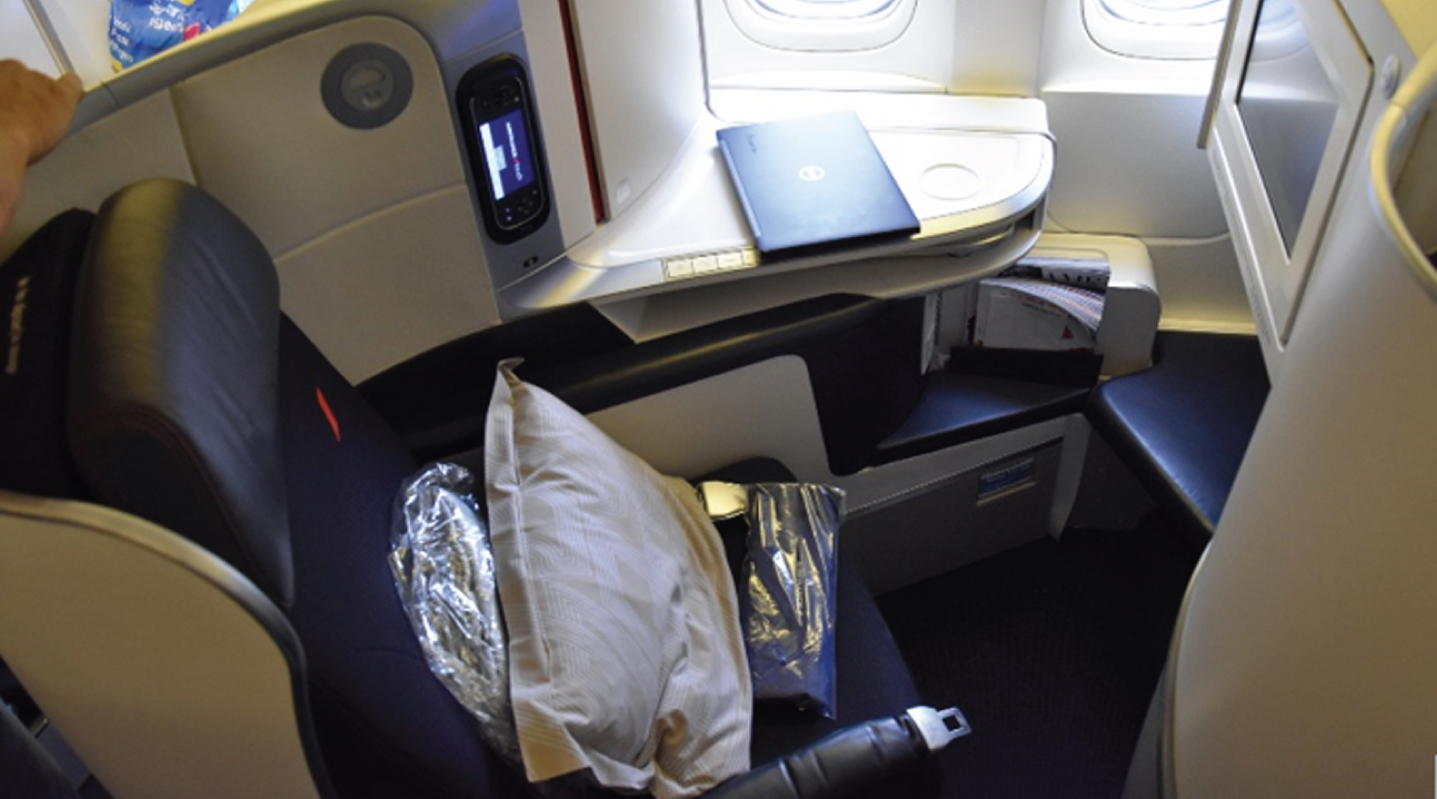
Fig. 2
Example of a premium economy seat in a Boeing 787.
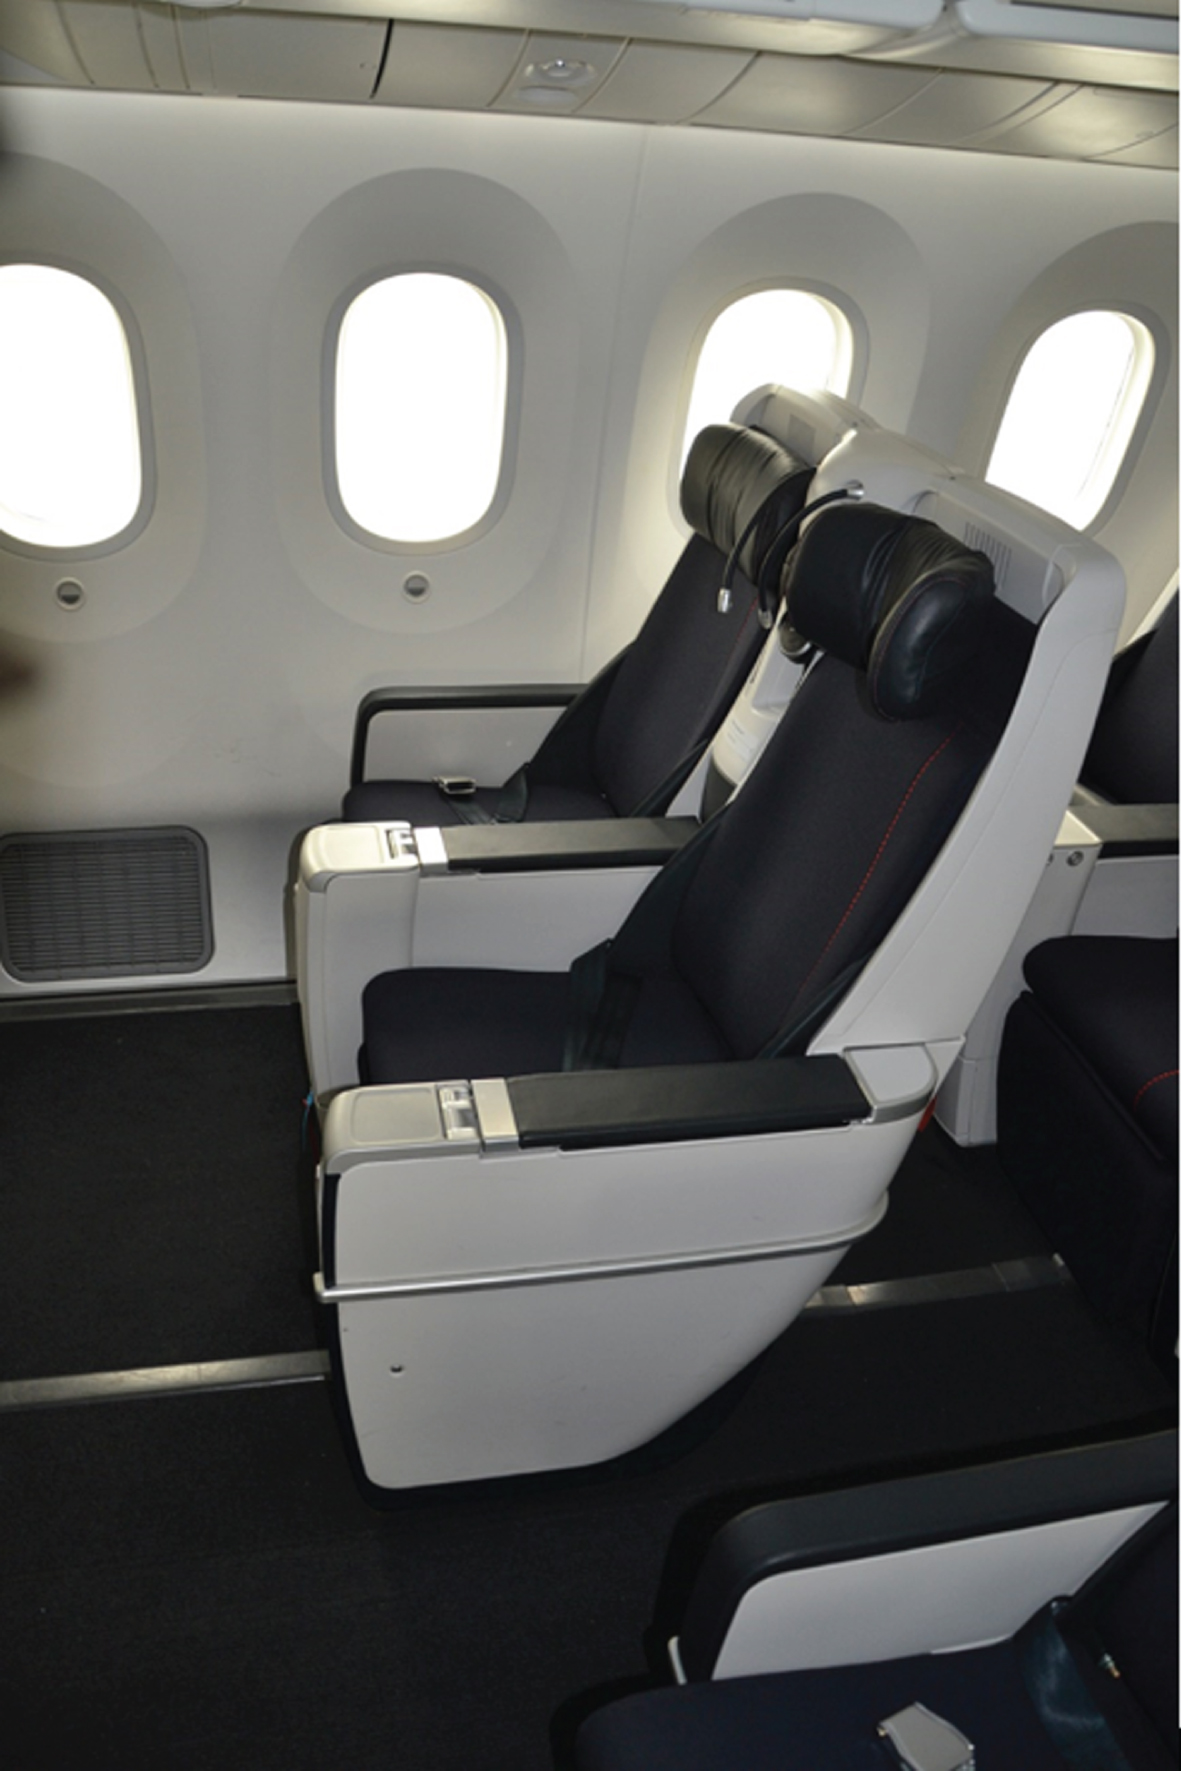
Fig. 3
Example of economy class seat in an Airbus A340.
Kollmuss and Lane [20] found that in the US markets, the space for a first-class seat is 313% bigger than an economy seat, while a premium economy class seat only occupies 29% more space than an economy class seat. This extra space could be beneficial as ticket prices of premium economy seats are higher. However, it was also found that the production cost of the seat is also 1.6 times more expensive than economy class seats [8]. On the other hand, airlines also want to increase the number of seats in a cabin, as aeroplane manufactures predicted that adding another row in the aeroplane can reduce 5% of the seat cost per trip [21]. Seats in the aeroplane could be placed in different orientations. Amendment 25–20 of the Federal Aviation Administration (FAA), dated April 23, 1969, that seats with an angle of 0–18° to the centerline of the aeroplane both forward and backwards would have an adequate level of safety. Seats placed at an angle more than 18 degrees to the aeroplane centerline must be protected from head injury by airbags or a safety belt and an energy-absorbing rest that supports the arms, shoulders, head, and spine; or by a safety belt and shoulder harness that prevents the head from contacting injurious objects. FAA also regulates the size of the aisle to be minimum 15 inches for aeroplanes with more than 20 passengers. Another regulation Sec. 25.817 of the FAA states that there is a maximum of 3 seats beside each aisle per row which needs to also be considered. Additionally, some authors did research on the design of a premium economy class seat [22, 23], and others calculated the price dispersion changes when the premium economy class is introduced [24].
3Materials and methods
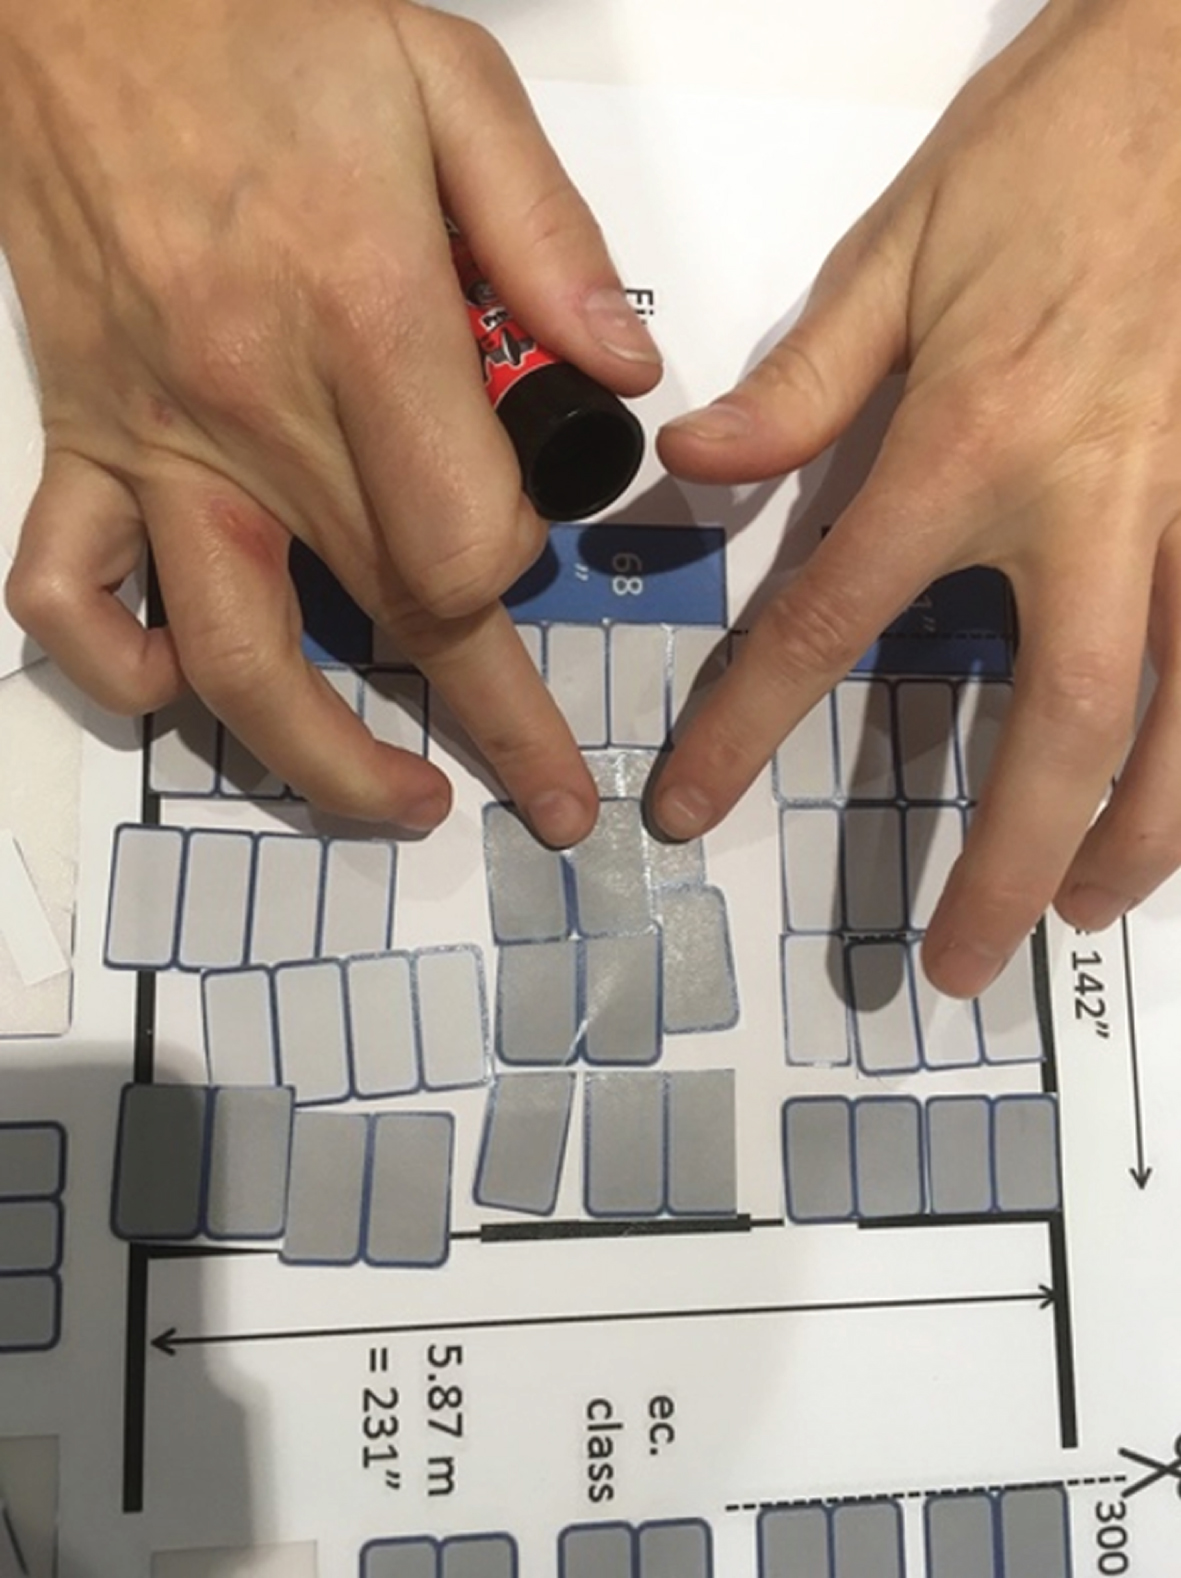
Eighty-eight experts in the field of aircraft interior were asked to make a floor plan of a part of a Boeing 777 aircraft of 5.87 m wide and 3.7 m long (Fig. 4). Twenty-nine groups were made, and one person left during the workshop. Each group was given a printed scaled aircraft floor plan and two types of economy seats to choose from (Fig. 5), and additional business class seats were given as a choice if they wanted more flexibility. Glue and scissors were provided to cut out the scaled seats and glue them on the floor plan. The sizes of two types of economy seats were 17′′ ×34′′ and 18′′ ×30′′, respectively, while the business class seats were 20′′ ×36′′. These seats were also scaled on paper for the participants to cut and glue on the floor plan. During the session, experts could put contours of the top view of the seat (including legroom) on top of the given floor plan to make different arrangements using their experience and/or creativity. The end results of the workshop were photographed and analysed based on aviation regulations and the outcomes of previous studies. At the end of the session, a general evaluation was made, and experts were asked to give a reasoning for the decision. All floor plans were analyzed and compared based on their manufacturing complexity, the potential of the total ticket price, the perceptual choice, the number of seats installed and the width of the aisle.
Fig. 4
3D drawing of cabin section between first class and economy class of Boeing 777 discussed in this study (unit: inch).
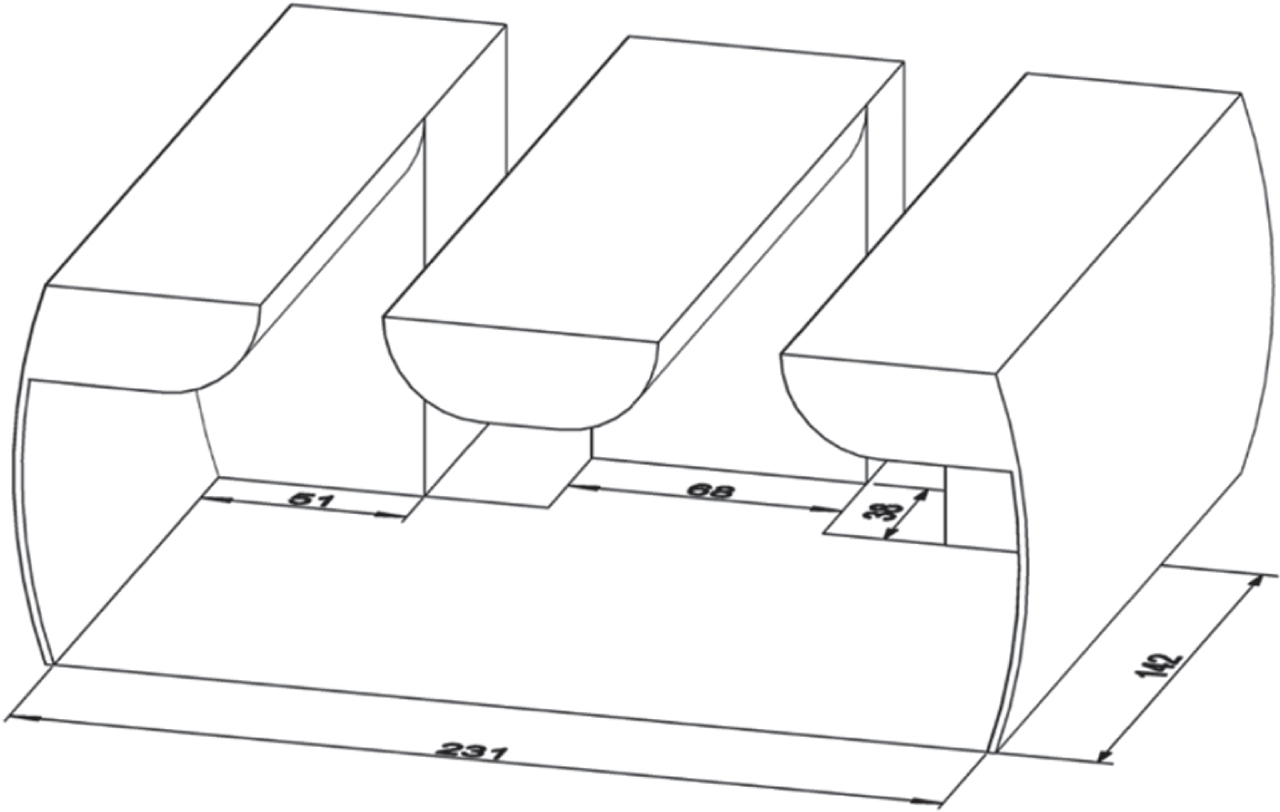
Fig. 5
Discussion process of the workshop.
A Python program was developed to use Skyline, Maximal Rectangles, and Guillotine algorithms [25] to find the optimal layouts in different configurations. In the setup of the configuration, three blocks of seats and two aisles were set up as the general layout and the following guidelines were given: 1) the widths of the blocks are adjustable; 2) the minimal aisle width was set following the regulations; 3) for each block, the type of seat is the same; and 4) the seats could be freely rotated. The objective functions of the optimization were set as either the floor plan with the most seats or with the highest added value. The optimization results were compared with the floor plans of the experts.
4Results and discussions
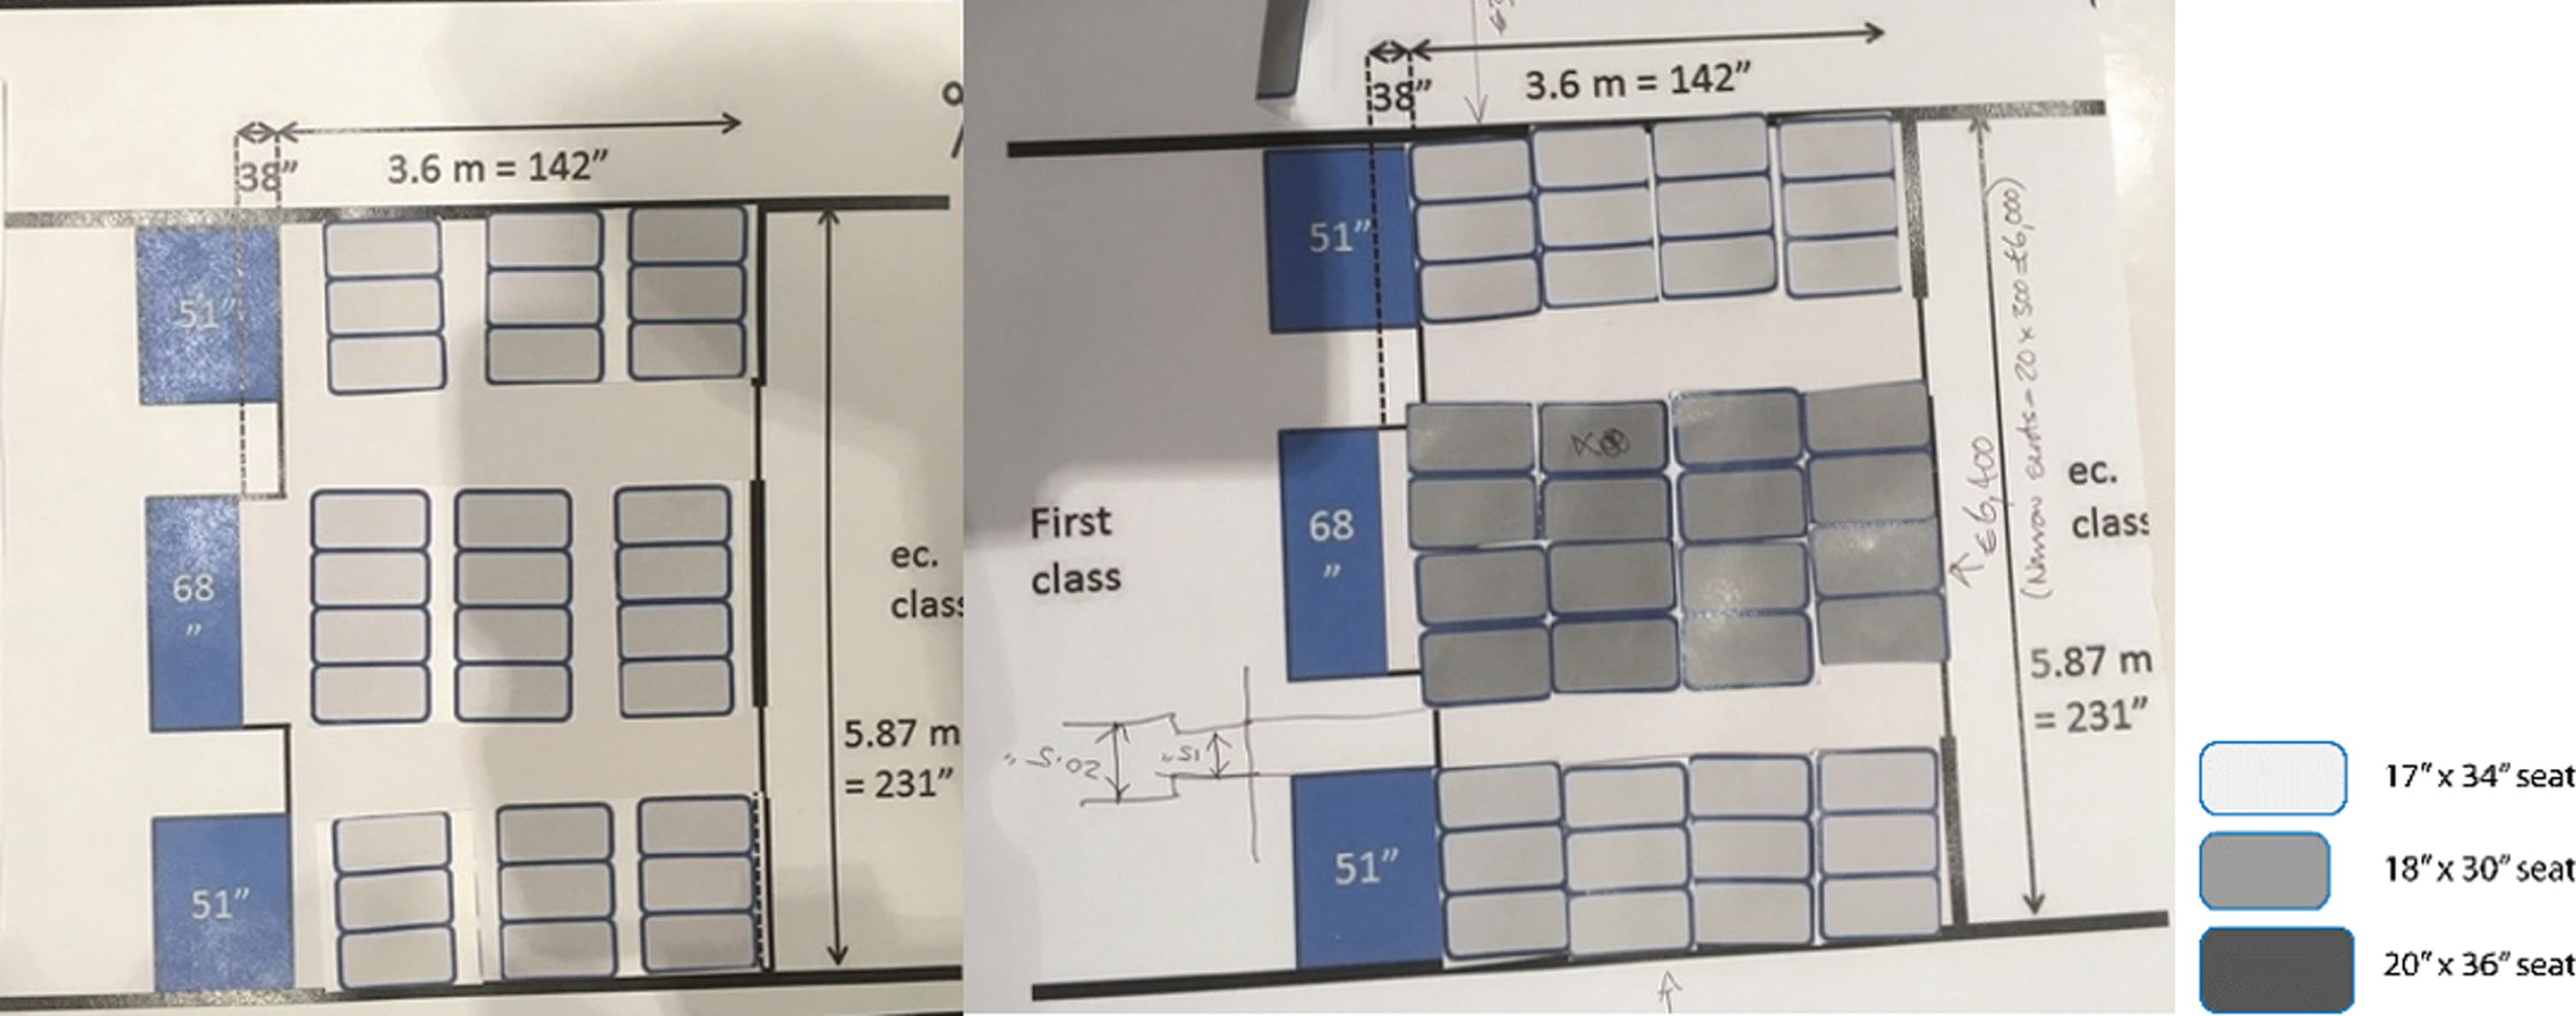
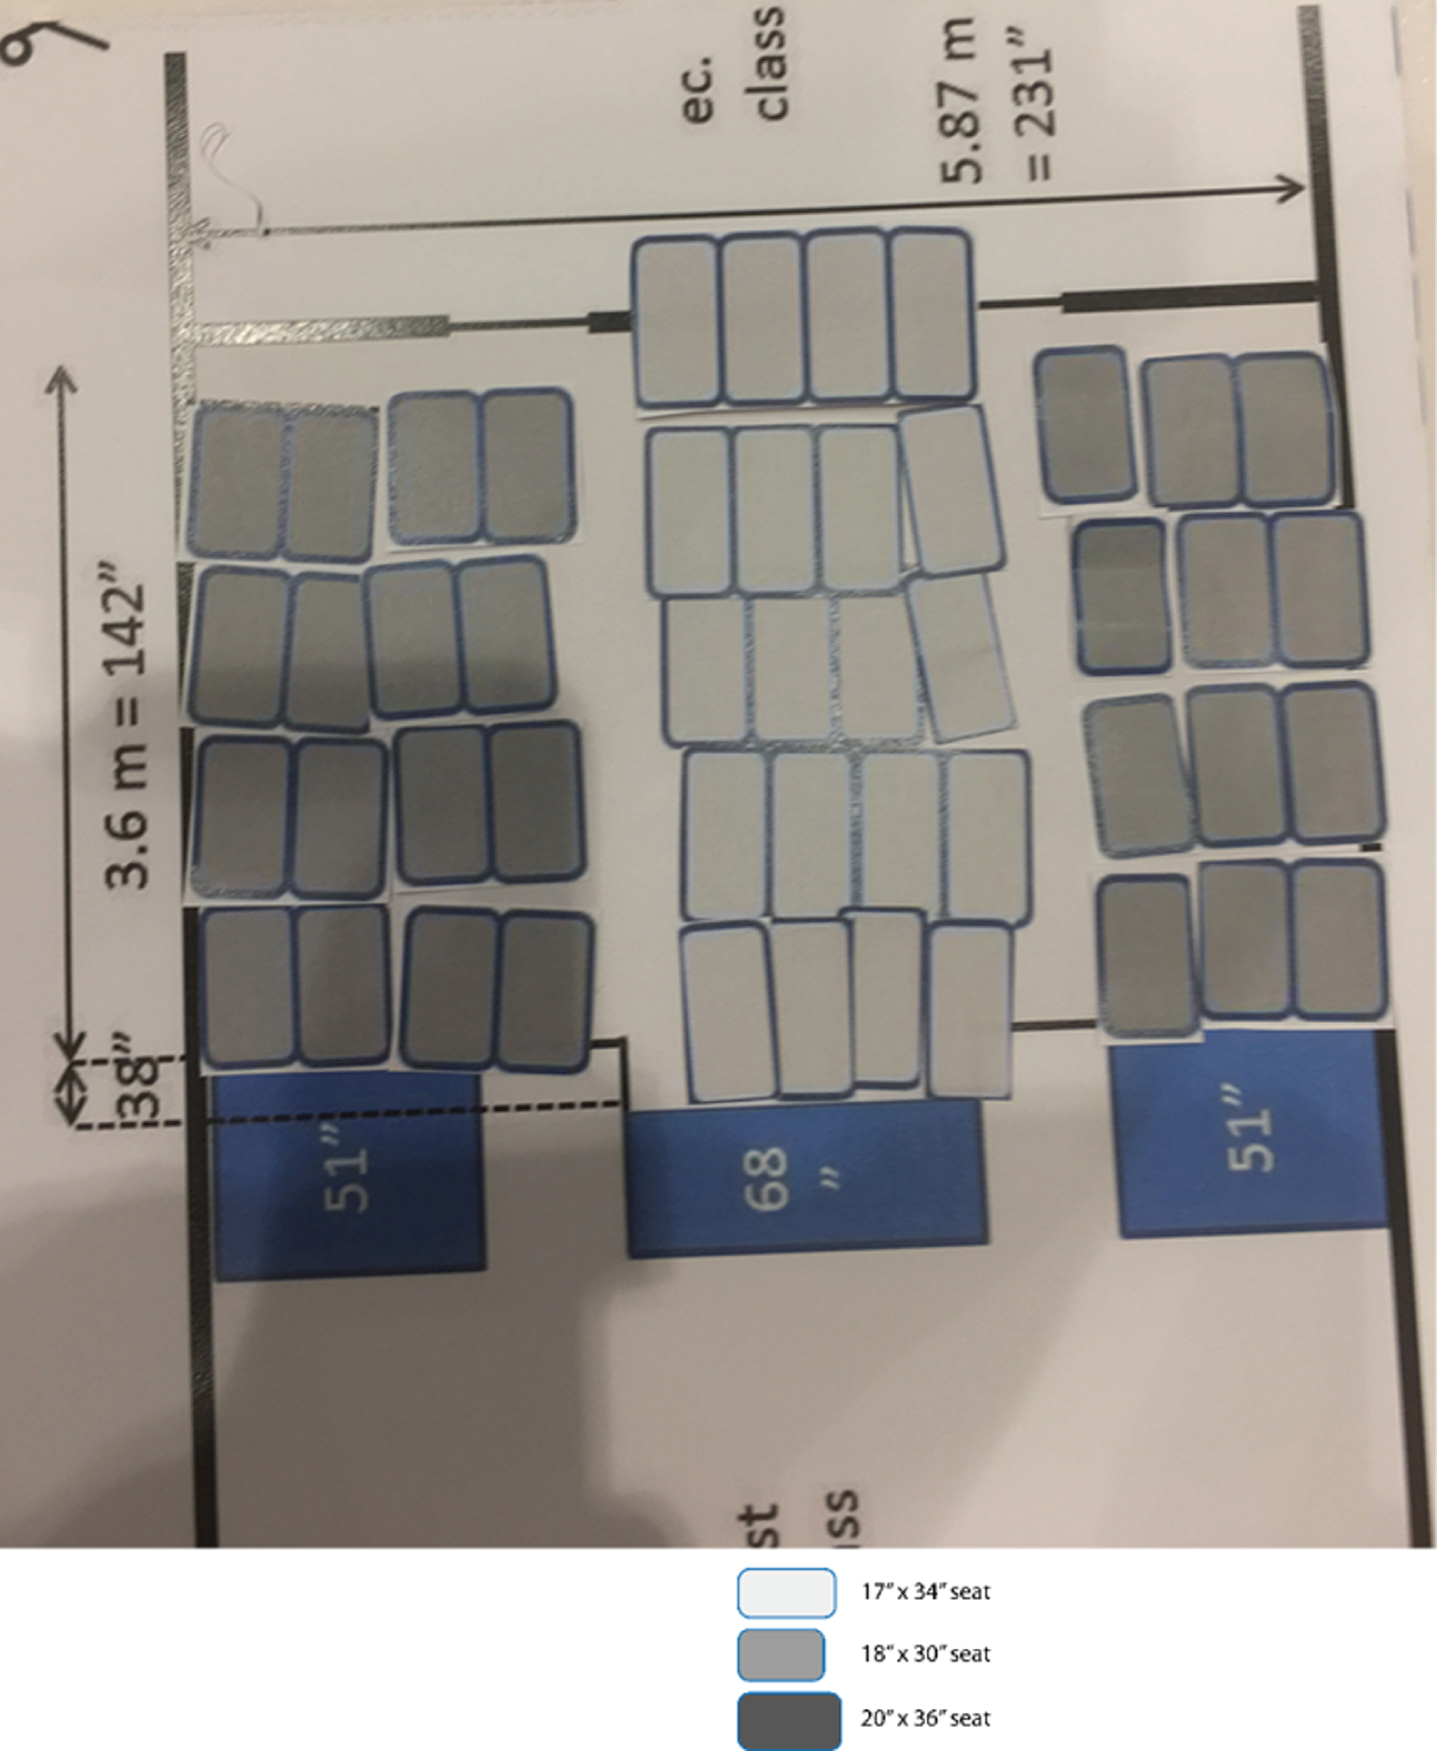
Twenty-nine floor-plans were collected from this workshop (Fig. 6). Additionally, 126 floor-plans were generated by computational algorithms, where 64 allowed 90 degrees rotation and 62 were fixed facing forward. Fourteen groups of the workshop chose to only use the two types of economy class seats (floor plan no. 1–14). These photographed floor plans were analysed based on the complexity of the operations, the number of passengers on board, the revenue of the airline, and it might also bump some rules such as a minimum of 15 inches of aisle width. Since this aircraft has two aisles, the sufficient aisle width would be 30 inches.
Fig. 6
Examples of floor plans made by experts in the workshop of the study.
Each group was provided with three different types of seats. Adding different seat types would increase the operational complexity as it would change the process of maintenance, booking, ticketing, etc. The number of seat types is included to give an overview of the complexity level of the operation.
The size choice of seats placed in the premium economy will affect the revenue of the airliner, as adding more seats can lead to a price reduction per seat, but having an upgraded space could attract the passengers to pay more [11, 21]. Calculations of the potential total of additional revenue were made based on the Willingness to Pay (WTP) prices of Balcombe et al. [11] when upgrading seat space from a basic 17-inch-wide 28-inch-pitch economy class seat for a 4.5–5.5 hours flight with LCCs. Each 17′′×34′′ seats were valued € 22 and the 18′′ ×30′′ seats were valued € 29 additionally. This upgrade could be attractive for economy and premium economy passengers since 68.1% perceived legroom as the source of discomfort, while 50.7% had high discomfort on seat width [26]. The complexity level, the aisle width, the additional value of floor plans and numbers of seats were calculated as Table 1.
Table 1
Calculation of floor plans results made by experts in the workshop which only used premium economy class seats
| No. | 18′′×30′′ | 17′′×34′′ | Number of seat types | Aisle width (m) | Additional value | Seat count |
| 1 | 0 | 40 | 1 | 1.57 | € 880 | 40 |
| 2 | 0 | 30 | 1 | 1.57 | € 660 | 30 |
| 3 | 16 | 24* | 2 | 1.53 | € 992 | 40 |
| 4 | 40 | 0 | 1 | 1.27 | € 1,160 | 40 |
| 5 | 38** | 0 | 1 | 1.07 | € 1,102 | 38 |
| 6 | 16 | 24 | 2 | 1.45 | € 992 | 40 |
| 7 | 22** | 24 | 2 | 1.45 | € 1,166 | 46 |
| 8 | 20 | 24 | 2 | 1.45 | € 1,108 | 44 |
| 9 | 0 | 44 | 1 | 1.14 | € 968 | 44 |
| 10 | 36 | 0 | 1 | 1.73 | € 1,044 | 36 |
| 11 | 20 | 24 | 2 | 1.45 | € 1,108 | 44 |
| 12 | 20 | 24 | 2 | 1.45 | € 1,108 | 44 |
| 13 | 20 | 24 | 2 | 1.45 | € 1,108 | 44 |
| 14 | 28 | 20 | 2 | 0.93 | € 1,252 | 48 |
*Seats were placed. **Layout contained a second storey.
In some plans, experts added an additional storey for more seats in the cabin. This did increase the numbers of seats, regulation wise it might not be possible since each aisle only allows three seats on each side of the aisle. One group placed the 17′′ ×34′′ seat for fitting more seats in. However, it is not yet known the comfort level of the passenger in this type of seat as the orientation of the seat might also influence the comfort level. No floor plans had an aisle width shorter than 0.76 m, though floor plan number 4 exceeded the given space. This floor plan with the highest additional revenue (€ 1,252) contains 28 seats of 18′′ ×30′′ and 20 seats of 17′′ 34′′ shown in Fig. 7. This floor plan fits the regulations for 2 aisles, leaving a 0.93 m space, which will give each aisle width of 0,465 = 18.3′′.
Fig. 7
The floor plan made by experts that had the highest seat count of 48 seats and potential revenue of US$21,984.
Another comparison was made to see the maximum number of passenger on-board by combining business and premium economy class seats shown in Table 2. The floor plans that included the business class seats (floor plan no. 15–29) were included in this comparison. This calculation was based on a Boeing cost model for British Airways BA747–400 aircraft from London Heathrow to New York JFK in 2012 [8]. The real cost per passenger was US$ 766 for business class and US$ 359 for premium economy. While the real revenue per passenger was US$ 1,251 and US$ 817 for business and premium economy, respectively. The load factor for this route was included in the cost model. By comparing the potential profit from all floor plans, it was found that having a cabin with the premium economy is more profitable than just having business class seats or even combining them. Among all floor plans that are complying to the regulations, the variation with 48 premium economy class without business class was found to gain more profit of US$ 21,984. This might be due to the different space-profit ratio of the business class and premium economy class seats. Therefore, adding the business class seat to this cabin section does not add to the profitability, though this calculation might change if the load factor of each class is added. The load factor used in the calculation of Hugon-Duprat and O’Connell [8] uses a 70%, 78% and 85% load factor for business, premium economy and economy, respectively. It is worth mentioning that the referenced profit/loss calculation had a longer seat pitch compared to the seats offered in this study.
Table 2
Profit/loss calculation for every floor plan made in the workshop by experts
| No. | Business class | Premium economy | Comply** | Cost (US$) | Revenue (US$) | Profit/Loss (US$)*** |
| 2 | 0 | 30 | ✓ | 10,770 | 24,510 | 13,740 |
| 25 | 21 | 13 | X | 20,753 | 36,892 | 16,139 |
| 16 | 7 | 28 | ✓ | 15,414 | 31,633 | 16,219 |
| 10 | 0 | 36 | ✓ | 12,924 | 29,412 | 16,488 |
| 24 | 19 | 16 | X | 20,298 | 36,841 | 16,543 |
| 18 | 12 | 24 | ✓ | 17,808 | 34,620 | 16,812 |
| 27 | 24 | 12 | ✓ | 22,692 | 39,828 | 17,136 |
| 5 | 0 | 39* | X | 14,001 | 31,863 | 17,862 |
| 28 | 20* | 18 | X | 21,782 | 39,726 | 17,944 |
| 17 | 9 | 30 | ✓ | 17,664 | 35,769 | 18,105 |
| 1 | 0 | 40 | ✓ | 14,360 | 32,680 | 18,320 |
| 3 | 0 | 40 | ✓ | 14,360 | 32,680 | 18,320 |
| 4 | 0 | 40 | X | 14,360 | 32,680 | 18,320 |
| 6 | 0 | 40 | ✓ | 14,360 | 32,680 | 18,320 |
| 22 | 16 | 24 | ✓ | 20,872 | 39,624 | 18,752 |
| 23 | 16 | 24 | ✓ | 20,872 | 39,624 | 18,752 |
| 26 | 24 | 16 | ✓ | 24,128 | 43,096 | 18,968 |
| 20 | 16 | 25 | ✓ | 21,231 | 40,441 | 19,210 |
| 21 | 16 | 25 | X | 21,231 | 40,441 | 19,210 |
| 15 | 6 | 36 | ✓ | 17,520 | 36,918 | 19,398 |
| 7 | 0 | 44* | X | 15,796 | 35,948 | 20,152 |
| 8 | 0 | 44 | ✓ | 15,796 | 35,948 | 20,152 |
| 9 | 0 | 44 | ✓ | 15,796 | 35,948 | 20,152 |
| 11 | 0 | 44 | ✓ | 15,796 | 35,948 | 20,152 |
| 12 | 0 | 44 | ✓ | 15,796 | 35,948 | 20,152 |
| 13 | 0 | 44 | ✓ | 15,796 | 35,948 | 20,152 |
| 19 | 12 | 32 | X | 20,680 | 41,156 | 20,476 |
| 14 | 0 | 48 | ✓ | 17,232 | 39,216 | 21,984 |
| 29 | 52* | 0 | X | 39,832 | 65,052 | 25,220 |
*Layout contained a second storey. **Regulations regarding the aisle width, given floor space and additional storey. ***Colours from red (lowest) to green (highest) indicate the amount of profit of layouts that comply.
Theoretically, each block may have three variants regarding seat types. For 3 blocks and two objective functions, there are 54 (3×3×3×2) optima. However, in some conditions, there is more than one optimum, especially regarding seat capacity. Therefore, in total sixty-four optimal floor plans were generated from the computational algorithms as shown in Table 3. Compared to the results of the experts, the computer results saved more space for the same combination of seats. This may be caused by the extra-margin left on both the width and pitch directions in paper cutting.
Table 3
Optimal floor plans allowing rotation created by computer algorithm
| No. | Left | Middle | Right | Seat count | Profit/Loss (US$) | |||
| Type | Count | Type | Count | Type | Count | |||
| Rotate-1 | 17×34* | 8 | 20×34 | 20 | 17×34* | 8 | 36 | 17,028 |
| Rotate-2 | 17×34* | 8 | 17×34* | 24 | 20×34 | 8 | 40 | 18,536 |
| Rotate-3 | 17×34 | 12 | 17×34 | 20 | 20×34 | 8 | 40 | 18,536 |
| Rotate-4 | 20×34 | 8 | 17×34* | 24 | 17×34* | 8 | 40 | 18,536 |
| Rotate-5 | 20×34 | 12 | 17×34* | 16 | 17×34 | 12 | 40 | 18,644 |
| Rotate-6 | 17×34 | 12 | 17×34* | 16 | 20×34 | 12 | 40 | 18,644 |
| Rotate-7 | 20×34 | 12 | 17×34* | 16 | 17×34 | 12 | 40 | 18,644 |
| Rotate-8 | 17×34 | 12 | 20×34 | 16 | 17×34 | 12 | 40 | 18,752 |
| Rotate-9 | 20×34 | 8 | 17×34* | 24 | 20×34 | 8 | 40 | 18,752 |
| Rotate-10 | 20×34 | 8 | 18×30* | 24 | 20×34 | 8 | 40 | 18,752 |
| Rotate-11 | 17×34 | 12 | 20×34 | 16 | 17×34 | 12 | 40 | 18,752 |
| Rotate-12 | 20×34 | 12 | 17×34* | 16 | 20×34 | 12 | 40 | 18,968 |
| Rotate-13 | 20×34 | 12 | 18×30* | 16 | 20×34 | 12 | 40 | 18,968 |
| Rotate-14 | 20×34 | 12 | 17×34* | 16 | 20×34 | 12 | 40 | 18,968 |
| Rotate-15 | 20×34 | 12 | 18×30* | 16 | 20×34 | 12 | 40 | 18,968 |
| Rotate-16 | 17×34 | 12 | 20×34 | 16 | 20×34 | 12 | 40 | 19,076 |
| Rotate-17 | 20×34 | 12 | 20×34 | 16 | 17×34 | 12 | 40 | 19,076 |
| Rotate-18 | 17×34 | 12 | 20×34 | 16 | 20×34 | 12 | 40 | 19,076 |
| Rotate-19 | 20×34 | 12 | 20×34 | 16 | 17×34 | 12 | 40 | 19,076 |
| Rotate-20 | 20×34 | 12 | 20×34 | 16 | 20×34 | 12 | 40 | 19,400 |
| Rotate-21 | 20×34 | 12 | 20×34 | 16 | 20×34 | 12 | 40 | 19,400 |
| Rotate-22 | 17×34 | 12 | 17×34 | 20 | 17×34 | 12 | 44 | 20,152 |
| Rotate-23 | 17×34 | 12 | 17×34 | 20 | 18×30 | 12 | 44 | 20,152 |
| Rotate-24 | 18×30 | 12 | 17×34 | 20 | 17×34 | 12 | 44 | 20,152 |
| Rotate-25 | 18×30* | 16 | 17×34* | 16 | 17×34 | 12 | 44 | 20,152 |
| Rotate-26 | 17×34 | 12 | 17×34 | 20 | 17×34 | 12 | 44 | 20,152 |
| Rotate-27 | 17×34 | 12 | 17×34* | 16 | 18×30* | 16 | 44 | 20,152 |
| Rotate-28 | 18×30* | 16 | 17×34* | 16 | 17×34 | 12 | 44 | 20,152 |
| Rotate-29 | 17×34 | 12 | 18×30* | 24 | 20×34 | 8 | 44 | 20,368 |
| Rotate-30 | 18×30 | 12 | 18×30* | 24 | 20×34 | 8 | 44 | 20,368 |
| Rotate-31 | 20×34 | 8 | 18×30* | 24 | 17×34 | 12 | 44 | 20,368 |
| Rotate-32 | 20×34 | 8 | 18×30* | 24 | 18×30 | 12 | 44 | 20,368 |
| Rotate-33 | 17×34 | 12 | 18×30* | 24 | 20×34 | 8 | 44 | 20,368 |
| Rotate-34 | 20×34 | 8 | 18×30* | 24 | 17×34 | 12 | 44 | 20,368 |
| Rotate-35 | 18×30* | 16 | 17×34* | 16 | 20×34 | 12 | 44 | 20,476 |
| Rotate-36 | 18×30* | 16 | 18×30* | 16 | 20×34 | 12 | 44 | 20,476 |
| Rotate-37 | 20×34 | 12 | 17×34* | 16 | 18×30* | 16 | 44 | 20,476 |
| Rotate-38 | 20×34 | 12 | 18×30* | 16 | 18×30* | 16 | 44 | 20,476 |
| Rotate-39 | 18×30* | 16 | 17×34* | 16 | 20×34 | 12 | 44 | 20,476 |
| Rotate-40 | 18×30* | 16 | 18×30* | 16 | 20×34 | 12 | 44 | 20,476 |
| Rotate-41 | 20×34 | 12 | 17×34* | 16 | 18×30* | 16 | 44 | 20,476 |
| Rotate-42 | 20×34 | 12 | 18×30* | 16 | 18×30* | 16 | 44 | 20,476 |
| Rotate-43 | 17×34 | 12 | 20×34 | 16 | 18×30* | 16 | 44 | 20,584 |
| Rotate-44 | 18×30* | 16 | 20×34 | 16 | 17×34 | 12 | 44 | 20,584 |
| Rotate-45 | 17×34 | 12 | 20×34 | 16 | 18×30* | 16 | 44 | 20,584 |
| Rotate-46 | 18×30* | 16 | 20×34 | 16 | 17×34 | 12 | 44 | 20,584 |
| Rotate-47 | 20×34 | 12 | 20×34 | 16 | 18×30* | 16 | 44 | 20,638 |
| Rotate-48 | 18×30* | 16 | 20×34 | 16 | 20×34 | 12 | 44 | 20,908 |
| Rotate-49 | 20×34 | 12 | 20×34 | 16 | 18×30* | 16 | 44 | 20,908 |
| Rotate-50 | 18×30* | 16 | 20×34 | 16 | 20×34 | 12 | 44 | 20,908 |
| Rotate-51 | 17×34 | 12 | 18×30* | 24 | 17×34 | 12 | 48 | 21,984 |
| Rotate-52 | 17×34 | 12 | 18×30* | 24 | 18×30 | 12 | 48 | 21,984 |
| Rotate-53 | 18×30* | 16 | 17×34* | 16 | 18×30* | 16 | 48 | 21,984 |
| Rotate-54 | 18×30 | 12 | 18×30* | 24 | 17×34 | 12 | 48 | 21,984 |
| Rotate-55 | 18×30 | 12 | 18×30* | 24 | 18×30 | 12 | 48 | 21,984 |
| Rotate-56 | 18×30* | 16 | 18×30* | 16 | 18×30* | 16 | 48 | 21,984 |
| Rotate-57 | 17×34 | 12 | 18×30* | 24 | 17×34 | 12 | 48 | 21,984 |
| Rotate-58 | 17×34 | 12 | 18×30* | 24 | 18×30 | 12 | 48 | 21,984 |
| Rotate-59 | 18×30* | 16 | 17×34* | 16 | 18×30* | 16 | 48 | 21,984 |
| Rotate-60 | 18×30 | 12 | 18×30* | 24 | 17×34 | 12 | 48 | 21,984 |
| Rotate-61 | 18×30 | 12 | 18×30* | 24 | 18×30 | 12 | 48 | 21,984 |
| Rotate-62 | 18×30* | 16 | 18×30* | 16 | 18×30* | 16 | 48 | 21,984 |
| Rotate-63 | 18×30* | 16 | 20×34 | 16 | 18×30* | 16 | 48 | 22,416 |
| Rotate-64 | 18×30* | 16 | 20×34 | 16 | 18×30* | 16 | 48 | 22,416 |
*Seat rotated 90 degrees.
In some layouts, some seats were rotated 90 de-grees for maximizing the capacity towards the objective functions. However, whether this configuration is comfortable for passengers is still unknown. Adding seats will increase the additional revenue, though ingress and egress might cause a problem. This rotated position could also introduce extra manufacturing costs, as usually seats are manufactured in groups of 3 or 4 in a row. In order to place the seats, additional airbags should be installed in the seatbelt and/or in the walls. The dimension of the additional equipment is not calculated in the layouts, as well as the additional manufacturing cost of the seat.
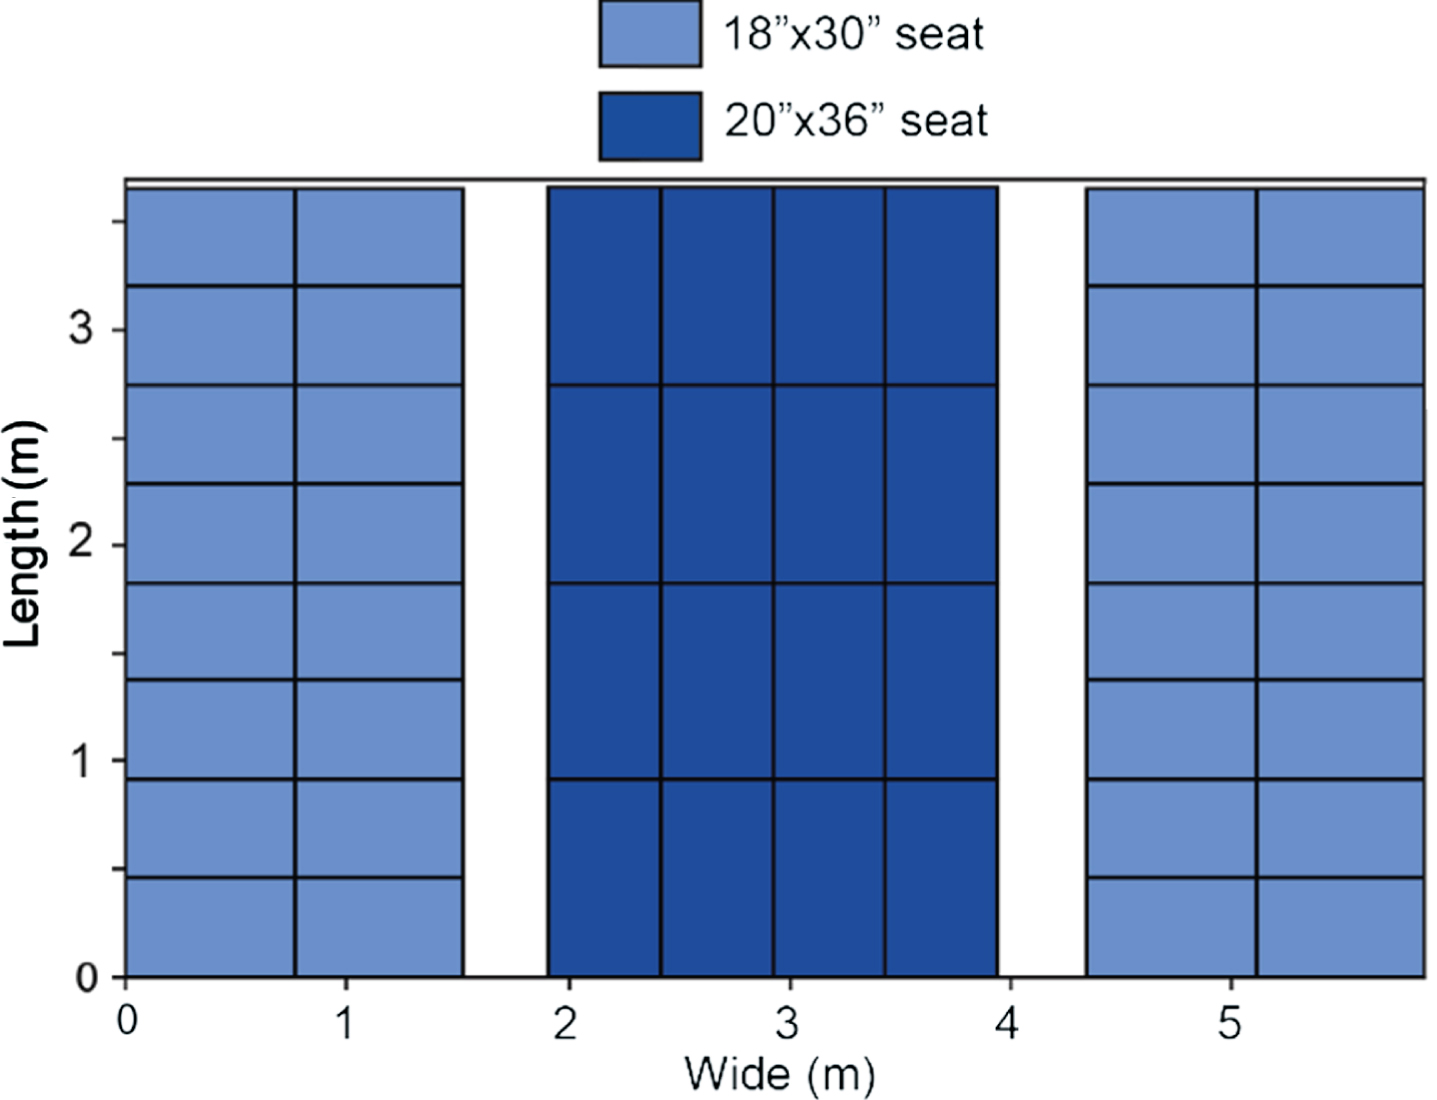
The highest seat count for the computer allowing rotation was 48 seats with only premium economy class seats. The for layouts that included business class seats, the layout with the maximum seat count could board 16 business class passengers and 32 premium economy class passengers on-board (Fig. 8).
Fig. 8
Floor plan allowing seat rotation with the highest seat count of 48 seats and highest potential revenue of US$22,416 generated with by the computer algorithm.
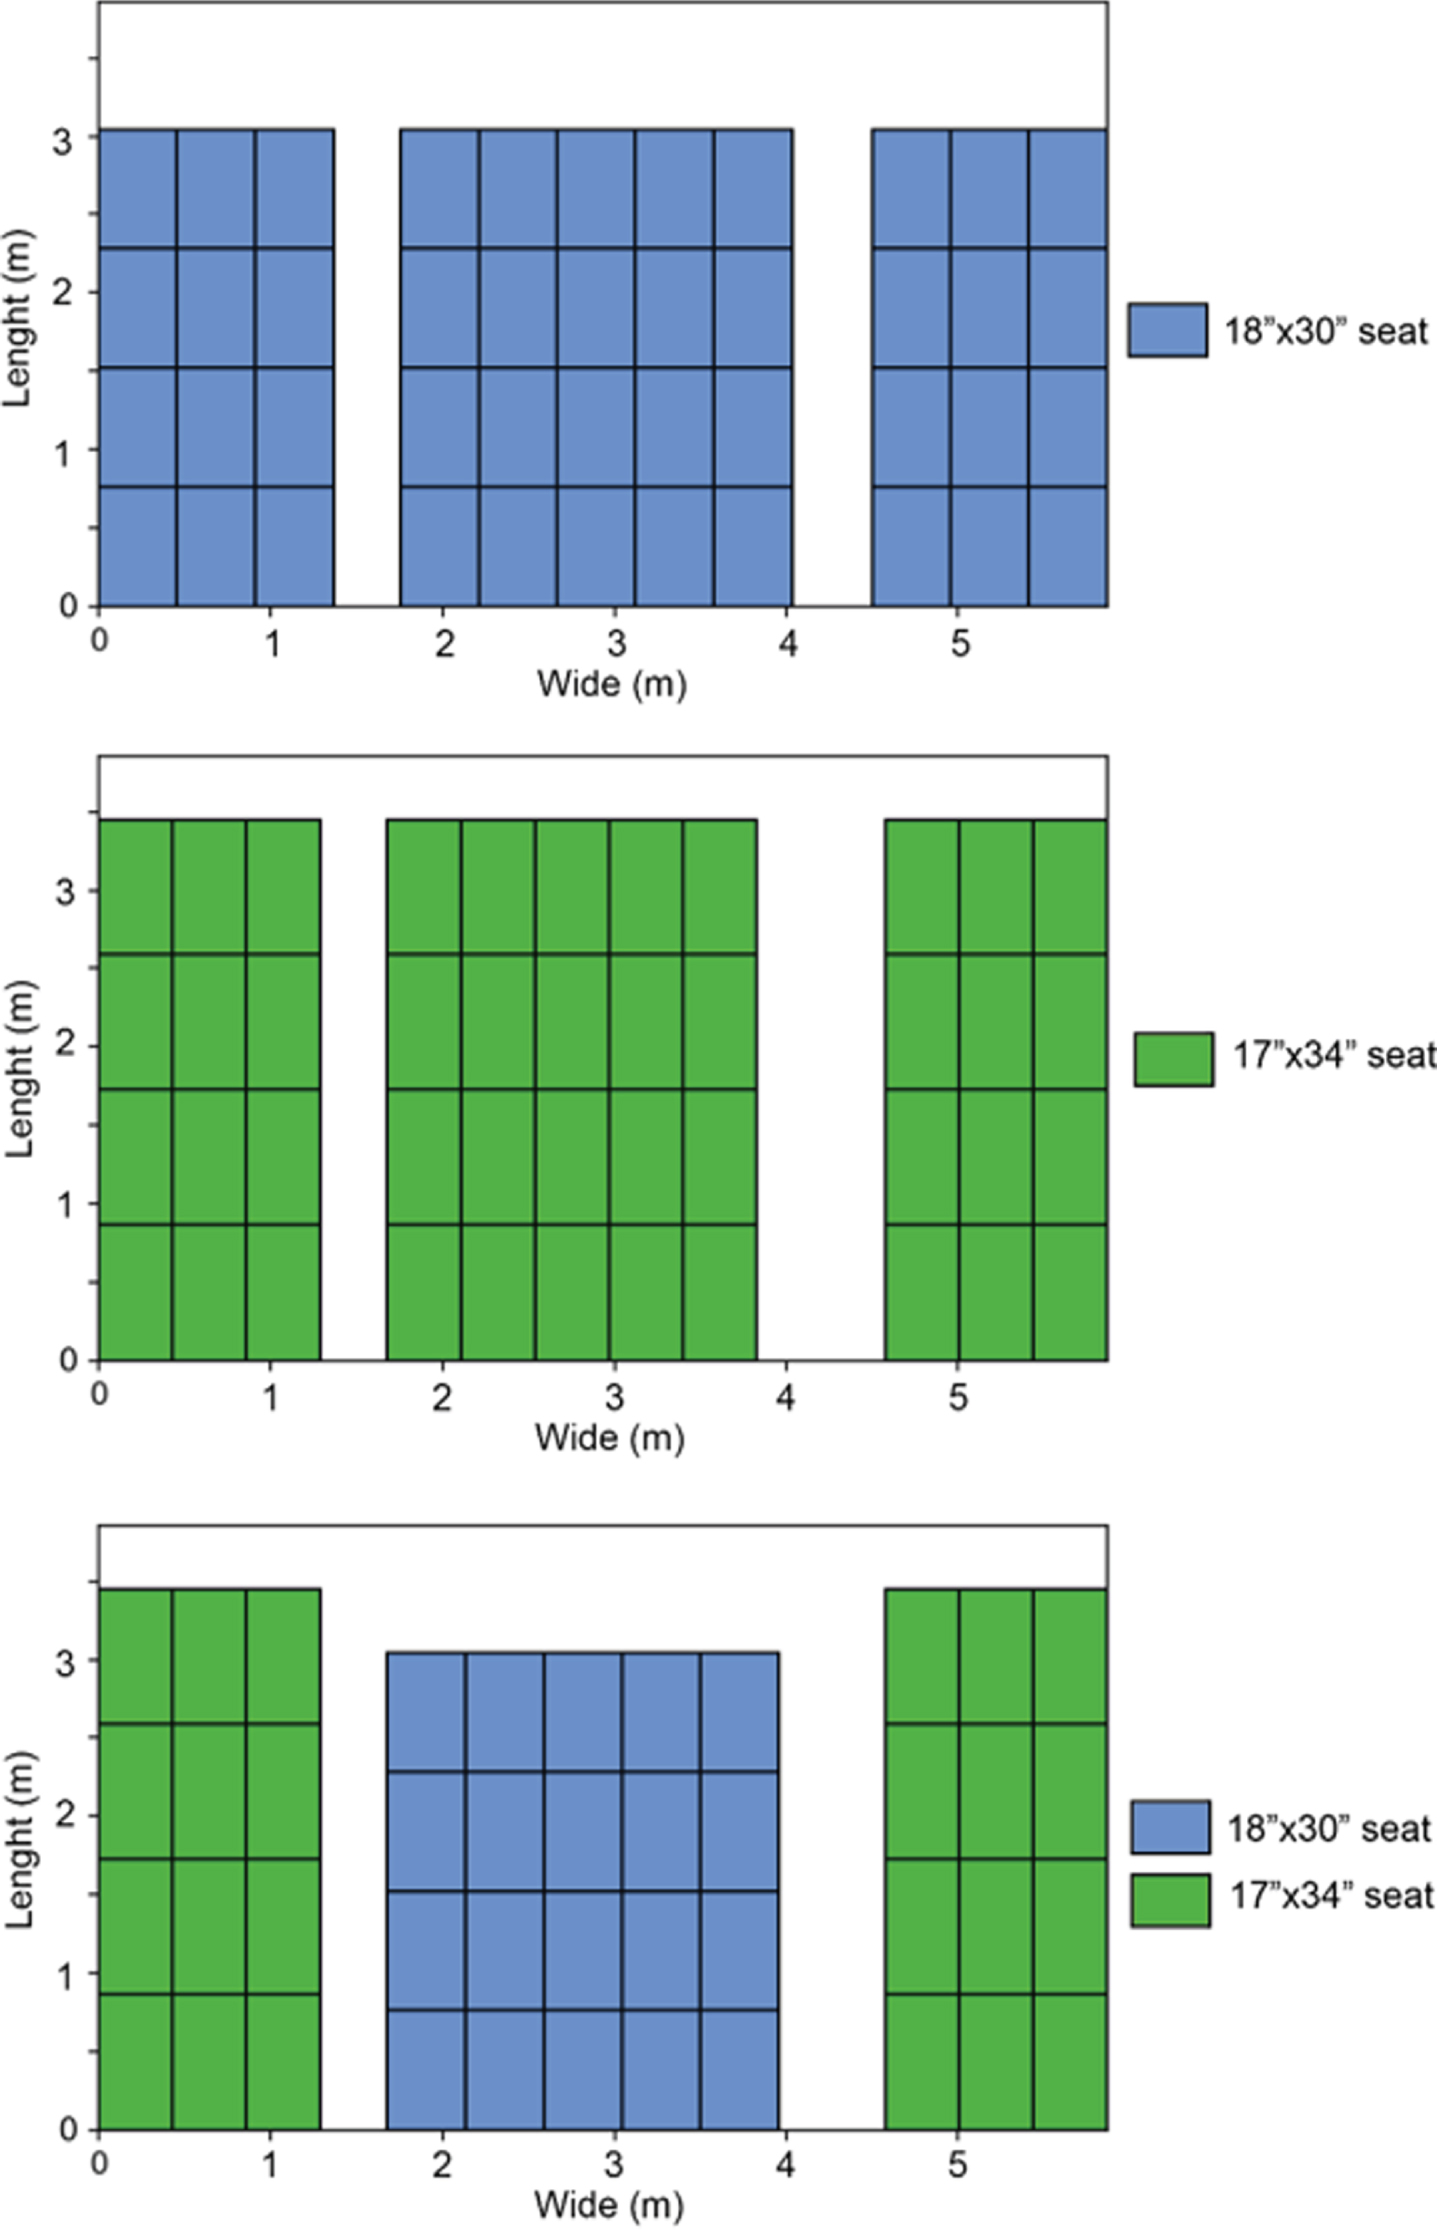
Another calculation was done for seat layouts with all passengers facing flight direction. Sixty-two layouts were generated from this algorithm (Table 4). With this facing forward restriction, seat count decreased to 44. There were 16 layouts with the same seat count. These layouts consisted of either or a mix of 18′′×30′′ and 17′′×34′′ seats, examples shown in Fig. 9, though having chosen the wider option could attract passengers to pay more.
Table 4
Optimal floor plans with all seats facing forward created by computer algorithm
| No. | Left | Middle | Right | Seat count | Profit/Loss (US$) | |||
| Type | Count | Type | Count | Type | Count | |||
| Forward-1 | 17×34 | 8 | 20×36 | 20 | 17×34 | 8 | 36 | 17,028 |
| Forward-2 | 17×34 | 8 | 17×34 | 24 | 20×36 | 8 | 40 | 18,536 |
| Forward-3 | 17×34 | 12 | 17×34 | 20 | 20×36 | 8 | 40 | 18,536 |
| Forward-4 | 17×34 | 12 | 18×30 | 20 | 20×36 | 8 | 40 | 18,536 |
| Forward-5 | 18×30 | 8 | 17×34 | 24 | 20×36 | 8 | 40 | 18,536 |
| Forward-6 | 18×30 | 12 | 17×34 | 20 | 20×36 | 8 | 40 | 18,536 |
| Forward-7 | 18×30 | 12 | 18×30 | 20 | 20×36 | 8 | 40 | 18,536 |
| Forward-8 | 20×36 | 8 | 17×34 | 24 | 17×34 | 8 | 40 | 18,536 |
| Forward-9 | 20×36 | 8 | 17×34 | 24 | 18×30 | 8 | 40 | 18,536 |
| Forward-10 | 20×36 | 8 | 18×30 | 20 | 17×34 | 12 | 40 | 18,536 |
| Forward-11 | 20×36 | 8 | 18×30 | 20 | 18×30 | 12 | 40 | 18,536 |
| Forward-12 | 20×36 | 12 | 17×34 | 16 | 17×34 | 12 | 40 | 18,644 |
| Forward-13 | 20×36 | 12 | 17×34 | 16 | 18×30 | 12 | 40 | 18,644 |
| Forward-14 | 20×36 | 12 | 18×30 | 16 | 17×34 | 12 | 40 | 18,644 |
| Forward-15 | 20×36 | 12 | 18×30 | 16 | 18×30 | 12 | 40 | 18,644 |
| Forward-16 | 17×34 | 12 | 17×34 | 16 | 20×36 | 12 | 40 | 18,644 |
| Forward-17 | 17×34 | 12 | 18×30 | 16 | 20×36 | 12 | 40 | 18,644 |
| Forward-18 | 18×30 | 12 | 17×34 | 16 | 20×36 | 12 | 40 | 18,644 |
| Forward-19 | 18×30 | 12 | 18×30 | 16 | 20×36 | 12 | 40 | 18,644 |
| Forward-20 | 20×36 | 12 | 17×34 | 16 | 17×34 | 12 | 40 | 18,644 |
| Forward-21 | 20×36 | 12 | 17×34 | 16 | 18×30 | 12 | 40 | 18,644 |
| Forward-22 | 20×36 | 12 | 18×30 | 16 | 17×34 | 12 | 40 | 18,644 |
| Forward-23 | 20×36 | 12 | 18×30 | 16 | 18×30 | 12 | 40 | 18,644 |
| Forward-24 | 17×34 | 12 | 20×36 | 16 | 17×34 | 12 | 40 | 18,752 |
| Forward-25 | 17×34 | 12 | 20×36 | 16 | 18×30 | 12 | 40 | 18,752 |
| Forward-26 | 18×30 | 12 | 20×36 | 16 | 17×34 | 12 | 40 | 18,752 |
| Forward-27 | 18×30 | 12 | 20×36 | 16 | 18×30 | 12 | 40 | 18,752 |
| Forward-28 | 20×36 | 8 | 17×34 | 24 | 20×36 | 8 | 40 | 18,752 |
| Forward-29 | 17×34 | 12 | 20×36 | 16 | 17×34 | 12 | 40 | 18,752 |
| Forward-30 | 17×34 | 12 | 20×36 | 16 | 18×30 | 12 | 40 | 18,752 |
| Forward-31 | 18×30 | 12 | 20×36 | 16 | 17×34 | 12 | 40 | 18,752 |
| Forward-32 | 18×30 | 12 | 20×36 | 16 | 18×30 | 12 | 40 | 18,752 |
| Forward-33 | 20×36 | 12 | 17×34 | 16 | 20×36 | 12 | 40 | 18,968 |
| Forward-34 | 20×36 | 12 | 18×30 | 16 | 20×36 | 12 | 40 | 18,968 |
| Forward-35 | 20×36 | 12 | 17×34 | 16 | 20×36 | 12 | 40 | 18,968 |
| Forward-36 | 20×36 | 12 | 18×30 | 16 | 20×36 | 12 | 40 | 18,968 |
| Forward-37 | 17×34 | 12 | 20×36 | 16 | 20×36 | 12 | 40 | 19,076 |
| Forward-38 | 18×30 | 12 | 20×36 | 16 | 20×36 | 12 | 40 | 19,076 |
| Forward-39 | 20×36 | 12 | 20×36 | 16 | 17×34 | 12 | 40 | 19,076 |
| Forward-40 | 20×36 | 12 | 20×36 | 16 | 18×30 | 12 | 40 | 19,076 |
| Forward-41 | 17×34 | 12 | 20×36 | 16 | 20×36 | 12 | 40 | 19,076 |
| Forward-42 | 18×30 | 12 | 20×36 | 16 | 20×36 | 12 | 40 | 19,076 |
| Forward-43 | 20×36 | 12 | 20×36 | 16 | 17×34 | 12 | 40 | 19,076 |
| Forward-44 | 20×36 | 12 | 20×36 | 16 | 18×30 | 12 | 40 | 19,076 |
| Forward-45 | 20×36 | 12 | 20×36 | 16 | 20×36 | 12 | 40 | 19,400 |
| Forward-46 | 20×36 | 12 | 20×36 | 16 | 20×36 | 12 | 40 | 19,400 |
| Forward-47 | 17×34 | 12 | 17×34 | 20 | 17×34 | 12 | 44 | 20,152 |
| Forward-48 | 17×34 | 12 | 17×34 | 20 | 18×30 | 12 | 44 | 20,152 |
| Forward-49 | 17×34 | 12 | 18×30 | 20 | 17×34 | 12 | 44 | 20,152 |
| Forward-50 | 17×34 | 12 | 18×30 | 20 | 18×30 | 12 | 44 | 20,152 |
| Forward-51 | 18×30 | 12 | 17×34 | 20 | 17×34 | 12 | 44 | 20,152 |
| Forward-52 | 18×30 | 12 | 17×34 | 20 | 18×30 | 12 | 44 | 20,152 |
| Forward-53 | 18×30 | 12 | 18×30 | 20 | 17×34 | 12 | 44 | 20,152 |
| Forward-54 | 18×30 | 12 | 18×30 | 20 | 18×30 | 12 | 44 | 20,152 |
| Forward-55 | 17×34 | 12 | 17×34 | 20 | 17×34 | 12 | 44 | 20,152 |
| Forward-56 | 17×34 | 12 | 17×34 | 20 | 18×30 | 12 | 44 | 20,152 |
| Forward-57 | 17×34 | 12 | 18×30 | 20 | 17×34 | 12 | 44 | 20,152 |
| Forward-58 | 17×34 | 12 | 18×30 | 20 | 18×30 | 12 | 44 | 20,152 |
| Forward-59 | 18×30 | 12 | 17×34 | 20 | 17×34 | 12 | 44 | 20,152 |
| Forward-60 | 18×30 | 12 | 17×34 | 20 | 18×30 | 12 | 44 | 20,152 |
| Forward-61 | 18×30 | 12 | 18×30 | 20 | 17×34 | 12 | 44 | 20,152 |
| Forward-62 | 18×30 | 12 | 18×30 | 20 | 18×30 | 12 | 44 | 20,152 |
Fig. 9
Examples of optimal layout facing forward with the highest seat count of 44 seats and highest potential revenue of US$ 20,152 generated by the computer algorithm.
Overall, both experts and computer program showed that the maximum seat count is 48, although experts used a mixture of only premium economy seats facing forward, while the computer program mixed premium economy and business class seats with rotated-seats. Experts paid more attention to comfort perceived by passengers using the information briefed before the group discussion, though the computer program was better at getting a floor plan that gives higher potential revenue. Computer programs also have a strict rule of constraints, so the layouts made would not bump any regulations, yet the experts are more creative in making ideas for future floor plans.
There are several limitations to this study. Each airline has a different label for their premium economy class, where the seat space dimensions also differ among airlines. Experts that participated in the workshop did affirm the chosen seat sizes in this experiment. This study also did not clearly define the duration of the flight for the section of cabin designed. There is a chance that the size of seats needs to be larger for long-haul flights. Moreover, there is a limited number of available references on premium economy class, especially with the same dimensions used during this study, limiting the discussion of this paper.
5Conclusion and future works
This study tries to explore the potential of the floor plans of the economy cabin using two types of economy class seats. Aircraft interior experts were asked to make floor plans with comfort as a consideration, which were analysed based on the complexity of the operations, the number of passengers on boards, the revenue of the airline, and its aisle width. Fourteen groups of experts used only the economy class seats. These floor plans were then photographed, and the potential additional revenues were calculated. The most profitable plan using premium economy class seats was using 28 seats of 18′′ ×30′′ and 20 seats of 17′′ ×34′′ resulting US$21,984 of potential revenue with the highest seat count with of 48 seats. Adding the business class seats to the floor plan did not increase the potential profit of the cabin section.
The results of the experts are then compared to the 126 layouts generated by computational algorithms. In these layouts, a rotation was allowed without considering comfort. The results show having a section with business class seats turned out to have a higher potential revenue of US$22,416. This combination has 32 seats of 18′′ ×30′′ rotated and 16 seats of 20′′ ×36′′. The highest seat count was 48, the same as the results from experts.
Overall, experts were better in using comfort knowledge and are more out-of-the-box in making future floor plans though some ideas bumped regulations. The results of the computer program had higher potential revenue by adding business class seats. The use of the computer resulted in optimal use of the space and would ensure all regulations are met, though some floor plans contained rotated seats where the comfort is still unknown.
This study explores this seat configuration modelling by aircraft interior experts, where comfort was one of the main goals. Besides the listed criteria, other researchers also investigated aircraft seating layout by measuring load/unload time of passengers [27–30]. Another study also tries to model an aircraft seat configuration by maximizing customer satisfaction and in-flight safety as well as being profitable for the airliners [31]. They utilized tools such as digital human models, layout optimization, and a profit-maximizing constraint to their model for an optimal floor plan. Further studies are needed to understand the impact of having different types of seats in one cabin, the effect on seat rotation, its effect on loading and unloading process and optimizing the floor plan based on those understandings.
There are several limitations to this study. Each airline has a different label for their premium economy class, where the seat space dimensions also differ among airlines. This study also did not clearly define the duration of the flight for the section of cabin designed. Moreover, there is a limited number of available references on premium economy class, especially with the same dimensions used during this study, limiting the discussion of this paper.
Conflict of interest
None to report.
Acknowledgments
The authors want to thank the Lembaga Pengelola Dana Pendidikan Republik Indonesia (Indonesian Endowment Fund for Education) for funding the PhD work of Shabila Anjani and the participants in the workshop.
References
[1] | Daft J , Albers S . A profitability analysis of low-cost long-haul flight operations. J Air Transp Manag [Internet]. (2012) ;19: (1):49–54. Available from: http://docs.lib.purdue.edu/jate/vol2/iss1/3/ |
[2] | Hunt J , Truong D . Low-fare flights across the Atlantic: Impact of low-cost, long-haul trans-Atlantic flights on passenger choice of Carrier. J Air Transp Manag [Internet]. (2019) ;75: :170–84. Available from: https://linkinghub.elsevier.com/retrieve/pii/S096969971830317X |
[3] | Thurlow C . Dissecting the language of elitism: The ‘joyful’ violence of premium. Lang Soc [Internet]. 2020;1–28. Available from: https://www.cambridge.org/core/product/identifier/S0047404519001015/type/journal_article |
[4] | Lee D , Luengo-Prado MJ . Are passengers willing to pay more for additional legroom? J Air Transp Manag [Internet]. (2004) ;10: (6):377–83. Available from: https://linkinghub.elsevier.com/retrieve/pii/S0969699704000365 |
[5] | Kurtulmuşoğlu FB , Can GF , Tolon M . A voice in the skies: Listening to airline passenger preferences. J Air Transp Manag. 2016; |
[6] | Kuo C-W , Jou R-C . Willingness to pay for airlines’ premium economy class: The perspective of passengers. J Air Transp Manag [Internet]. (2017) ;59: :134–42. Available from: https://linkinghub.elsevier.com/retrieve/pii/S0969699716303751 |
[7] | Espino R , Martín JC , Román C . Analyzing the effect of preference heterogeneity on willingness to pay for improving service quality in an airline choice context. Transp Res Part E Logist Transp Rev [Internet]. (2008) ;44: (4):593–606. Available from: https://linkinghub.elsevier.com/retrieve/pii/S1366554507000518 |
[8] | Hugon-Duprat C , O’Connell JF . The rationale for implementing a premium economy class in the long haul markets –Evidence from the transatlantic market. J Air Transp Manag [Internet]. (2015) ;47: :11–9. Available from: https://linkinghub.elsevier.com/retrieve/pii/S0969699715000277 |
[9] | Anjani S , Li W , Ruiter IA , Vink P . (In press) The effect of aircraft seat pitch on comfort. Appl Ergon. 2020; |
[10] | Anjani S , Song Y , Hou T , Ruiter IA , Vink P . The effect of 17 ′′ and 18′′ aircraft seat width on comfort. Manuscr Submitt Publ. 2019; |
[11] | Balcombe K , Fraser I , Harris L . Consumer willingness to pay for in-flight service and comfort levels: A choice experiment. J Air Transp Manag [Internet]. (2009) ;15: (5):221–6. Available from: https://linkinghub.elsevier.com/retrieve/pii/S0969699708001762 |
[12] | Jeon M-S , Lee J-H . Estimation of willingness-to-pay for premium economy class by type of service. J Air Transp Manag [Internet]. (2020) ;84: :101788. Available from: https://linkinghub.elsevier.com/retrieve/pii/S0969699719303783 |
[13] | Vink P , Brauer K . Aircraft interior comfort and design. 2011. |
[14] | Sezgen E , Mason KJ , Mayer R . Voice of airline passenger: A text mining approach to understand customer satisfaction. J Air Transp Manag [Internet]. (2019) ;77: :65–74. Available from: https://linkinghub.elsevier.com/retrieve/pii/S0969699718304873 |
[15] | Kim JH , Lee HC . Understanding the Repurchase Intention of Premium Economy Passengers Using an Extended Theory of Planned Behavior. Sustainability [Internet].Available from. (2019) ;11: (11):3213. Available from: https://www.mdpi.com/2071-1050/11/11/3213 |
[16] | Financial Times. Why airlines are rushing to add premium economy seats. Why airlines are rushing to add premium economy seats [Internet]. 2019; Available from: https://www.ft.com/content/41866d20-11f3-11ea-a225-db2f231cfeae |
[17] | CAPA Centre for Aviation. American, United, Delta Air: premium economy results encouraging [Internet]. Sydney; 2019. Available from: https://centreforaviation.com/analysis/reports/american-united-delta-air-premium-economy-results-encouraging-477523 |
[18] | Nghiêm-Phú B . What Determines the Loyalty of Airline Passengers? Findings of a Quantitative Data-Mining Study. Market-Tržište [Internet]. (2019) ;31: (1):23–37. Available from: https://hrcak.srce.hr/221239 |
[19] | Boeing. 787 Dreamliner by Design [Internet]. 2019 [cited 2019 Jun 3]. Available from: https://www.boeing.com/commercial/787/by-design/#/open-architecture |
[20] | Kollmus A , Lane J . Carbon Offsetting & Air Travel. Part 1: CO2-Emissions Calculations. Stockholm; 2008. |
[21] | Swan WM , Adler N . Aircraft trip cost parameters: A function of stage length and seat capacity. Transp Res Part E Logist Transp Rev [Internet]. (2006) ;42: (2):105–15. Available from: https://linkinghub.elsevier.com/retrieve/pii/S1366554505000761 |
[22] | Hiemstra-van Mastrigt S , Smulders M , Bouwens JMA , Vink P . Designing aircraft seats to fit the human body contour. In: DHMand Posturography [Internet]. Elsevier; 2019. pp. 781-9. Available from: https://linkinghub.elsevier.com/retrieve/pii/B9780128167137000611 |
[23] | Kokorikou A , Vink P , de Pauw IC , Braca A . Exploring the design of a lightweight, sustainable and comfortable aircraft seat. Vink P, Bazley CM, Jacobs K, editors. Work [Internet]. (2016) ;54: (4):941–54. Available from: https://www.medra.org/servlet/aliasResolver?alias=iospress&doi=10.3233/WOR-162352 |
[24] | Cui Y , Orhun AY , Duenyas I . How Price Dispersion Changes When Upgrades Are Introduced: Theory and Empirical Evidence from the Airline Industry. Manage Sci [Internet]. (2019) ;65: (8):3835–52. Available from: http://pubsonline.informs.org/doi/10.1287/mnsc.2018.3117 |
[25] | Jylänki J . A thousand ways to pack the bin-a practical approach to two-dimensional rectangle bin packing. Retrived From http//ClbDemonFi/Files/. . . .2010;1-50. |
[26] | Greghi MF , Rossi TN , de Souza JBG , Menegon NL . Brazilian passengers’ perceptions of air travel: Evidences from a survey. J Air Transp Manag [Internet]. (2013) ;31: :27–31. Available from: https://linkinghub.elsevier.com/retrieve/pii/S0969699712001512 |
[27] | Chung C . Simulation Design Approach for the Selection of Alternative Commercial Passenger Aircraft Seating Configurations. J Aviat Technol Eng [Internet]. (2012) ;2: (1):100–4. Available from: http://docs.lib.purdue.edu/jate/vol2/iss1/3/ |
[28] | Lusted M , Healey S , Mandryk JA . Evaluation of the seating of Qantas flight deck crew. Appl Ergon [Internet]. (1994) ;25: (5):275–82. Available from: https://linkinghub.elsevier.com/retrieve/pii/0003687094900418 |
[29] | McLean GA , Chittum CB , Funkhouser GE , Fairlie GW , Folk EW . Effects of seating configuration and number of type III exits on emergency aircraft evacuation [Internet]. 1992. Available from: https://rosap.ntl.bts.gov/view/dot/21397 |
[30] | Muir HC , Bottomley DM , Marrison C . Effects of Motivation and Cabin Configuration on Emergency Aircraft Evacuation Behavior and Rates of Egress. Int J Aviat Psychol [Internet]. (1996) ;6: (1):57–77. Available from: http://www.tandfonline.com/doi/abs/10.1207/s15327108ijap0601_4 |
[31] | Nadadur G , Parkinson MB . Using Designing for Human Variability to optimize Aircraft eat Layout. SAE Int J Passeng Cars - Mech Syst [Internet]. (2009) ;2: (1):2009–01-2310. Available from: https://www.sae.org/content/2009-01-2310/ |

