
A simple segmentation and quantification method for numerical quantitative analysis of cells and tissues
Abstract
BACKGROUND:
Microscopic image analysis based on image processing is required for quantitative evaluation of decellularization. Existing methods are not widely used because of expensive commercial software, and machine learning-based techniques lack generality for decellularization because many high-resolution image data has to be processed.
OBJECTIVE:
In this study, we developed an image processing algorithm for quantitative analysis of tissues and cells in a general microscopic image.
METHODS:
The proposed method extracts the color images obtained by the microscope into reference images consisting of grayscale, red (R), green (G), and blue (B) information and transforms each into a binary image. The transformed images were extracted by separating the cells and tissues through outlier noise elimination, logical multiplication and labeling. In order to verify the method, decellularization of porcine arotic valve was performed by the electrical method. Slice samples were obtained by time and the proposed method was applied.
RESULTS:
The experimental results show that the segmentation of cells and tissues, and quantitative analysis of the number of cells and changes in tissue area during the decellularization process was possible.
CONCLUSIONS:
The proposed method shows that cell and tissue extraction and quantitative numerical analysis were possible in different brightness of microscopic images.
1.Introduction
Recently, regenerative medicine-related research including stem cell as well as tissue engineering and cell therapy have been actively conducted as an alternative treatment for intractable diseases and organ transplantation [1, 2, 3, 4]. Regenerative medicine has been recognized as a new medical technology that can fundamentally restore cell death or tissue dysfunction, which is the cause of disease [3, 5, 6]. Key technologies for this purpose include cell manufacturing technology, growth factors and drug delivery technology to induce tissue regeneration, and biomaterial manufacturing. On the other hand, organ transplantation refers to a series of procedures in which the organs within the body of a patient are transferred to another site or the organs received from another person are replaced. This is called auto and allogeneic transplantation, respectively. In the case of organ transplantation in brain death patients, it is called deceased donor transplantation. Therefore, the organs of the body are being performed for the healing of the patients when they are in a state of irreversible treatment by a medical method due to severe damage and external force due to serious pathology. In recent years, the number of patients for organ transplantation has been increasing every year due to chronic functional deterioration of organs due to environmental factors [7, 8]. However, in cases other than auto transplantation, it is essential to confirm the adequacy of donor and donor transplantation before organ transplantation due to gene compatibility, blood compatibility, and defense mechanisms due to immunity. However, this procedure is very time-consuming or rarely suitable. Therefore, organ transplantation is often performed when the life-threatening condition is not met [9, 10]. There is a risk of complications due to the use of immunosuppressive drugs to suppress the prognosis after transplantation [11].
In recent years, research has been actively carried out to artificially construct organs that match genes or utilize the tissues of patients themselves in organ transplantation field, as well as biomaterial manufacturing technology related to cell and tissue regeneration in the field of regenerative medicine [1, 12, 13]. For this purpose, it is necessary to improve the physical properties that can serve as the structural skeleton of the artificial tissue, which is required for the characteristics of the biological material, the adhesion and proliferation capacity of the cells, the compatibility with the surrounding tissues without inflammation, specific functionality and so on. In order to meet these various demands, studies on biomaterials related to synthetic materials, extracted natural materials, materialization of cells or tissues of animals or human bodies, and extracellular matrix-derived biomaterials have also been carried. Among these methods, 3-Dimensional bioprinting technology has been recently performed in terms of manufacturing biometrics and precise control of printing. However, further studies are needed to establish stable structures of the arteries, veins, capillaries, and cells in which the target organ or tissue can function, shape and maintain homeostasis [14, 15]. Therefore, in practical terms, tissues to be regenerated or organs to be transplanted which similar in structure and function are extracted from large animals (dogs, pigs, rabbits, etc.), and then the cells present in the extracted object are completely removed. After this process, a method of using the remaining structure as a scaffold has been actively studied. This process of removing cells is called decellularization [14, 16, 17].
In order to increase the efficacy of decellularization, the cells and genes of the tissue must be completely removed, and the extracellular matrix (ECM) and mechanical properties used as scaffold must be preserved while maintaining the physical properties of the tissue [18, 19]. Therefore, most decellularization studies have focused on methodological aspects to induce necrosis of the cells. Currently, chemical, optical and electrical methods are mainly used [20, 21, 22]. However, in order to quantitatively evaluate and analyze the results of the degree of necrosis on each of the methodological aspects, an open source image processing programs such as Image J or a software tool provided by a microscope vendor are used. These software offer various functions for analysis, but they are composed mainly of functions that are widely used for general purposes and are expensive [20, 22]. Recently, studies on quantification and classification have been attempted by using pattern recognition in the data science field, but the environment is limited because high-resolution microscopic image samples with specific image format are required for high accuracy [23, 24, 25, 26].
Therefore, this study proposed a simple and general-purpose image processing technique that can segment and quantify cells and tissues. In order to verify the proposed method, decellularization was induced by electrical method on porcine arotic valve. Through the analysis of the microscopic image over time, it was confirmed that the degree of cell death and the change of tissue can be extracted quantitatively.
2.Materials and methods
2.1Developing an image processing algorithm
To implement the proposed method, a MATLAB software (Mathworks Inc., Natick, MA, USA) which is widely used as a numerical analysis tool was used. Using the obtained microscope image, the degree of cell death and the tissue structure were quantitatively calculated and presented as % value through MATLAB statistical functions. The proposed segmentation method is based on the edge detection of the image [27]. The overall flow diagram of the proposed algorithm is shown in Fig. 1.
Figure 1.
Flow of the proposed image processing algorithm for segmentation and quantification of cell and tissue from microscopic images.
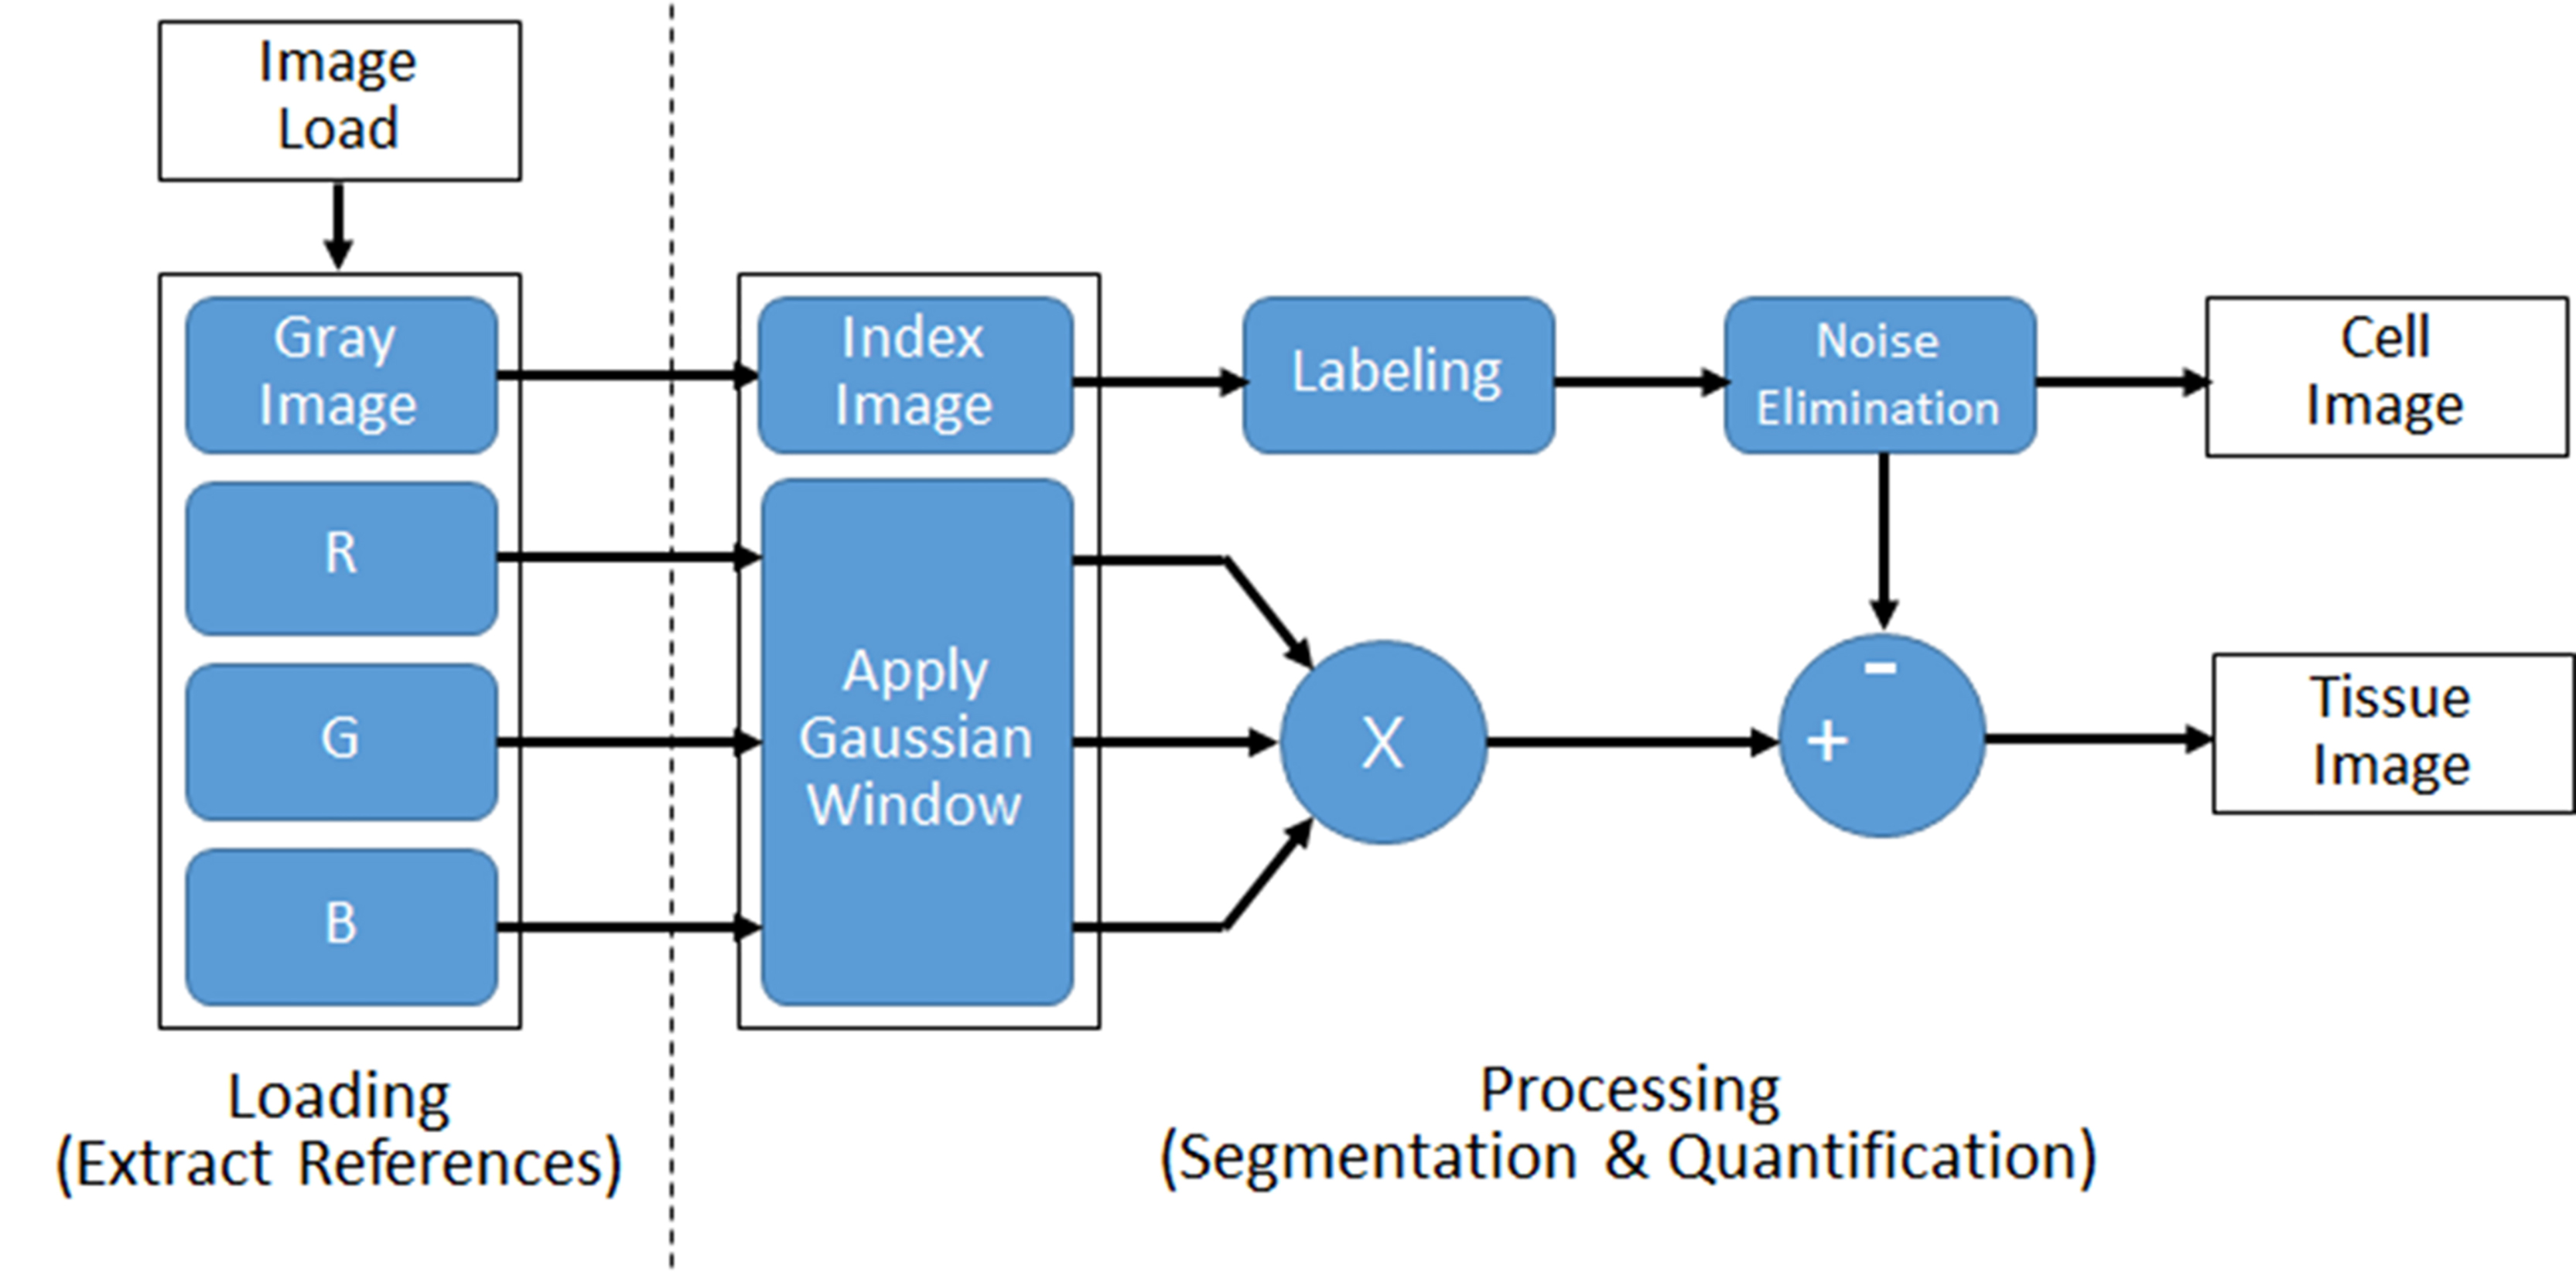
The method consists of two steps. In the first step, the colored-raw image obtained from the microscope is loaded and four reference images are extracted. In order to compensate the color image, the grayscale image is used as the first reference image because the brightness of the image is different depends on the microscope image acquisition environment. Also, three reference images were extracted by separating red (R), green (G), and blue (B) components.
Figure 2.
Flowchart of the proposed image segmentation method.
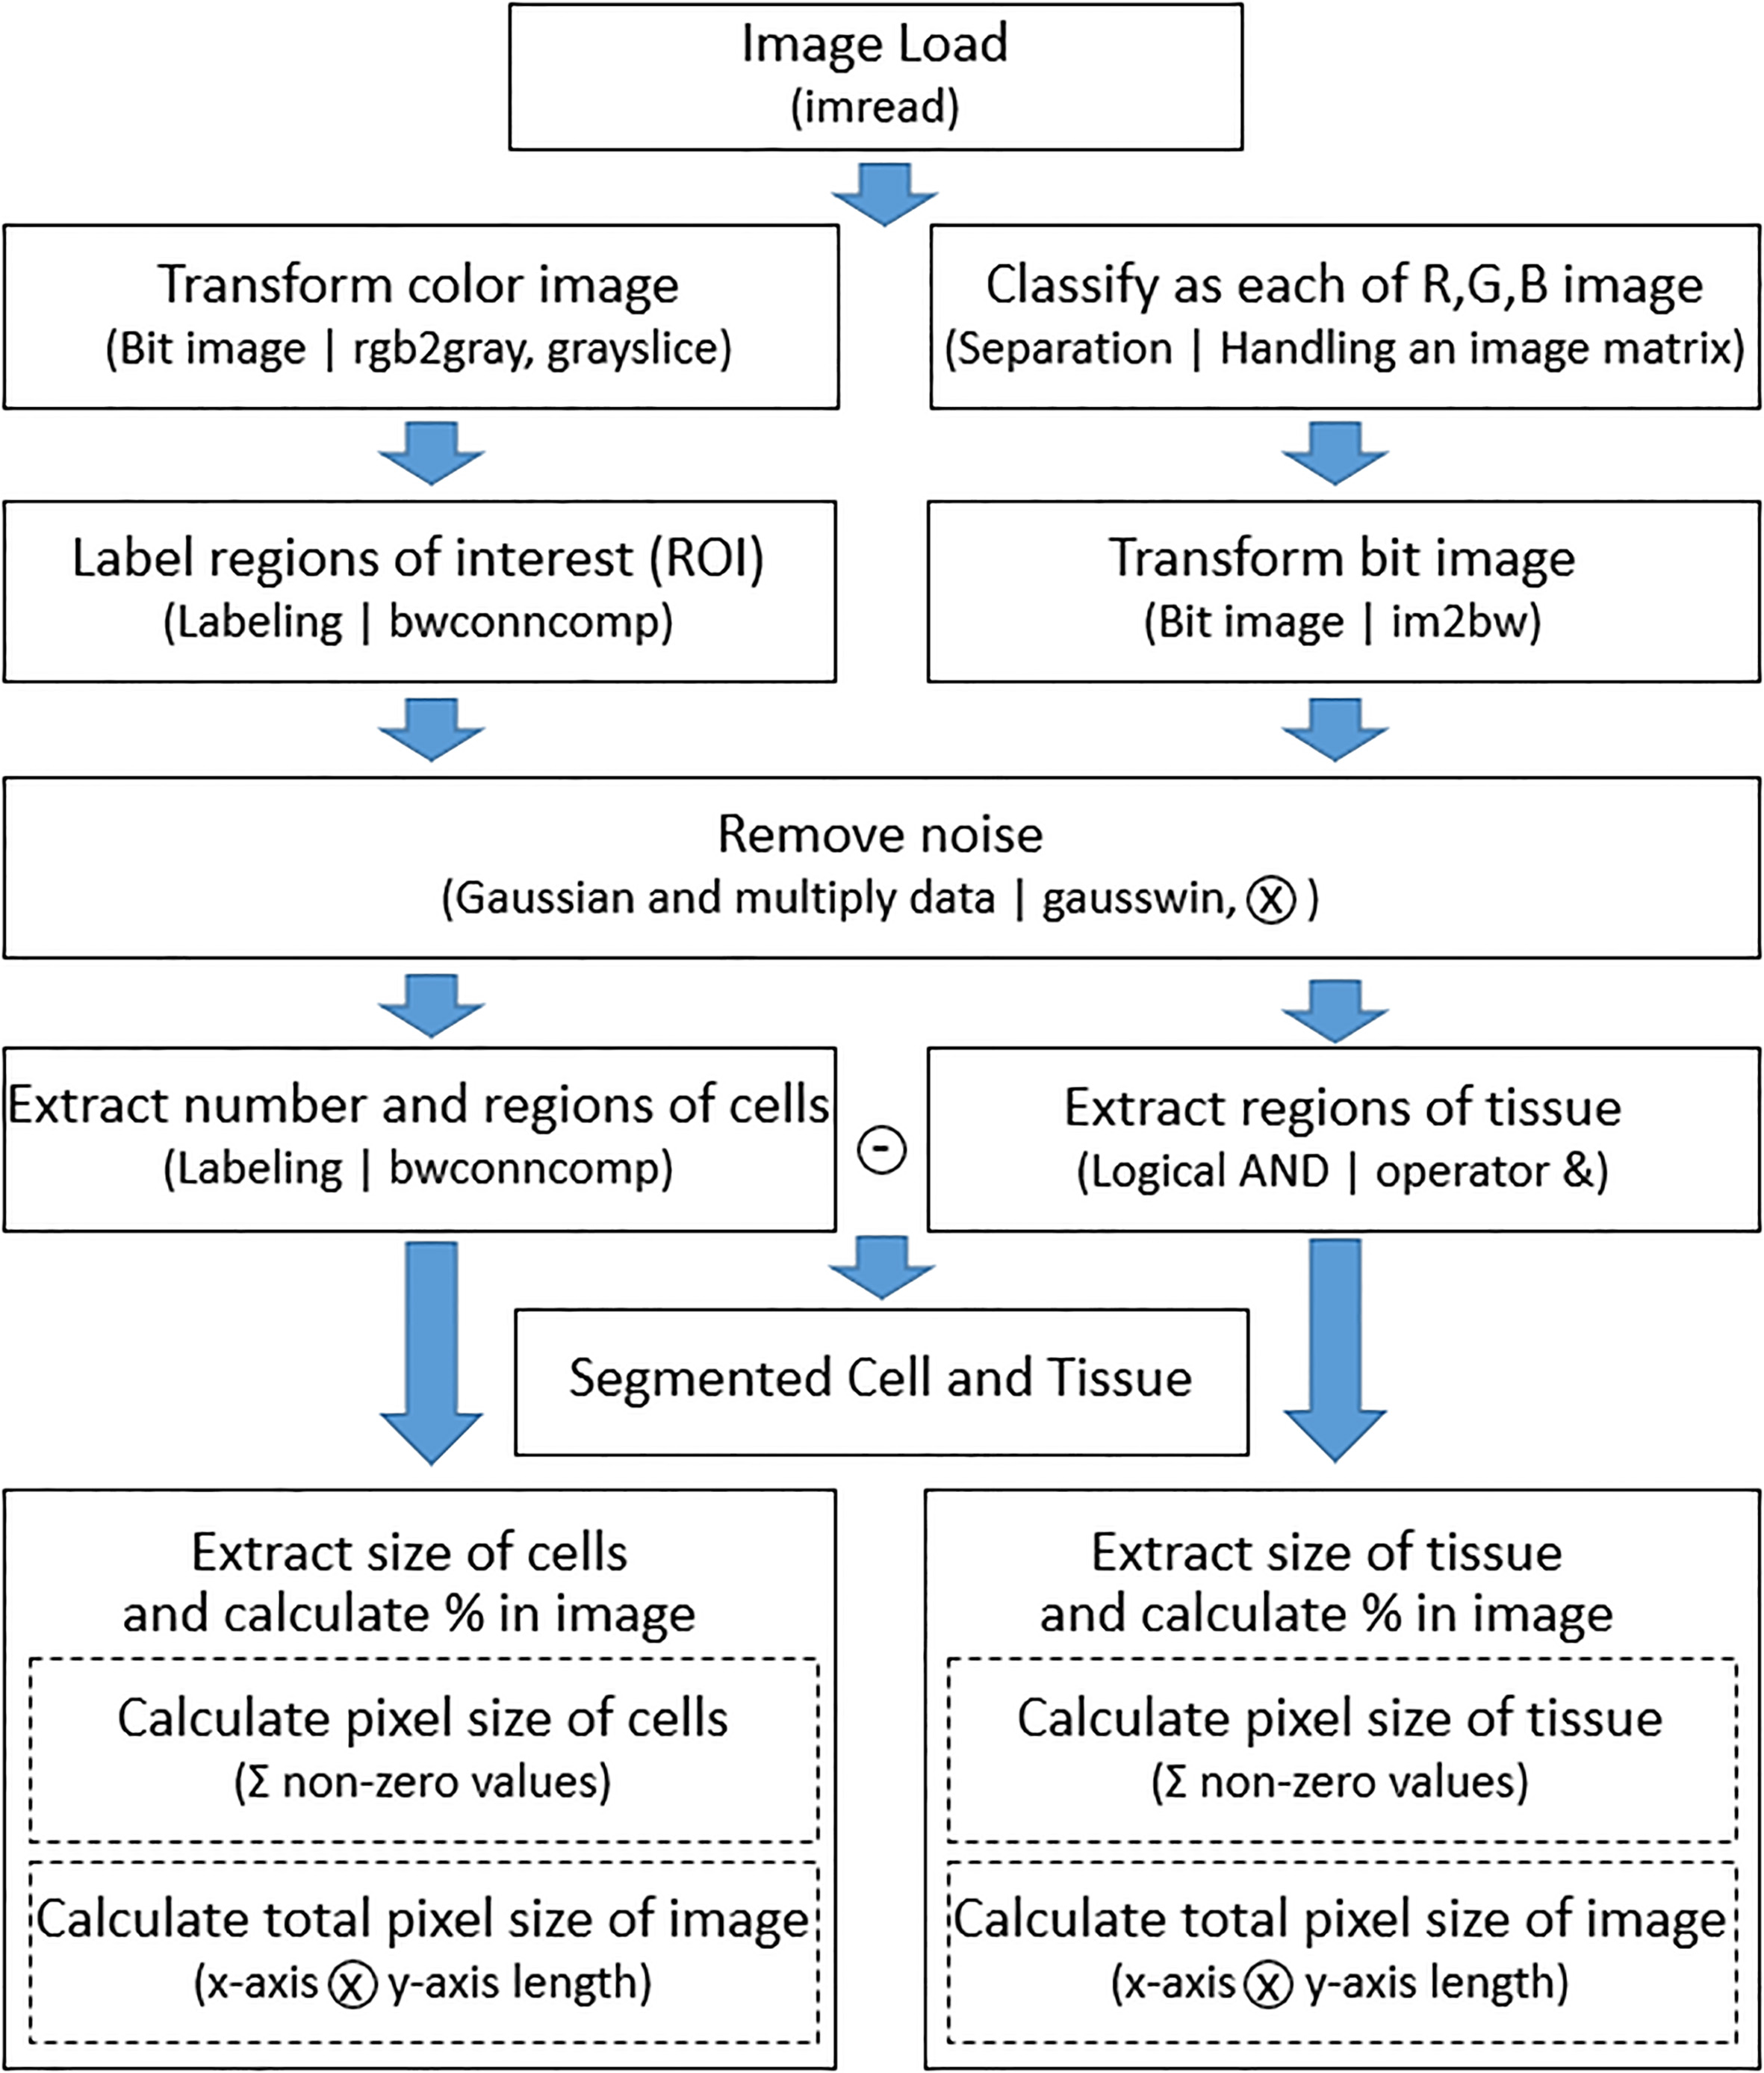
In the second step, image processing is performed using reference images. Grayscale image reference was used to extract cell information. Generally, in a microscopic image sample in which cell and tissue are present at the same time, the cell has a high contrast to the surrounding tissue, so that it can be easily distinguished by adjusting the intensity with grayscale. Therefore, the color image is converted into grayscale and converted into a two-step indexed binary image. The labeling was applied to remove the noise of the binarized image. Labeling is a method of assigning the same index number to all adjacent or connected pixels in one image and assigning different numbers to other pixels. Since the number of index numbers assigned to each pixel can be counted, this was used to remove noise [28]. In a slice image, those labeled-pixels that are not included in the
2.2Decellularization process and apparatus
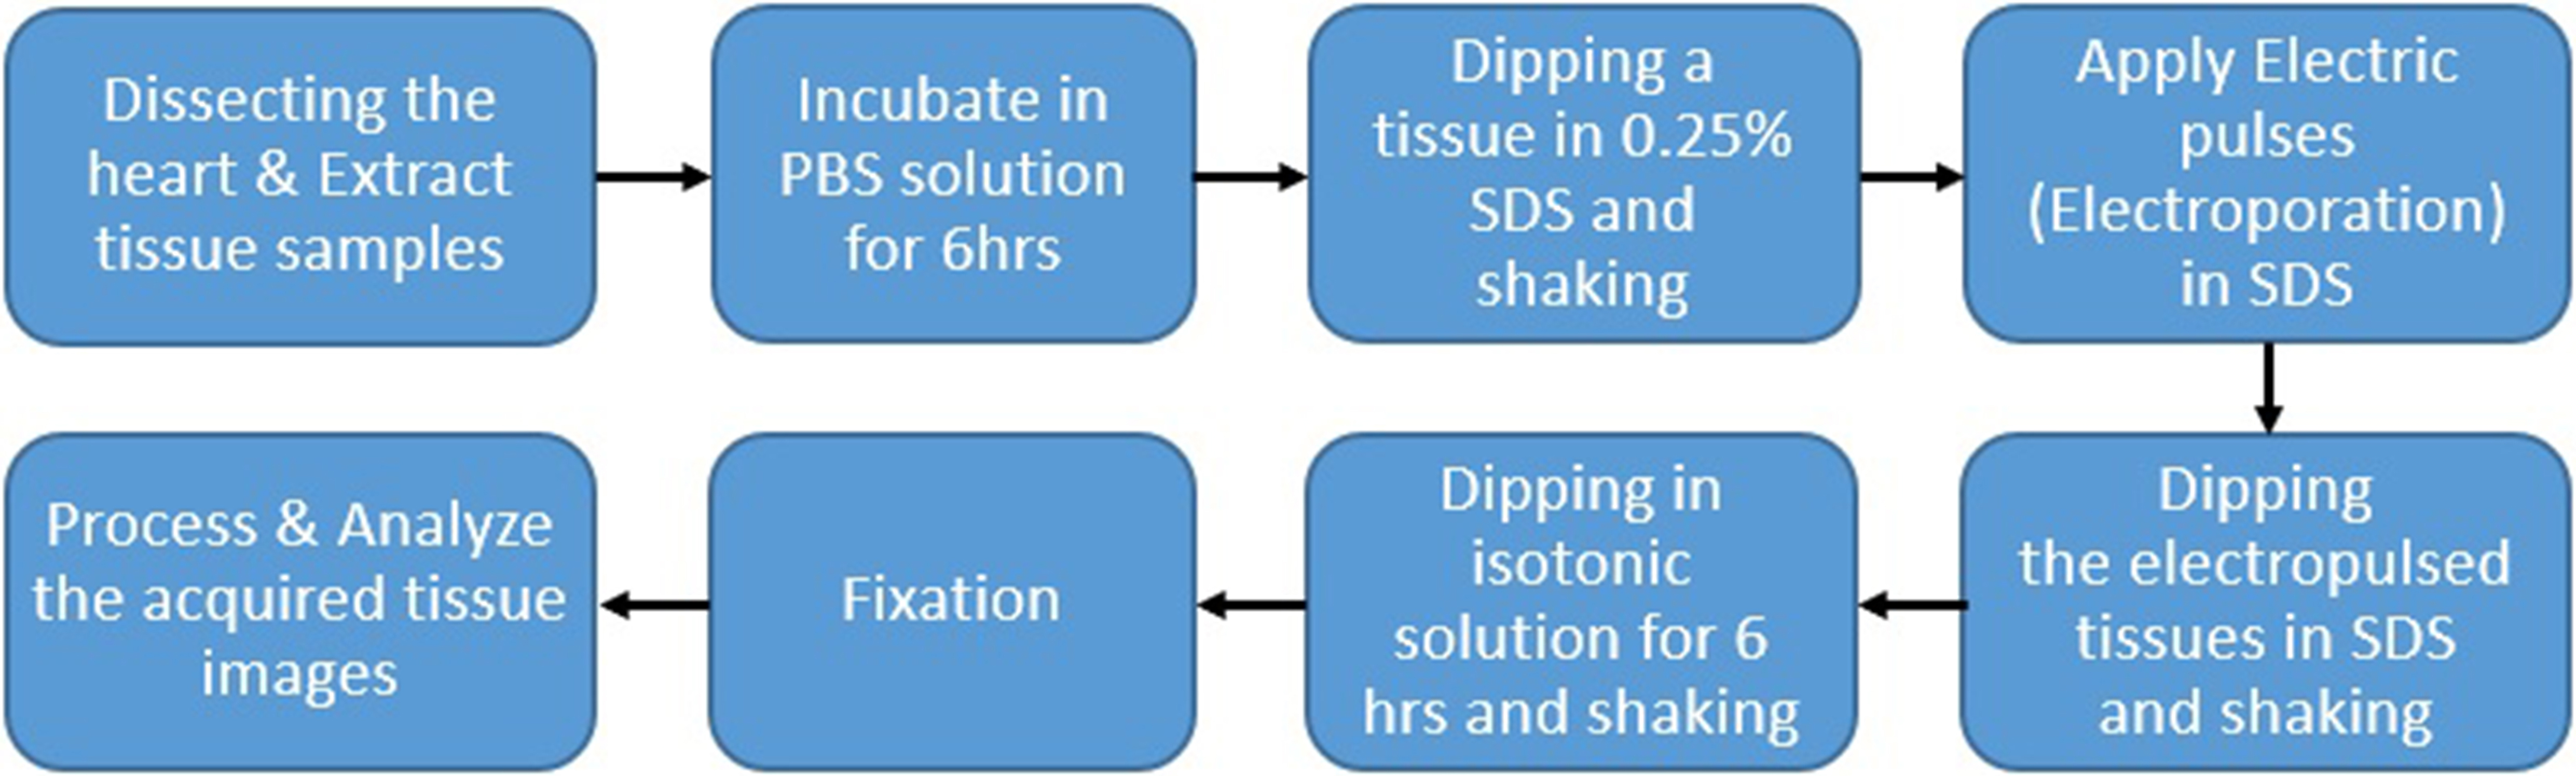
To verify the developed algorithm, we applied decellularization to porcine arotic valve and observed cell and tissue changes. Hearts and pericardium of healthy pigs slaughtered at the slaughterhouse were collected under the cooperation of a veterinarian and the remaining blood was washed and stored in 4
Figure 3.
Illustration of the procedures for the experimental protocol.
3.Results
Figure 4 shows the results of applying the proposed algorithm to images obtained by microscope. Figure 4A, D, G is a raw color image with different brightness and Fig. 4G is the brightest in order. Figure 4B, E, H is a cell image extracted from each color image. Figure 4C, F, I is the result of extracting tissue area. It is possible to calculate the number and area of cells and to check the structure of tissues even with different brightness microscope images.
Figure 4.
Extracted cell and tissue images from colored microscopic images with different brightness. (A) is high brightness, (D) is medium brightness, (G) is relatively darker brightness than (A) and (D). (B), (E), (H) are extracted cells and (C), (F), (I) are segmented tissue images.
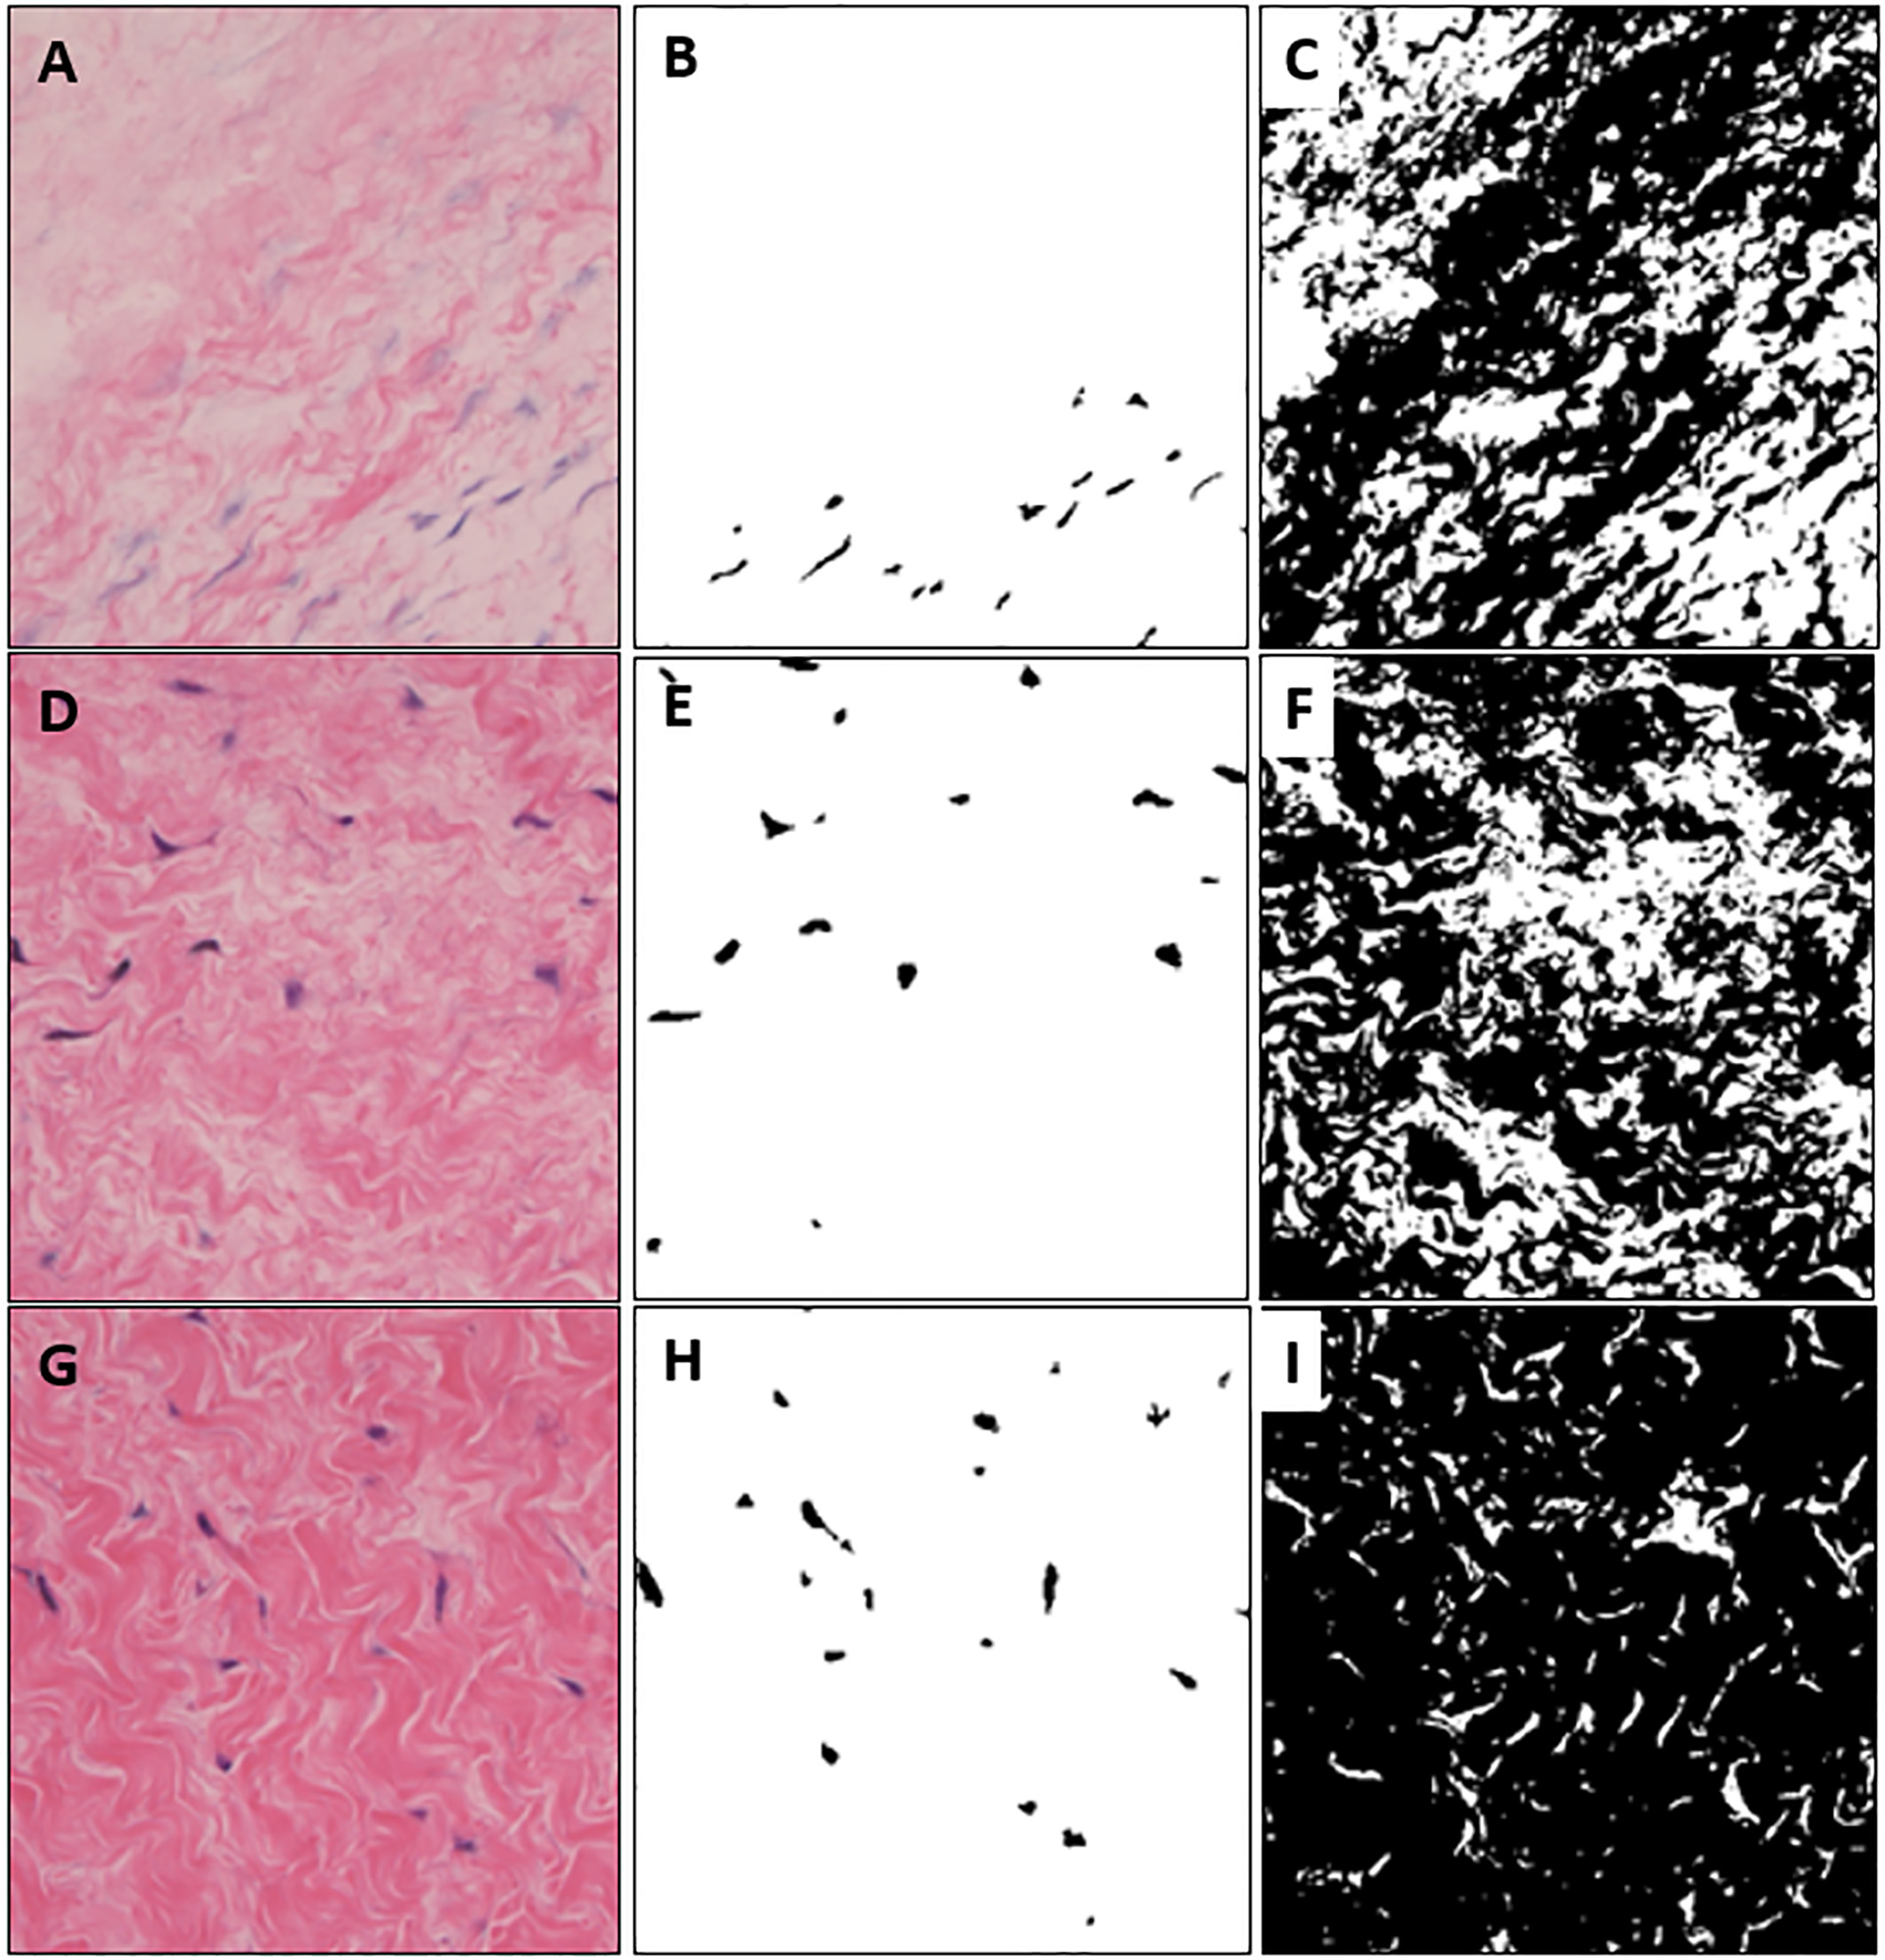
Figure 5 shows the results of a Gaussian-weighted image applied to compensate for some of the colors of the tissue in the raw-colored image. If the Gaussian is not applied to the high intensity region shown in Fig. 5A, all the regions are recognized as cells shown in Fig. 5B. However, in Fig. 4C with Gaussian, it is confirmed that the cell area is extracted correctly.
Figure 5.
Results of Gaussian-weighted image and comparison of cell extraction. (A) is a raw-colored image with high-intensity tissue regions. (B) is the result of recognition of tissue as a cell by high-intensity tissue regions. (C) shows the error correction by the Gaussian-weighted method.
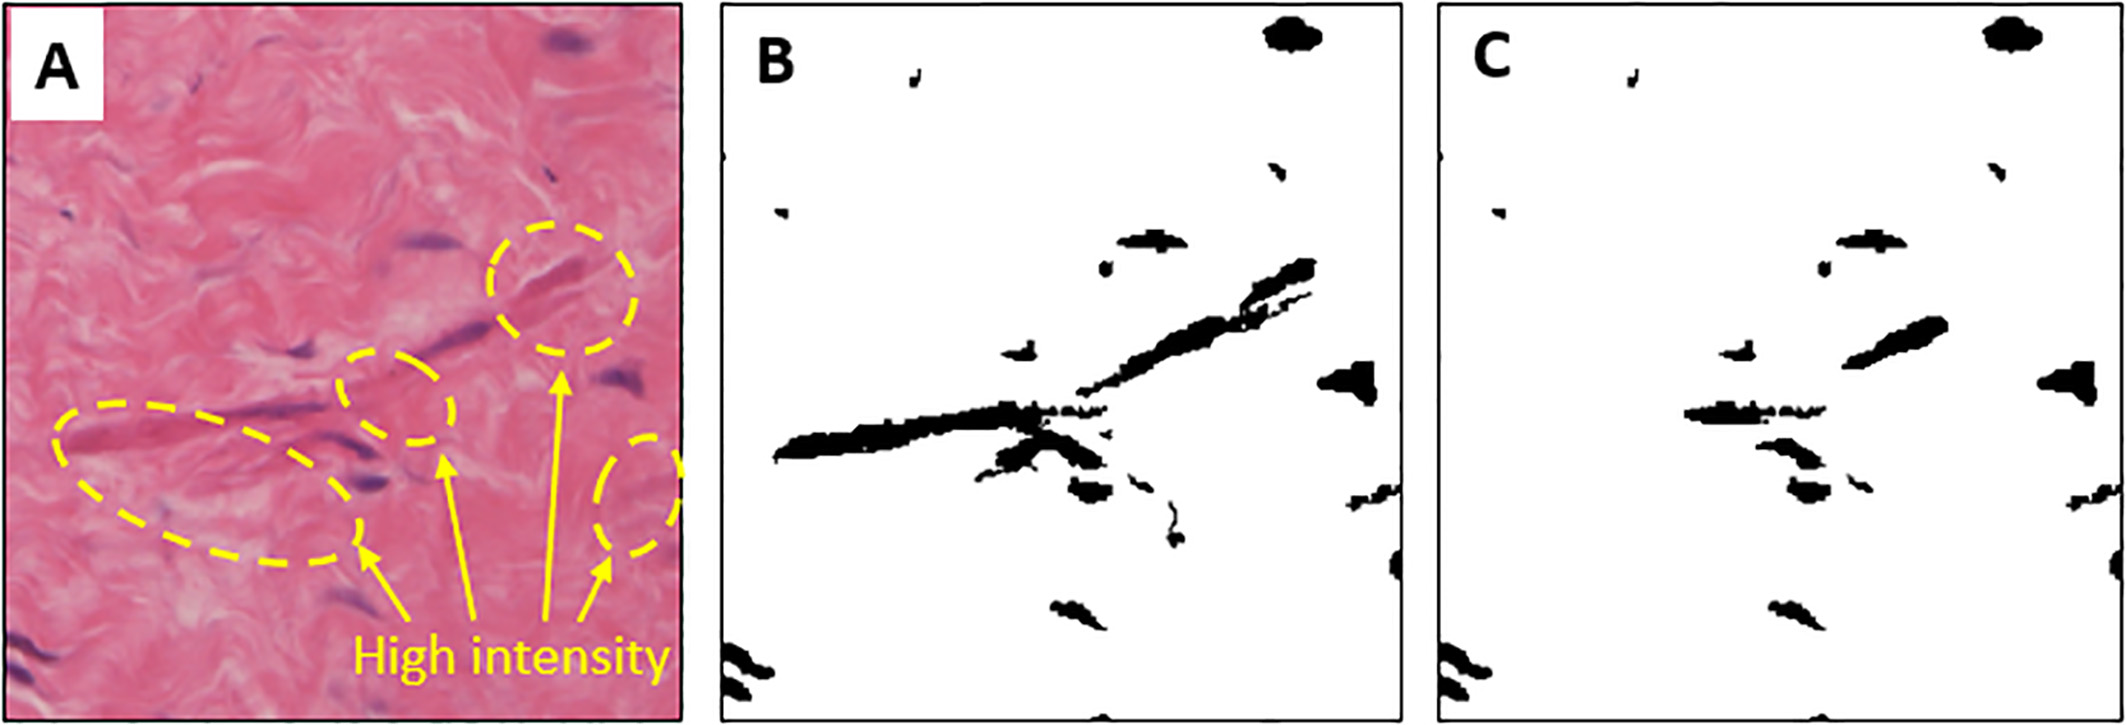
Figure 6 shows the actual output of the electric pulse applied to the porcine arotic valve. Pulse parameters of the set amplitude of voltage, pulse width, pulse interval and number of pulses were output correctly. The maximum current at 280 volts/cm, which is the highest voltage used in the experiment, was about 140 mA. 100 and 200 volts/cm were 53 mA and 110 mA, respectively. In all three cases, the magnitude of the first flowing current was smallest and gradually increased to the fifth pulse. The magnitude of the current flowing from the sixth pulse did not change. This is because cell membrane changes after electroporation caused changes in permeability [29, 30].
Table 1 shows the results of counting cells by time from the labeling results for the acquired image samples. In addition, to confirm the proposed image processing algorithm, we compared the number directly counted and calculate the absolute percentage error. Compared with the actual number of cells, the difference is very small and it is confirmed that the cells are extracted correctly.
Table 1
Number of cells and absolute percentage error over time before and after decellularization
| Naive | 1 hr | 2 hr | 5 hr | 8 hr | ||
|---|---|---|---|---|---|---|
| 100 volts/cm | N, n | 38, 38 | 36, 34 | 31, 31 | 15, 15 | 13, 13 |
| % Abs. Err | 0.00 | 0.06 | 0.00 | 0.00 | 0.00 | |
| 200 volts/cm | N, n | 22, 24 | 22, 22 | 18, 18 | 8, 8 | 5, 5 |
| % Abs. Err | 0.09 | 0.00 | 0.00 | 0.00 | 0.00 | |
| 280 volts/cm | N, n | 31, 33 | 28, 29 | 20, 19 | 12, 12 | 9, 9 |
| % Abs. Err | 0.06 | 0.04 | 0.05 | 0.00 | 0.00 |
N: number of cells after image processing, n: number of cells counted directly.
Table 2
Changes in cell and tissue area according electric voltage and time after electroporation (Unit: %)
| Naive | 1 hr | 2 hr | 5 hr | 8 hr | ||
|---|---|---|---|---|---|---|
| 100 volts/cm | Cell area | 3.12 | 2.98 | 2.46 | 1.60 | 1.39 |
| Tissue area | 93.83 | 93.01 | 92.88 | 92.41 | 90.36 | |
| 200 volts/cm | Cell area | 4.91 | 4.57 | 4.01 | 2.46 | 1.87 |
| Tissue area | 93.11 | 91.24 | 89.86 | 89.10 | 87.47 | |
| 280 volts/cm | Cell area | 3.98 | 3.66 | 2.47 | 1.09 | 0.76 |
| Tissue area | 94.37 | 92.89 | 91.17 | 87.47 | 84.34 |
Figure 6.
Applied voltage and current pulse waveforms used for the electroporation method.
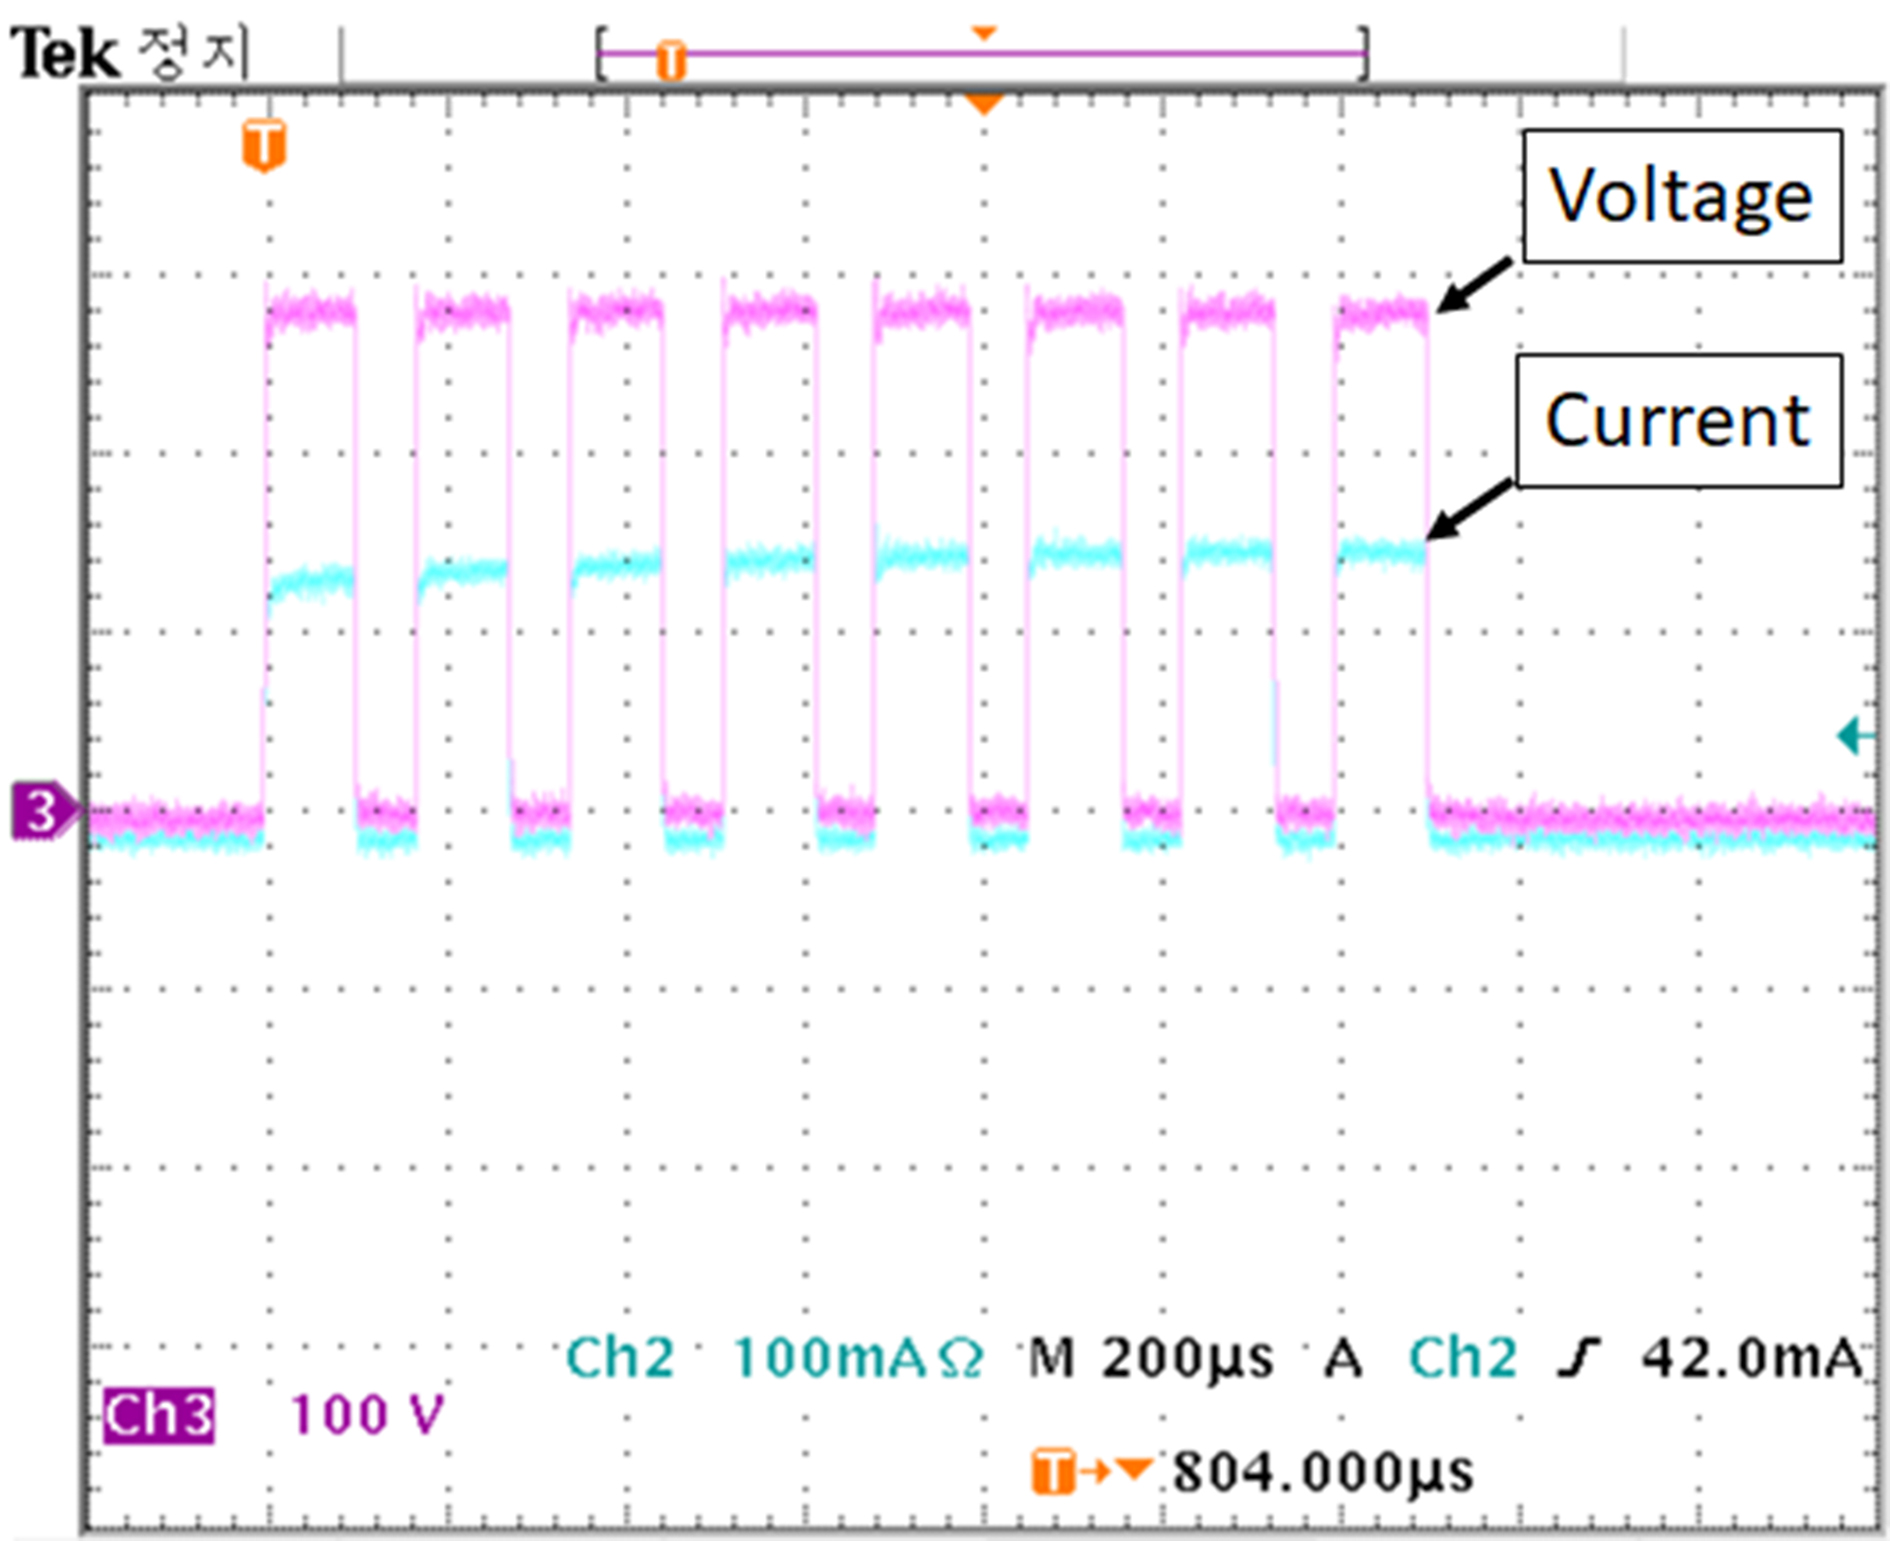
Table 2 shows the change of cell and tissue area by voltage and time before and after electroporation using proposed image processing algorithm. All results are expressed in % and calculated using the standard deviation function of MATLAB used for the application of the image processing algorithm.
After applying electroporation to porcine arotic valve samples, slice analysis was performed by time. After 1 hour and 2 hours after the electroporation, the changes were less, but after 5 hours, the cell and tissue area changes were significant at all three voltages. After 8 hours, the cell area changed to
4.Discussion
In this study, we developed an image processing algorithm that can extract cell and tissue separately and analyze quantitatively in color microscope image. This study started with the hypothesis that time-based quantitative evaluation of tissue images before and after decellularization can be performed using RGB separation and binarization of color images. The developed algorithm was able to quantitatively analyze the cell and tissue of a single image, rather than a complex computation or analysis based on a lot of high quality image data. In addition, it was possible to calibrate the brightness of the color which varies depending on the microscope equipment or the experiment environment. These results can be more objectively compared to the comparison between pre- and post-experiment photographs, which were used in previous tissue and cell related analysis studies [14, 15, 20, 22]. In addition, quantitative analysis can be done by time and the results are presented in %, so the interpretation of results is simple [17, 26]. To verify the proposed algorithm, electric pulse was applied to a porcine arotic valve and time-dependent analysis of decellularization was performed. It is possible to quantitatively calculate the number of cells, area and tissue area from extracted microscope images, even at different brightness. Also, time series analysis after decellularization was possible, and there was very small absolute percentage error compared to the direct counting method. These data mean support our hypotheses. It is simpler than the method of separating tissue and cell by using existing machine learning [24, 25, 26, 28], and compared with the existing methods, it is easy to use because there is no need of many microscope images used for learning algorithm application [1, 24, 25]. Experimental results showed that cell necrosis rapidly progressed after about 2 hours. In the case of 280 volts/cm, most cells died after 8 hours. There was little change in tissue structure. In the experiment by applied different voltage, the cell death rate was higher at higher voltage. This is because the electric energy calculated from the measured voltage and current was 1.06 mJ, 4.4 mJ, and 7.84 mJ as the applied voltage was higher.
Since the developed image processing algorithm enables quantitative analysis of cell and tissue changes, it can be used to control the electric pulse parameters such as voltage, pulse width, interval, and number of pulses in the electroporation field or to conduct quantitative evaluation by decellularization methods. In addition, it is possible to calibrate different microscope images according to the imaging environment, it is expected that it can be used in various fields where quantitative evaluation of cells and tissues is required.
Acknowledgments
This paper was supported by Konkuk University in 2018.
Conflict of interest
None to report.
References
[1] | Dzobo K, Thomford NE, Senthebane DA, et al. Advances in regenerative medicine and tissue engineering: innovation and transformation of medicine. Stem Cells Int. (2018) ; 2495848. |
[2] | Morikuni T. Current state and issues related to cell therapy under the act on the safety of regenerative medicine. Personal Med Univer. (2018) ; 7: : 37-38. |
[3] | Ranjeet SM. Stem cells applications in regenerative medicine and disease therapeutics. Int J of Cell Biol. (2016) ; 2016: : 6940283. |
[4] | Zakrzewski W, Dobrzyński M, Szymonowicz M, Rybak Z. Stem cells: past, present, and future. Stem Cell Res Ther. (2019) ; 10: (1): 68. |
[5] | Angelo SM, David JM. Regenerative medicine: Current therapies and future directions. Proc Natl Acad Sci USA. (2015) ; 112: (47): 14452-14459. |
[6] | John G, Andrew W, Jacqueline B. Anticipating the clinical adoption of regenerative medicine: building institutional readiness in the UK. Regen Med. (2018) ; 13: (1): 29-39. |
[7] | Alyssa W, David KK, Kate MF, et al. Social, economic, and policy implications of organ preservation advances. Curr Opin Organ Transplant. (2018) ; 23: (3): 336-346. |
[8] | Leonardo VR, Jessamyn B, John I, Maria-Luisa A. Impact of environmental factors on alloimmunity and transplant fate. J Clin Invest. (2017) ; 127: (7): 2482-2491. |
[9] | Aikawa A. Current status and future aspects of kidney transplantation in Japan. Renal Replace Therapy. (2018) ; 4: : 50. |
[10] | Dicks SG, Northam H, van Haren FMP, Boer DP. An exploration of the relationship between families of deceased organ donors and transplant recipients: A systematic review and qualitative synthesis. Health psychol Open. (2018) ; 5: (1): 2055102918782172. |
[11] | Albekairy AM, Abdel-Razaq WS, Alkatheri AM, et al. The impact of immunosuppressant therapy on the recurrence of hepatitis C post-liver transplantation. Int J Health Sci. (2018) ; 12: (4): 78-87. |
[12] | Chen FM, Liuc X. Advancing biomaterials of human origin for tissue engineering. Prog Polym Sci. (2016) ; 53: : 86-168. |
[13] | Donderwinkel I, van Hest JCM, Cameron NR. Bio-inks for 3D bioprinting: recent advances and future prospects. Polymer Chemistry (2017) ; 8: : 4451-4471. |
[14] | Ahmed M, Raja KV, James St. J, et al. Three-dimensional printing of biological matters. J Sci Adv Mater Devices. (2016) ; 1: : 1-17. |
[15] | Elliot SB, Sami M, Mikhail P, et al. 3-D bioprinting technologies in tissue engineering and regenerative medicine: Current and future trends. Genes Dis. (2017) ; 4: (4): 185-195. |
[16] | Robb KP, Shridhar A, Flynn LE. Decellularized matrices as cell-instructive scaffolds to guide tissue-specific regeneration. ACS Biomater Sci Eng. (2018) ; 4: (11): 3627-3643. |
[17] | Lisa JW, Adam JT, Denver MF, et al. The impact of detergents on the tissue decellularization process: a ToF-SIMS study. Acta Biomater. (2017) ; 50: : 207-219. |
[18] | Farag A, Vaquette C, Theodoropoulos C, et al. Decellularized periodontal ligament cell sheets with recellularization potential. J Dent Res. (2014) ; 93: (12): 1313-1319. |
[19] | Kusuma GD, Brennecke SP, O’Connor AJ, et al. Decellularized extracellular matrices produced from immortal cell lines derived from different parts of the placenta support primary mesenchymal stem cell expansion. PLOS One. (2017) ; 12: : e0171488. |
[20] | Anna G, Yong Y. Decellularization Strategies for Regenerative Medicine: From Processing Techniques to Applications. Biomed Res Int. (2017) ; 2017: : 9831534. |
[21] | Gupta SK, Mishra NC, Dhasmana A. Decellularization methods for scaffold fabrication. Methods Mol Biol. (2018) ; 1577: : 1-10. |
[22] | Keane TJ, Swinehart IT, Badylak SF. Methods of tissue decellularization used for preparation of biologic scaffolds and in vivo relevance. Methods. (2015) ; 84: : 25-34. |
[23] | Chen LC, Papandreou G, Kokkinos I, et al. Deeplab: Semantic image segmentation with deep convolutional nets, atrous convolution, and fully connected CRFs. IEEE Trans Pattern Anal Mach Intelli. (2018) ; 40: : 834-848. |
[24] | Kan A. Machine learning applications in cell image analysis. Immunol Cell Biol. (2017) ; 95: (6): 525-530. |
[25] | Mahfouzi SH, Amoabediny G, Doryab A, et al. Noninvasive Real-Time Assessment of Cell Viability in a Three-Dimensional Tissue. Tissue Eng Part C Methods. (2018) ; 24: (4): 197-204. |
[26] | Xie W, Noble JA, Zisserman A. Microscopy cell counting and detection with fully convolutional regression networks. Comput Methods Biomechs Biomed Eng. (2016) ; 6: : 1-10. |
[27] | Hossain MD, Chen D. Segmentation for Object-Based Image Analysis (OBIA): A review of algorithms and challenges from remote sensing perspective. J Photogram Remote Sens. (2019) ; 150: : 115-134. |
[28] | Shao Z, Yang K, Zhou W. Performance Evaluation of Single-Label and Multi-Label Remote Sensing Image Retrieval Using a Dense Labeling Dataset. Remote Sens. (2018) ; 10: (6): 964. |
[29] | Pavlin M, Kandušer M, Reberšek M, et al. Effect of Cell Electroporation on the Conductivity of a Cell Suspension. Biophys J. (2005) ; 88: (6): 4378-4390. |
[30] | Napotnik TB, Miklavčič D. In vitro electroporation detection methods – An overview. Bioelectrochemistry. (2018) ; 120: : 166-182. |

