
Grey matter connectivity within and between auditory, language and visual systems in prelingually deaf adolescents
Abstract
Purpose: Previous studies have shown brain reorganizations after early deprivation of auditory sensory. However, changes of grey matter connectivity have not been investigated in prelingually deaf adolescents yet. In the present study, we aimed to investigate changes of grey matter connectivity within and between auditory, language and visual systems in prelingually deaf adolescents.
Methods: We recruited 16 prelingually deaf adolescents and 16 age-and gender-matched normal controls, and extracted the grey matter volume as the structural characteristic from 14 regions of interest involved in auditory, language or visual processing to investigate the changes of grey matter connectivity within and between auditory, language and visual systems. Sparse inverse covariance estimation (SICE) was utilized to construct grey matter connectivity between these brain regions.
Results: The results show that prelingually deaf adolescents present weaker grey matter connectivity within auditory and visual systems, and connectivity between language and visual systems declined. Notably, significantly increased brain connectivity was found between auditory and visual systems in prelingually deaf adolescents.
Conclusions: Our results indicate “cross-modal” plasticity after deprivation of the auditory input in prelingually deaf adolescents, especially between auditory and visual systems. Besides, auditory deprivation and visual deficits might affect the connectivity pattern within language and visual systems in prelingually deaf adolescents.
1Introduction
Brain plasticity has been widely reported in prelingually deaf subjects due to deprivation of the auditory sensory input. The auditory cortex in deaf subjects can be activated by various tasks, such as speech (Macsweeney et al., 2001, 2002; Nishimura et al., 1999; Yoshida et al., 2011) and visual stimuli (Fine et al., 2005; Finney et al., 2001, 2003; Karns et al., 2012), which is a phenomenon known as “cross-modal plasticity”. Additionally, brain regions involved in language and visual functions change in deaf subjects as demonstrated by many studies (Macsweeney et al., 2009; Li et al., 2012), which is suggested to be caused by the use of sign language as well as the lower level of reading or speaking skills observable in deaf youngsters (Hollingsworth et al., 2014, for review; Parasnis et al., 2003; Pavani and Bottari, 2012; Quittner et al., 2004). Therefore, it is interesting to investigate the alterations of brain regions involved in auditory, language and visual processing in prelingually deaf adolescents.
Brain connectivity provides a new insight into brain abnormalities due to aging or diseases, and is critical to understand how neurons and neural networks process information. As reported by the literatures, the patterns of connectivity in human brains are vulnerable to aging (Meunier et al., 2009; St Jacques et al., 2009) as well as various neuropsychiatric diseases, such as schizophrenia (Garrity et al., 2007; Meyer-Lindenberg et al., 2005; Skudlarski et al., 2010), Alzheimer’s disease (Grady et al., 2001; Stam et al., 2007; Supekar et al., 2008; Wang et al., 2006), and autism (Rippon et al., 2007; Wass, 2011). The connectivity pattern is formed by structural links or statistical relationship. Functional connectivity captures statistical relationship between time series of brain regions, and it is therefore highly time dependent. Structural connectivity refers to either direct fiber connections by diffusion tensor imaging (DTI) or associated structural attributes by structural MRI, which is relatively stable at shorter time scales. Since well-documented evidence has shown abnormal functional changes of brain regions in prelingually deaf subjects (Emmorey et al., 2010; Li et al., 2013; Malaia et al., 2014; Shiell et al., 2015), we mainly focus on the structural abnormalities in deaf. Li et al. (2012) used DTI and tract-based spatial statistics to study the structural brain connectivity in the deaf subjects, which represents changes of white matter connectivity. In the present study, we used structural MRI to study the connectivity pattern on the grey matter suggesting the synchronized changes on the grey matter of brain regions. Additionally, the subjects recruited in this study are adolescents with the age from 10 to 18 at which brain structure and connectivity are in developmental changes with increased experience, knowledge as well as skills (Spear, 2000). To our best knowledge, abnormalities of grey matter connectivity have not been investigated in prelingually deaf adolescents yet.
In recent years, researchers have used morphometric characteristics, such as volume (Bassett et al., 2008), cortical thickness (He et al., 2007, 2008, 2009) and surface area (Sanabria-Diaz et al., 2010), to investigate grey matter connectivity of human brains, and the most commonly used method is the correlation-based analysis, resulting in a correlation matrix indicating connections between pairs of brain regions. However, correlation-based analysis requires a relatively large sample size to ensure the statistical power. To conquer this limitation, Huang et al. (2009, 2010) proposed a method based on sparse inverse covariance estimation (SICE) to identify brain connectivity networks. This method imposes a sparsity constraint on the maximum likelihood estimation of an inverse covariance matrix, leading to a reliable estimation even if the sample size is small (Friedman et al., 2008; Li and Gui, 2006; Schäfer et al., 2005). SICE is an effective tool for identifying the distribution of brain connectivity (i.e. the zero and non-zero entries). This method has been applied to positron emission tomography (PET) to learn about brain connectivity of Alzheimer’s disease, and successfully used for classification between patients and normal controls (Huang et al., 2010).
In the present study, we hypothesized grey matter connectivity within and between auditory, language and visual systems would change in prelingually deaf adolescents compared with normal controls. We recruited 16 prelingually deaf adolescents and 16 normal controls with matched age and gender. Fourteen regions of interest (ROIs) related to auditory, language as well as vision were selected to build the connections between and within these sensory systems. We used the SICE method to construct the connectivity matrix using grey matter volume as the structural characteristic. The structural connectivity within and between auditory, language and visual systems were analyzed in prelingually deaf adolescents and normal controls, respectively. These results would represent the brain plasticity happening in deaf adolescents after the early deprivation of auditory sensory.
2Materials and methods
2.1Subjects
Sixteen adolescents with prelingual deafness (age: 14.56±2.10 years, 10∼18 years; 8 males) and sixteen healthy controls (age: 14.75±2.38 years, 10∼18 years; 8 males) were scanned, matched in age (p = 0.815) and gender (Chi-Squared p = 1.0). These subjects were the same as those used in our previous studies (Li et al., 2012, 2013). All subjects were right-handed, and had no history of central nervous system disease or significant head trauma. The deaf subjects were diagnosed with severe sensorineural hearing loss after the birth, having a mean pure tone audiometry average air conduction threshold greater than 90 dB of hearing loss for the better ear and no single frequency better than 45 dB of hearing loss between 500 Hz and 4000 Hz. The causes of deafness was either congential deafness or drug toxicity. All these prelingually deaf adolescents used Chinese Sign Language (CSL) and wore hearing aids. Detailed biographical information of the deaf subjects is shown in Table 1. The study was conducted according to the Declaration of Helsinki and was approved by the Committee at Beijing Tongren Hospital. The written informed consent was obtained from all the subjects and their parents.
2.2Data acquisition
T1-weighted 3D spoiled gradient echo (SPGR) images were collected from all the subjects on a 3 Tesla MR imaging scanner (GE Medical System, Milwaukee, WI, USA) with an eight-channel phased-array head coil. The protocol for T1 images included repetition time (TR) = 9 ms, echo time (TE) = 3.5 ms, inversion time (TI) = 450 ms, slice thickness = 1 mm, flip angle = 13°, matrix size = 256×256, field of view (FOV) = 24×24 cm2, yielding 196 sagittal slices with in-plane resolution of 0.9375×0.9375 mm2.
2.3Data preprocessing
Data preprocessing was performed using the FreeSurfer software package v. 4.5.0 (http://surfer.nmr.mgh.harvard.edu) (Dale et al., 1999; Fischl et al., 1999). Fischl et al. (2002, 2004) have documented the processing steps in detail. In brief, all T1 images were first skull stripped using a surface deformation procedure to remove non-brain tissue, and transformed into Talairach space. Then, these images underwent segmentation of subcortical white matter (WM) and grey matter (GM) structures, and intensity normalization to correct for MR intensity non-uniformity. For surface-based morphometry, preprocessing involved tessellation of the GM/WM boundaries, automated topology correction, surface deformation to generate the GM/WM and GM/CSF boundaries based on signal-intensity gradients. The generated pial and WM surfaces were visually inspected for accuracy (by W. Li) and edited manually if necessary. These images were then inflated and registered to a spherical atlas in the MNI (Montreal Neurological Institute) 152-space and parceled on the basis of gyral and sulcal information derived from the brain atlas, resulting in values for volume, cortical thickness, and surface area (Desikan et al., 2006). Finally, all these measurements were calculated in the native space by an inverse transformation. In the present study, we used grey matter volume as the structural attribute for construction of the brain connectivity matrix. Based on the clinical expertise of the clinicians (J. Li & J. Xian) and the existed literatures (Beason-Held et al., 1998; Burton, 2001; Cavanna & Trimble, 2006; Jeannerod, 2004; Kawashima et al., 1995; Lauter et al., 1985; Nixon et al., 2004; Stoeckel et al., 2009), fourteen ROIs, including the transverse temporal gyrus, superior temporal gyurs, middle temporal gyrus, inferior temporal gyrus, pars opercularis, pars triangularis, pars orbitalis, supramarginalgyrus, cuneus, fusiform gyrus, lateral occipital cortex, lingual gyrus and precuneus, were selected and categorized as auditory, language and visual regions, respectively (see Table 2). To attenuate the variations brought by brain asymmetries, we considered the left and right sides of these regions together, calculating the average volume over the bilateral regions.
2.4Construction of brain connectivity
We used the SICE method to construct the brain connectivity based on the grey matter volume extracted from 14 ROIs. SICE is also known as exploratory Gaussian graphical models with the off-diagonal elements of inverse covariance matrix corresponding to partial correlations. In addition, imposing sparsity on the inverse covariance estimation ensures a reliable construction of brain connectivity with a relatively small sample size. This method was described by Huang et al. (2009, 2010) in detail. Specifically, assuming that all the brain regions {X 1, … , X p } follows a multivariate Gaussian distribution with mean μ and covariance matrix Σ , let Θ = Σ -1 be the inverse covariance matrix. SICE finds an estimate for the inverse covariance of the brain regions by solving the following optimization:
(1)
The non-zero entries in the estimate of inverse covariance
In this paper, we construct grey matter connectivity matrix for deaf adolescents and normal controls, respectively. When performing group analysis, one crucial problem for the SICE method is how to select the λ value for each group and make the group comparisons meaningful. In order to compare groups in terms of the organization of the connectivity instead of the global scale of the connectivity, the connectivity differences due to the differences at the global scale must be factored out. A number of studies have adopted the strategy that controls the total number of connections for each group to be the same (He et al., 2008; Huang et al., 2010; Stam et al., 2007; Supekar et al., 2008). We employed this strategy and adjusted the λ such that the two models for the deaf and control groups have the same total number of connections. In addition, the models can represent the brain connectivity at different strength levels by different values for the total number of connections. Specifically, the model represents strong brain connectivity when the total number of connections is small so that only strong connectivity can show up. With the increase of the total number of connections, mild connectivity will show up, and the model represents mild-to-strong brain connectivity. In the present study, we focused on the connectivity between 14 ROIs which formed a total of 14 *13/2 = 91 possible connections. We adjusted the λ value and investigated the organization of brain connectivity with 20, 30, and 40 brain connections respectively.
2.5Statistical analysis
First, we used analysis of covariance to test for grey matter volume differences of 14 ROIs between deaf and control groups taking the intracranial volume (ICV) into consideration. The statistical results were Bonferroni corrected for multiple comparisons, taking the correlation between the dependent variables into account by using the Simple Interactive Statistical Analysis Bonferroni tool (http://www.quantitativeskills.com/sisa/calculations/bonfer.htm) to optimally balance between Type-I and Type-II errors. In the between-group analysis, volumes of ROIs show a mean correlation coefficient of r = 0.4756 over all subjects, leading to an equivalent corrected alpha of 0.013 (number of tests = 14).
SICE method provides a matrix of brain connectivity for each group. By adjusting λ, we obtained connectivity matrices with different sparsities and three matrices (20, 30, and 40 brain connections over a total of 91 possible connections) were taken for instance to investigate alterations of grey matter connectivity in prelingually deaf adolescents. The binary matrices were first constructed by setting all non-zero entries to ones to figure out the distribution of the grey matter connectivity with different sparsities in deaf and control groups. Then, a connectivity matrix with a quasi-measure is present for each group to illustrate the connectivity strength. Specifically, we selected the structure of the connectivity matrix with 40 connections and assigned each element with the quasi-measure for connectivity strength defined as the critical λ at which two brain regions change from being connected to being not connected.
A nonparametric permutation test was then performed to determine statistically significant differences of brain connectivity (Bullmore et al., 1999). Since the value of the quasi-measure for connectivity strength did not represent the strength directly, we calculated the number of connections to quantitatively evaluate the group differences of grey matter connectivity within and between auditory, language and visual systems. Then, to test the null hypothesis that the observed group differences could occur by chance, we randomly reallocated all the subjects to two groups, and used the SICE method to construct the model of brain connectivity at each sparsity for each group. We calculated the differences of connection numbers within and between auditory, language, and visual systems between the two randomized groups. The randomization procedure was repeated for 10000 times, and the 95 percentile points of each distribution were used as the critical values for a one-tailed test.
3Results
3.1Group differences of grey matter volume
We did not find significant differences of grey matter volume for each ROI between prelingually deaf adolescents and normal controls (see Table 3 in detail).
3.2Structural brain connectivity
The grey matter connectivity matrix was constructed by the SICE method with different sparsities for the two groups. Fig. 1 shows the binary connectivity matrices with 20, 30, and 40 brain connections in normal controls and deaf adolescents respectively. We can see that deaf subjects have fewer connections within auditory and visual systems but more connections between these two systems.
We used a quasi-measure to identify the strength of brain connectivity between brain regions. Fig. 2 shows the connectivity matrix with each element representing the quasi-measure for strength with the sparsity of 40/91. The larger the value is, the stronger the strength is. Fig. 3 is a 3D view of the grey matter connectivity within and between auditory, language and visual systems, which is visualized with the BrainNet Viewer (http://www.nitrc.org/projects/bnv/) (Xia et al., 2013). The figures show that the connectivity within auditory and visual systems and between language and visual systems is much weaker in deaf adolescents compared with that in normal controls. On the contrary, the connectivity between auditory and visual systems is stronger in prelingually deaf subjects.
Using the permutation test, we found more connections between auditory and visual systems, which were significant at the sparsity of 40/91 and a trend of significance at the other two sparsities (see Fig. 4).
4Discussion
In the present study, we investigated alterations of grey matter connectivity within and between auditory, language and visual systems in prelingually deaf adolescents compared with normal controls. Grey matter volume was extracted for 14 ROIs involved in auditory, language and visual processing, and brainconnectivity model was constructed using the SICE method. Results show that connections within auditory and visual systems and between language and visual systems were much weaker in deaf adolescents compared with normal controls. Most interestingly, significantly increased connectivity was found between auditory and visual systems, indicating the “cross-modal” plasticity in prelingually deaf adolescents.
4.1Preserved grey matter volumes
In the present study, we did not find significant differences of the volumes from 14 ROIs between prelingually deaf adolescents and normal controls. Emmorey et al. (2003) reported that deaf and hearing subjects did not differ in the total volume or the grey matter volume in the primary auditory cortex. Shibata (2007) did not find grey matter volume changes in deaf subjects by the optimized voxel-based morphometry (VBM) method. In addition, our previous studies (Li et al., 2012, 2013) found grey matter volume changes only in the cerebellum but not the other brain regions. The results in the present study are consistent with these studies, suggesting that the early hearing loss would not lead to the structural damages or neural degeneration in brain regions involved in auditory, language as well as vision. However, we found changes of brain connectivity between these brain regions, indicating the damages caused by hearing loss might be compensated by connectivity changes.
4.2Weaker connectivity within auditory and visual systems and between language and visual systems
Upadhyay et al. (2008) used both fMRI and diffusion tensor probabilistic mapping to investigate connectivity in human auditory cortex. Their results show effective connectivity between the primary auditory cortex and the surrounding auditory regions on the supratemporal plane and STG, and reveal rostral and caudal fiber pathways between regions depicting effective connectivity in normal controls. However, in deaf subjects, reduced fractional anisotropy (FA) values were found in the primary auditory cortex (Kim et al., 2009; Li et al., 2012; Miao et al., 2013), reflecting axonal loss or lack of myelination in auditory cortex due to hearing loss. This may lead to the impaired connectivity between auditory regions in prelingually deaf subjects as shown in our study. Besides auditory deprivation, visual deficits have been widely reported in deaf subjects (Hollingsworth et al., 2014, for review; Parasnis et al., 2003; Pavani and Bottari, 2012; Quittner et al., 2004), which might result in weaker connectivity within visual system as detected in the present study. Furthermore, visual deficits has the potential to impair the development of language and lower level of reading and speaking skills are often companied with deaf subjects (Hollingsworth et al., 2014, for review; Parasnis et al., 2003; Pavani and Bottari, 2012; Quittner et al., 2004). This may explain our results of weaker connectivity between language and visual systems in prelingually deaf subjects.
4.3Significantly increased connectivity between auditory and visual systems
In the present study, we found significantly increased grey matter connectivity between auditory and visual systems, which indicated the “cross-modal” plasticity occurred in prelingual deaf adolescents. “Cross-modal” plasticity refers to the phenomenon that the early disruption of sensory input from one modality can induce the structural or functional brain reorganization of a deprived cortical area, resulting in compensatory abilities in the remaining senses, which is a common phenomenon observed in subjects with the loss of a certain sensory (Bola et al., 2014; Fine et al., 2005; Kamke et al., 2014; Karns et al., 2012; Nishimura et al., 1999; Yoshida et al., 2011). For deaf subjects, “cross-modal” plasticity means that the other sensation inputs, such as visual, tactile, and olfactory stimuli, can activate the auditory cortex. Macsweeney et al. (2002) and Nishimura et al. (1999) demonstrated that the superior temporal gyrus and the secondary auditory cortices were activated by sign language. Finney et al. used both fMRI and MEG and found visual stimuli could activate the primary and secondary auditory cortices (Finney et al., 2001, 2003). The present study revealed connectivity between the auditory and visual systems significantly increased in prelingually deaf adolescents compared with normal controls, indicating brain reorganizations between auditory and visual systems. These changes might be caused by the new connections built between the two sensory systems, which may further support that the grey matter volume in the auditory cortex did not decline by the early hearing loss in prelingually deaf subjects.
Interestingly, increases between auditory and visual systems are only significant when the total number of connections equals to 40, but not significant when it equals to 20 or 30. This indicates that the strength of the increased connections in the prelingually deaf adolescents are mild (not so strong) because only strong connectivity can show up when the total number of brain connections is small and mild connectivity will show up with the increase of the total number of connections. These results reveal that more connections are built between auditory and visual systems of the prelingually deaf adolescents, but the strength is mild. While the constructed connections reflect the “cross-modal” plasticity in deaf subjects as described above, the increased but mild connections may be a sign that functional control is less localized and more distributed.
4.4Limitations
The present study has some limitations. First, the sample size in the study is relatively small. We recruited 16 prelingually deaf subjects and 16 normal controls matched in age and gender respectively. More subjects will be recruited in further studies. Second, the present study only took the brain regions involved in auditory, language and visual processing into consideration. In the future, the brain connectivity throughout the whole brain will be investigated.
5Conclusion
In the present study, we used the SICE method to construct the model for grey matter connectivity within and between auditory, language and visual systems and compared the organization of grey matter connectivity between prelingually deaf adolescents and normal controls. The results show weaker connectivity within auditory and visual systems and between language and visual systems, which might be caused by auditory deprivation and visual deficits in prelingually deaf adolescents. Most interestingly, increased but mild connectivity was detected between the auditory and visual systems in deaf adolescents, indicating the “cross-modal” plasticity after the early hearing loss as well as less localized and more distributed connections in deaf. All these evidence demonstrated the brain plasticity occurred within and between auditory, language and visual systems.
Acknowledgments
This work is supported by 863 Project (2013AA013803), National Natural Science Foundation of China (NSFC) (No. 81271557, No. 61271151, No. 61228103), the Beijing Postdoctoral Research Foundation (No. 2014ZZ-8) and Doctoral Scientific Research Foundation of Beijing University of Technology, We thank all the subjects and their families for the time and effort they dedicate to our research.
References
1 | Bassett DS, Bullmore E, Verchinski BA, Mattay VS, Weinberger DR, Mayer-Lindenberg A(2008) Hierarchical organization of human cortical networks in health and schizophreniaJ Neurosci28: (37)92399248 |
2 | Beason-Held LL, Purpura KP, Krasuski JS, Maisoq DJ, Desmond RE, Optican LM, Schapiro MB, VanMeter JW(1998) Cortical regions involved in visual texture perception: A fMRI studyBrain Res Cogn Brain Res7: (2)111118 |
3 | Bola M, Gall C, Moewes C, Fedorov A, Hinrichs H, Sabel BA(2014) Brain functional connectivity network breakdown and restoration in blindnessNeurology83: (6)542551 |
4 | Bullmore ET, Suckling J, Overmeyer S, Rabe-Hesketh S, Taylor E, Brammer MJ(1999) Global, voxel, and cluster tests, by theory and permutation, for a difference between two groups of structural MR images of the brainIEEE Trans Med Imaging18: (1)3242 |
5 | Burton MW(2001) The role of inferior frontal cortex in phonological processingCogn Sci25: (5)695709 |
6 | Cavanna AE, Trimble MR(2006) The precuneus: A review of its functional anatomy and behavioural correlatesBrain129: (Pt 3)564583 |
7 | Dale AM, Fischl B, Sereno MI(1999) Cortical surface-based analysis *:: I. Segmentation and surface reconstructionNeuroimage9: (2)179194 |
8 | Desikan RS, Ségonne F, Fischl B, Quinn BT, Dickerson BC, Blacker D, Buckner RL, Dale AM, Maguire RP, Hyman BT, Albert MS, Killiany RJ(2006) An automated labeling system for subdividing the human cerebral cortex on MRI scans into gyral based regions of interestNeuroimage31: (3)968980 |
9 | Dye MW, Bavelier D(2010) Attentional enhancements and deficits in deaf populations: An integrative reviewRestor Neurol Neurosci28: (2)181192 |
10 | Emmorey K, Allen JS, Bruss J, Schenker N, Damasio H(2003) A morphometric analysis of auditory brain regions in congenitally deaf adultsProc Natl Acad Sci U S A100: (17)1004910054 |
11 | Emmorey K, Xu J, Gannon P, Goldin-Meadow S, Braun A(2010) CNS activation and regional connectivity during pantomime observation: No engagement of the mirror neuron system for deaf signersNeuroimage49: (1)9941005 |
12 | Fine I, Finney EM, Boynton GM, Dobkins KR(2005) Comparing the effects of auditory deprivation and sign language within the auditory and visual cortexJ Cogn Neurosci17: (10)16211637 |
13 | Finney EM, Fine I, Dobkins KR(2001) Visual stimuli activate auditory cortex in the deafNat Neurosci4: (12)11711174 |
14 | Finney EM, Clementz BA, Hickok G, Dobkins KR(2003) Visual stimuli activate auditory cortex in deaf subjects: Evidence from MEGNeuroreport14: (11)14251427 |
15 | Fischl B, Sereno MI, Dale AM(1999) Cortical surface-based analysis *:: II: Inflation, flattening, and a surface-based coordinate systemNeuroimage9: (2)195207 |
16 | Fischl B, Salat DH, Busa E, Albert M, Dieterich M, Haselgrove C, van der Kouwe A, Killiany R, Kennedy D, Klaveness S, Montillo A, Makris N, Rosen B, Dale AM(2002) Whole brain segmentation: Automated labeling of neuroanatomical structures in the human brainNeuron33: (3)341355 |
17 | Fischl B, Salat DH, van der Kouwe A, Makris N, Ségonne F, Quinn BT, Dale AM(2004) Sequence-independent segmentation of magnetic resonance imagesNeuroimage23: (Supp 1)S69S84 |
18 | Friedman J, Hastie T, Tibshirani R(2008) Sparse inverse covariance estimation with the graphical lassoBiostatistics9: (3)432441 |
19 | Garrity AG, Pearlson GD, McKiernan K, Lloyd D, Kiehl KA, Calhoun VD(2007) Aberrant “default mode” functional connectivity in schizophreniaAm J Psychiatry164: (3)450457 |
20 | Grady CL, Furey ML, Pietrini P, Horwitz B, Rapoport SI(2001) Altered brain functional connectivity and impaired short-term memory in Alzheimer’s diseaseBrain124: (Pt 4)739756 |
21 | He Y, Chen Z, Evans AC(2007) Small-world anatomical networks in the human brain revealed by cortical thickness from MRICereb Cortex17: (10)24072419 |
22 | He Y, Chen Z, Evans AC(2008) Structural insights into aberrant topological patterns of large-scale cortical networks in Alzheimer’s diseaseJ Neurosci28: (18)47564766 |
23 | He Y, Dagher A, Chen Z, Charil A, Zijdenbos A, Worsley K, Evans AC(2009) Impaired small-world efficiency in structural cortical networks in multiple sclerosis associated with white matter lesion loadBrain132: (Pt 12)33663379 |
24 | Hollingsworth R, Ludlow AK, Wilkins A, Calver R, Allen PM(2014) Visual performance and ocular abnormalities in deaf children and young adults: A literature reviewActa Ophthalmol92: (4)305310 |
25 | Huang S, Li J, Sun L, Liu J, Wu T, Chen K, Fleisher A, Reiman E, Ye J(2009) Learning brain connectivity of Alzheimer’s disease from neuroimaging dataProceedings of Neural Information Processing Systems Conference (NIPS)Vancouver B.C., Canada, September 7-9, 2009 |
26 | Huang S, Li J, Sun L, Ye J, Fleisher A, Wu T, Chen K, Reiman E(2010) Learning brain connectivity of Alzheimer’s disease by sparse inverse covariance estimationNeuroimage50: (3)935949 |
27 | Jeannerod M(2004) Visual and action cues contribute to the self-other distinctionNat Neurosci7: (5)422423 |
28 | Kamke MR, Van LuynJ, Constantinescu G, Harris J(2014) Contingent capture of involuntary visual spatial attention does not differ between normally hearing children and proficient cochlear implant usersRestor Neurol Neurosci32: (6)799811 |
29 | Karns CM, Dow MW, Neville HJ(2012) Altered cross-modal processing in the primary auditory cortex of congenitally deaf adults: A visual-somatosensory fMRI study with a double-flash illusionJ Neurosci32: (28)96269638 |
30 | Kawashima R, Roland PE, O’Sullivan BT(1995) Functional anatomy of reaching and visuomotor learning: A positron emission tomography studyCereb Cortex5: (2)111122 |
31 | Kim D, Park S, Kim J, Lee DH, Park H(2009) Alterations of white matter diffusion anisotropy in early deafnessNeuroreport20: (11)10321036 |
32 | Lauter JL, Herscovitch P, Formby C, Raichle ME(1985) Tonotopic organization in human auditory cortex revealed by positron emission tomographyHear Res20: (3)199205 |
33 | Li H, Gui J(2006) Gradient directed regularization for sparse Gaussian concentration graphs, with applications to inference of genetic networksBiostatistics7: (2)302317 |
34 | Li J, Li W, Xian J, Li Y, Liu Z, Liu S, Wang X, Wang Z, He H(2012) Cortical thickness analysis and optimized voxel-based morphometry in children and adolescents with prelingually profound sensorineural hearing lossBrain Res1430: 3542 |
35 | Li W, Li J, Xian J, Lv B, Li M, Wang C, Li Y, Liu Z, Liu S, Wang Z, He H, Sabel BA(2013) Alterations of grey matter asymmetries in adolescents with prelingual deafness: A combined VBM and cortical thickness analysisRestor Neurol Neurosci31: (1)117 |
36 | Li Y, Booth JR, Peng D, Zang Y, Li J, Yan C, Ding G(2013) Altered intra- and inter-regional synchronization of superior temporal cortex in deaf peopleCereb Cortex23: (8)19881996 |
37 | Li Y, Ding G, Booth J, Huang R, Lv Y, Zang Y, He Y, Peng D(2012) Sensitive period for white-matter connectivity of superior temporal cortex in deaf peopleHum Brain Mapp33: (2)349359 |
38 | MacSweeney M, Campbell R, Calvert GA, McGuire PK, David AS, Suckling J, Andrew C, Woll B, Brammer MJ(2001) Dispersed activation in the left temporal cortex for speech-reading in congenitally deaf peopleProc Biol Sci268: (1466)451457 |
39 | MacSweeney M, Woll B, Campbell R, McGuire PK, David AS, Williams SCR, Suckling J, Calvert GA, Brammer MJ(2002) Neural systems underlying British Sign Language and audio-visual English processing in native usersBrain125: (Pt 7)15831593 |
40 | MacSweeney M, Brammer MJ, Waters D, Goswami U(2009) Enhanced activation of the left inferior frontal gyrus in deaf and dyslexic adults during rhymingBrain132: (Pt 7)19281940 |
41 | Malaia E, Talavage TM, Wilbur RB(2014) Functional connectivity in task-negative network of the deaf: Effects of sign language experiencePeerJ2: e446 |
42 | Meunier D, Achard S, Morcom A, Bullmore E(2009) Age-related changes in modular organization of human brain functional networksNeuroimage44: (3)715723 |
43 | Meyer-Lindenberg AS, Olsen RK, Kohn PD, Brown T, Egan MF, Weinberger DR, Berman KF(2005) Regionally specific disturbance of dorsolateral prefrontal-hippocampal functional connectivity in schizophreniaArch Gen Psychiatry62: (4)379386 |
44 | Miao W, Li J, Tang M, Xian J, Li W, Liu Z, Liu S, Sabel BA, Wang Z, He H(2013) Altered white matter integrity in adolescents with prelingual deafness: A high-resolution tract-based spatial statistics imaging studyAJNR Am J Neuroradiol34: (6)12641270 |
45 | Nishimura H, Hashikawa K, Doi K, Iwaki T, Watanabe Y, Kusuoka H, Nishimura T, Kubo T(1999) Sign language ‘heard’ in the auditory cortexNature397: (6715)116 |
46 | Nixon P, Lazarova J, Hodinott-Hill I, Gough P, Passingham R(2004) The inferior frontal gyrus and phonological processing: An investigation using rTMSJ Cogn Neurosci16: (2)289300 |
47 | Parasnis I, Samar VJ, Berent GP(2003) Deaf adults without attention deficit hyperactivity disorder display reduced perceptual sensitivity and elevated impulsivity on the Test of Variables of Attention (T.O.V.AJ Speech Lang Hear Res46: (5)11661183 |
48 | Pavani F, Bottari D(2012) Visual abilities in individuas with profound deafness A critical reviewBoca Raton (FL)CRC Press |
49 | Quittner AL, Leibach P, Marciel K(2004) The impact of cochlear implants on young deaf children: New methods to assess cognitive and behavioral developmentArch Otolaryngol Head Neck Surg130: (5)547554 |
50 | Rippon G, Brock J, Brown C, Boucher J(2007) Disordered connectivity in the autistic brain: Challenges for the ‘new psychophysiology’Int J Psychophysiol63: (2)164172 |
51 | Sanabria-Diaz G, Melie-Garcia L, Iturria-Medina Y, Alemán-Gòmez Y, Hernández-González G, Valdés-Urrutia L, Galán L, Valdés-Sosa P(2010) Surface area and cortical thickness descriptors reveal different attributes of the structural human brain networksNeuroimage50: (4)14971510 |
52 | Schäfer J, Strimmer K(2005) A shrinkage approach to large-scale covariance matrix estimation and implications for functional genomicsStat Appl Genet Mol Biol4: Article 32 |
53 | Shibata DK(2007) Differences in brain structure in deaf persons on MR imaging studied with voxel-based morphometryAJNR Am J Neuroradiol28: (2)243249 |
54 | Shiell MM, Champoux F, Zatorre RJ(2015) Reorganization of auditory cortex in early-deaf people: Functional connectivity and relationship to hearing aid useJ Cogn Neurosci27: (1)150163 |
55 | Skudlarski P, Jagannathan K, Anderson K, Stevens MC, Calhoun VD, Skudlarska BA, Pearlson G(2010) Brain connectivity is not only lower but different in schizophrenia: A combined anatomical and functional approachBiol Psychiatry68: (1)6169 |
56 | Spear LP(2000) The adolescent brain and age-related behavioral manifestationsNeurosci Biobehav Rev24: (4)417463 |
57 | St Jacques PL, Dolcos F, Cabeza R(2009) Effects of aging on functional connectivity of the amygdala for subsequent memory of negative pictures: A network analysis of functional magnetic resonance imaging dataPsychol Sci20: (1)7484 |
58 | Stam CJ, Jones BF, Nolte G, Breakspear M, Scheltens P(2007) Small-world networks and functional connectivity in Alzheimer’s diseaseCereb Cortex17: (1)9299 |
59 | Stoeckel C, Gough PM, Watkin KE, Devlin JT(2009) Supramarginal gyrus involvement in visual word recognitionCortex45: (9)10911096 |
60 | Supekar K, Menon V, Rubin D, Musen M, Greicius MD(2008) Network analysis of intrinsic functional brain connectivity in Alzheimer’s diseasePLoS Comput Biol4: (6)111 |
61 | Upadhyay J, Silver A, Knaus TA, Lindgren KA, Ducros M, Kim D, Tager-Flusberg H(2008) Effective and structural connectivity in the human auditory cortexJ Neurosci28: (13)33413349 |
62 | Wang L, Zang Y, He Y, Liang M, Zhang X, Tian L, Wu T, Jiang T, Li K(2006) Changes in hippocampal connectivity in the early stages of Alzheimer’s disease: Evidence from resting state fMRINeuroimage31: (2)496504 |
63 | Wass S(2007) Distortions and disconnections: Disrupted brain connectivity in autismBrain Cogn75: (1)1828 |
64 | Xia M, Wang J, He Y(2013) BrainNet Viewer: A network visualization tool for human brain connectomicsPLoS One8: (7)e68910 |
65 | Yoshida H, Kanda Y, Takahashi H, Miyamoto I, Chiba K(2011) Observation of cortical activity during speech stimulation in prelingually deafened adults with cochlear implantation by Positron Emission Tomography-Computed TomographyAnn Otol Rhinol Laryngol120: (8)499504 |
Figures and Tables
Fig.1
Binary matrices of grey matter connectivity with different sparsities (20, 30 and 40 connections over a total of 91 possible connections) for (a) normal controls and (b) deaf subjects respectively. The colors of red, green and blue indicate connections within auditory, language, and visual systems respectively, and the grey color represents connections between these systems. Black lines divide the 14 ROIs into auditory, language and visual systems accordingly.
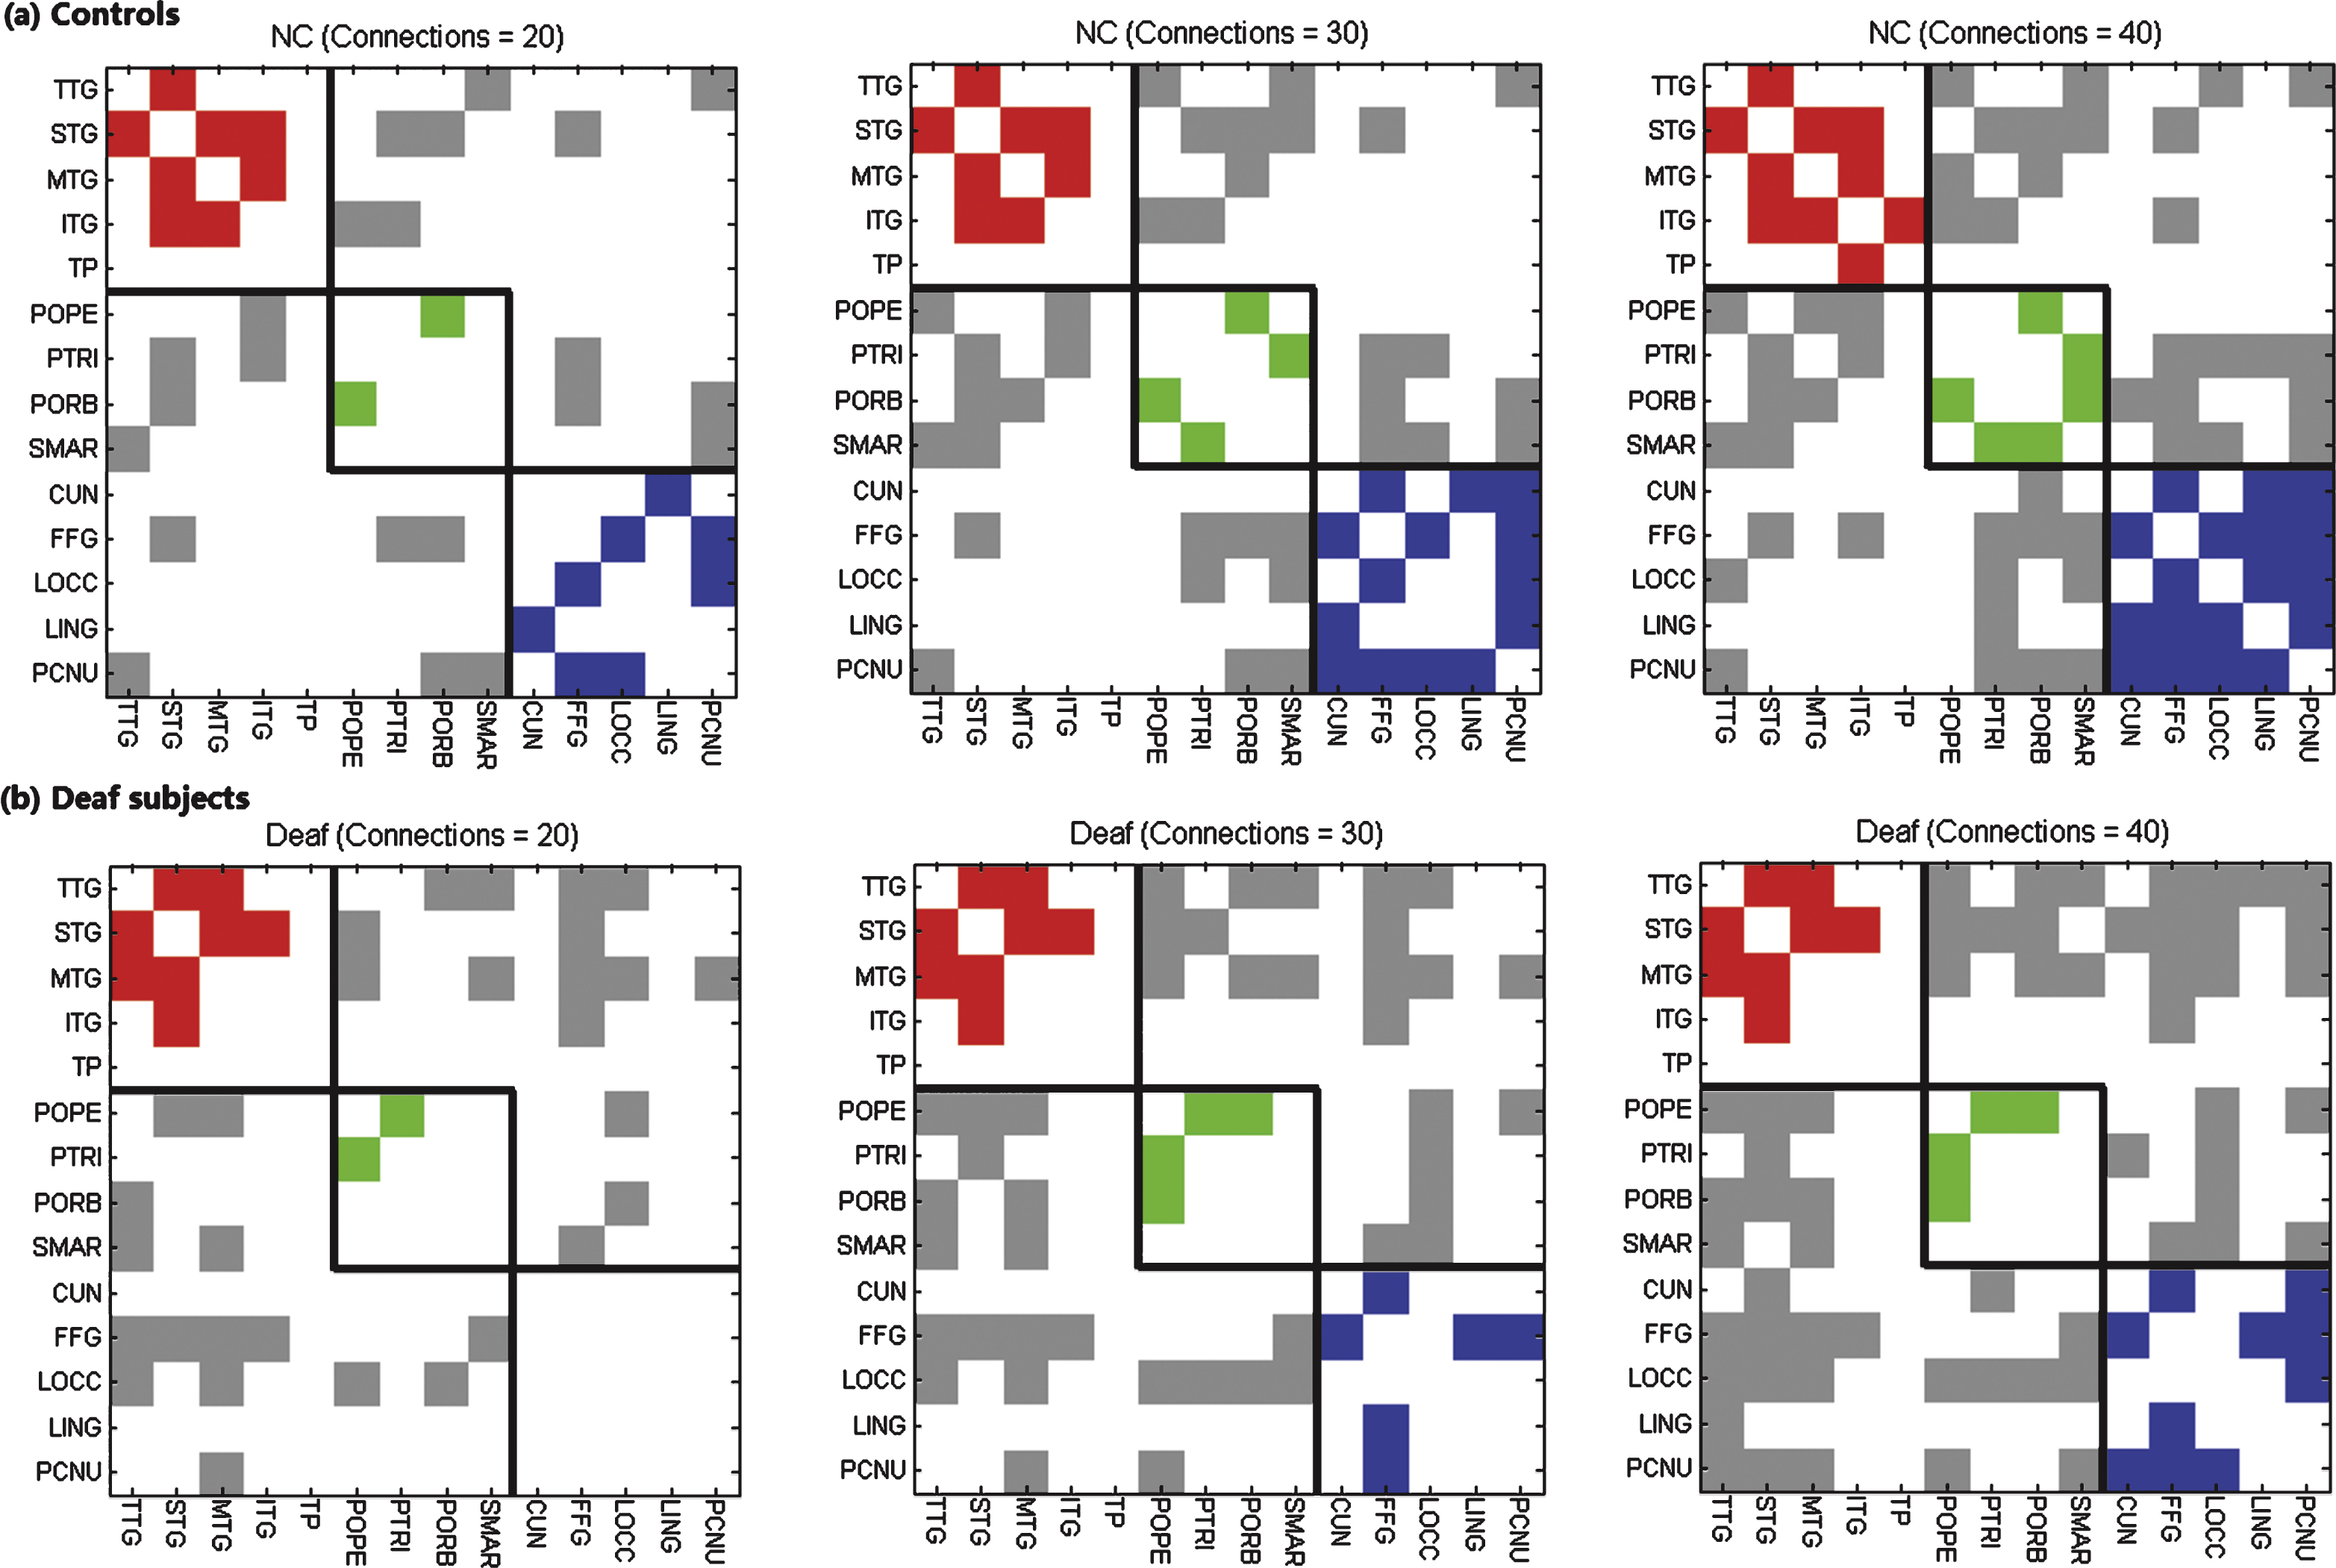
Fig.2
Grey matter connectivity matrix with 40 connections over a total of 91 connections suggesting a quasi-measure for the strength in (a) normal controls and (b) deaf subjects respectively. The value in the matrix is the critical λ at which two brain regions change from being connected to being not connected. The colorbar represents the critical λ. The larger the value is, the stronger strength it indicates..
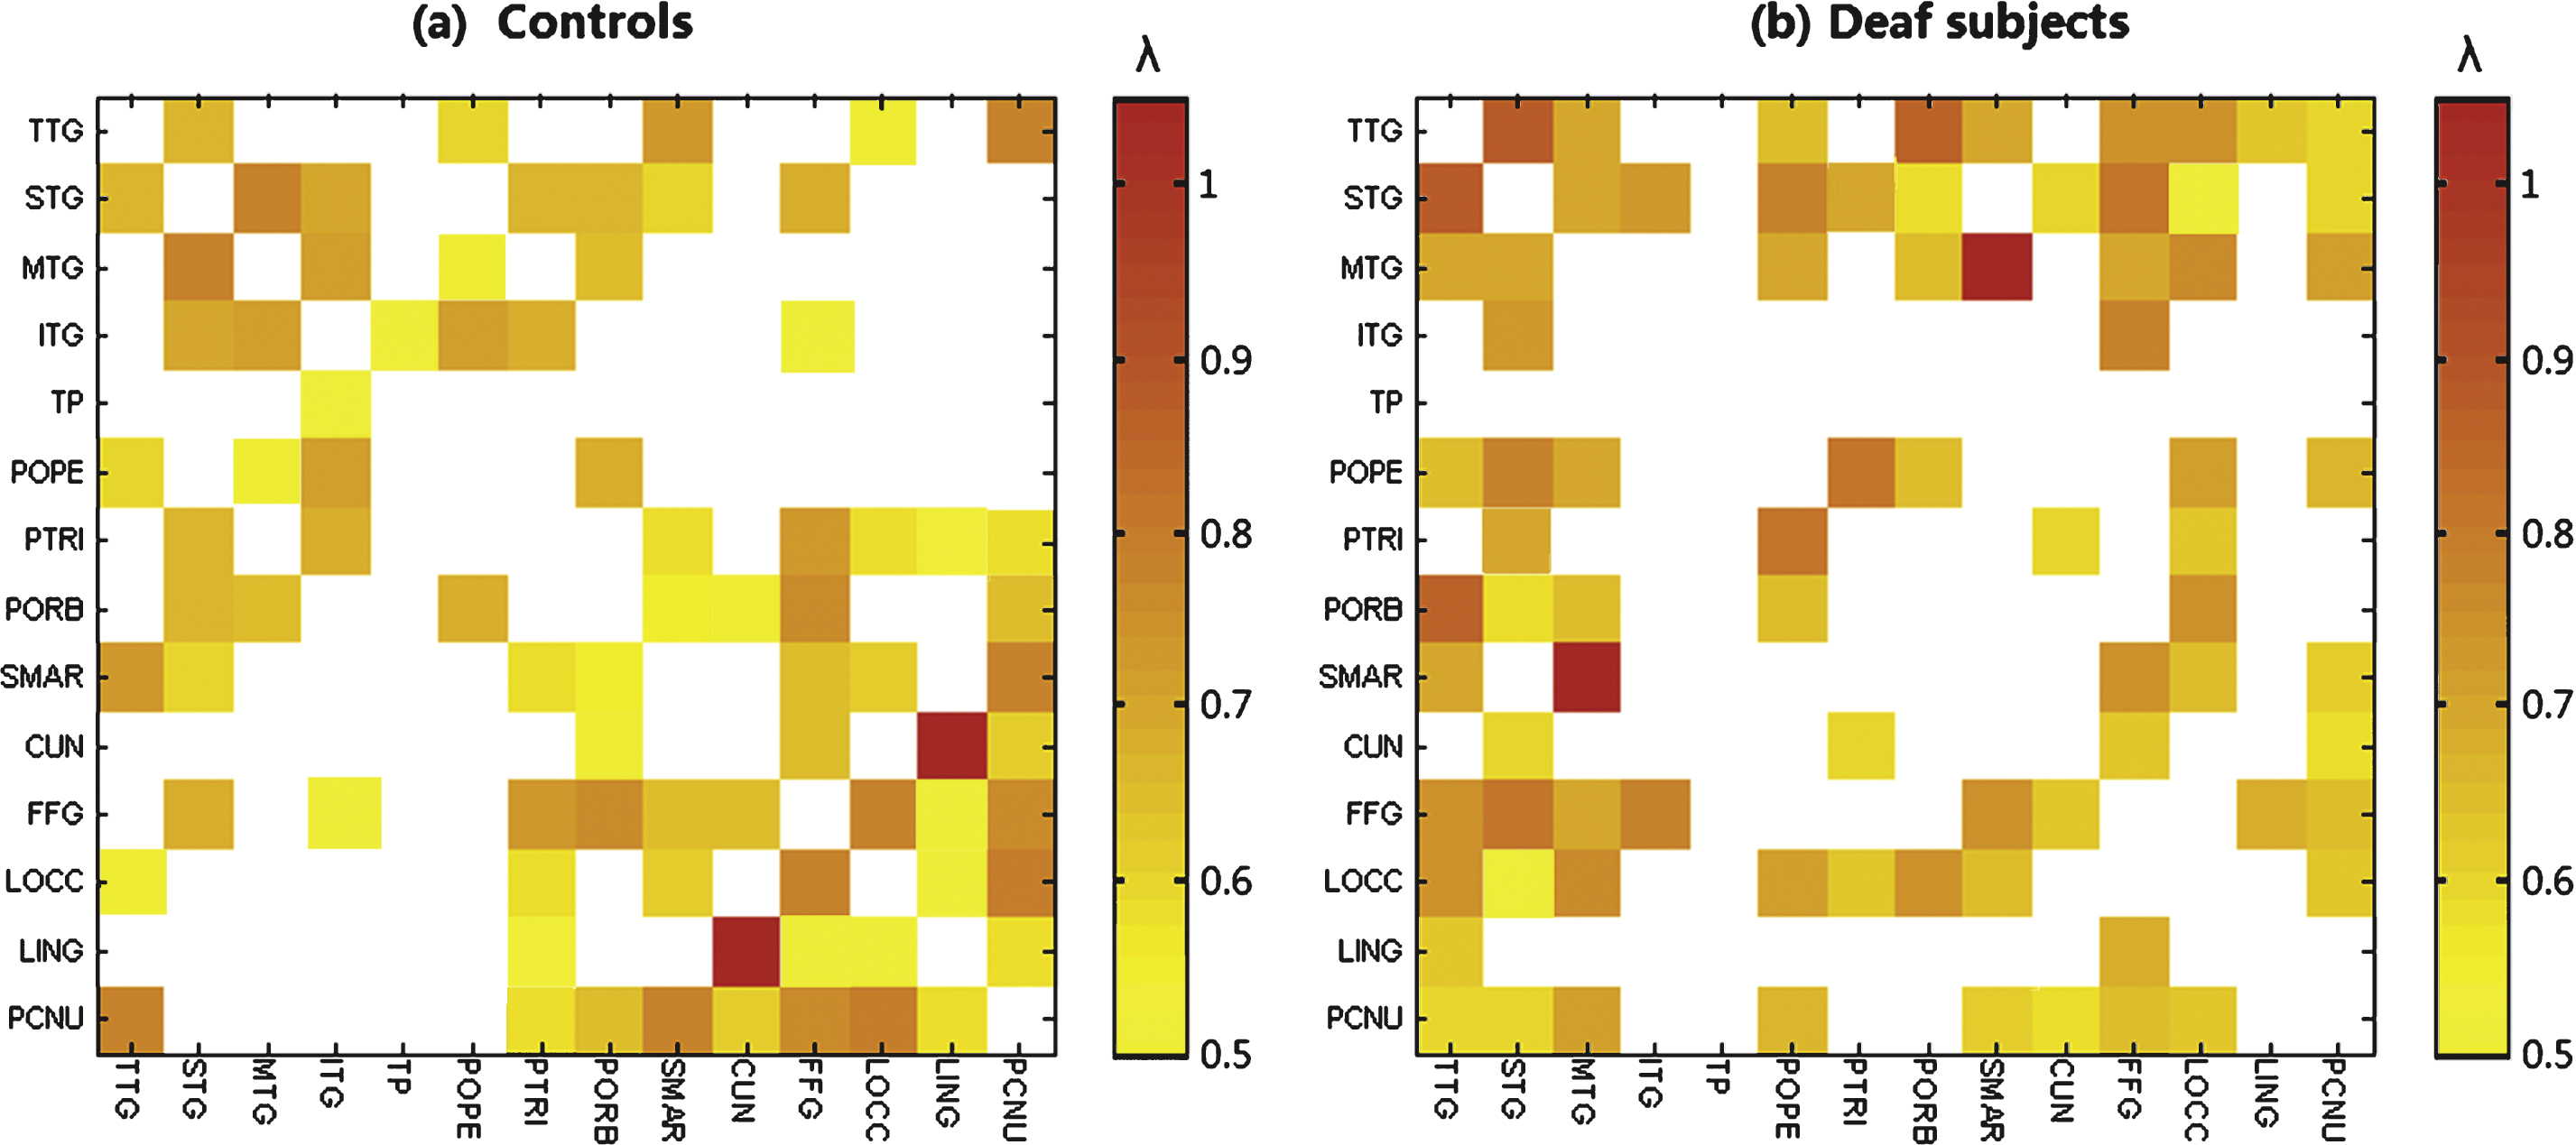
Fig.3
A 3D view of grey matter connectivity within and between auditory, language and visual systems in (a) normal controls and (b) deaf subjects. The lateral and medium views are shown. The nodes involved in auditory, language and visual processing are represented by red, green and blue respectively. The connections within each system are shown as the same color as the nodes, and the connections between these systems are present in grey color. Thicker edges indicate stronger connectivity, while thinner edges indicate weaker connectivity.
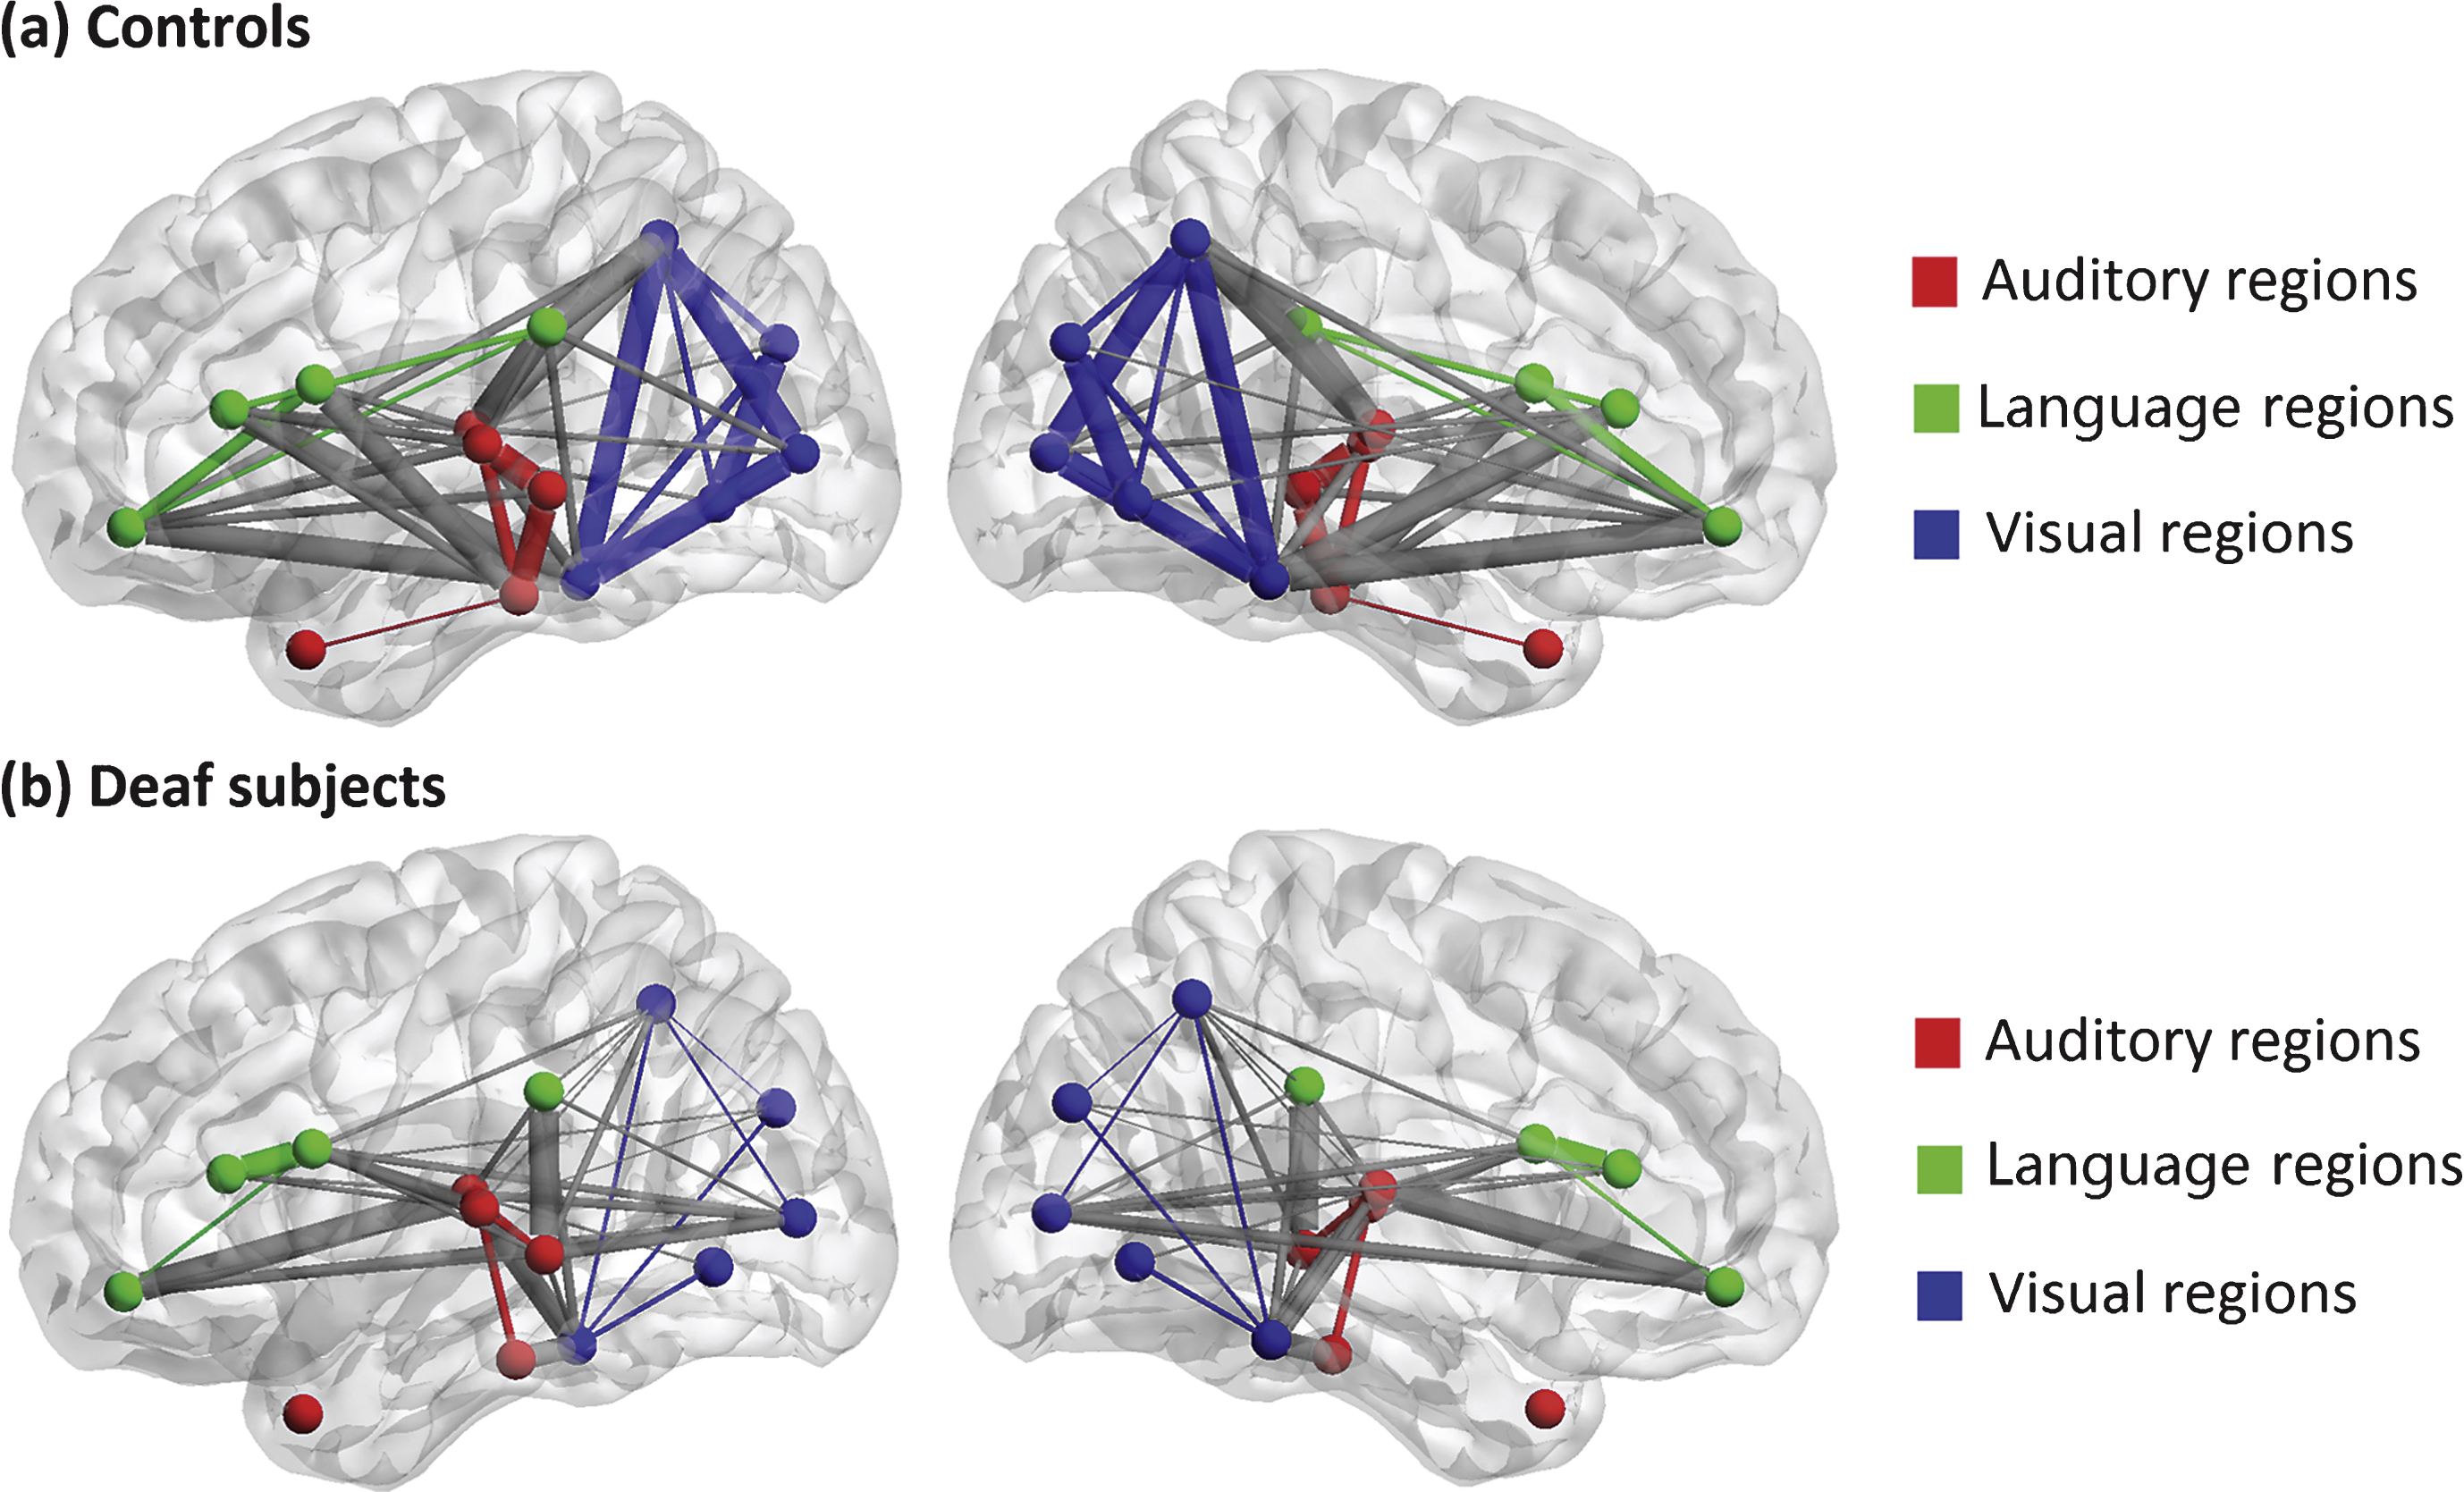
Fig.4
Between-group differences of number of structural brain connections within and between auditory, language, and visual systems with different sparsities for the connectivity matrix (20, 30 and 40 connections over a total of 91 connections). The horizon axis indicates six kinds of connections within and between auditory, language and visual systems (A-A: within auditory system; L-L: within language system; V-V: within visual system; A-L: between auditory and language systems; A-V: between auditory and visual systems; L-V: between language and visual systems). The vertical axis represents the differences of number of brain connections. Positive values indicate more connections in controls relative to deaf subjects, and negative vales indicate fewer connections in controls. Red solid circles represent the real difference between deaf and control groups, and black lines represent 95% confidence intervals with the mean difference shown as black hollow circle in the permutation test (repeated time = 10000). Group difference is significant if the red solid circle (the real difference) is not located in the 95% confidence intervals.
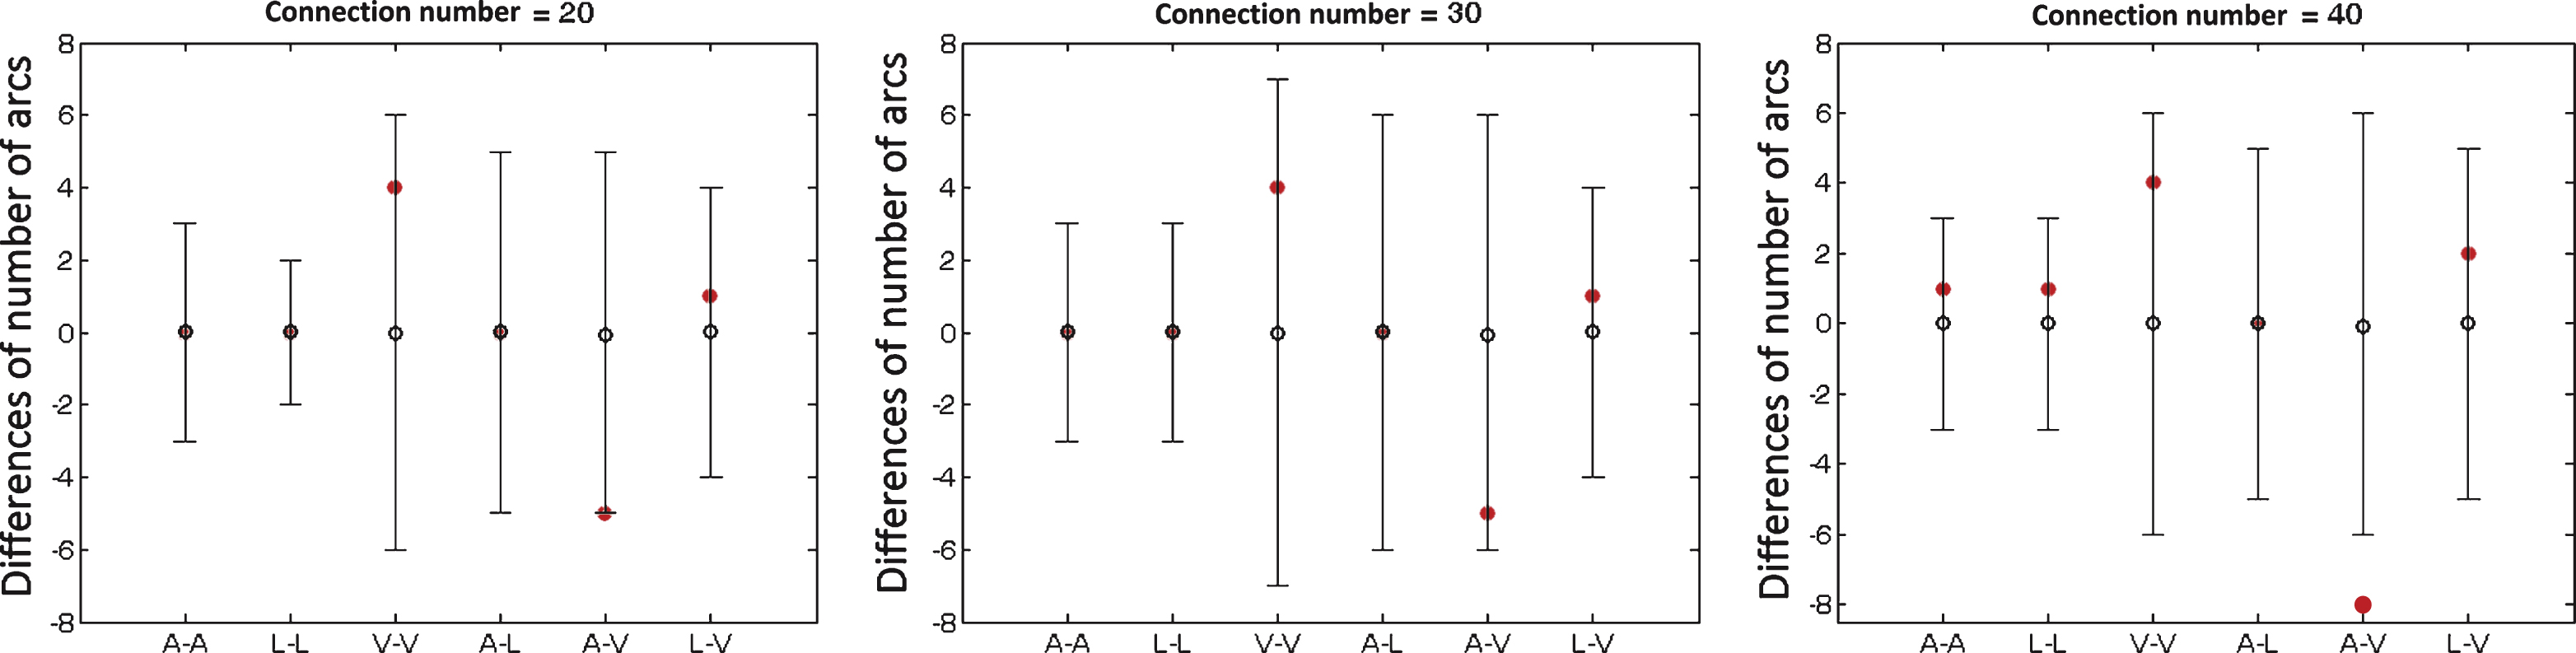
Table 1
Biographical characteristics of adolescents with prelingual deafness
| ID | Age (years) | Gender | Causes of deafness |
| 1 | 13 | Female | Congential |
| 2 | 16 | Male | Congential |
| 3 | 18 | Male | Congential |
| 4 | 16 | Male | Drug toxicity |
| 5 | 15 | Female | Congential |
| 6 | 13 | Female | Drug toxicity |
| 7 | 10 | Male | Drug toxicity |
| 8 | 14 | Female | Drug toxicity |
| 9 | 16 | Female | Congential |
| 10 | 17 | Female | Drug toxicity |
| 11 | 13 | Male | Drug toxicity |
| 12 | 17 | Male | Drug toxicity |
| 13 | 14 | Female | Congential |
| 14 | 12 | Male | Drug toxicity |
| 15 | 14 | Female | Drug toxicity |
| 16 | 15 | Male | Congential |
Table 2
List of regions of interest in the study
| Brain regions | Abbreviation | |
| Auditory regions | transverse temporal gyrus | TTG |
| superior temporal gyrus | STG | |
| middle temporal gyrus | MTG | |
| inferior temporal gyrus | ITG | |
| temporal pole | TP | |
| Language regions | pars opercularis | POPE |
| pars triangularis | PTRI | |
| pars orbitalis | PORB | |
| supramarginal gyrus | SMAR | |
| Visual regions | cuneus | CUN |
| fusiform gyrus | FFG | |
| lateral occipital cortex | LOCC | |
| lingual gyrus | LING | |
| precuneus | PCUN |
Table 3
Grey matter volumes of 14 ROIs and group differences between deaf and control groups
| Brain regions | Control | Deaf | Differences (p) | |||
| Mean | Std | Mean | Std | |||
| Auditory regions | TTG | 1221.50 | 195.71 | 1171.30 | 200.19 | 0.831 |
| STG | 14065.00 | 1414.79 | 13721.00 | 1718.05 | 0.906 | |
| MTG | 15094.00 | 2081.75 | 14848.00 | 2391.06 | 0.726 | |
| ITG | 13290.00 | 1844.08 | 13308.00 | 1866.59 | 0.512 | |
| TP | 2269.20 | 316.29 | 2205.00 | 239.41 | 0.533 | |
| Language regions | POPE | 5451.80 | 814.78 | 5391.30 | 967.87 | 0.757 |
| PTRI | 5001.10 | 1100.30 | 4756.70 | 722.30 | 0.898 | |
| PORB | 3024.40 | 419.70 | 2740.80 | 449.13 | 0.146 | |
| SMAR | 13502.00 | 2177.25 | 12981.00 | 2041.24 | 0.809 | |
| Visual regions | CUN | 3282.40 | 689.15 | 3021.20 | 468.05 | 0.458 |
| FFG | 12408.00 | 2268.92 | 11582.00 | 1365.79 | 0.482 | |
| LOCC | 13142.00 | 1472.52 | 12946.00 | 2332.49 | 0.575 | |
| LING | 7561.10 | 1328.98 | 7103.90 | 1093.52 | 0.598 | |
| PCUN | 11526.00 | 1290.66 | 10582.00 | 1278.17 | 0.089 | |

