
Physical Activity and Hippocampal Sub-Region Structure in Older Adults with Memory Complaints
Abstract
Background:
Physical activity (PA) plays a major role in maintaining cognition in older adults. PA has been shown to be correlated with total hippocampal volume, a memory-critical region within the medial temporal lobe (MTL). However, research on associations between PA and MTL sub-region integrity is limited.
Objective:
To examine the relationship between PA, MTL thickness, and its sub-regions, and cognitive function in non-demented older adults with memory complaints.
Methods:
Twenty-nine subjects aged ≥60 years, with memory complaints were recruited for this cross-sectional study. PA was tracked for 7 days using accelerometers, and average number of steps/day determined. Subjects were categorized into two groups: those who walked ≤4000 steps/day (lower PA) and those with >4000 steps/day (higher PA). Subjects received neuropsychological testing and 3T MRI scans. Nonparametric ANCOVAs controlling for age examined differences between the two groups.
Results:
Twenty-six subjects aged 72.7(8.1) years completed the study. The higher PA group (n = 13) had thicker fusiform gyrus (median difference = 0.11 mm, effect size (ES) = 1.43, p = 0.001) and parahippocampal cortex (median difference = 0.12 mm, ES = 0.93, p = 0.04) compared to the lower PA group. The higher PA group also exhibited superior performance in attention and information-processing speed (median difference = 0.90, ES = 1.61, p = 0.003) and executive functioning (median difference = 0.97, ES = 1.24, p = 0.05). Memory recall was not significantly different between the two groups.
Conclusion:
Older non-demented individuals complaining of memory loss who walked >4000 steps each day had thicker MTL sub-regions and better cognitive functioning than those who walked ≤4000 steps. Future studies should include longitudinal analyses and explore mechanisms mediating hippocampal related atrophy.
INTRODUCTION
Considerable evidence exists in the literature to suggest that regular physical exercise confers reduced risk for mild cognitive impairment and dementia [1–3] and has beneficial effects in maintaining cognitive functions in older adults [4, 5]. Further, several randomized trials have documented better cognitive performance after 6 or 12 months of exercise compared with sedentary controls [1].
In addition to establishing associations between physical activity (PA) and cognitive function, studies have shown that PA affects regional brain structure. Aerobic exercise training increases the size of the anterior hippocampus that has been found to be associated with improved spatial memory [6], and fitness improvement has been positively associated with changes in hippocampal volume and perfusion after a 3-month intervention among 40 sedentary healthy older adults [7]. Higher fitness levels were also associated with greater levels of white matter microstructure and preserved spatial memory performance [8].
However, research on associations between physical activity and medial temporal lobe (MTL) sub-region integrity is scarce. In one of the few studies to assess the effect of PA on cortical thickness, less thinning in the left prefrontal cortex was associated with higher PA levels [9]. In another study, investigators reported that while aerobic fitness at baseline was related to larger thickness in dorsolateral prefrontal cortex, it did not predict change in thickness after a 6-month exercise intervention in 58 sedentary older subjects [10]. Both these studies were performed on cognitively intact older adults; thus, the effect of PA on older adults with memory complaints is unknown. To address this knowledge gap, the objective of the present study was to examine the effect of PA on thickness in hippocampal and neighboring cortical sub-region structures as well as cognition in older adults with memory complaints.
METHODS
Participants
A total of 29 non-demented older adults (60–89 years old) with memory complaints were recruited through advertisements, media coverage, and referrals from physicians and families. Exclusion criteria included conditions impacting mobility, dementia, major psychiatric or neurologic disorders, active alcohol or substance abuse, head trauma, or systemic diseases affecting brain function, uncontrolled hypertension and cardiovascular disease. Participants were also required to have a live-in partner/roommate to ensure correct usage of the physical activity monitors during the study and to verify self-reports of activity levels. All participants underwent IRB-approved informed consent procedures prior to enrolling in the study.
Assessment of physical activity levels
Subjects were fitted with UCLA Wireless Institute bilateral ankle tri-axial accelerometers (M-DAWNs©). A 50-meter walk test was used to ‘fingerprint’ gait algorithms for each subject. Subjects were instructed to wear the monitors for 2-weeks throughout the day to measure levels of activity, including number of steps walked daily as well as time spent walking daily.
MRI procedures and image analysis
All MRI scans were performed on a Siemens Allegra 3T head-only MRI scanner. We acquired sagittal T1-weighted magnetization prepared rapid acquisition gradient-echo (MPRAGE) volumetric scans (TR 2300 ms, TE 2.93 ms, slice thickness 1 mm, 160 slices, inplane voxel size 1.3×1.3 mm, FOV 256 mm) for volumetric measurements and high-resolution oblique coronal T2-weighted fast spin echo (FSE) sequences for structural segmentation and unfolding procedures (TR 5200 ms, TE 105 ms, slice thickness 3 mm, spacing 0 mm, 19 slices, in-plane voxel size 0.39×0.39 mm, FOV 200 mm).
We used cortical unfolding [11, 12] to enhance the visibility of the convoluted MTL cortex by flattening the entire MTL gray matter volume to 2D-space. First, we manually defined white matter and cerebrospinal fluid on the oblique coronal T2 FSE structural MRI sequence with high in-plane resolution. In order to maximize visibility of the images for manual segmentation, high in-plane resolution (0.39×0.39 mm) is critical. To minimize the effect of this larger through-plane resolution across slices on boundary changes, we acquired images perpendicular to the long axis of the hippocampus where anatomical variability in hippocampal structures is smallest, thereby minimizing variability from slice to slice while maximizing in-plane resolution where anatomic variability is greatest. Once segmentation is complete, the original images are interpolated by a factor of 7, resulting in a final voxel size of 0.39×0.39×0.43 mm. Next, up to 18 connected layers of gray matter are grown out from the boundary of white matter, using a region-expansion algorithm to cover all pixels defined as gray matter. This produces a gray matter strip containing cornu ammonis (CA) fields 1, 2, and 3, the dentate gyrus (DG), subiculum (SUB), entorhinal cortex (ERC), perirhinal cortex (PRC), parahippocampal cortex (PHC), and the fusiform gyrus (FUS). We are unable to distinguish between CA fields 2, 3, and DG due to limits in resolution; thus we treat these regions as a single entity (CA23DG). It is this strip of gray matter that is the input for the unfolding procedure, an iterative algorithm based on multidimensional scaling (http://www.ccn.ucla.edu/wiki/index.php/Unfolding). We delineated boundaries between sub-regions on the original in-plane MRI images, based on histological and MRI atlases and then projected them mathematically to their corresponding coordinates in flat map space. We calculated cortical thickness in all MTL sub-regions (CA23DG, CA1, SUB, ERC, PRC, PHC, and FUS), averaged over left and right hemispheres, as well as overall MTL cortical thickness by averaging thickness across these sub-regions. To calculate thickness, for each gray matter voxel we computed the distance to the closest non-gray matter voxel. In 2D-space, for each voxel, we took the maximum distance value of the corresponding 3D voxels across all layers and multiplied by two. Mean thickness in each sub-region was calculated by averaging thickness of all 2D voxels within each region of interest.
Manual segmentations were finalized and readied for unfolding procedures by the same person. This investigator was unaware of all demographic and clinical information. All manual segmentations were performed in native space in line with previous studies using the cortical unfolding technique. We have previously reported interrater and test-retest reliability analyses for the manual proceduresinvolved [13].
Clinical and neuropsychological assessments
The clinical examination for volunteers included a psychiatric and medical history, physical exam, mental status exam, and comprehensive neuropsychological testing. The Hamilton Rating Scales for Depression [14] and Anxiety [15] were administered to assess mood and anxiety, respectively. Subjects meeting criteria for depressive or anxiety disorders were excluded to control for impact of mood on study measures.
The neuropsychological test battery was administered to assess three specific cognitive domains: 1) memory, including the Wechsler Memory Scale Third Edition (WMS-III) logical memory (delayed score), Buschke selective reminding (delayed score), Rey-Osterrieth complex figure recall (3-min delayed recall score), Hopkins Verbal Learning Test (delayed score) and Verbal Paired Associates (delayed recall score); 2) Attention and information-processing speed, including Trail making task A, Stroop color naming (Kaplan version), and Wechsler Adult Intelligence Scale Third Edition (WAIS-III) digit symbol; and 3) Executive functioning, including Trail making task B, and Stroop Interference (Kaplan version). The raw test scores (reversed for those tests where higher scores represent worse performance) were converted to Z scores by standardizing them to a mean of 0 and a standard deviation of 1. A domain Z score was obtained by averaging those Z scores belonging to the cognitive tests in that domain. The domain Z scores were used to examine associations with physical activity measures and hippocampal thickness.
Data analysis
Data were screened for outliers and normality assumptions. Three subjects had missing data (two for physical activity measures and one for the thickness measures), and were not included in the analyses. Based on the distribution of the number of steps walked daily, we categorized the subjects into either “lower” or “higher” physical activity groups depending on whether they walked less than or equal to 4000 steps per day (lower PA group; n = 13) or more than 4000 steps per day (higher PA group; n = 13). The median of number of steps walked per day for the study sample was 4009 (range 862–14355). In addition to the average number of steps walked daily, the accelerometer also collected data on average total time spent walking daily, and average total distance walked daily. The latter two measures were highly and significantly correlated with the number of steps walked daily (Spearman correlation coefficients: r = 0.93, 0.92 respectively, both p≤0.0001); we therefore examined only one of these physical activity measures and chose number of steps walked daily as the measure of interest. This choice was based on the fact that pedometers are simple and inexpensive and are more likely to be adopted for clinical and real world applications, including direct use by public [16] even if they are less sensitive to very slow walking [17], as opposed to the relative expense of accelerometers and their associated intensive data management requirements, which limit their use to research purposes [16].
Participants in the two PA groups were compared using Wilcoxon-Mann-Whitney tests (for continuous variables) or Fisher’s exact tests (for categorical variables) on all demographic and clinical characteristics at baseline. Association between thickness of hippocampal sub-regions and PA groups were examined using non-parametric ANCOVAs, controlling for those variables that differed between the two PA groups. Cognitive domain scores were also compared between the two PA groups using similar non-parametric ANCOVAs. Effect sizes (ES; Cohen’s d) are reported for all significant group differences. A significance level of p < 0.05 (two-tailed) was used for all inferences. We did not employ any correction procedures for multiple comparisons, since this is the first study in adults with memory complaints examining the association of physical activity to thickness in hippocampal sub-regions and is intended as a hypothesis generating study where it is more important not to miss possibly important findings rather than to prematurely discard potentially useful observations because of type 2 errors caused by corrections for multiplicity [18].
RESULTS
The final study sample included 26 subjects, with a median age of 71 (range 61–88) years old, with 18 (69.2%) women (Table 1). The two PA groups differed significantly in age with the lower PA group being older than the higher PA group (77 versus 68, p = 0.05); no significant differences were observed for gender, ethnicity, years of education, or MMSE scores.
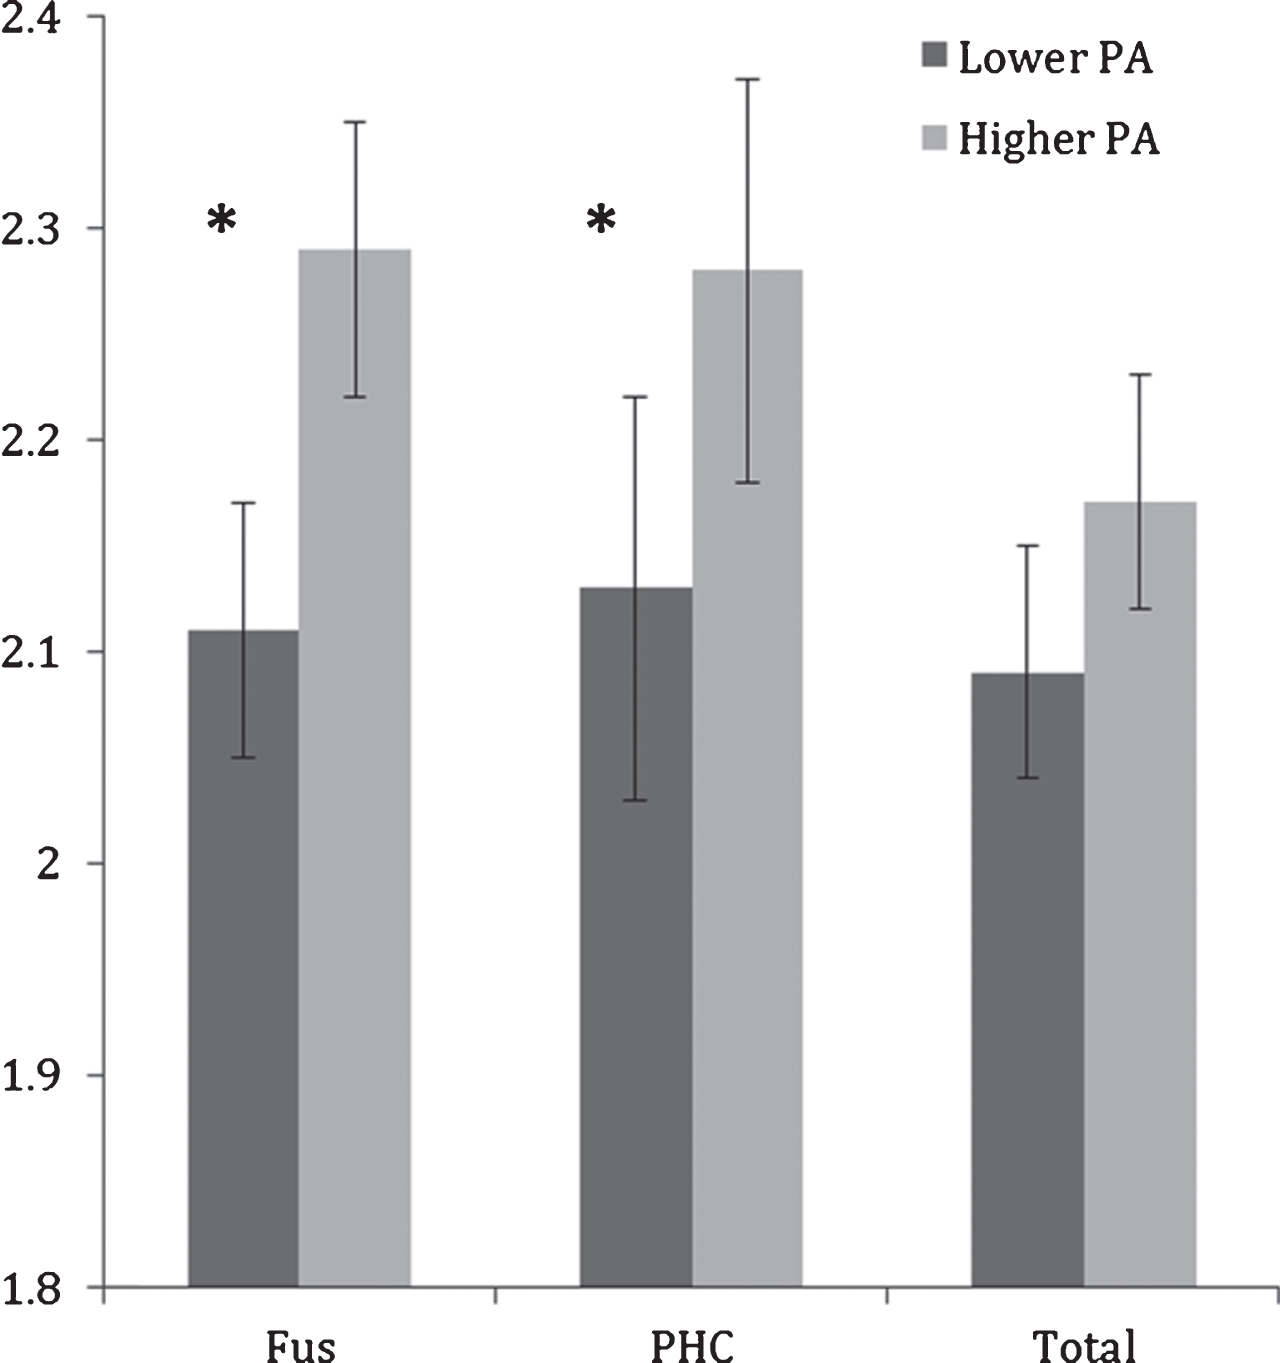
Controlling for age, the difference between higher and lower PA groups on total MTL thickness did not reach significance (F(1,23) = 3.68, p = 0.06); however, significant differences were observed between lower and higher PA groups in the fusiform gyrus and parahippocampal cortex (Table 2; Fig. 1). Compared to the lower PA group, the higher PA group had thicker fusiform gyrus (ES = 1.43, F(1,23) = 13.26, p = 0.001) and parahippocampal cortex (ES = 0.93, F(1,23) = 4.78, p = 0.04). None of the other sub-regions were significantly different between the physical activity groups.
Table 1
Demographic and clinical characteristics* of the sample
| All n = 26 | Lower PA∧ n = 13 | Higher PA∧ n = 13 | Statistics** | p-value | |
| Age (years) | 71 (66–79) | 77 (67–80) | 68 (64–72) | 215.5 | 0.05 |
| Sex (Female) | 18 (69.2) | 9 (69.2) | 9 (69.2) | – | 1.00 |
| Ethnicity (Caucasian) | 23 (88.5) | 10 (76.9) | 13 (100) | – | 0.22 |
| Education (years) | 17 (16–18) | 17 (16–22) | 17 (16–18) | 181.5 | 0.78 |
| WTAR | 44 (35–47) | 43 (31–45) | 45 (40–48) | 150.5 | 0.22 |
| MMSE | 29 (27–30) | 28 (26–29) | 29 (29–30) | 134.5 | 0.07 |
| HAMD | 3 (2–7) | 6 (2–11) | 3 (2-3) | 207.0 | 0.12 |
*Results are reported as median (IQR) for continuous variables and number of subjects (%) for categorical variables. ∧Lower PA, less than or equal to 4000 steps/day; higher PA, more than 4000 steps/day. **Wilcoxon-Mann Whitney tests for continuous variables and Fisher’s exact tests for categorical variables.
Table 2
Outcome measures of interest*
| Lower PA∧ n = 13 | Higher PA∧ n = 13 | Statistics** F(1,23) | p-value | |
| Physical Activity | ||||
| Mean steps walked/day | 2593 (2107–3335) | 6352 (5488–6942) | –4.85 | <0.0001 |
| Mean time walking/day¶ | 1945 (1550–2440) | 3887 (3332–4462) | –2.96 | 0.007 |
| Thickness# | ||||
| Total MTL | 2.09 (2.05–2.17) | 2.17 (2.13–2.22) | 3.68 | 0.06 |
| CA1 | 1.85 (1.76–1.94) | 1.85 (1.71–1.92) | 0.28 | 0.6 |
| CA23DG | 2.56 (2.39–2.63) | 2.55 (2.46–2.70) | 0.49 | 0.5 |
| ERC | 2.11 (2.00–2.19) | 2.20 (2.08–2.31) | 1.13 | 0.3 |
| FUS | 2.15 (2.06–2.23) | 2.26 (2.23–2.37) | 13.26 | 0.001 |
| PHC | 2.13 (2.04–2.24) | 2.25 (2.16–2.40) | 4.78 | 0.04 |
| PRC | 2.20 (2.00–2.29) | 2.28 (2.20–2.38) | 2.26 | 0.15 |
| SUB | 1.81 (1.72–1.95) | 1.78 (1.72–1.85) | 0.00 | 0.9 |
| Cognition& | ||||
| Memory Recall | 0.04 (–0.85–0.65) | 0.45 (0.25–1.18) | 0.33 | 0.6 |
| Attention and information processing speed | –0.16 (–0.82–0.07) | 0.74 (0.41–0.91) | 10.58 | 0.003 |
| Executive Functioning | –0.31 (–0.76–0.34) | 0.66 (0.29–0.83) | 3.89 | 0.05 |
*Results are reported as median (IQR). ∧Lower PA, less than or equal to 4000 steps/day; higher PA, more than 4000 steps/day. **Differences between the two physical activity groups are tested by non-parametric ANCOVAs controlling for age. ¶ time walking reported in seconds. #Values in mm. &Z-scores.
Fig.1
Mean fusiform (FUS) and parahippocampal cortex (PHC) and total MTL thicknesses (in mm) in lower and higher physical activity (PA) groups. Error bars represent 95% confidence limits; *p < 0.05
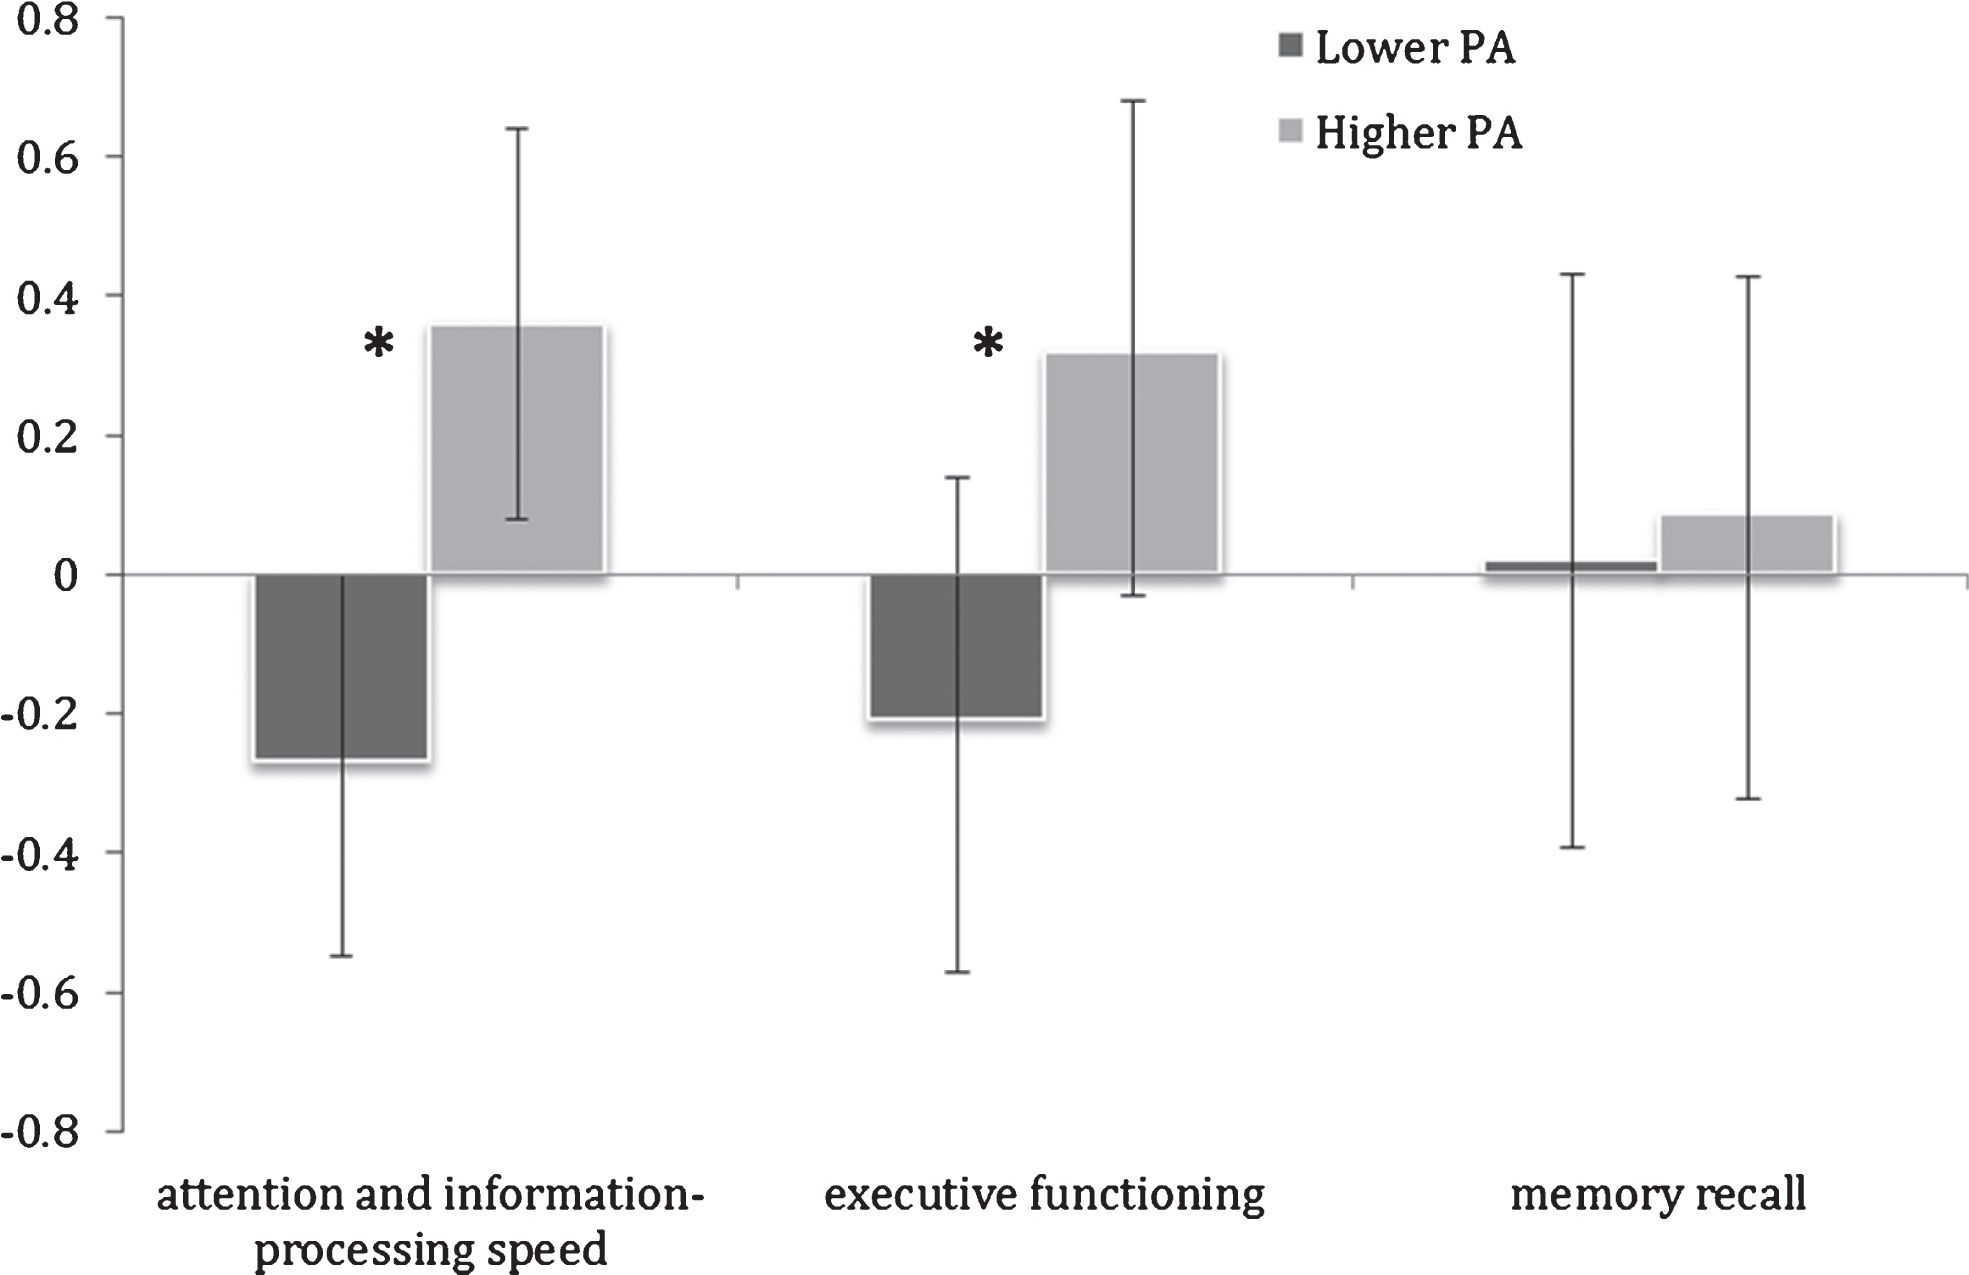
The higher PA group also exhibited significantly superior performance in attention and information-processing speed (ES = 1.61, F(1,23) = 10.58, p = 0.003) and executive functioning (ES = 1.24, F(1,23) = 3.89, p = 0.05) (Table 2; Fig. 2). Memory recall was not significantly different between the two PA groups (F(1,23) = 0.33, p = 0.6).
Fig.2
Mean cognitive domain Z-scores in lower and higher physical activity (PA) groups. Error bars represent 95% confidence limits; *p < 0.05
DISCUSSION
In this first pilot study in older adults with memory complaints of accelerometer-monitored physical activity and high-resolution MRI with MTL sub-region analyses, we found that subjects who walked more steps each day had greater thickness in the fusiform and parahippocampal cortices as well as better performance in attention, information-processing speed, and executive functioning, but not memory recall.
While previous reports have examined the association between physical activity and brain volume [19], few studies have focused in the relationship between cortical thickness and physical activity. A previous report indicated that even in the absence of significant MTL, cranial or brain volume changes over time, greater cortical thinning in MTL sub-regions is observed in older subjects at risk for Alzheimer’s disease [12] and thinner cortical regions may increase susceptibility to subtle pathological changes as incipient Alzheimer’s disease progresses. The finding of this study that greater physical activity is associated with greater thickness in subjects with memory complaints may provide further impetus for research into possible interventions that focus on physical activity to target memory problems in older adults. Furthermore, the current results also point to the utility of MTL structure integrity as a potential biomarker for adequate activity with aging and for examining the effects of an exercise intervention.
Participants in the study were categorized into two groups, using 4000 steps walked daily as the cut-off, based on the distribution of the observed data. Interestingly, in the long-running Nakanojo Study that includes almost 500 participants aged 65 years and older, results indicated that better mental health is associated with walking more than 4000 steps per day and/or >5 min/day at intensity >3 metabolic equivalents while better physical health is associated with >8000 steps [20]. A recent review that assessed how many steps per day are required for optimal health concluded that healthy, older adults need at least an average of 7100 steps per day [16]. It is noteworthy that this threshold is comparable to the mean steps/day of the higher PA group. Moreover, the same study observed that for older adults with chronic diseases or disability, the recommended number of steps is 4600 steps/day, which is comparable to the cut-off used in the present study. We also note that 4000 steps per day are easily achievable by older adults and correspond to 30–40 minutes of walking.
The observed effects of PA on cognitive domains in the current study are consistent with several previous studies [21–23]. In a sample of 93 adults aged 60 and older, it was observed that a higher level of physical functioning (testing included several walking measures) was significantly associated with greater processing speed and better executive functions but was not associated with better memory performance [21]. Our results strengthen the existing evidence linking PA to cognitive performance and, in particular, to processing speed and executive function.
While the exact mechanism of how physical exercise benefits cortical thickness is uncertain, several possibilities exist. Some studies have suggested that PA can increase brain-derived neurotrophic factor (BDNF) in serum and brain. More specifically, a recent investigation observed that among 19 healthy older adults, a 35-min session of physical activity has a significantly larger impact on serum BDNF levels than either cognitive training or mindfulness practice [24]. Physical activity is also thought to increasehippocampal synaptic plasticity either directly via signal transduction mechanisms or indirectly by increasing BDNF levels, which in turn regulate specific signal transduction mechanisms [25]. In addition, exercise may augment the effects of BDNF on synaptic-plasticity, through a positive feedback loop in which it concurrently increases the mRNA levels of both itself and its receptor [26]. Therefore, BDNF up-regulation, strongly evoked by PA, potentiates the protection of neurons from eventual damage and favors neurogenesis and plasticity [27]. Interestingly, a recent systematic review concluded that aerobic exercise was a major source for the enhancement of BDNF-dependent executive functioning [28], consistent with our finding of increased PA and enhanced executive functioning. PA also has been associated with a reduction of plasma amyloid-β levels [29, 30], which are associated with a greater risk of cognitive impairment [30, 31]. It is also possible that PA indirectly contributes to preserving cortical thickness by maintaining a healthy body mass index and reducing the risk for chronic diseases, such as diabetes and cardiovascular disease and/or inflammatory and metabolic responses related to obesity. Finally, a recently proposed theory, the Adaptive Capacity Model, explores an evolutionary connection between hippocampal structures and exercise [32]. This model suggests that during aging, the brain responds adaptively by diminishing capacity so as to reduce energy costs, leading to age-related regional brain atrophy and associated function, while engaging exercise in late life can adaptively increase capacity, thus reducing the impacts of cognitiveaging [32].
Strengths of this study include 3T MRI scanning, which allows for a detailed assessment of MTL structures as well as objective markers of physical activity. The primary limitation of this study is the small sample size and the findings of this pilot study need to be replicated in a larger sample before the specific sub-regions associated with physical exercise can be identified with certainty. While we controlled for age in all the analyses, the age difference between the two physical activity groups is also a concern. Finally, this was a cross-sectional study and therefore causation cannot be inferred. Despite these limitations, this preliminary study of older adults indicates that physical activity, specifically the number of steps walked daily, is associated with greater thickness in MTL sub-regions, in addition to enhanced cognitive performance. These findings are novel, suggesting that physical activity may be a promising protectivefactor against hippocampal atrophy in older adults with memory complaints and warrant further exploration in longitudinal studies and analyses of mediating mechanisms.
ACKNOWLEDGMENTS
Supported by McLoughlin Cognitive Health Gift Fund, NIH (P01-AG024831), Fran and Ray Stark Foundation Fund, American Foundation for Aging Research, and Hartford Foundation. Funding/Support: This study was supported by grants from NIA OAIC (5P30AG028748), and UCLA CTSI (UL1TR000124).
Authors’ disclosures available online (https://www.j-alz.com/manuscript-disclosures/17-0586r1).
REFERENCES
[1] | Ahlskog JE , Geda YE , Graff-Radford NR , Petersen RC ((2011) ) Physical exercise as a preventive or disease-modifying treatment of dementia and brain aging. Mayo Clin Proc 86: , 876–884. |
[2] | Kirk-Sanchez NJ , McGough EL ((2014) ) Physical exercise and cognitive performance in the elderly: Current perspectives. Clin Interv Aging 9: , 51–62. |
[3] | Radak Z , Hart N , Sarga L , Koltai E , Atalay M , Ohno H , Boldogh I ((2010) ) Exercise plays a preventive role against Alzheimer’s disease. J Alzheimers Dis 20: , 777–783. |
[4] | Baumgart M , Snyder HM , Carrillo MC , Fazio S , Kim H , Johns H ((2015) ) Summary of the evidence on modifiable risk factors for cognitive decline and dementia: A population-based perspective. Alzheimers Dement 11: , 718–726. |
[5] | Gomez-Pinilla F , Hillman C ((2013) ) The influence of exercise on cognitive abilities. Compr Physiol 3: , 403–428. |
[6] | Erickson KI , Voss MW , Prakash RS , Basak C , Szabo A , Chaddock L , Kim JS , Heo S , Alves H , White SM , Wojcicki TR , Mailey E , Vieira VJ , Martin SA , Pence BD , Woods JA , McAuley E , Kramer AF ((2011) ) Exercise training increases size of hippocampus and improves memory. Proc Natl Acad Sci U S A 108: , 3017–3022. |
[7] | Oberlin LE , Verstynen TD , Burzynska AZ , Voss MW , Prakash RS , Chaddock-Heyman L , Wong C , Fanning J , Awick E , Gothe N , Phillips SM , Mailey E , Ehlers D , Olson E , Wojcicki T , McAuley E , Kramer AF , Erickson KI ((2016) ) White matter microstructure mediates the relationship between cardiorespiratory fitness and spatial working memory in older adults. Neuroimage 131: , 91–101. |
[8] | Maass A , Duzel S , Goerke M , Becke A , Sobieray U , Neumann K , Lovden M , Lindenberger U , Backman L , Braun-Dullaeus R , Ahrens D , Heinze HJ , Muller NG , Duzel E ((2015) ) Vascular hippocampal plasticity after aerobic exercise in older adults. Mol Psychiatry 20: , 585–593. |
[9] | Walhovd KB , Storsve AB , Westlye LT , Drevon CA , Fjell AM ((2014) ) Blood markers of fatty acids and vitamin D, cardiovascular measures, body mass index, and physical activity relate to longitudinal cortical thinning in normal aging. Neurobiol Aging 35: , 1055–1064. |
[10] | Jonasson LS , Nyberg L , Kramer AF , Lundquist A , Riklund K , Boraxbekk CJ ((2016) ) Aerobic exerciseintervention, cognitive performance, and brain structure: Results from the Physical Influences on Brain in Aging (PHIBRA) study. Front Aging Neurosci 8: , 336. |
[11] | Burggren AC , Zeineh MM , Ekstrom AD , Braskie MN , Thompson PM , Small GW , Bookheimer SY ((2008) ) Reduced cortical thickness in hippocampal subregions among cognitively normal apolipoprotein E ɛ4 carriers. Neuroimage 41: , 1177–1183. |
[12] | Donix M , Burggren AC , Suthana NA , Siddarth P , Ekstrom AD , Krupa AK , Jones M , Martin-Harris L , Ercoli LM , Miller KJ , Small GW , Bookheimer SY ((2010) ) Family history of Alzheimer’s disease and hippocampal structure in healthy people. Am J Psychiatry 167: , 1399–1406. |
[13] | Ekstrom AD , Bazih AJ , Suthana NA , Al-Hakim R , Ogura K , Zeineh M , Burggren AC , Bookheimer SY ((2009) ) Advances in high-resolution imaging and computational unfolding of the human hippocampus. Neuroimage 47: , 42–49. |
[14] | Hamilton M ((1960) ) A rating scale for depression. J Neurol Neurosurg Psychiatry 23: , 56–62. |
[15] | Hamilton M ((1959) ) The assessment of anxiety states by rating. Br J Med Psychol 32: , 50–55. |
[16] | Tudor-Locke C , Craig CL , Aoyagi Y , Bell RC , Croteau KA , De Bourdeaudhuij I , Ewald B , Gardner AW , Hatano Y , Lutes LD , Matsudo SM , Ramirez-Marrero FA , Rogers LQ , Rowe DA , Schmidt MD , Tully MA , Blair SN ((2011) ) How many steps/day are enough? For older adults and special populations. Int J Behav Nutr Phys Act 8: , 80. |
[17] | Cyarto EV , Myers A , Tudor-Locke C ((2004) ) Pedometer accuracy in nursing home and community-dwelling older adults. Med Sci Sports Exerc 36: , 205–209. |
[18] | Rothman KJ ((1990) ) No adjustments are needed for multiple comparisons. Epidemiology 1: , 43–46. |
[19] | Erickson KI , Prakash RS , Voss MW , Chaddock L , Hu L , Morris KS , White SM , Wojcicki TR , McAuley E , Kramer AF ((2009) ) Aerobic fitness is associated with hippocampal volume in elderly humans. Hippocampus 19: , 1030–1039. |
[20] | Aoyagi Y , Shephard RJ ((2009) ) Steps per day: The road to senior health? Sports Med 39: , 423–438. |
[21] | Desjardins-Crepeau L , Berryman N , Vu TT , Villalpando JM , Kergoat MJ , Li KZ , Bosquet L , Bherer L ((2014) ) Physical functioning is associated with processing speed and executive functions in community-dwelling older adults. J Gerontol B Psychol Sci Soc Sci 69: , 837–844. |
[22] | Johnson LG , Butson ML , Polman RC , Raj IS , Borkoles E , Scott D , Aitken D , Jones G ((2016) ) Light physical activity is positively associated with cognitive performance in older community dwelling adults. J Sci Med Sport 19: , 877–882. |
[23] | McGough EL , Kelly VE , Logsdon RG , McCurry SM , Cochrane BB , Engel JM , Teri L ((2011) ) Associations between physical performance and executive function in older adults with mild cognitive impairment: Gait speed and the timed “up & go” test. Phys Ther 91: , 1198–1207. |
[24] | Hakansson K , Ledreux A , Daffner K , Terjestam Y , Bergman P , Carlsson R , Kivipelto M , Winblad B , Granholm AC , Mohammed AK ((2017) ) BDNF responses in healthy older persons to 35 minutes of physical exercise, cognitive training, and mindfulness: Associations with working memory function. J Alzheimers Dis 55: , 645–657. |
[25] | Lista I , Sorrentino G ((2010) ) Biological mechanisms of physical activity in preventing cognitive decline. Cell Mol Neurobiol 30: , 493–503. |
[26] | Vaynman S , Ying Z , Gomez-Pinilla F ((2003) ) Interplay between brain-derived neurotrophic factor and signal transduction modulators in the regulation of the effects of exercise on synaptic-plasticity. Neuroscience 122: , 647–657. |
[27] | Budni J , Bellettini-Santos T , Mina F , Garcez ML , Zugno AI ((2015) ) The involvement of BDNF, NGF and GDNF in aging and Alzheimer’s disease. Aging Dis 6: , 331–341. |
[28] | de Assis GG , de Almondes KM ((2017) ) Exercise-dependent BDNF as a modulatory factor for the executive processing of individuals in course of cognitive decline. A systematic review. Front Psychol 8: , 584. |
[29] | Brown BM , Peiffer JJ , Taddei K , Lui JK , Laws SM , Gupta VB , Taddei T , Ward VK , Rodrigues MA , Burnham S , Rainey-Smith SR , Villemagne VL , Bush A , Ellis KA , Masters CL , Ames D , Macaulay SL , Szoeke C , Rowe CC , Martins RN ((2013) ) Physical activity and amyloid-beta plasma and brain levels: Results from the Australian Imaging, Biomarkers and Lifestyle Study of Ageing. Mol Psychiatry 18: , 875–881. |
[30] | Stillman CM , Lopez OL , Becker JT , Kuller LH , Mehta PD , Tracy RP , Erickson KI ((2017) ) Physical activity predicts reduced plasma beta amyloid in the Cardiovascular Health Study. Ann Clin Transl Neurol 4: , 284–291. |
[31] | Baker JE , Lim YY , Pietrzak RH , Hassenstab J , Snyder PJ , Masters CL , Maruff P ((2017) ) Cognitive impairment and decline in cognitively normal older adults with high amyloid-beta: A meta-analysis. Alzheimers Dement (Amst) 6: , 108–121. |
[32] | Raichlen DA , Alexander GE ((2017) ) Adaptive capacity: An evolutionary neuroscience model linking exercise, cognition, and brain health. Trends Neurosci 40: , 408–421. |

