
Findings from the Longitudinal CINRG Becker Natural History Study
Abstract
Background:
Becker muscular dystrophy is an X-linked, genetic disorder causing progressive degeneration of skeletal and cardiac muscle, with a widely variable phenotype.
Objective:
A 3-year, longitudinal, prospective dataset contributed by patients with confirmed Becker muscular dystrophy was analyzed to characterize the natural history of this disorder. A better understanding of the natural history is crucial to rigorous therapeutic trials.
Methods:
A cohort of 83 patients with Becker muscular dystrophy (5–75 years at baseline) were followed for up to 3 years with annual assessments. Muscle and pulmonary function outcomes were analyzed herein. Age-stratified statistical analysis and modeling were conducted to analyze cross-sectional data, time-to-event data, and longitudinal data to characterize these clinical outcomes.
Results:
Deletion mutations of dystrophin exons 45–47 or 45–48 were most common. Subgroup analysis showed greater pairwise association between motor outcomes at baseline than association between these outcomes and age. Stronger correlations between outcomes for adults than for those under 18 years were also observed. Using cross-sectional binning analysis, a ceiling effect was seen for North Star Ambulatory Assessment but not for other functional outcomes. Longitudinal analysis showed a decline in percentage predicted forced vital capacity over the life span. There was relative stability or improved median function for motor functional outcomes through childhood and adolescence and decreasing function with age thereafter.
Conclusions:
There is variable progression of outcomes resulting in significant heterogeneity of the clinical phenotype of Becker muscular dystrophy. Disease progression is largely manifest in adulthood. There are implications for clinical trial design revealed by this longitudinal analysis of a Becker natural history dataset.
INTRODUCTION
Becker muscular dystrophy (BMD) is an allelic disease to Duchenne muscular dystrophy (DMD), and both disorders are caused by mutations in the DMD gene. BMD has a far greater age range at onset and more variability in progressive motor decline compared to DMD [1–4]. Therefore, the Cooperative International Neuromuscular Research Group (CINRG) conducted a prospective natural history study enrolling 83 participants, both ambulatory and non-ambulatory, with BMD. All had confirmed DMD gene deletion mutations that predicted preservation of the reading frame. Participants were followed annually for up to 3 years at 11 study sites in Canada, Italy, the United Kingdom, and multiple centers in the United States. Multiple functional outcomes evaluated included timed function tests, six-minute walk distance, NorthStar Ambulatory Assessment, upper limb, and pulmonary function. Analysis of the initial baseline (at enrollment) outcomes dataset were published previously [5].
There are some reports in the literature describing the phenotype of BMD and genotype-phenotype correlations in BMD [2, 6–10]. Far fewer report longitudinal follow-up to characterize the progression of BMD. Bello et al. [11] characterized mutation-specific BMD phenotypes with longitudinal measures over 1 year. De Wel et al. studied the respiratory phenotype of BMD longitudinally [12]. The study reported here adds to this body of knowledge with a longer follow-up period. The aim was to better characterize the clinical course of BMD for two purposes. First, the characterization of progression can lead to a better understanding of the disease course and thus inform patient clinical care. Second, the description of longitudinal trajectories of functional outcome measures is crucial to inform clinical treatment trial design, both for the evaluation of outcome measures and drug effect as well as to inform eligibility criteria and sample size determination.
MATERIALS AND METHODS
The study design, participants and functional assessment procedures were previously published [5]. Detailed procedures for functional assessments followed CINRG protocols previously described in detail [13]. Briefly, data were collected on a variety of functional outcomes including time to stand from supine velocity (STANDVEL) (rises/s), time to climb 4 steps velocity (CLIMBVEL) (stairs/s), time to run/walk 10 m velocity (RWVEL) (m/s), six-minute walk distance (6MWD) (m), NorthStar ambulatory assessment (NSAA) score, performance of the upper limb 1.2 (PUL1.2) and % predicted FVC.
Procedures involving experiments on human subjects are done in accord with the ethical standards of the Committee on Human Experimentation at each participating institution in which the experiments were done or in accord with the Helsinki Declaration of 1975.
Statistical methods
Statistical analysis and modeling were conducted based on whether the data used was cross-sectional (baseline data only or median measurement using all available timepoints), repeated cross-sectional (using the median observation per participant per a time interval of interest), or longitudinal (using all available timepoints). Given the possibility of measurement error, as well as the influence of motivation and day/season/unknown factors on assessments on a given day, median measurements of participants across all available timepoints were also modeled, allowing robust quantification of functional ability.
For the binning analysis to describe the natural history, median measurements per time interval were used. The decision to use age stratification at the level of minors vs. adults was made based on initial descriptive analysis. Spearman correlations were used to quantify associations between baseline (at enrollment) measurements of different outcomes and age.
A shift analysis was carried out on the NSAA data using change over 12 months based on blocks of one. These include change from baseline to first annual follow-up, first annual follow-up to second follow-up, second follow-up to third follow-up, combined; two (i.e., change from baseline to second follow-up, first follow-up to third follow-up combined), and three years (baseline to third follow-up). For the longitudinal mixed-effect analysis (random intercept models), both raw outcomes (timed function test velocities, 6MWD, NSAA) and log-transformed outcomes were considered to model the functional shape of the population-level trajectory and model diagnostics conducted. In the <18 years of age group, a quadratic term was also considered to model a period of improvement followed by stability and decline. Imputation was conducted for missing data for timed function tests and 6MWD only if a participant lost ambulation during the study and hence it was certain that a participant had lost the ability to complete a test due to disease progression, in which case their timed function test velocities, as well as 6MWD, were imputed to a small epsilon (for log-transformed analysis; zero otherwise to represent the loss of ability, hence zero velocity or zero meters). For inferential modeling, if a participant had ever only a zero recorded for an outcome across visits, they were not retained for that analysis. This removed one participant in analysis of 6MWD, CLIMBVEL, and STANDVEL. Given the small sample sizes seen for mutation groups, only some analyses were adjusted for mutation groups, including the longitudinal analysis. Time to event analysis was conducted for the event of the first time to stand from supine of 10 seconds or more using nonparametric maximum likelihood estimation and bootstrapping assuming interval censoring. All analyses were conducted in R with the following packages (interval [14], lme4 [15], ggplot2 [16], sjPlot [17], visreg [18]). No correction for multiple testing was done.
RESULTS
Overall
Baseline characteristics (Table 1) are presented for two age-based strata, comprising participants less than 18 years of age at the age of enrollment for one group and participants greater than or equal to 18 years of age for the other group. This largely separates a childhood and adolescent phase, in which the disease process is superimposed on growth and development, from an adult phase. Approximately 39% of participants were between the ages of 5 and 18 years at enrollment and approximately 61% of participants were between 18 and 76 years of age at enrollment. The use of assistive devices or orthotics was distributed across the age range of the study, with no participants initiating their use newly during the study. While there was no evidence of a difference in age at baseline between orthotic users vs non-users (p = 0.95), assistive device use was more prevalent in older participants (mean age in years = 40.7 [users] vs 24.2 [non-users]; p = 0.0006, 95% CI = 7.6, 25.3 years). We observed a ceiling effect for NSAA in those less than 18 years of age. There was a ceiling effect across the majority of participants in both age groups (85% and 86% of minors and adults, respectively with a score between 72 and 74) for the PUL 1.2 assessment. None of the other outcome measures had such a uniform ceiling effect. Of note, both standing height and calculated height [19] were recorded for all participants. Standing height and calculated height were strongly correlated (Spearman correlation: 0.86) with calculated height tending to overestimate standing height.
Table 1
Summary baseline characteristics (at first visit)
| Characteristic mean (SD); available n | <18 years of age (n = 32) | ≥18 years of age (n = 51) |
| Age in years; n = 83 | 12 (3.6) | 39.9 (14.4) |
| TTSTAND (seconds) n = 63 | 3.4 (3.4) | 10.7 (18.1) |
| STAND velocity (rises/s); n = 63 | 0.41 (0.18) | 0.21 (0.16) |
| TTCLIMB (seconds); n = 64 | 2.2 (1.4) | 6.8 (6.2) |
| CLIMB velocity (stairs/s); n = 64 | 2.14 (0.74) | 1.06 (0.83) |
| TTRW (seconds); n = 66 | 3.9 (1.6) | 8.5 (4.0) |
| RW velocity (m/s); n = 66 | 2.85 (0.75) | 1.52 (0.87) |
| 6MWD (m); n = 64 | 479.5 (94.7) | 377.7 (128.7) |
| NSAA (units); n = 67 | 31.7 (4.5) | 21.2 (8.9) |
| Standing height (cms); n = 66 | 148.1 (21.4) | 176.0 (5.8) |
| Weight (kgs); n = 82 | 44.2 (18.2) | 82 (19.8) |
| % predicted FVC; n = 75 | 92.9 (17.8) | 81.4 (16.6) |
| PUL 1.2 score; n = 63 | 78.8 (2.1) | 78.8 (2.3) |
| Ambulatory | 100% | 75% |
| Distribution of mutations; n = 83 | exons 45–47 (15.6%); 45–48 (18.8%); Other deletions (65.6%) | exons 45–47 (39.2%); 45–48 (21.6%); Other deletions (39.2%) |
Abbreviations: TTSTAND: time to stand from supine; TTCLIMB: time to climb 4 steps; TTRW: time to run/walk 10m; 6MWD: six-minute walk distance; NSAA: NorthStar Ambulatory Assessment; FVC: Forced vital capacity; PUL 1.2: Performance of Upper Limb version 1.2.
Distribution of mutations
To be eligible for the study, participants had a DMD gene mutation that was predicted to be in-frame [20]. The original study design planned to bin participants based on correspondence to an out-of-frame mutation whose frame would be restored with exon skipping of exons 45, 51 or 53. However, few participants had deletions corresponding to exon skipping of exons 51 and 53 (Supplemental Figure 1). Therefore, the data analysis incorporated 3 groups based on mutation comprising one bin each for the 2 most common DMD deletion mutations, deletion of exons 45–47, deletion of exons 45–48 and a third bin for all other deletions (Supplemental Table 1). The median age at baseline in the ‘other mutation’ group was 18 years (mean 25 years) in contrast to 37 years (mean 36 years) in the exon 45–47 group and 34 years (mean 30 years) in the exon 45–48 group. The median age for the cohort at first visit was 25 years (mean 29 years).
Distribution of milestones
The age of symptom onset had a median of 7 years (IQR = 9 years; range: 0.5 to 57 years) while the age of diagnosis (confirmed by muscle biopsy and/or DNA for BMD) had a median of 12.9 years (IQR = 25.53; range: 0.47 to 75.46 years), with a difference of 10.1 years on average (median: 3.9 years; IQR = 0.8 to 17.3 years). Nine participants had a recorded age at transition to fulltime wheelchair use with a median of 48 years (IQR = 11 years; range: 20 to 63 years); these participants had all transitioned to fulltime wheelchair use prior to enrollment in the study.
Corticosteroid exposure
Sustained use of corticosteroids is less common in BMD as compared to DMD. In our study, we had 19 participants with some lifetime corticosteroid exposure (mean[median] lifetime exposure at last visit = 5.6 [2.1] years). Of these 19, ten participants had exposure to corticosteroids during the study (mean[median] lifetime exposure at last visit = 7.0 [3.3] years).
Follow-up assessments
The prior report of the baseline values of the CINRG Becker Natural History Study presented the details of the cohort of 83 participants at the baseline visit [5]. Of these 83 participants, 75, 61, and 39 had one, two, and three follow up assessments, respectively. Follow up was planned at annual intervals but could have a longer latency (mean (median)±SD: 1.07 (1.01)±0.38 years) up to 3.05 years and as low as 0.08 years when the follow-up occurred at the end of the study.
Ambulation
Two participants became non-ambulatory during follow-up: one at age 35 years, and another at age 46 years. Ambulation status was defined based on the ability to do the 10 m run/walk test. The last ambulatory measurements of RWVEL in these 2 participants prior to losing independent ambulation ability were 17.8 seconds (for the 35 year old) and 21.2 seconds (for the 46 year old).
Completeness of data
As a measure of data completeness for the clinical outcomes (NSAA, 6MWD, RWVEL, STANDVEL, CLIMBVEL) across the longitudinal dataset, we analyzed the levels of missing data at the level of observations from the study visits where participants were classified as ambulatory. There were 179 time points in which all timed function tests, 6MWT, and NSAA were completed (179/206 ∼87%). In terms of dominant missing combined patterns, for 9 observations, the only missing data was for STANDVEL. For 4 observations, the only missing data was for CLIMBVEL. Looking at one outcome at a time, the amount of missing data was highest for STANDVEL with CLIMBVEL, 6MWD, followed by NSAA and RWVEL, each with the least amount of missing data.
Repeated cross-sectional binning analysis
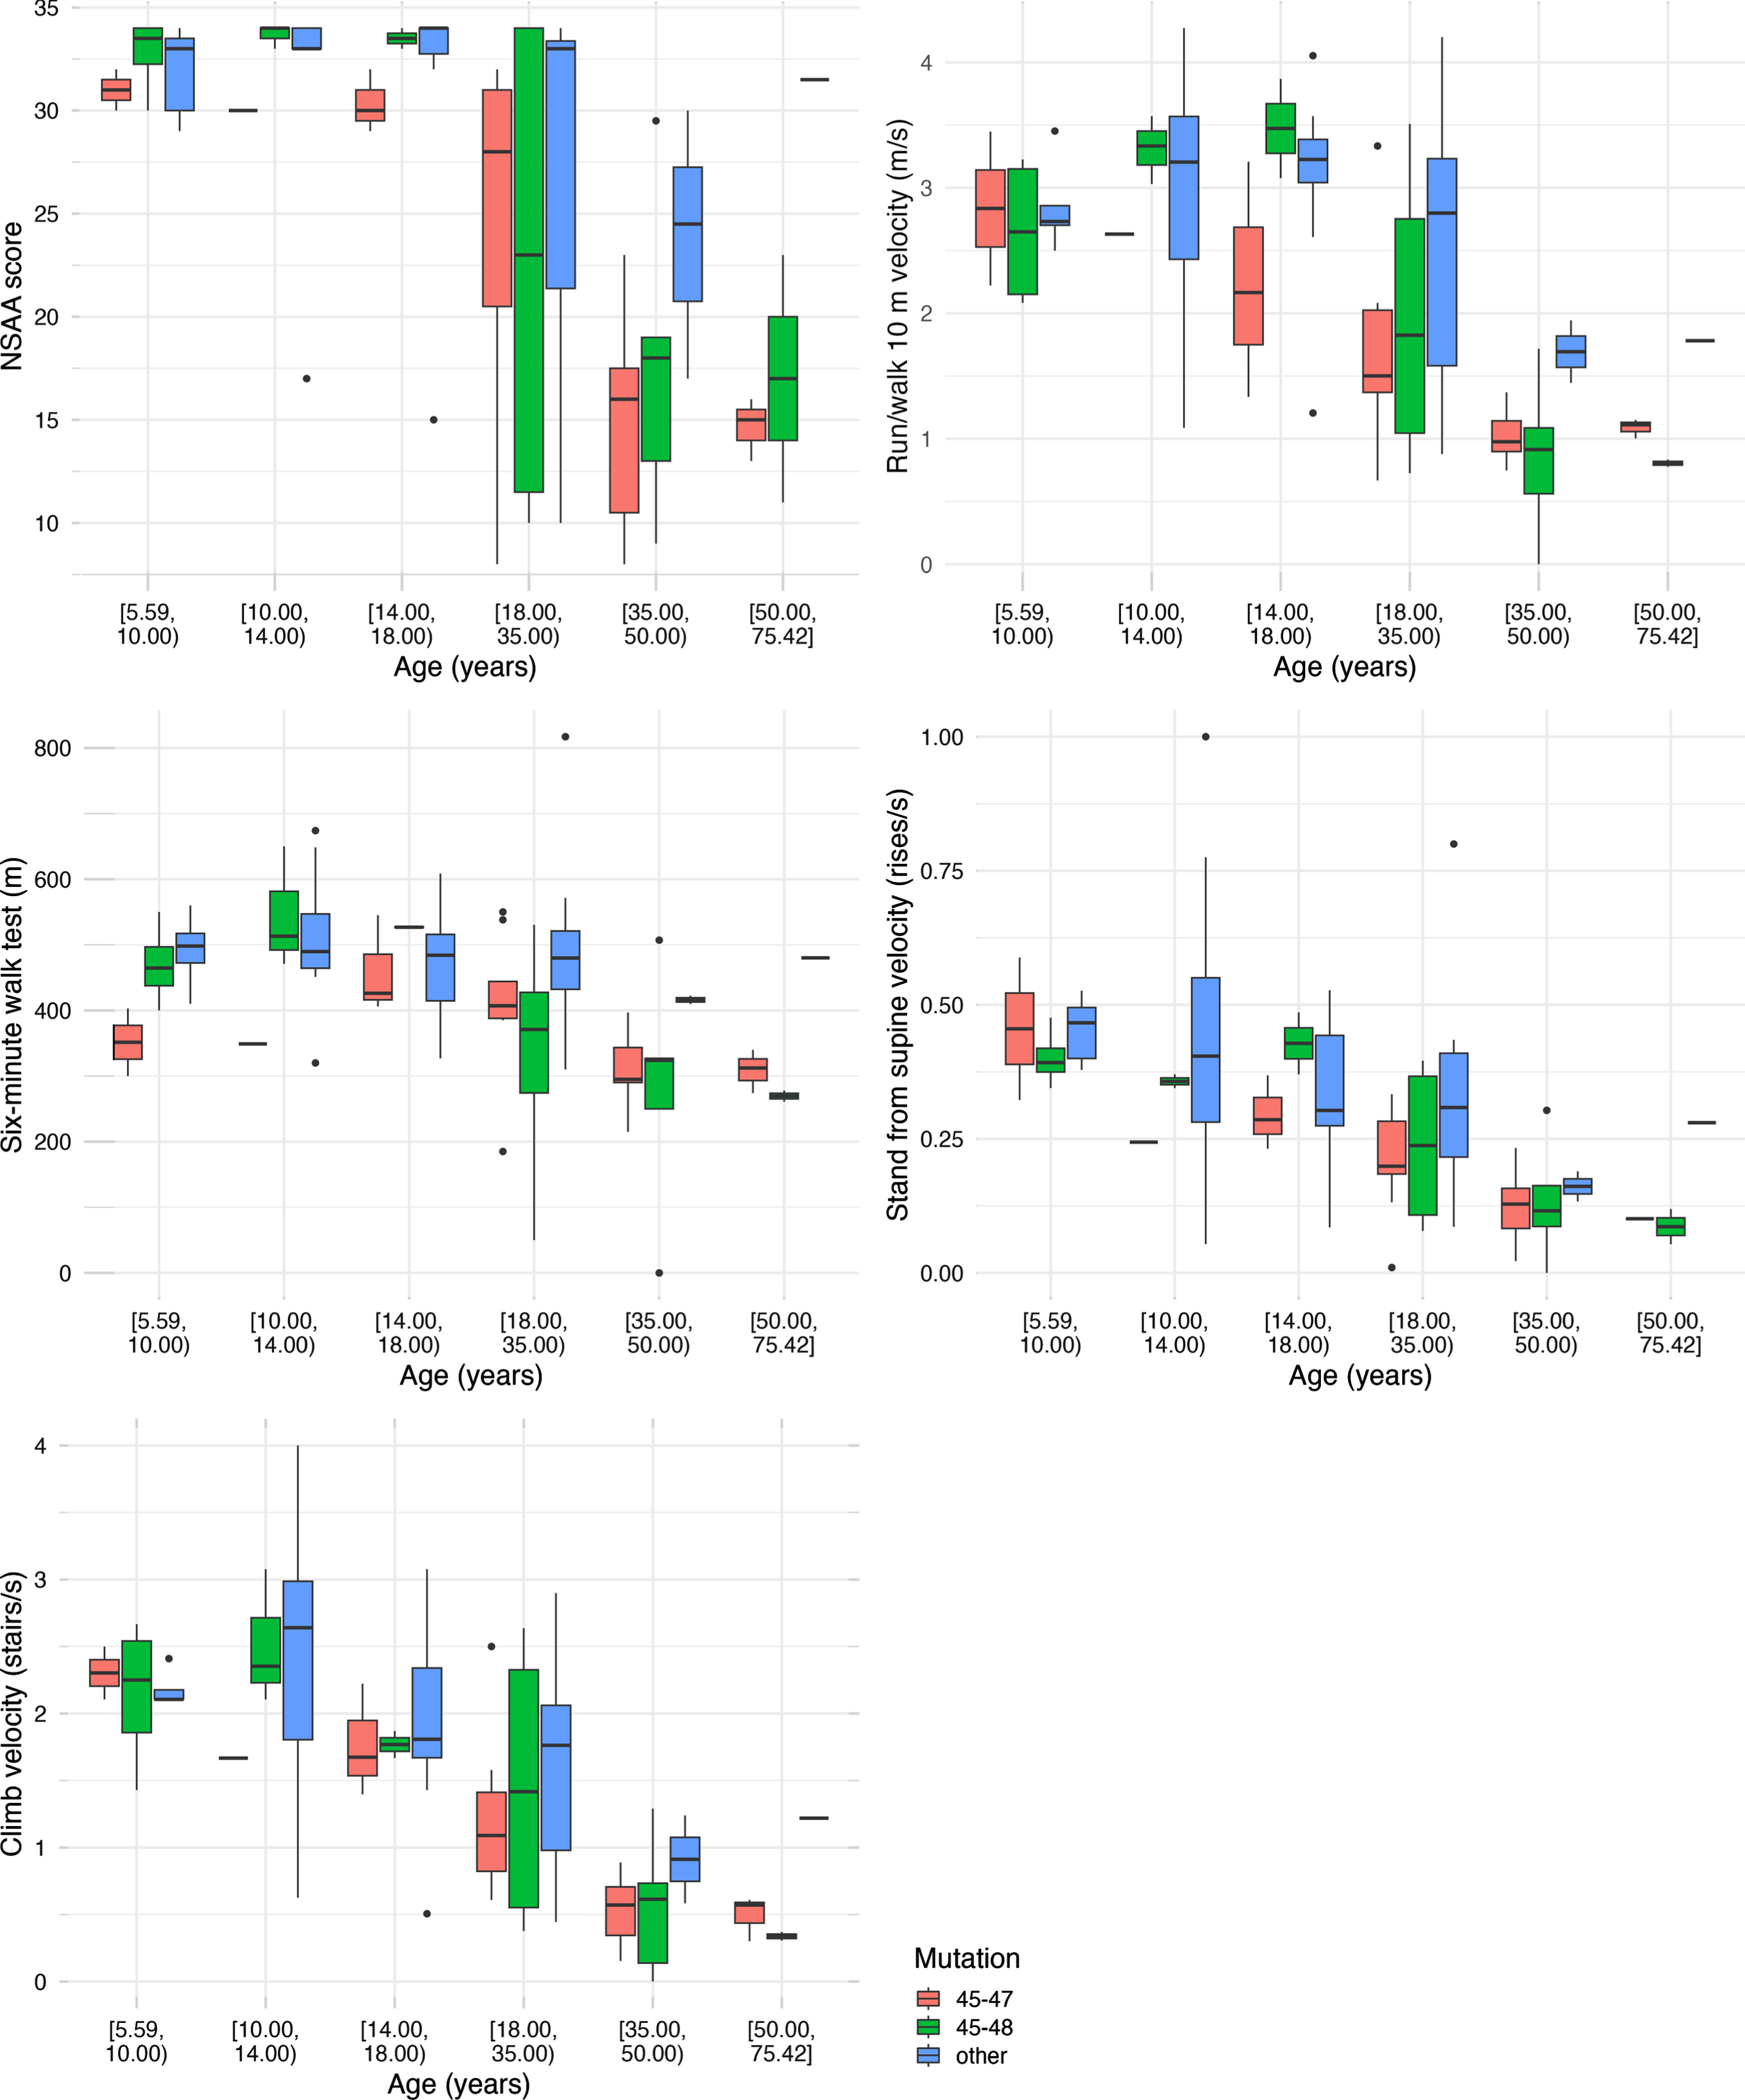
Participants were distributed across the lifespan from age 5 to 76 years. Choosing one median observation per participant per interval, we analyzed the timed function tests by age groups and by mutation group (Fig. 1). For NSAA, most participants less than 18 years were near the top of the scale. The NSAA score decreased with increasing age after age 18 years. The other four functional measures are also shown (Fig. 1). These demonstrate either stability or improved median function through childhood and adolescence and decreasing median function with age thereafter.
Fig. 1
Boxplots using one median observation per participant per age interval stratified by age group and mutation status.
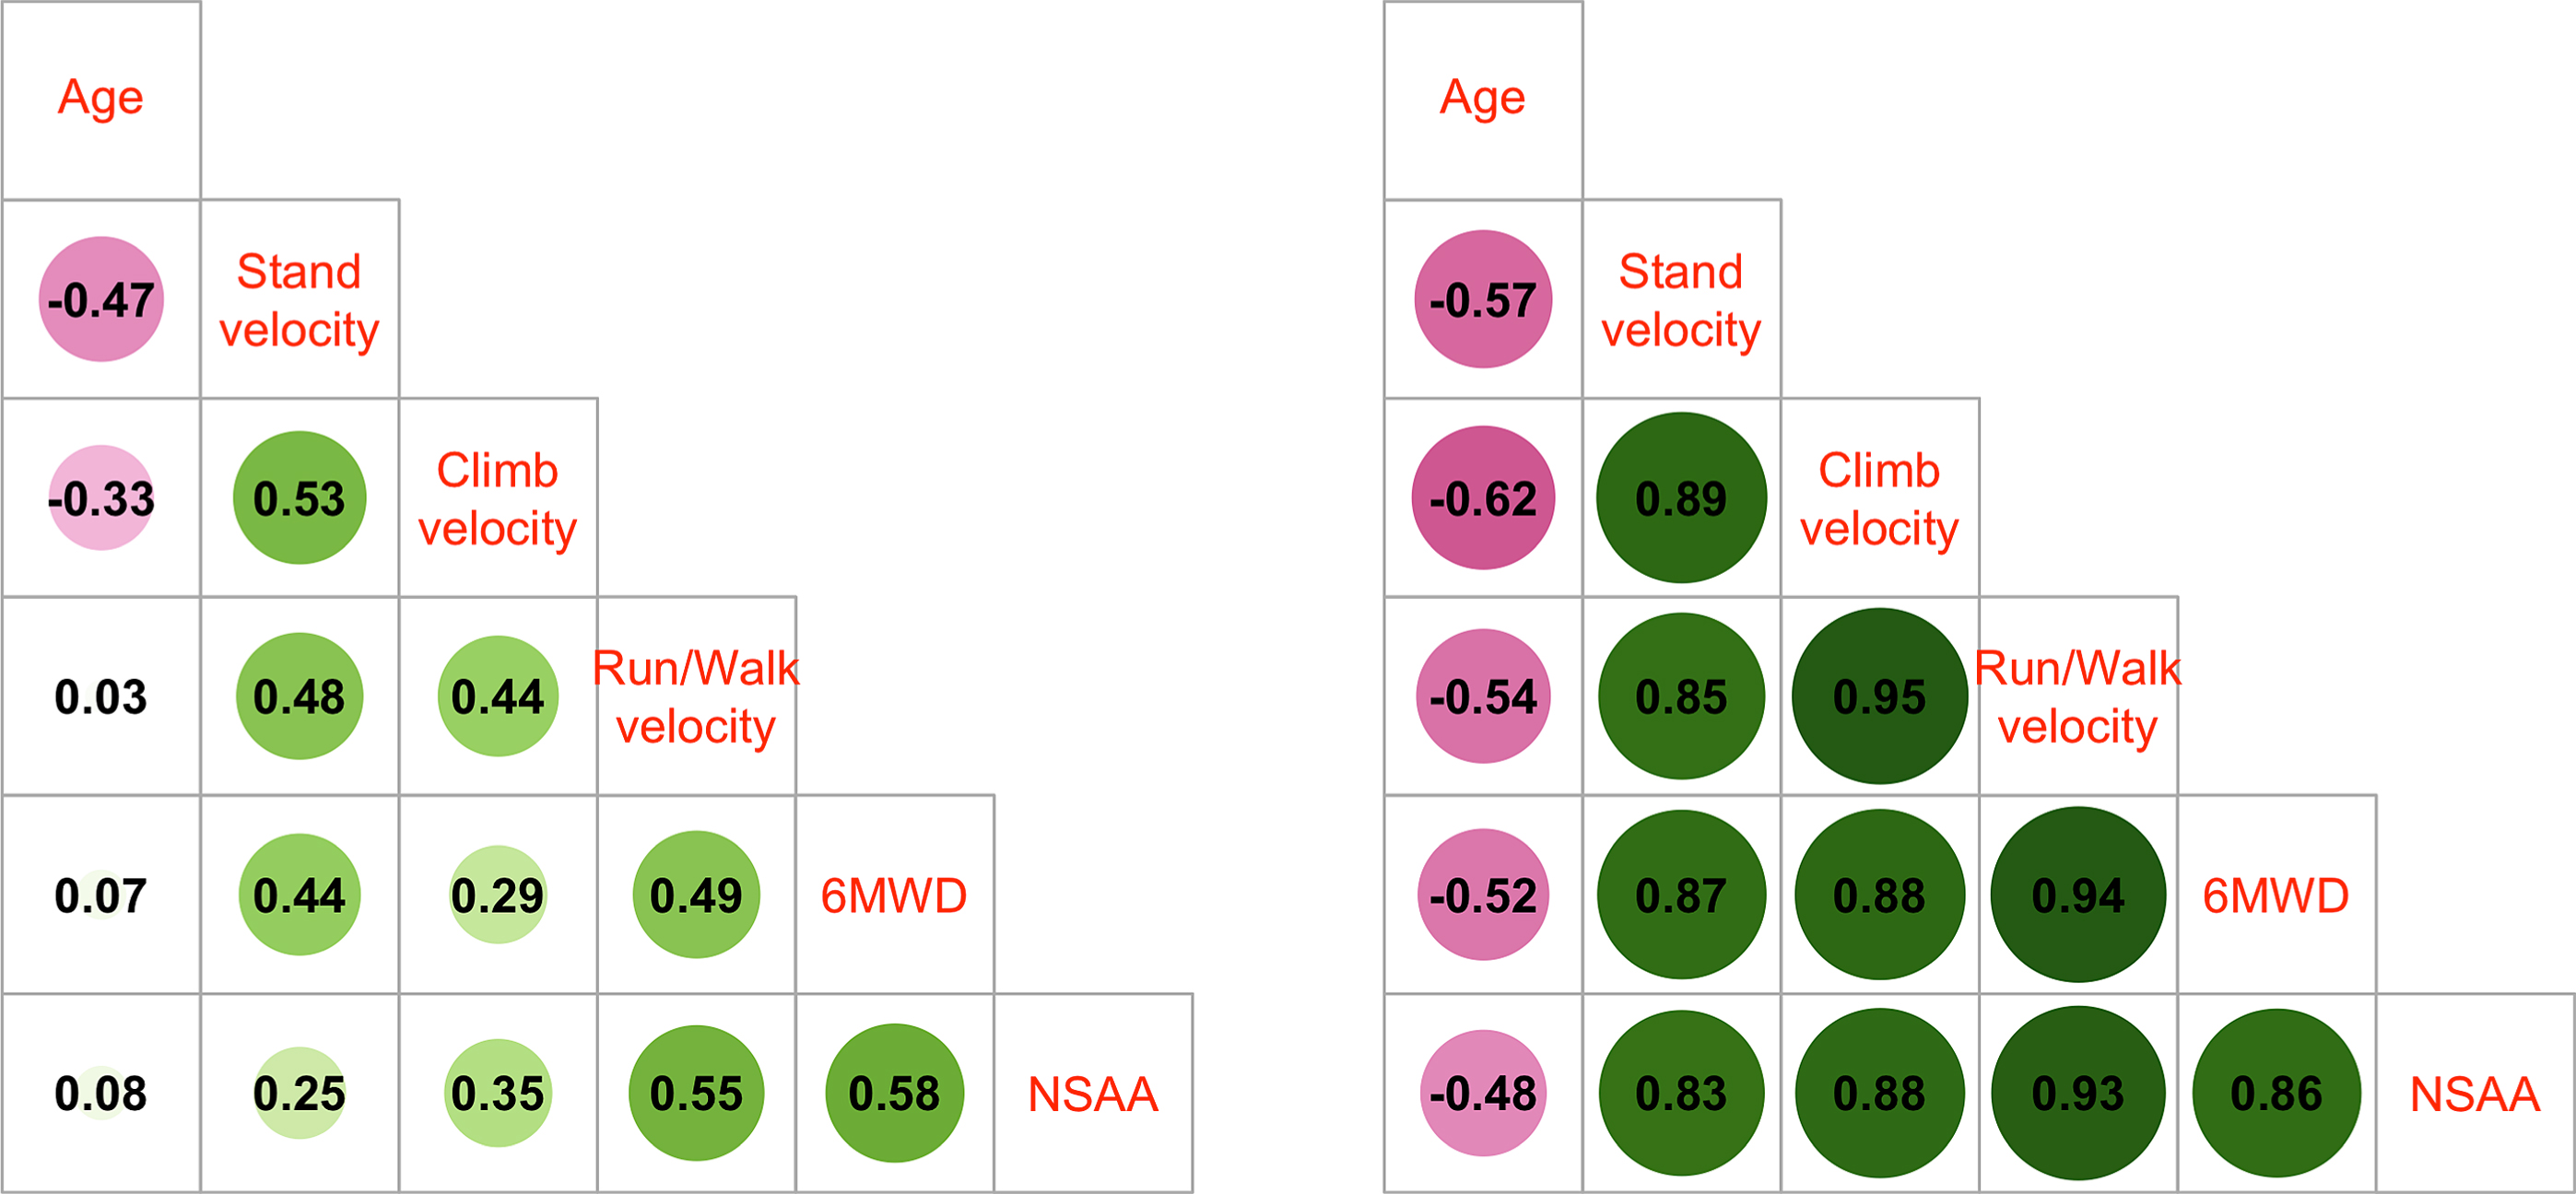
Correlation of outcomes at baseline
Correlation analysis of baseline values for age and timed function tests for each participant showed strong Spearman correlations between all pairs of tests but less so with age (Supplemental Figure 2). For those participants who were >18 years of age, NSAA had the weakest Spearman correlation with age out of all the outcomes, while the 3 timed function tests had stronger pairwise correlation magnitudes, especially in adults (Fig. 2). The stronger correlation magnitudes in adults compared to youth suggests more heterogeneity in outcome capabilities in those less than 18 years. Motor outcomes were more strongly associated with other clinical outcomes than age, suggesting that level of function may be a more suitable trial eligibility criterion than age.
Fig. 2
Spearman correlations of baseline outcome values for participants <18 years (left panel) and ≥18 years of age (right panel).
NSAA shift-based analysis
For items in the NSAA, we performed a longitudinal shift-based analysis. Percentage of NSAA items gained and lost were more similar in minors (although more items lost) over 1 year whereas there were more items lost than gained in adults over 12 months, 24 months, and 36 months.
Consistent with our overall observation that muscle function performance is largely stable up to age 18, the percentages of NSAA items that were stable over a duration of 12, 24 and 36 months in this age group were 89.6% (n = 60 periods/blocks), 87.5% (n = 24 periods) and 86.8% (n = 12 periods), respectively. For participants over age 18 years, the percentages of NSAA items that were stable over 12, 24 and 36 months were 78.8% (n = 63 periods), 74.2% (n = 26 periods) and 73.8% (n = 13 periods), respectively.
Time to event analysis
There were enough events for a first time to stand of 10 seconds measurement to characterize this distribution. The median age at which it took 10 seconds or longer to stand was estimated as 51 years (95% CI: 42.5 years, ∞).
Change over time
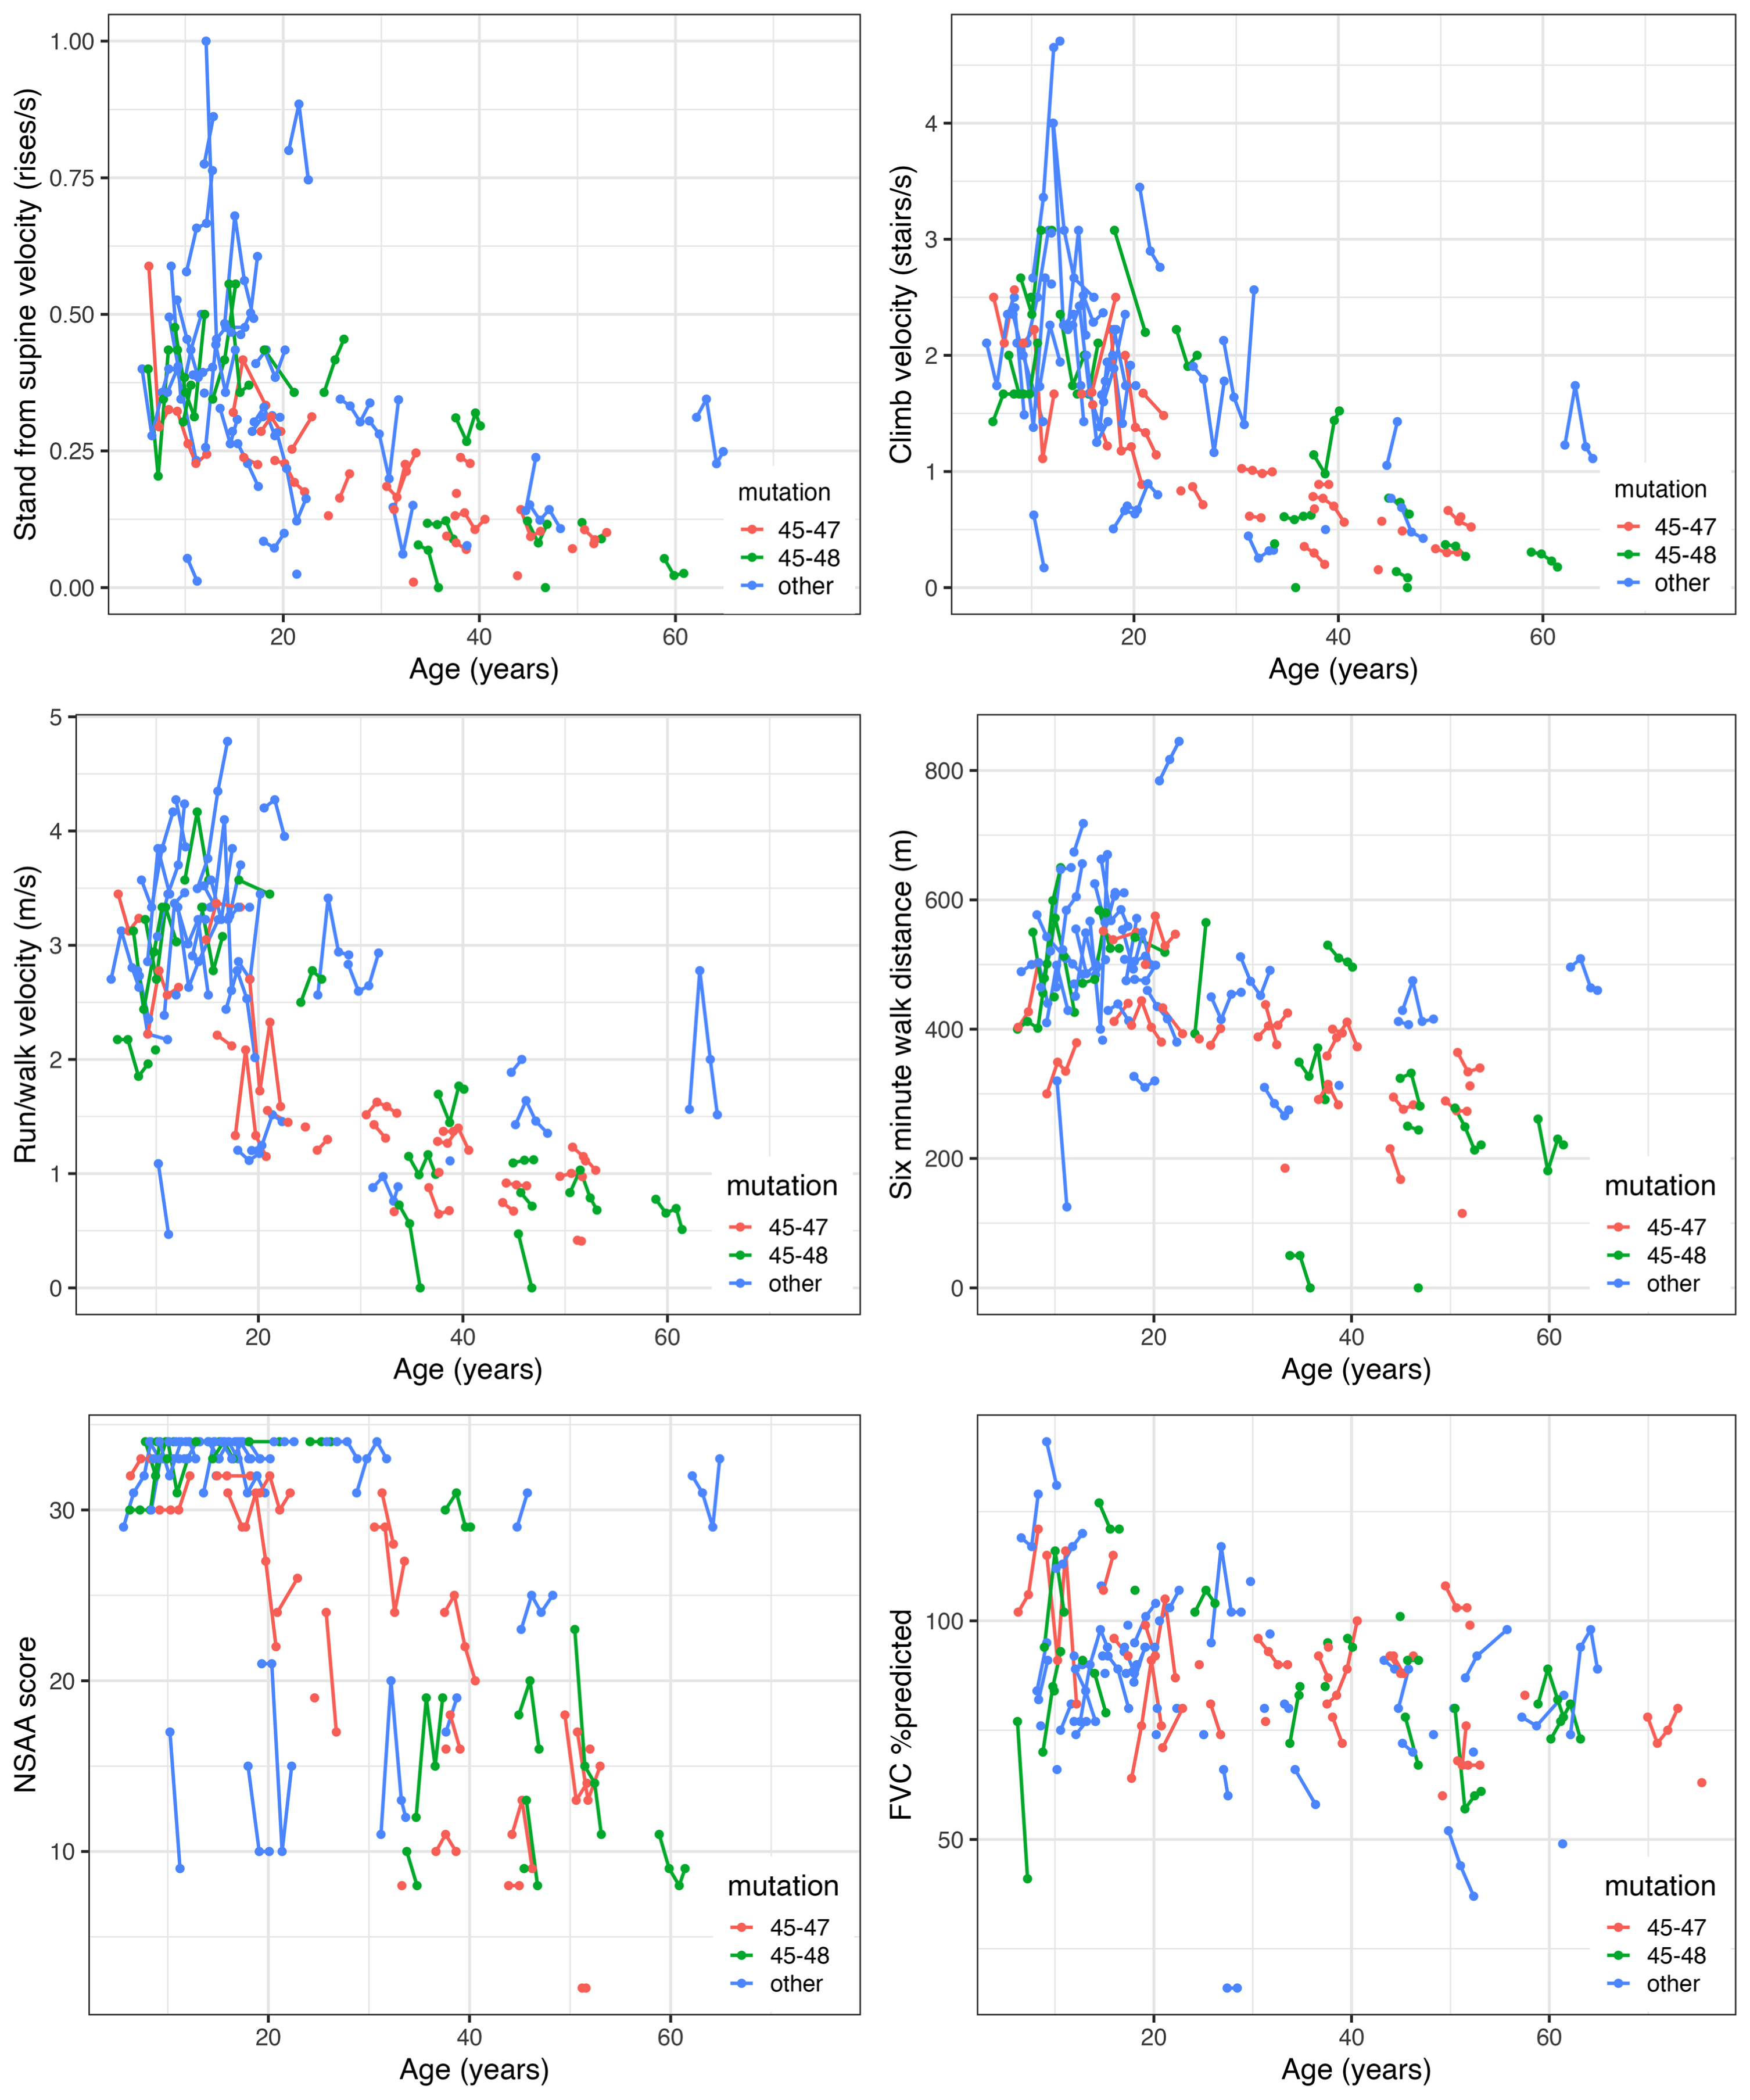
We saw relatively little change in functional test performance at the participant level over 3 years although measurements from visit to visit might be more divergent (Fig. 3; Supplemental Figure 3). In those <18 years of age at enrollment, both positive (improvement) and negative (decline) change from baseline was evident, whereas in those 18 years and older, the change tended to be more negative, as expected. Due to the ceiling effect in NSAA, there was more negative change seen over follow-up in many of those less than 18 years of age as well. Comparing those <18 with those 18 years and older, larger intra-participant change tended to be observed in those younger than 18 years old, who may improve or decline from visit to visit.
Fig. 3
Overall trajectory plots of outcomes for participants in the Becker Natural History Study.
Longitudinal modeling
For longitudinal modeling of timed function tests, we used linear mixed effect models and separated the analysis by age group, <18 years or 18 years and older (Supplemental Figure 4). While little overall change was seen from 5 to 18 years of age, an increase and a decline over the age range was also fit via a quadratic term. This association was found to be significant for 6MWD (p = 0.027), NSAA score (p < 0.001), and CLIMBVEL (p = 0.033) but not for STANDVEL or RWVEL.
Decline of muscle function with increasing age was clearly demonstrated in the 18 years or older age group. Modeling with either raw data or log-transformed data yielded similar findings in terms of significant associations with age in adults across all outcomes. Modeling with log-transformed data for an overall curvilinear fit seemed to fit slightly better for most outcomes (Table 2). For some outcomes (RWVEL, NSAA), a statistically significant difference was found between the exon 45–47 deletion group and the “other” deletion group favoring the “other” deletion group (but not between the exon 45–47 deletion group and exon 45–48 deletion groups) (Table 2) possibly indicating relative homogeneity and severity of the exon 45–47 mutation group compared to the “other” group. Similarly, for RWVEL, a statistically significant difference was found between the exon 45–48 deletion group and the “other” deletion group as well (favoring the “other” deletion group). However, note that the “other” group included younger participants on average (Supplemental Table 1). Age was found to be significantly associated with outcome performance in adulthood across the outcomes but not in those <18 years. For example, for RWVEL in adults, test performance declines to 97.5% [SE = 0.7% ] of previous year, on average (Table 2). Alternatively, using a linear model, test performance declined by 0.04 units [SE = 0.01], on average for RWVEL in adults. Given the large age range, limited sample size, and unclear population level longitudinal trajectory, we report findings from both linear and curvilinear fits.
Table 2
Findings from mixed-effect modeling of motor outcomes in adults (>18 years old). Model A provides estimates from a model with log-transformed response, whereas model B provides estimates from a linear model
| Estimate (SE; 95% CI) | Run/walk velocity (m/s) | Stand velocity (rises/s) | Climb velocity (stairs/s) | Six-minute walk distance (m) | NSAA score |
| Overall association with age (model A) | 0.975 (0.007; 0.961–0.988) | 0.971 (0.011; 0.949 –0.992) | 0.957 (0.009; 0.940–0.975) | 0.985 (0.007; 0.971 –1.000) | 0.976 (0.006; 0.963–0.989) |
| Overall association with age (model B) | –0.04 (0.01; –0.06 ––0.02) | –0.006 (0.002; –0.01 ––0.002) | –0.04 (0.01; –0.05 — –0.02) | –5.6 (1.52; –8.61 ––2.59) | –0.39 (0.10; –0.59 ––0.19) |
Percent predicted forced vital capacity was modeled linearly through the age range, i.e., without stratifying at 18 years of age, and a significant decline of 0.34% [SE = 0.10%; 95% CI = (–0.54, –0.13), p = 0.001] was obtained, with no significant difference between the mutations seen in a model with mutations modeled as well.
DISCUSSION
The analysis of this longitudinal dataset of natural history of patients with BMD highlights the high phenotypic variability of this patient population at different ages. This 3-year longitudinal study adds to the prior one-year longitudinal study [11]. Bello et al. found relatively stable function in 1 year of follow up, similar to our finding over 3 years. The study reported here reinforces the slow progression that is observed in patients with BMD when viewed individually. However, we obtained greater insight into the natural progression of the disease via longitudinal modeling demonstrating that decreasing function with age was only seen in adulthood.
A principal finding of this analysis is that elements of functional decline reflecting disease progression are more highly correlated with each other and, therefore, overall disease progression, than with age. We also provide evidence that decline/improvement in function would be hard to measure in patients less than 18 years of age. For patients aged 18 years or older, the exon 45–47 deletion group was found to have a relatively homogeneous functional decline. Based on the findings in the analysis reported here, study (controlled or observational) design may be most productive if eligibility and outcomes are focused on functional measures within a 15–20 year age bracket. For example, NSAA score demonstrated steep decline in the interval of 35–50 years of age. An example study to test an intervention could establish a predetermined minimum score and a maximum score of 32 for NSAA (also in view of the ceiling effect for this outcome) for eligibility limited to a 15–20 year age range and measure change in NSAA score before, during, and after a period of treatment. Despite having a relatively large overall sample size of patients in the exon 45–47 and exon 45–48 deletion groups for a BMD study, the broad age range for these groups limited clear findings of genotype-phenotype associations.
The high variability of disease progression and lack of clear genotype-phenotype relationships for functional measures in BMD suggest that incorporation of an external comparator group for an interventional study in BMD would be challenging. Hence, placebo control will be an important consideration in study designs. Of note, a prior study was able to make a genotype-phenotype correlation to age of onset of dilated cardiomyopathy [21].
Loss of ambulation is a relatively homogeneous milestone for patients with DMD and is accepted as a good measure reflecting quality of life [22, 23]. Loss of ambulation occurs over a far more variable timeframe in patients with BMD, and there is insufficient data on age-specific incidence. Indeed, only 2 participants in this natural history study became non-ambulatory during follow-up. Loss of ambulation is unlikely to be useful as a milestone in observational or interventional studies in BMD. On the other hand, there were enough events that we were able to estimate the median age (51 years) at which a participant may first take 10 seconds to complete the time to stand test.
The data analysis in this report adds to the limited prior experience with prospectively collected, longitudinal data on functional outcomes for patients with BMD [1–4, 11]. Of these studies, Bello et al. [11] had sufficiently large groups with either a DMD deletion ending in exon 51 or in exon 45. From their analysis, they concluded that deletions ending in exon 51 corresponded to a milder phenotype than deletions ending in exon 45. While the dataset reported here had many patients with DMD deletions ending in exon 45, there were relatively few with deletions ending in exon 51; hence, a relationship between the 2 mutation groups could not be assessed. It is likely that the very mild, seemingly asymptomatic group of patients with BMD and a DMD deletion ending in exon 51 are most often detected when there is inclusion of the serum creatine kinase in the routinely collected lab panel for electrolytes and hepatic and renal function.
Limitations of this study were inherent in BMD disease which has wide phenotypic variability and is a rare disease which limits recruitment and attainment of large groups of patients reflecting specific mutations, age groups or other measures [24]. Furthermore, the nature of a natural history study tends to lead to a higher level of missing data compared to a shorter, more controlled interventional study. We also stratified based on 18 years of age based on some exploratory visual/descriptive analysis. We do not suggest this as a hard cut-off for change in function, but it was useful to understand stability through adolescence vs. decline in functional outcomes in adulthood. Future analysis on an external cohort with a larger sample size is needed to validate our findings and should investigate interaction between genotype and age.
Our data demonstrated variable progression of different outcomes based on age groups, and mutation groups, and found that disease progression seems to largely manifest in adulthood for BMD. We also provide estimates from longitudinal models for commonly used clinical outcomes. Our study has clinical trial design implications for enrollment criteria, importance of placebo control, efficacy determination, and sample size calculations.
ACKNOWLEDGMENTS
We would like to thank all patients with Becker muscular dystrophy and their families for participating in this research study, as well as the study coordinators, clinical evaluators, CINRG, and TRiNDS. Additional researchers at the CINRG network sites that contributed to this project: University of Pittsburgh: Hoda Abdel-Hamid, Kathryn Brown, Karen Karnevas; Children’s National Medical Center: Sally Evans, Rachel Walega, Lauren Carruthers, Katherine Kundrat, Bemnete Tadesse, Alynn Toles; Washington University: Alyssa Sonsoucie, Betsy Malkus, Catherine Siener, Rebecca Oschwald; Centro Clinico Nemo Hospital: Marco Gualandris, Cristina Grandi, Luca Mauro, Alessandra Di Bari, Elisa Pavesi; Newcastle University: Meredith James, Anna Mayhew, Robert Muni, Dionne Reynolds; Hershey Medical Center: Aiesha Ahmed, Anne Haulman, Victoria Kern, Heidi Runk, Matthew Bankert; University of Tennessee: Ana Phillips, Robert Henegar; Alberta Children’s Hospital: Angela Chiu, Karla Sanchez; Duke University Medical Center: Laura Case, Julie Coats, Karen Cornett, Andrea Hartzell; Lurie Children’s Hospital: Colleen Blomgren, Carolyn Hyson, Theresa Oswald, Duncan Schulte, Lauren Webb; University of California, Davis: Candace Aguilar, Erica Goude, Alina Nicorici; Children’s Healthcare of Atlanta: Han Phan, Kimberly Carvell, Saadia Khizer; University of Florida: Manuela Corti, Samantha Norman; University of Minnesota: Molly Stark, Natalya Alassy,; Carolinas Medical Center: Mohammed Sanjak, Anja Little, Brittany J. Neelands; University of Texas Southwestern Medical Center: Holly Lawrence, Lisa LaMotte, Leslie Nelson.
Funding for this study was provided by the National Institutes of Health/National Institute of Arthritis and Musculoskeletal and Skin Diseases (P50 AR060836-01). Travel funding for participants in this study was provided by the Muscular Dystrophy Association.
The authors take full responsibility for the contents of this manuscript, which do not represent the views of the Department of Veterans Affairs or the U.S. Government.
CONFLICT OF INTEREST
Dr. Clemens served as a consultant for Epirum, Catalyst Medical Education and Med Learning Group. She has received research grants from ReveraGen, NS Pharma, Amicus, Sanofi and Spark.
Dr. Gordish-Dressman is a part owner of TRiNDS, LLC, a paid consultant for AGADA Biosciences and SOLID GT, and has consulted for ReveraGen and Audentes.
Ms. Niizawa has no disclosures.
Dr. Gorni is Global Senior Medical Director at HOFFMAN-LA ROCHE INC.
Dr. Guglieri was Chief Investigator/Principal Investigator for clinical trials of Edgewise, Pfizer, Italfarmaco, Santhera, Roche, ReveraGen, Dynacure, Dyne. She received research funding from Sarepta and PTC. She is a member of Advisory boards for Pfizer, NS Pharma and Dyne. She has received speaker honoraria from Sarepta, Roche and Italfarmaco.
Dr. Connolly has research funding from Biohaven, Edgewise, FibroGen, MDA, Sarepta Therapeutics, Inc. and Scholar Rock. She has done consulting for Biohaven, Edgewise, Sarepta Therapeutics, Inc. and Scholar Rock.
Dr. Wicklund has research funding from Edgewise Therapeutics and Sarepta Therapeutics. He has done consulting for Edgewise Therapeutics. He is on the Advisory Board for Sarepta Therapeutics.
Dr. Bertorini has no disclosures.
Dr. Mah received research grants to her institution from CINRG, Sarepta; PTC Therapeutics; NS Pharma, Inc.; ReveraGen; Italfarmaco; Biogen; Roche; Pfizer; and the Alberta Children’s Hospital Foundation.
Dr. Thangarajh was a speaker for NS Pharma and PTC Therapeutics.
Dr. Smith has no disclosures.
Dr. Kuntz serves as PI on research grants to her institution for Argenx, Astellas, Biogen, Novartis, Roche, Sarepta and Scholar Rock; on Medical Advisory Boards for Argenx, BioMarin, Biogen, Roche, Sarepta; on DSMB for Sarepta; she is a speaker on gene therapy for Sarepta.
Dr. McDonald received personal consulting fees from Astellas/Mitobridge, Avidity Biosciences, Bristol-Myers Squibb, Capricor Therapeutics, Catabasis Pharmaceuticals, Edgewise Therapeutics, Eli Lilly and Company, Epirium Bio, FibroGen, Halo Therapeutics, Italfarmaco, BioMarin Pharmaceutical, Novartis, Pfizer, Prosensa, PTC Therapeutics, Santhera Pharmaceuticals, and Sarepta Therapeutics. He has served on Advisory Boards for Avidity Biosciences, Capricor Therapeutics, Edgewise Therapeutics, PTC Therapeutics, and Sarepta therapeutics.
Dr. Henricson has served as a consultant or advisory board member for, or received research funds from Sarepta, Santhera, Pfizer, Epirium, Capricor, Catabasis, Mallinkrodt, Bristol-Myers-Squibb and PTC Therapeutics.
Dr. Upadhyayula has no disclosures.
Dr. Byrne serves on the North America Pompe Registry Advisory Board, Edgewise Therapeutics Scientific Advisory Board and Global DMD Advisory Board for Pfizer.
Dr. Manousakis has no disclosures.
Dr. Harper is site PI for clinical research studies sponsored by Novartis, NSPharma, Italafarmaco, Reveregan/Santhera, Astellas, Dyne, Fulcrum and MLBio.
Dr Iannaccone serves on advisory boards or as a consultant for Audentes Therapeutics Inc, Biomarin Pharmaceutical Inc, Edgewise Therapeutics Inc, Entrada Therapeutics Inc, Genentech Inc, Octapharma Use Inc, Taysha Gene Therapies Inc, Vertex Pharmaceutics Inc. Dr Iannaccone has research funding from AveXis/Novartis, Biogen, Capricor, Genentech, RegenxBio, Sarepta and Scholar Rock.
Dr. Dang has served as consultant to ReveraGen, and received research grants from Foundation to Eradicate Duchenne and NIH.
DATASET AVAILABILITY STATEMENT
The data supporting the findings of this study are available on request from the corresponding author. The data are not publicly available due to privacy or ethical restrictions.
SUPPLEMENTARY MATERIAL
[1] The supplementary material is available in the electronic version of this article: https://dx.doi.org/10.3233/JND-230178.
REFERENCES
[1] | Bushby KM , Gardner-Medwin D The clinical, genetic and dystrophin characteristics of Becker muscular dystrophy. I. Natural history. J Neurol. (1993) ;240: (2):98–104. |
[2] | Bushby KM , Gardner-Medwin D , Nicholson LV , Johnson MA , Haggerty ID , Cleghorn NJ et al., The clinical, genetic and dystrophin characteristics of Becker muscular dystrophy. II. Correlation of phenotype with genetic and protein abnormalities. J Neurol. (1993) ;240: (2):105–12. |
[3] | McDonald CM , Abresch RT , Carter GT , Fowler WM Jr , Johnson ER , Kilmer DD Profiles of neuromuscular diseases. Becker’s muscular dystrophy. Am J Phys Med Rehabil. (1995) ;74: (5 Suppl):S93–103. |
[4] | van den Bergen JC , Wokke BH , Janson AA , van Duinen SG , Hulsker MA , Ginjaar HB et al., Dystrophin levels and clinical severity in Becker muscular dystrophy patients. J Neurol Neurosurg Psychiatry. (2014) ;85: (7):747–53. |
[5] | Clemens PR , Niizawa G , Feng J , Florence J , D’Alessandro AS , Morgenroth LP et al., The CINRG Becker Natural History Study: Baseline characteristics. Muscle Nerve. (2020) ;62: (3):369–76. |
[6] | Anthony K , Cirak S , Torelli S , Tasca G , Feng L , Arechavala-Gomeza V et al., Dystrophin quantification and clinical correlations in Becker muscular dystrophy: Implications for clinical trials. Brain. (2011) ;134: (Pt 12):3547–59. |
[7] | Barp A , Bello L , Caumo L , Campadello P , Semplicini C , Lazzarotto A et al., Muscle MRI and functional outcome measures in Becker muscular dystrophy. Sci Rep. (2017) ;7: (1):16060. |
[8] | Kesari A , Pirra LN , Bremadesam L , McIntyre O , Gordon E , Dubrovsky AL et al., Integrated DNA, cDNA, and protein studies in Becker muscular dystrophy show high exception to the reading frame rule. Hum Mutat. (2008) ;29: (5):728–37. |
[9] | Ripolone M , Velardo D , Mondello S , Zanotti S , Magri F , Minuti E et al., Muscle histological changes in a large cohort of patients affected with Becker muscular dystrophy. Acta Neuropathol Commun. (2022) ;10: (1):48. |
[10] | Yuan R , Yi J , Xie Z , Zheng Y , Han M , Hou Y et al., Genotype-phenotype correlation in Becker muscular dystrophy in Chinese patients. J Hum Genet. (2018) ;63: (10):1041–8. |
[11] | Bello L , Campadello P , Barp A , Fanin M , Semplicini C , Soraru G et al., Functional changes in Becker muscular dystrophy: Implications for clinical trials in dystrophinopathies. Sci Rep. (2016) ;6: , 32439. |
[12] | De Wel B , Willaert S , Nadaj-Pakleza A , Aube-Nathier AC , Testelmans D , Buyse B et al., Respiratory decline in adult patients with Becker muscular dystrophy: A longitudinal study. Neuromuscul Disord. (2021) ;31: (3):174–82. |
[13] | McDonald CM , Henricson EK , Abresch RT , Han JJ , Escolar DM , Florence JM et al., The cooperative international neuromuscular research group Duchenne natural history study–a longitudinal investigation in the era of glucocorticoid therapy: Design of protocol and the methods used. Muscle Nerve. (2013) ;48: (1):32–54. |
[14] | Fay MP , Shaw PA Exact and asymptotic weighted logrank tests for interval censored data: The interval R package. J Stat Softw. (2010) ;36: (2). |
[15] | Bates D , Mächler M , Bolker B , Walker S Fitting linear mixed-effects models using lme4. J Stat Softw. (2015) ;67: (1):1–48. |
[16] | Wickham H ggplot2: Elegant Graphics for Data Analysis: Springer International Publishing; 2016. |
[17] | Lüdecke D sjPlot: DataVisualization for Statistics in Social Science 2023. https://CRAN.R-project.org/package=sjPlot |
[18] | Breheny P , Burchett W Visualization of Regression Models Using visreg. The R Journal. (2017) ;9: (2):56. |
[19] | Gauld LM , Kappers J , Carlin JB , Robertson CF Height prediction from ulna length. Dev Med Child Neurol. (2004) ;46: (7):475–80. |
[20] | Hoffman EP , Fischbeck KH , Brown RH , Johnson M , Medori R , Loike JD et al., Characterization of dystrophin in muscle-biopsy specimens from patients with Duchenne’s or Becker’s muscular dystrophy. N Engl J Med. (1988) ;318: , 1363–8. |
[21] | Nicolas A , Raguenes-Nicol C , Ben Yaou R , Ameziane-Le Hir S , Cheron A , Vie V et al., Becker muscular dystrophy severity is linked to the structure of dystrophin. Hum Mol Genet. (2015) ;24: (5):1267–79. |
[22] | Bello L , Morgenroth LP , Gordish-Dressman H , Hoffman EP , McDonald CM , Cirak S et al., DMD genotypes and loss of ambulation in the CINRG Duchenne Natural History Study. Neurology. (2016) ;87: (4):401–9. |
[23] | McDonald CM , Henricson EK , Abresch RT , Duong T , Joyce NC , Hu F et al., Long-term effects of glucocorticoids on function, quality of life, and survival in patients with Duchenne muscular dystrophy: A prospective cohort study. Lancet. (2018) ;391: (10119):451–61. |
[24] | Mah JK , Korngut L , Dykeman J , Day L , Pringsheim T , Jette N A systematic review and meta-analysis on the epidemiology of Duchenne and Becker muscular dystrophy. Neuromuscul Disord. (2014) ;24: (6):482–91. |

