
Proteome Network Analysis Identifies Potential Biomarkers for Brain Aging
Abstract
Background:
Alzheimer’s disease and related dementias (ADRD) involve biological processes that begin years to decades before onset of clinical symptoms. The plasma proteome can offer insight into brain aging and risk of incident dementia among cognitively healthy adults.
Objective:
To identify biomarkers and biological pathways associated with neuroimaging measures and incident dementia in two large community-based cohorts by applying a correlation-based network analysis to the plasma proteome.
Methods:
Weighted co-expression network analysis of 1,305 plasma proteins identified four modules of co-expressed proteins, which were related to MRI brain volumes and risk of incident dementia over a median 20-year follow-up in Framingham Heart Study (FHS) Offspring cohort participants (n = 1,861). Analyses were replicated in the Cardiovascular Health Study (CHS) (n = 2,117, mean 6-year follow-up).
Results:
Two proteomic modules, one related to protein clearance and synaptic maintenance (M2) and a second to inflammation (M4), were associated with total brain volume in FHS (M2: p = 0.014; M4: p = 4.2×10⁻⁵). These modules were not significantly associated with hippocampal volume, white matter hyperintensities, or incident all-cause or AD dementia. Associations with TCBV did not replicate in CHS, an older cohort with a greater burden of comorbidities.
Conclusions:
Proteome networks implicate an early role for biological pathways involving inflammation and synaptic function in preclinical brain atrophy, with implications for clinical dementia.
INTRODUCTION
Biological pathways involved in Alzheimer’s disease and related dementias (ADRD), before the onset of clinical symptoms, are promising targets for disease-modifying intervention, as biological processes leading to ADRD development begin years to decades before symptoms appear [1]. Circulating plasma proteins are potential therapeutic targets for ADRD and can be measured less invasively compared to cerebrospinal fluid (CSF) proteins. Prior studies have identified associations between expression of several specific proteins in the blood and risk of Alzheimer’s disease (AD) dementia and mild cognitive impairment (MCI) [2–6], dementia endophenotypes, including structural brain MRI measures [5] and amyloid-PET burden [7], and cognitive decline [8].
Previous studies have identified and validated individual protein biomarkers of ADRD risk. We hypothesized that a network approach to the plasma proteome could identify protein modules, groups of proteins whose expression is positively or inversely inter-correlated, which would suggest pathways relevant to incident ADRD. Analysis at the module level has the potential to detect small but consistent variations in protein expression levels that may be missed when analyzing proteins individually. Such network approaches have successfully identified relevant pathways in blood pressure regulation, cancer, and chronic kidney disease [9–13]. Network analyses of the brain proteome have identified modules of proteins or “hub” proteins that are cross-sectionally associated with AD disease status [14–17], some of which are involved in astrocytic and microglial anti-inflammatory processes [18], as well as RNA splicing and protein binding [19]. A recent analysis using a network approach based on annotations found that dementia-associated plasma proteins were enriched in biological pathways implicated in dementia pathophysiology, including immune, lipid, metabolic signaling, and hemostasis pathways [20].
In this investigation, we used an annotation-independent network analysis applied to a large proteomic panel to identify modules of co-expressed plasma proteins in the middle-aged Framingham Heart Study (FHS) Offspring Cohort. We tested for associations between these modules and structural MRI endophenotypes for ADRD cross-sectionally, and incident ADRD over two decades of follow-up. We compared these results to the associations of individual proteins with ADRD and MRI outcomes. Finally, we sought replication in the Cardiovascular Health Study (CHS), an independent longitudinal cohort study comprised of older adults.
MATERIALS AND METHODS
Discovery cohort
The FHS Offspring Cohort has been described previously [21]. Participants who attended the FHS Offspring Cohort fifth examination cycle (1991–1995), had available aptamer-based proteomic assays, and had provided informed consent for use of these data were included (n = 1,861).
Protein assay
Proteomic data for this analysis was collected using the SomaScan aptamer-based proteomic platform in two phases using plasma stored in 1992–1995, as described previously [22, 23] (see the Supplementary Material). In Phase 1, 1,061 plasma proteins were measured in 798 participants. In Phase 2, an expanded panel of 1305 proteins were assayed in 1,063 additional participants.
MRI brain volumes
Brain MRIs were conducted at the seventh FHS Offspring Cohort clinic examination cycle between 1999 and 2002. Total cerebral brain volume (TCBV), hippocampal volume (HV), and white matter hyperintensity volume (WMH) were measured as described previously [24–26]. All brain volumes were expressed as percentages of intracranial volume to correct for head size. WMH volumes were natural logarithmically transformed to reduce skewness in their distribution.
All-cause dementia and Alzheimer’s disease
Surveillance and diagnosis protocols for all-cause dementia and clinical AD in the FHS Offspring Study from the fifth examination cycle (1992–1995) through 2018 have been described previously [27].
Network building and module identification
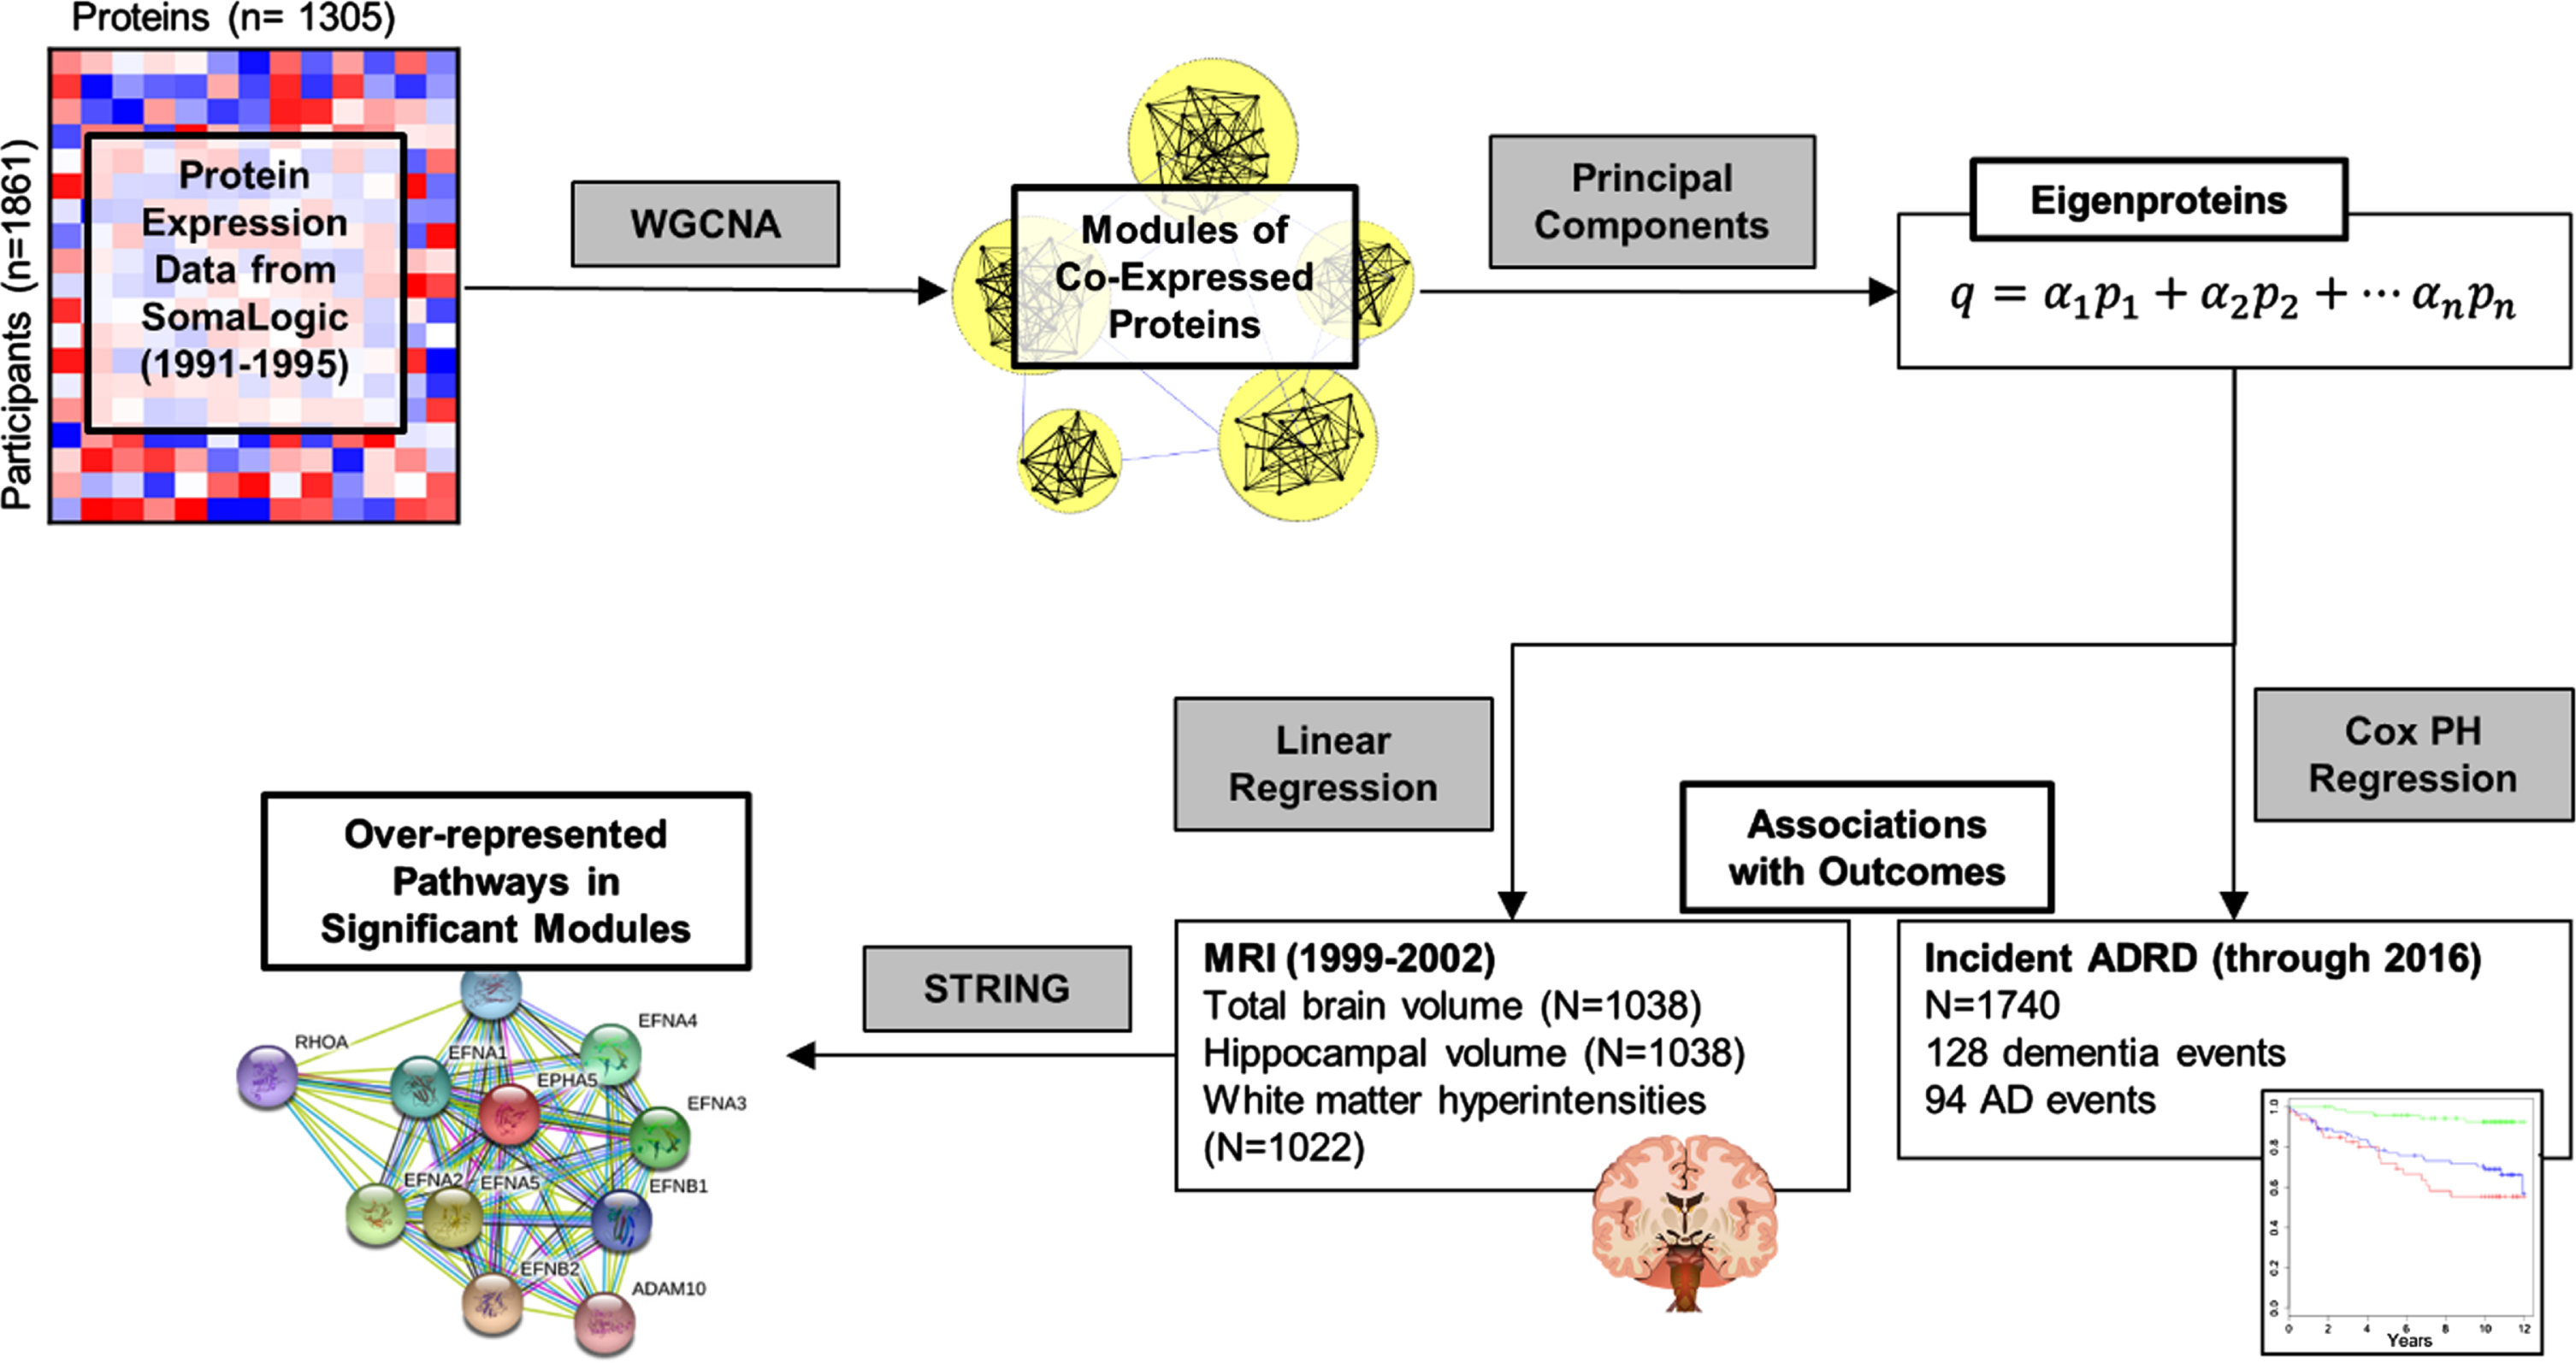
Statistical analyses for this study were performed in R (4.2.1) [28] and SAS (9.4). Analysis steps for this study are outlined in Fig. 1. We built a protein network by applying an unsigned weighted co-expression network analysis (WGCNA) as implemented in the Pigengene package [10] to the plasma protein concentrations. In addition to positive correlations, an unsigned approach also allows us to capture any negative correlations among proteins in the network, which could arise from negative regulatory mechanisms, for instance. This analysis identified four modules (i.e., clusters) of mutually correlated proteins. For each protein module, a summary measure called an “eigenprotein” was calculated. An eigenprotein has a single value for each participant, indicating a weighted average of plasma levels of the proteins in the corresponding module. Modules were given shorthand names based on top overrepresented Kyoto Encyclopedia of Genes and Genomes (KEGG) pathways. Details on this process are in the Supplementary Material. We measured associations between each module eigenprotein and demographic variables in FHS and CHS using Welch’s t-tests for binary variables and Spearman correlation for continuous variables, and plotted results in a heatmap.
Fig. 1
Outline of analysis of protein data in FHS discovery cohort. Correlation in protein expression values is used to perform a weighted correlation network analysis (WGCNA), which identifies modules of correlated proteins. Each module is summarized as an eigenprotein, which is a weighted sum of the concentrations of proteins in a module for each participant. Eigenproteins are used as features in linear regressions to assess associations with structural brain MRIs and in Cox proportional hazards (PH) regressions for associations with incident ADRD. Pathway analysis with STRING identifies pathways that are over-represented in modules of interest.
Primary analyses: Relation between eigenproteins and outcomes
Brain volumes
Eigenproteins were standardized to mean 0 and standard deviation (SD) 1 before regression analysis. We used linear regression to relate protein modules to brain volumes, adjusting for age at blood draw, age squared, sex, APOE ɛ4 allele carrier status, and time interval between blood draw and MRI scan. We additionally fit regression models with an expanded set of covariates available in a subset of 865 participants, which included the above covariates and body mass index, systolic blood pressure, total/HDL cholesterol ratio, current diabetes, current smoking, current antihypertensive medication use, estimated glomerular filtration rate (eGFR), and prevalent cardiovascular disease (a composite of stroke, transient ischemic attack, myocardial infarction, acute coronary syndrome, angina pectoris, intermittent claudication, or congestive heart failure). We used Bonferroni corrections, multiplying p-values by four (to a maximum of 1.0) to account for the four modules tested. This adjustment is used throughout our study for association tests involving modules for ease of comparing p-values across analyses.
Incident all-cause dementia
We fit two Cox proportional hazards regression models for each eigenprotein with time to dementia or time to clinical AD as dependent variables. We adjusted for 1) a minimal set of covariates including age at blood draw, sex, and APOE ɛ4 allele carrier status, and 2) an expanded set of covariates available in a subset of 1,464 participants, including the minimal set of covariates and body mass index, systolic blood pressure, total/HDL cholesterol ratio, current diabetes, current smoking, current antihypertensive medication use, eGFR, and prevalent cardiovascular disease. We confirmed that the proportional hazards assumptions were met by testing for correlations between Schoenfeld residuals and time using the cox.zph in the survival package in R.
Hub proteins within modules associated with outcomes
For significant associations between modules and outcomes, we aimed to identify hub proteins within modules that were interconnected within the module and explained the associations between the module and outcomes. In previous studies, Module Membership (MM), or a measure of intramodular connectivity of a protein, has been used to identify hub proteins, often in combination with some measure of association with the outcome of interest, such as “gene significance” [29, 30]. Rather than use gene significance (a measure from an individual protein) as a measure of biological importance, we used the collective association of a subset of the module with the outcome of interest.
To do this, we “pruned” the modules, removing one protein at a time in ascending order of their MM value (absolute “weight”), recalculating eigenprotein values and re-fitting regression models at each step. Regression models were adjusted for the original set of covariates from our primary analyses. The set of hub proteins chosen for each outcome was the set of top weighted proteins that collectively had the lowest p-value in association with the outcome. For ease of comparison with primary results, Bonferroni corrections for four protein modules are displayed in the figures.
Relation of individual proteins to outcomes
To complement the primary module-based analyses, we also identified associations between individual proteins and each outcome, utilizing the same models, dependent variables and standard covariates as described above for the eigenproteins. We adjusted p-values for the association between proteins and each outcome for 1,305 multiple comparisons using the Benjamini-Hochberg (i.e., false discovery rate (FDR)) method [31] within each outcome, with a significance cutoff of FDR < 0.10 (Supplementary Material).
Replication analysis in Cardiovascular Heart Study
The CHS is a population-based, longitudinal cohort enrolled between 1998-1999, as described previously and in the Supplementary Material [32]. SomaScan 5k platform was used to generate plasma proteomic data on 3171 participants from samples stored in 1992–1993. Of these participants, 2726 were part of the Cognition study and were followed for incident dementia until 1998-1999 and 782 of those underwent brain MRIs as described previously and in the Supplementary Material [33, 34]. We summarized demographic variables for FHS and CHS and tested for differences between cohorts using chi-square tests for categorical variables and t-tests for continuous variables, based on summary statistics from both cohorts.
Our analyses were conducted in four phases: 1) calculating the FHS eigenproteins in the CHS cohort; 2) replicating associations with brain MRI measurements; 3) replicating associations with incident ADRD; and 4) performing individual protein associations for proteins that were associated with outcomes in FHS. Participants who did not consent to use of their genetic data or who did not have APOE ɛ4 allele carrier status were excluded from replication steps (n = 196). For analysis of incident ADRD, we excluded those with prevalent all-cause dementia at the start of the Cognition Study or who developed dementia prior to plasma collection for proteomics (n = 88).
In pursuit of replicating the protein network analysis in CHS, we used the modules and corresponding protein weights generated from FHS data and calculated the corresponding eigenproteins in the CHS cohort as the weighted sum of the Blom inverse-rank normalized protein concentrations. We fit separate linear regression models to measure the association between the modules with significant associations in FHS (M2 and M4, see Results) with TCBV, and we fit separate Cox proportional hazards models to measure the associations between M2 and M4 with incident mild dementia and incident AD dementia. In all models, we adjusted for the same sets of covariates in the CHS analyses as in the FHS analyses. Details on the replication analyses are included in the Supplementary Material.
RESULTS
Our discovery cohort included 1,861 individuals for building the protein network, 1,038 individuals for the analysis of MRI outcomes, and 1,740 individuals for the analysis of all-cause dementia and clinical AD outcomes. Table 1 summarizes the characteristics for each analysis in FHS and CHS at the time of blood draw. On average, the CHS cohort was older, with a greater percentage of women, a lower education level, lower prevalence of smoking, higher SBP, lower DBP, and greater use of antihypertensive medications, greater HDL and lower total/HDL cholesterol ratio, higher fasting glucose and diabetes prevalence, lower eGFR, higher cardiovascular disease prevalence, smaller total cerebral brain volume/ICV and hippocampal volume/ICV, and greater burden of white matter hyperintensities. FHS had a longer follow-up period and a lower incidence of AD and all-cause dementia over the follow-up period compared with CHS.
Table 1
Description of FHS and CHS samples for analysis
| FHS | CHS | |||||
| Protein network analysis (n = 1,861) | MRI analysis (n = 1,038) | Incident all-cause dementia, AD (n = 1,740) | Protein network analysis (n = 2,117) | MRI analysis (n = 666) | Incident all-cause dementia, AD (n = 2,107) | |
| *Age, y | 55±10 | 54±10 | 55±10 | 74±5 | 74±4 | 74±5 |
| *Women (%) | 54 | 55 | 55 | 61 | 61 | 61 |
| *BMI (kg/m2) | 27.4±5.0 | 27.2±5.0 | 27.4±5.0 | 26.4±4.3 | 26.4±4.1 | 26.5±4.3 |
| *Education (%) | ||||||
| *No high school diploma | 3 | 3 | 3 | 22 | 18 | 22 |
| High school diploma | 28 | 28 | 28 | 29 | 28 | 29 |
| *Some college | 30 | 30 | 31 | 24 | 26 | 24 |
| *College degree | 38 | 38 | 38 | 25 | 29 | 25 |
| *Systolic blood pressure (mm Hg) | 126±19 | 124±18 | 126±19 | 135±21 | 131±20 | 135±21 |
| *Diastolic blood pressure (mm Hg) | 74±10 | 74±10 | 74±10 | 71±11 | 70±10 | 71±11 |
| *Antihypertensive treatment (%) | 19 | 16 | 16 | 38 | 35 | 38 |
| Total cholesterol | 205±37 | 204±36 | 205±36 | 203±39 | 203±37 | 203±39 |
| *HDL cholesterol | 50±15 | 51±15 | 50±15 | 54±14 | 54±15 | 54±14 |
| *Total/HDL cholesterol | 4.4±1.5 | 4.4±1.5 | 4.4±1.5 | 4.0±1.2 | 4.0±1.2 | 4.0±1.2 |
| Lipid-lowering medication (%) | 7 | 6 | 6 | 8 | 8 | 8 |
| APOE ɛ4 allele carrier (%) | — | 23 | 23 | — | 24 | 24 |
| *Fasting blood glucose | 95 (89, 103) | 95 (89, 102) | 95 (89, 103) | 98 (91, 107) | 97 (91, 105) | 98 (91, 107) |
| *Diabetes (%) | 7 | 6 | 7 | 14 | 10 | 14 |
| *eGFR (mL/min/1.73m2) | 89±20 | 90±18 | 89±20 | 64±14 | 64±13 | 64±14 |
| *Current Smoking (%) | 19 | 16 | 19 | 9 | 8 | 9 |
| *Prevalent CVD | 6 | 4 | 6 | 12 | 10 | 12 |
| *Incident all-cause dementia, N (%) | — | — | 128 (7.4) | — | — | 260 (12.3) |
| *Incident AD, N (%) | — | — | 94 (5.4) | 221 (10.5) | ||
| *Follow-up time, y | — | — | 19.7 (14.0, 22.7) | — | — | 6.2 (5.7, 6.6) |
| *Total cerebral brain volume (cm3) | — | 952±102 | — | — | 841±89 | — |
| *Total cerebral brain volume/ICV (%) | 77% ±3% | 59% ±3% | ||||
| *Hippocampal volume (cm3) | — | 6.6±0.7 | — | — | 6.8±0.9 | — |
| *Hippocampal volume/ICV (%) | 0.54% ±0.05% | 0.48% ±0.07% | ||||
| *White matter hyperintensities (cm3) | — | 0.56 (0.32, 1.09) | — | — | 4.1 (2.4, 7.8) | — |
| *White matter hyperintensities/ICV (%) | — | 0.04% (0.02%, 0.08%) | — | — | 0.29% (0.17%, 0.54%) | — |
Summary statistics for continuous variables are mean±standard deviation or median (Q1, Q3). For categorical variables, percentages are reported unless otherwise indicated. *p < 0.05 for a t-test for continuous variables or for a chi-sq test for categorical variables, based on summary statistics. For demographic variables, tests compare values from protein network analysis samples. BMI, body mass index; ICV, intracranial volume; eGFR, estimated glomerular filtration rate; CVD, cardiovascular disease.
Protein modules in FHS
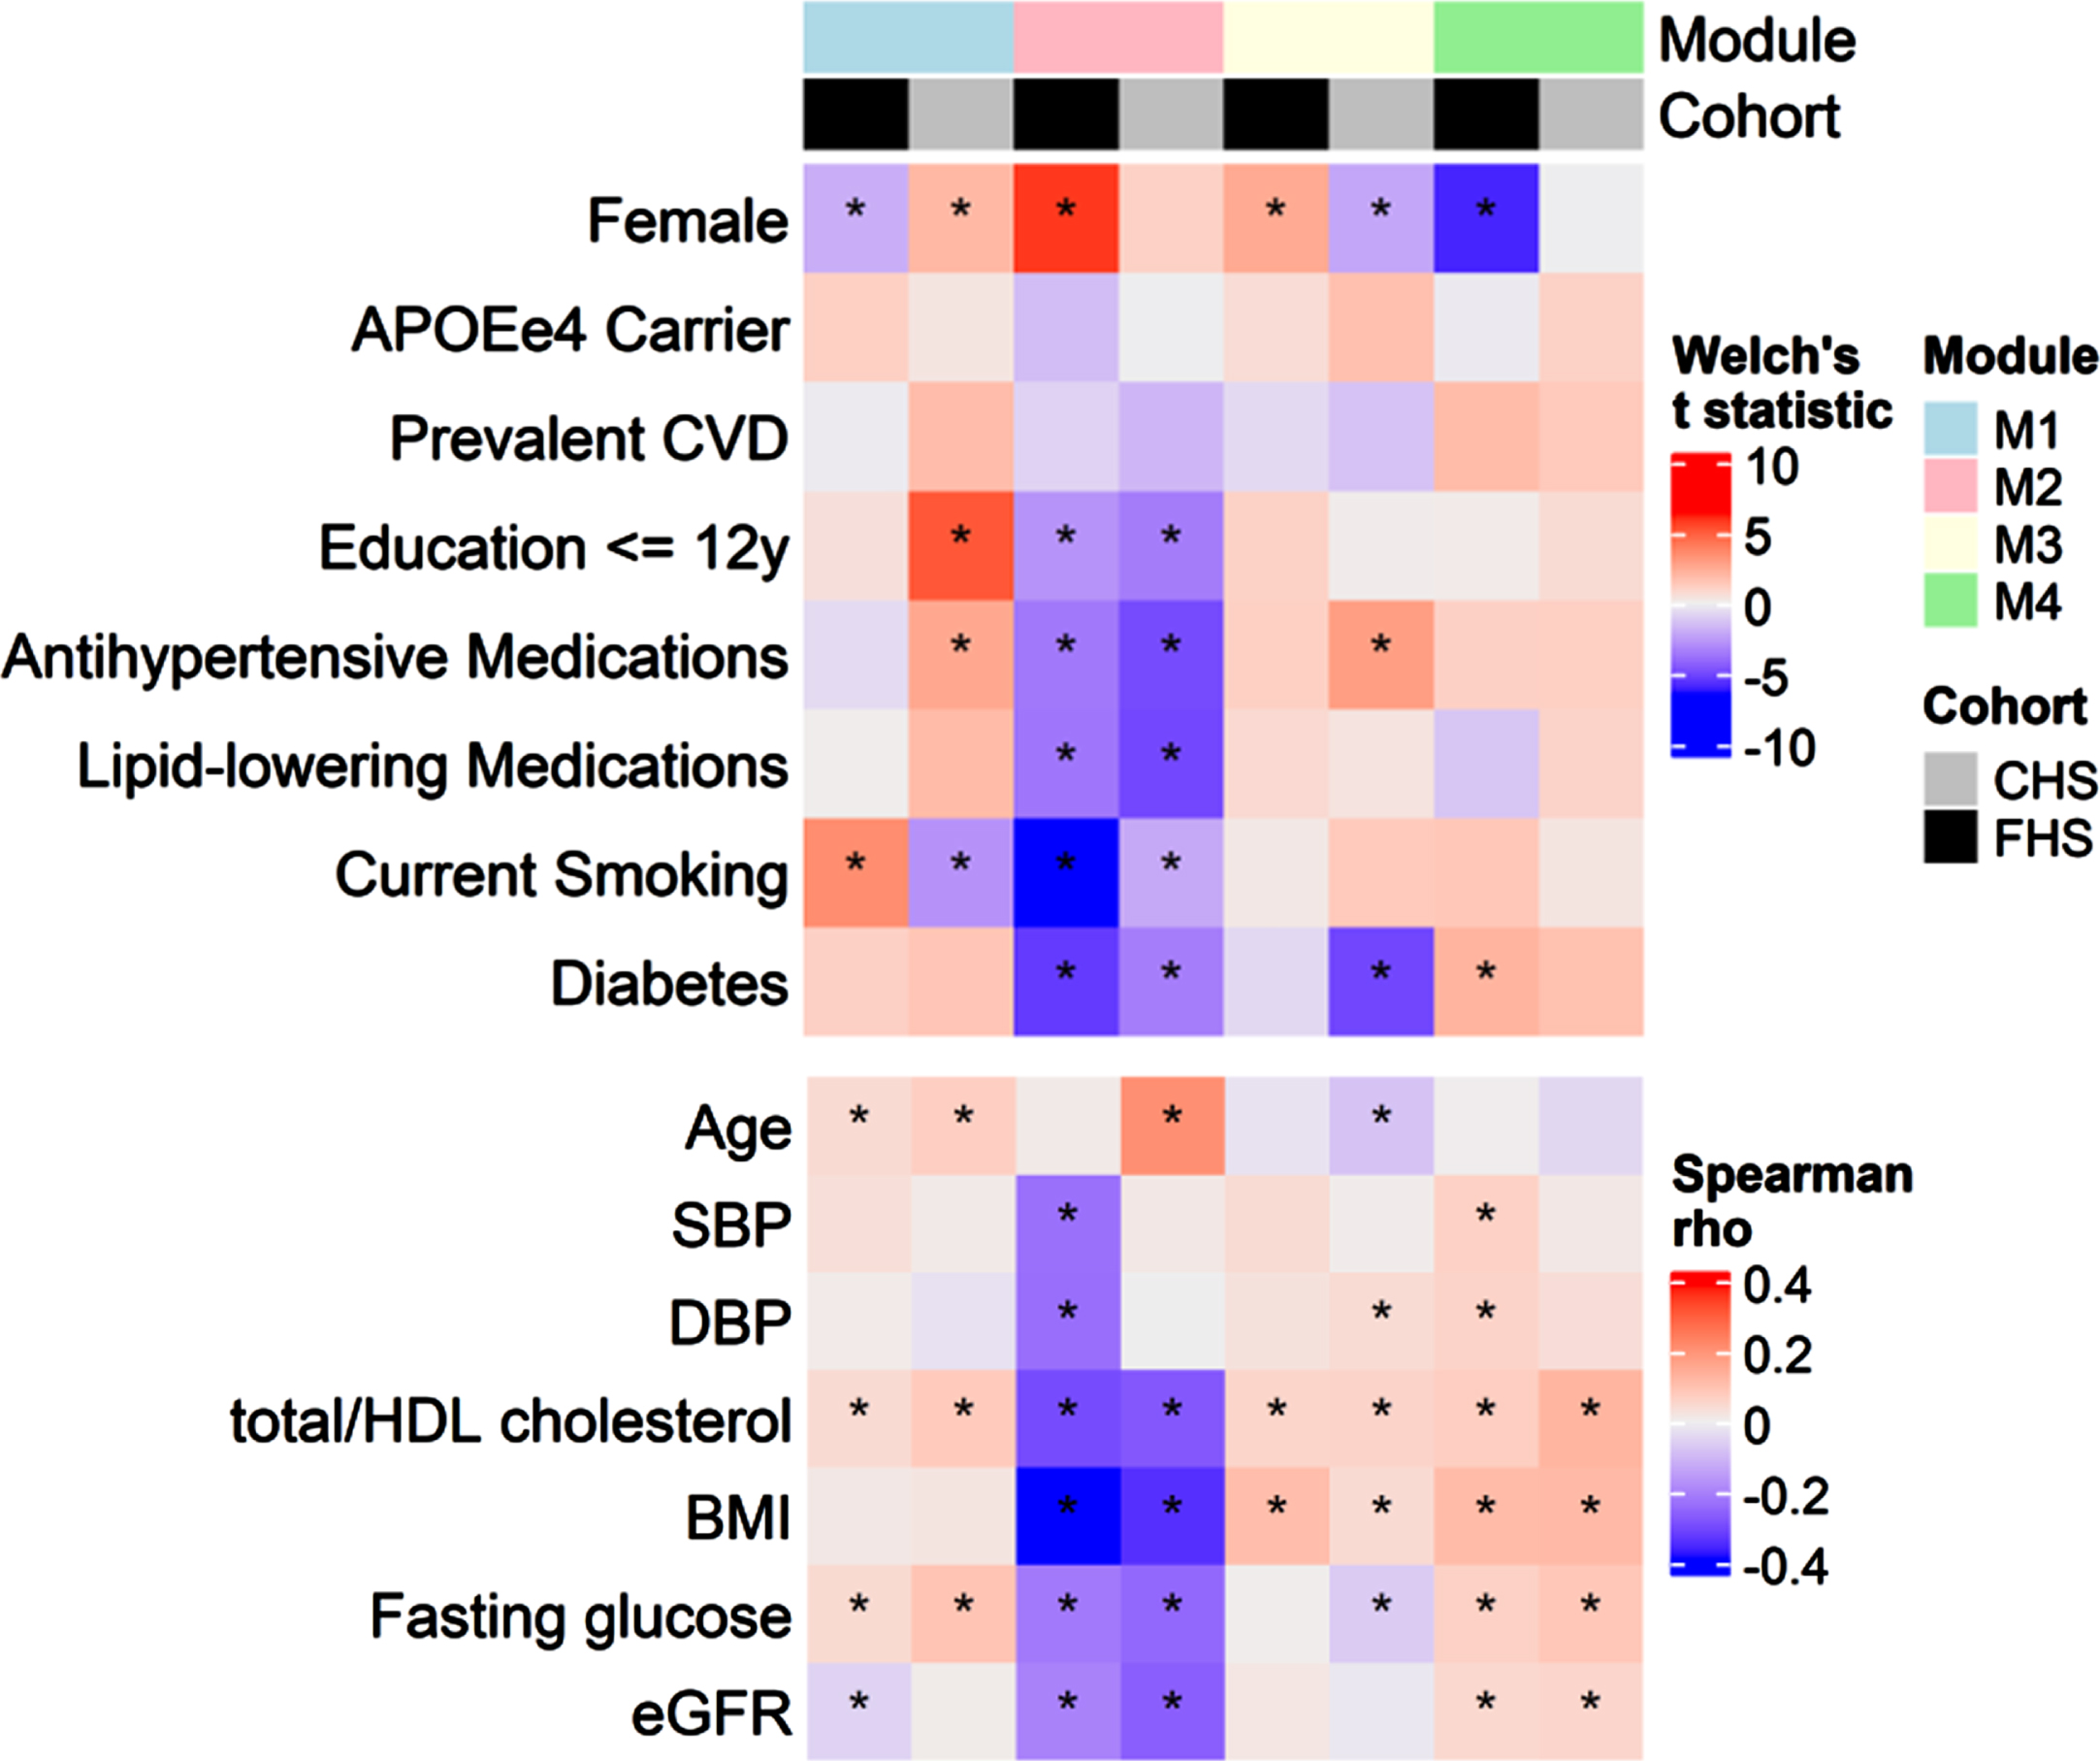
The WGCNA procedure identified four modules containing 272 (M1), 165 (M2), 76 (M3), and 42 proteins (M4). The remaining 750 proteins did not belong to any of the identified modules (Supplementary Table 1). Modules were associated with demographic features and cardiovascular risk factors at baseline (Fig. 2). Higher M1 was associated with greater age, total/HDL cholesterol ratio, and fasting glucose in both cohorts. Higher M2 was associated with lower cardiovascular risk factors in both cohorts, including lower BMI, less current smoking, less diabetes, lower total/HDL cholesterol ratio, and less use of lipid-lowering and antihypertensive medications. Higher M2 was additionally associated with higher educational attainment and lower eGFR. M3 was associated with higher total/HDL cholesterol ratio and BMI in both cohorts, and M4 was associated with greater total/HDL cholesterol, BMI, fasting glucose and eGFR in both cohorts. Associations between the modules and age and sex differed between the cohorts, with no module having consistent age- and sex- associations in both cohorts, except for a positive age association with M1.
Fig. 2
Associations between protein modules and demographic variables. Top panel summarizes Welch’s t statistics for two-sample t-tests for mean protein modules across levels of binary demographic variables. Bottom panel summarizes Spearman correlations between protein modules and continuous demographic variables. Asterisks denote associations for which p < 0.05.
Module associations with structural MRI and incident dementia
Of the four modules, two were significantly associated with TCBV in FHS. Module 2 (M2) had a positive association with TCBV. A one SD increase in the M2 eigenprotein was associated with an increase in TCBV of 0.18% (95% CI: 0.06%, 0.30%, adjusted p = 0.014). Module 4 (M4) showed a negative association with TCBV, with one SD increase in M4 eigenprotein associated with a decrease in TCBV of –0.27% (95% CI: –0.38%, –0.15%, adjusted p = 4.2×10⁻⁵) (Table 2). No modules were associated with HV or WMH. The association between M2 and TCBV was attenuated upon adjustment for additional cardiovascular risk factors and was no longer significant, whereas the association between M4 and TCBV was similar after further adjustment (Supplementary Table 2).
Of the 1,740 participants free from ADRD at the time of blood draw for proteomic assessment who were followed for a median of 19.7 years, 128 developed all-cause dementia, including 94 with probable AD. After correcting for multiple testing, no modules were significantly associated with risk of all-cause dementia or clinical AD (Table 2).
Overrepresented pathways in protein modules
Results from overrepresentation analysis of proteins in M1–M4 for Gene Ontology Process, Function, and Component annotations, as well as KEGG, Reactome, and Wikipathways annotations are presented in Supplementary Table 3A-D. M2 included 8 overrepresented KEGG pathways with FDR p < 0.05, the most significant of which were related to axon guidance (FDR = 1.89×10⁻¹¹) and complement and coagulation cascades (FDR: 2.12×10⁻¹⁰). M4 contained 14 overrepresented KEGG pathways, the most significant of which were cytokine-cytokine receptor interactions (FDR = 9.7×10⁻⁴) and osteoclast differentiation (FDR = 0.0014) (Supplementary Table 3B, D).
Table 2
Summary of significant module associations with outcomes
| Module 2: “Clearance/Synaptic Maintenance” | Module 4: “Inflammation” | |
| Number of proteins | 165 | 42 |
| Proteins and pathways | ||
| Top proteins in each module based on absolute weight | Netrin receptor UNC5DEphrin-A5 | Breast cancer anti-estrogen resistance protein 3Abelson tyrosine-protein kinase 2 |
| Ciliary neurotrophic factor receptor subunit alpha | Serine/threonine-protein kinase 17 | |
| NT-3 growth factor receptor | OCIA domain-containing protein 1 | |
| SLIT and NTRK-like protein 5 | Estradiol 17-beta-dehydrogenase 1 | |
| Top KEGG Pathways from | Axon guidance (18/177) | Cytokine–cytokine receptor interaction (7/282) |
| module (relevant genes/full | FDR p = 1.9×10⁻¹¹ | FDR p = 0.00097 |
| gene set) from STRING | Complement and coagulation cascades (13/82) | |
| database | FDR p = 2.1×10⁻¹⁰ | |
| FDR p < 0.001 | Cytokine–cytokine receptor interaction (17/282) | |
| FDR p = 7.3×10⁻⁸ | ||
| Cell adhesion molecules (11/137) | ||
| FDR p = 4.3×10⁻⁶ | ||
| MRI outcomes | ||
| Total Cerebral Brain Volume (% ICV) | ||
| Beta (95% CI) | 0.18 (0.06 to 0.30) | –0.27 (–0.38 to –0.15) |
| Bonferroni p | 0.014 | 4.2×10⁻⁵ |
| Number of hub proteins | 43 | 17 |
| Hippocampal Volume (% ICV) | ||
| Beta (95% CI) | –0.002 (–0.005 to 0.001) | 2.4×10⁻⁶ (–0.003 to 0.003) |
| Bonferroni p | 0.90 | 1.0 |
| Log (WMH [% ICV]) | ||
| Beta (95% CI) | 0.02 (–0.04 to 0.07) | 0.04 (–0.02 to 0.10) |
| Bonferroni p | 1.0 | 0.66 |
| Incident dementia outcomes | ||
| Incident all-cause dementia | ||
| HR (95% CI) | 0.82 (0.68 to 0.99) | 1.22 (1.04 to 1.44) |
| Bonferroni p | 0.16 | 0.06 |
| Incident AD | ||
| HR (95% CI) | 0.85 (0.68 to 1.06) | 1.26 (1.04 to 1.52) |
| Bonferroni p | 0.58 | 0.07 |
KEGG, Kyoto Encyclopedia of Genes and Genomes; ICV, intracranial volume; AD, Alzheimer’s disease; WMH, white matter hyperintensities. Names for modules come from top overrepresented KEGG pathways, methods detailed in the Supplementary Material.
Table 3
Singular proteins significantly associated with MRI volumes and ADRD in FHS
| Analyte Name | Module | Estimate | Standard error | t-value (TCBV, HV) or z-value (AD) | Raw p | False discovery rate |
| Total cerebral brain volume | ||||||
| Insulin-like growth factor-binding protein 4 | – | –0.329 | 0.060 | –5.510 | 4.54×10–08 | 5.92×10–05 |
| Tissue-type plasminogen activator | 2 | –0.298 | 0.062 | –4.772 | 2.08×10–06 | 0.003 |
| Antileukoproteinase | – | –0.283 | 0.060 | –4.707 | 2.86×10–06 | 0.004 |
| Afamin | – | –0.277 | 0.060 | –4.628 | 4.17×10–06 | 0.005 |
| Gelsolin | 2 | 0.274 | 0.060 | 4.555 | 5.88×10–06 | 0.008 |
| Polymeric immunoglobulin receptor | – | –0.266 | 0.060 | –4.412 | 1.13×10–05 | 0.015 |
| Alpha-(1 3)-fucosyltransferase 5 | – | –0.259 | 0.061 | –4.232 | 2.52×10–05 | 0.033 |
| OCIA domain-containing protein 1 | 4 | –0.247 | 0.060 | –4.132 | 3.89×10–05 | 0.051 |
| Macrophage scavenger receptor types I and II | 4 | –0.242 | 0.060 | –4.056 | 5.36×10–05 | 0.070 |
| RGM domain family member B | 2 | 0.242 | 0.060 | 4.049 | 5.53×10–05 | 0.072 |
| Coagulation factor IXab | 2 | –0.243 | 0.060 | –4.030 | 5.99×10–05 | 0.078 |
| Hippocampal volume | ||||||
| ADP-ribosyl cyclase/cyclic ADP-ribose hydrolase 1 | – | –0.0076 | 0.0018 | –4.21 | 2.99×10–05 | 0.039 |
| Incident clinical AD | ||||||
| Cathepsin D | – | 0.577 | 0.139 | 4.16 | 3.14×10–05 | 0.041 |
| A disintegrin and metalloproteinase with thrombospondin motifs 15 | – | 0.458 | 0.113 | 4.05 | 5.14×10–05 | 0.067 |
Pruned subsets and individual proteins in each module
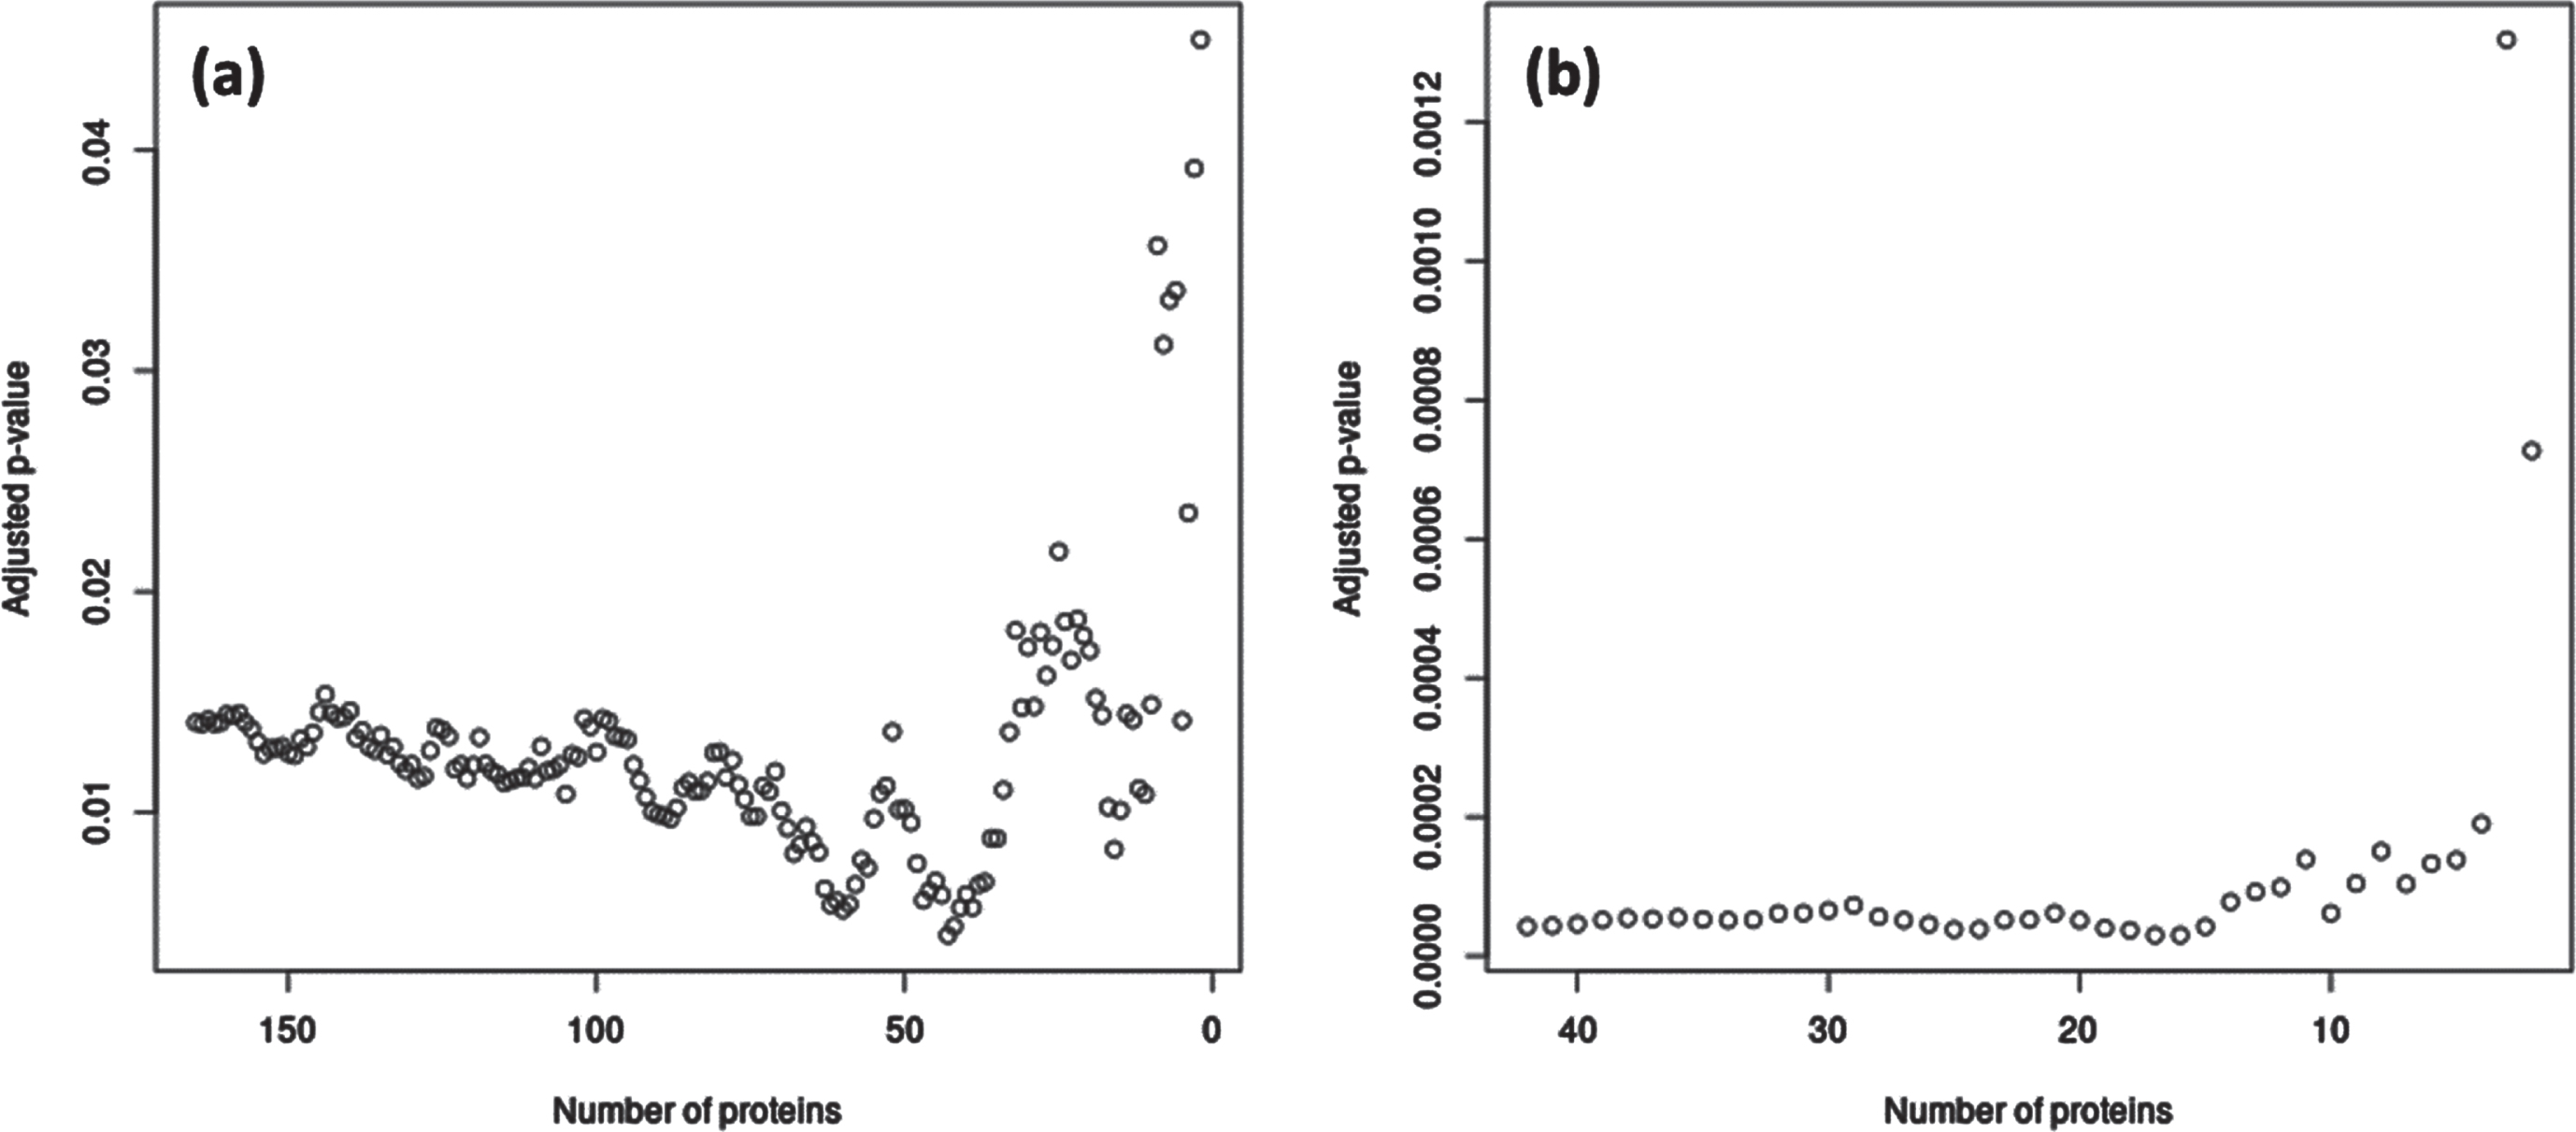
For the significant module-outcome associations, we identified hub proteins in the modules that maximized interconnectedness within the modules as well as significance of the association with the outcome. In M2, the 43 top weighted proteins had the most significant association with TCBV; in M4, the 17 proteins with the greatest MM had the most significant association with TCBV (Fig. 3). Hub proteins from M2 and M4 are listed in Supplementary Table 1.
Fig. 3
Subsets of hub proteins in M2 and M4 associated with TCBV in FHS. (a) p-values for association of M2 with TCBV, as M2 is gradually decreased from 165 to 2 proteins, with proteins removed in order of absolute weight (i.e., Module Membership) in the eigenprotein from least to greatest. The most significant association with TCBV corresponded to the top 43 M2 proteins. (b) p-values for association of M4 with TCBV, as M4 is gradually decreased from 42 to 2 proteins in a similar manner as in (a). The most significant association with all-cause TCBV corresponded to the top 17 M4 proteins. All p-values were adjusted for the four modules examined using Bonferroni corrections. Hub proteins identified from these analyses are listed in Supplementary Table 1.
Of the 1,305 proteins examined individually, 11 were significantly associated with TCBV (Table 3, Supplementary Table 4A). Among these, four belonged to M2 (tissue-type plasminogen activator, gelsolin, RGM domain family member B, and coagulation factor IXab), two belonged to M4 (macrophage scavenger receptor types I and II, and OCIA domain-containing protein 1), and the remaining five did not belong to any module. ADP-ribosyl cyclase/cyclic ADP-ribose hydrolase 1 was associated with HV and did not belong to any module (Table 3, Supplementary Table 4B). No proteins were associated with WMH (Supplementary Table 4C).
Of the 1,305 proteins that were analyzed, none was individually significantly associated with all-cause dementia with FDR <0.10, and two were associated with clinical AD dementia: Cathepsin D (HR: 1.78 (1.36–2.34), FDR q-value = 0.04) and A disintegrin and metalloproteinase with thrombospondin motifs 15 (ADAMTS-15) (HR: 1.58 (1.27–1.97), FDR q-value = 0.07) (Table 3, Supplementary Tables 5A and 5B).
Replication analysis in CHS
There were no significant linear associations between the M2 or M4 modules defined in FHS, and TCBV, risk of dementia, or risk of clinical AD dementia in the CHS sample (Supplementary Table 6). The individual proteins associated with TCBV, HV, and AD dementia in the discovery cohort did not replicate (Supplementary Table 7).
DISCUSSION
In this investigation, we used a network approach and individual analysis of about 1,300 plasma proteins in older adults in the community-based FHS Offspring Cohort to identify pathways and potential biomarkers involved in brain aging and ADRD. We identified two modules and several proteins associated with the structural MRI endophenotype TCBV. No module was significantly associated with all-cause dementia or AD dementia after correcting for multiple testing, however, the effect directions are concordant with those observed in the TCBV analyses (HR: 0.82; 95% CI: 0.68 to 0.99 for M2 with all-cause dementia, HR: 1.22; 95% CI: 1.04 to 1.44 for M4 with all-cause dementia). The findings in FHS did not replicate in CHS, possibly due to the differing protein dynamics in this older cohort, which shows the need for further replication to understand potential associations between the plasma proteome and ADRD and its endophenotypes across the life course.
Of the protein modules evaluated, the M4 module showed the strongest associations with TCBV in FHS. It was enriched in proteins pertaining to cytokine-related pathways including cytokine IL-1β and other interleukins (IL-3, IL-22RA1, IL-2RA (CD25)), as well as members of the TNF receptor superfamily. Indeed, inflammation is believed to play a critical role in the development of dementia through microglial activation, and age-related increases in pro- and anti-inflammatory cytokines have been reported [35–38]. For example, a 2014 meta-analysis reported that in several studies, IL-1β was found to be elevated in serum or plasma of patients with AD dementia and MCI, and was unchanged in others [39]. The same meta-analysis reported that circulating IL-3 was generally unchanged in patients with AD dementia and MCI relative to controls, though individual studies showed mixed results. Other inflammatory markers commonly implicated in ADRD, such as IL-6, TNF-α, and CRP [40, 41], were not associated with brain MRI endophenotypes or incident ADRD in our study, either individually or within protein modules, although IL-6 receptor was represented in M2. A recent integrative omics study in AD brains found that CSF1, a cytokine belonging to four of the top five pathways over-represented in M4, is implicated in microglial activation in AD via upregulation in astrocytes [42].
The M2 module was associated with higher TCBV in the discovery cohort. M2 is enriched in proteins involved in phagocytosis and synaptic maintenance. The axon guidance pathway (the most over-represented in M2) is important for neuronal development, neuroinflammation and, possibly, neurodegeneration. A large GWAS meta-analysis of late-onset AD [43, 44], as well as a gene expression study in brains with early-onset AD dementia [45], and several mouse studies have identified a number of axon guidance pathway proteins associated with AD dementia, including Ephrins, Netrins, and semaphorins [46].
The complement and coagulation cascade pathway also showed strong over-representation in M2. Complement cascades are known to be upregulated in the CNS in aging and AD, and may play a role in early synaptic loss through inducing microglial phagocytosis in response to amyloid-β deposition [38, 47, 48]. Our results suggest a somewhat counterintuitive neuroprotective role for M2. One possible explanation is that the greatest weighted complement protein in M2,CD55, is an inhibitor of the complement cascade [49]. In addition, several other complement proteins were negatively weighted within M2, meaning that lower M2 eigenprotein values (associated with worse outcomes) indicated higher expression of these complement proteins. Our results are consistent with a recent plasma proteome study that found over-representation of the complement and coagulation cascade pathway in AD-associated proteins [50]. Finally, cell adhesion molecules were also over-represented among proteins in M2. Synaptic cell adhesion molecules are implicated in synaptic maintenance and neuronal plasticity, and data from murine models suggest that members of the NCAM family, represented in M2, may be responsible for mediating age-related changes in memory [51]. M2 was not significantly associated with total brain volume after adjustment in the linear models for an expanded set of covariates relating to cardiovascular risk. This, along with the observed correlations between M2 and various cardiovascular risk factors (Fig. 2), suggest that the association between M2 and brain aging may be related to its association with overall cardiovascular health.
Previous proteomic co-abundance network analyses in the brain and CSF have identified modules associated with prevalent AD, asymptomatic AD, and cognitive function. Some “hub” proteins found to differentiate those with AD versus healthy controls in Cheng et al. [16] and Jiang et al. [17] were also present in the module M2 we identified, including Insulin-like growth factor-binding protein 2, Osteopontin, Serum amyloid P-component, and Leukemia inhibitory factor receptor. “Hub” proteins in the modules from Swarup et al. [15] and Johnson et al. [18, 19] did not overlap with proteins in the M2 and M4 modules we identified. In Swarup et al. and Zhang et al., however, modules related to MAPK signaling, cell adhesion, immune response, inflammatory response (including complement proteins) were identified and found to be associated with AD status, which is concordant with our TCBV results [14, 15].
A recent study in the ARIC and AGES cohorts used Ingenuity Pathways Analysis to identify protein modules and related pathways associated with incident dementia [20]. In contrast to our network model, which is agnostic to associations with outcomes or previously documented annotations, this study performed network analyses using proteins that were individually associated with dementia, and constructed a network based on previously annotated relationships. Some of the pathways identified in that study overlap with ours, including complement and coagulation cascades, PI3K-Akt signaling pathways, and cytokine-cytokine receptor interaction pathway (Supplementary Table 3B,D). Although the individual dementia-associated proteins in that study did not overlap with those in our analysis, the identification of similar pathways in both studies is reassuring. This supports our hypothesis that analyzing groups of proteins provide more statistical power, and thus is more robust, than analyzing them individually.
Associations of M2 and M4 with TCBV were not replicated in the CHS cohort. Participants from the CHS cohort were on average 19 years older than participants from the FHS cohort, and the mean follow-up time (to dementia or end of follow up) was 5.5 years in CHS, compared to nearly 20 years in FHS. It is possible that associations between eigenproteins and dementia endophenotypes may vary over the life course. Indeed, a recent study found that plasma proteins implicated in aging vary greatly over the life course, and in particular a group of proteins enriched for axon guidance and ephrin signaling pathways (overrepresented in M2 in our study) had stable concentrations until age 70 followed by a sharp increase over subsequent decades [52]. This agrees with our finding that M2 was positively correlated with age in the older CHS sample, but not in the middle-aged FHS (Fig. 2). The roles of proteins in aging appear to be nonlinear, and further research is needed to unpack the interplay between age, plasma protein dynamics and ADRD risk.
The strengths of our study include use of large, well-characterized community-based samples with robust longitudinal follow-up data, an agnostic computational approach to identifying proteins related to ADRD and related MRI endophenotypes from a large panel, and consistent ascertainment of dementia over time. Further analysis of genetic factors that influence circulating protein concentrations could be used to understand potential causal relationships between the proteins identified by this study and ADRD. Our study has some limitations. Our research was not designed to address causal pathways specific to amyloid or tau pathways. Instead, because of use of an “agnostic” approach, these results may reflect systemic states such as inflammation that may have independent, additive, or interactive effects on AD pathologies leading to dementia. WGCNA clusters proteins in such a way that proteins cannot belong to multiple clusters, which may not reflect biological realities. The proteins included in the SomaScan platform were selected specifically because they were of interest for health outcomes. Thus, we do not have a comprehensive or random sample of proteins and they are enriched in biological pathways such as hemodynamics. In addition, the Framingham Offspring Cohort is an ethnically homogenous sample of white participants of European ancestry, and findings may not be generalizable to people from other racial and ethnic groups.
Conclusion
This study uses a large plasma proteome panel in conjunction with network analysis methods to identify groups of proteins associated with neuroimaging markers and incident ADRD in community-based cohorts of cognitively healthy older adults. We identified two groups of proteins associated with TCBV, an endophenotype for dementia. These protein modules were not significantly associated with ADRD risk in our analysis, though the observed directions of effect were concordant with the associations with TCBV. From the relevant protein modules, we identified inflammatory pathways, phagocytosis, axon guidance, and complement and coagulation cascades as having potential roles in earlier stages of abnormal brain aging. Future studies are warranted to replicate our network approach in additional cohorts using blood and CSF protein panels from cognitively healthy older adults.
ACKNOWLEDGMENTS
The authors have no acknowledgments to report.
FUNDING
FHS acknowledges support from the National Heart, Lung, and Blood Institute (NHLBI) [contracts NO1-HC-25195, HHSN268201500001I, 75N92019D00031, and grant number R01HL132320]. Dr. Short is supported in part by NIA [grant number UH3AG064704] and by the National Center for Advancing Translational Sciences, National Institutes of Health [grant number UM1TR004398]. Dr. Aparicio is supported by funds from the American Academy of Neurology Research Program, the Alzheimer’s Association [grant number AARGD-20-685362], and the Boston University Chobanian Assistant Professorship. Dr. DeCarli is supported by NIA [grant numbers: P30AG010129, P30AG072972]. Dr. Vasan is supported in part by the Evans Medical Foundation and the Jay and Louis Coffman Endowment from the Department of Medicine at the Boston University School of Medicine. Dr Fohner is supported by K01AG071689. The research in CHS was supported by contracts HHSN268201200036C, HHSN268200800007C, HHSN268201800001C, N01HC55222, N01HC85079, N01HC85080, N01HC85081, N01HC85082, N01HC85083, N01HC85086, 75N92021D00006, and grants U01HL080295, U01HL130114, and HL144483 from NHLBI, with additional contribution from NINDS. Additional support was provided by R01AG023629 from NIA. Phenotype support was provided from N01HC15103, R01AG15928 & R01AG20098. A full list of principal CHS investigators and institutions can be found at CHS-NHLBI.org. Other support came from National Institute on Aging (NIA) [grant numbers: R01AG063507, R01AG054076, R01AG049607, P30 AG066546, R01AG068293, 1R01AG0665241A1, and R01AG065301R01AG0653011R01AG0665241A1, and R01AG065301R01AG068293, 1R01AG0665241A1, and R01AG065301], and the National Institute of Neurological Disorders and Stroke (NINDS) [grant numbers R01NS017950 and U19NS115388].
CONFLICT OF INTEREST
Dr. Psaty serves on the Steering Committee of the Yale Open Data Access Project, funded by Johnson & Johnson.
Dr. DeCarli serves as a consultant to Novartis on a safety trial of heart failure treatment, and as a consultant to Nova Nordisk on Alzheimer’s treatment.
Drs. Fohner, Satizabal, and McGrath are Associate Editors for this journal but were not involved in the peer-review process for this manuscript nor had access to any information regarding its peer-review.
All other authors have no conflicts of interest to disclose.
DATA AVAILABILITY
The data used to generate the findings in this study are available upon request from the corresponding author. The data are not publicly available due to privacy or ethical restrictions.
SUPPLEMENTARY MATERIAL
[1] The supplementary material is available in the electronic version of this article: https://dx.doi.org/10.3233/JAD-230145.
REFERENCES
[1] | Grossberg GT , Tong G , Burke AD , Tariot PN ((2019) ) Present algorithms and future treatments for Alzheimer’s disease. J Alzheimers Dis 67: , 1157–1171. |
[2] | Weinstein G , Seshadri S ((2014) ) Circulating biomarkers that predict incident dementia. Alzheimers Res Ther 6: , 6. |
[3] | Kiddle SJ , Sattlecker M , Proitsi P , Simmons A , Westman E , Bazenet C , Nelson SK , Williams S , Hodges A , Johnston C ((2014) ) Candidate blood proteome markers of Alzheimer’s disease onset and progression: A systematic review and replication study. J Alzheimers Dis 38: , 515–531. |
[4] | Muenchhoff J , Poljak A , Song F , Raftery M , Brodaty H , Duncan M , McEvoy M , Attia J , Schofield PW , Sachdev PS ((2015) ) Plasma protein profiling of mild cognitive impairment and Alzheimer’s disease across two independent cohorts. J Alzheimers Dis 43: , 1355–1373. |
[5] | Hye A , Riddoch-Contreras J , Baird AL , Ashton NJ , Bazenet C , Leung R , Westman E , Simmons A , Dobson R , Sattlecker M , Lupton M , Lunnon K , Keohane A , Ward M , Pike I , Zucht HD , Pepin D , Zheng W , Tunnicliffe A , Richardson J , Gauthier S , Soininen H , Kłoszewska I , Mecocci P , Tsolaki M , Vellas B , Lovestone S ((2014) ) Plasma proteins predict conversion to dementia from prodromal disease. Alzheimers Dement 10: , 799-807 e792. |
[6] | Pase MP , Beiser AS , Himali JJ , Satizabal CL , Aparicio HJ , DeCarli C , Chêne G , Dufouil C , Seshadri S ((2019) ) Assessment of plasma total tau level as a predictive biomarker for dementia and related endophenotypes. JAMA Neurol 76: , 598–606. |
[7] | Shi L , Westwood S , Baird AL , Winchester L , Dobricic V , Kilpert F , Hong S , Franke A , Hye A , Ashton NJ ((2019) ) Discovery and validation of plasma proteomic biomarkers relating to brain amyloid burden by SOMAscan assay. Alzheimers Dement 15: , 1478–1488. |
[8] | Tanaka T , Lavery R , Varma V , Fantoni G , Colpo M , Thambisetty M , Candia J , Resnick SM , Bennett DA , Biancotto A ((2020) ) Plasma proteomic signatures predict dementia and cognitive impairment. Alzheimers Dement (N Y) 6: , e12018. |
[9] | Huan T , Meng Q , Saleh MA , Norlander AE , Joehanes R , Zhu J , Chen BH , Zhang B , Johnson AD , Ying S ((2015) ) Integrative network analysis reveals molecular mechanisms of blood pressure regulation. Mol Syst Biol 11: , 799. |
[10] | Foroushani A , Agrahari R , Docking R , Chang L , Duns G , Hudoba M , Karsan A , Zare H ((2017) ) Large-scale gene network analysis reveals the significance of extracellular matrix pathway and homeobox genes in acute myeloid leukemia: An introduction to the Pigengene package and its applications. BMC Med Genom 10: , 16. |
[11] | Zhai X , Xue Q , Liu Q , Guo Y , Chen Z ((2017) ) Colon cancer recurrence-associated genes revealed by WGCNA co-expression network analysis. Mol Med Rep 16: , 6499–6505. |
[12] | Di Y , Chen D , Yu W , Yan L ((2019) ) Bladder cancer stage-associated hub genes revealed by WGCNA co-expression network analysis. Hereditas 156: , 7. |
[13] | Guo Y , Ma J , Xiao L , Fang J , Li G , Zhang L , Xu L , Lai X , Pan G , Chen Z ((2019) ) Identification of key pathways and genes in different types of chronic kidney disease based on WGCNA. Mol Med Rep 20: , 2245–2257. |
[14] | Zhang Q , Ma C , Gearing M , Wang PG , Chin L-S , Li L ((2018) ) Integrated proteomics and network analysis identifies protein hubs and network alterations in Alzheimer’s disease. Acta Neuropathol Commun 6: , 19. |
[15] | Swarup V , Chang TS , Duong DM , Dammer EB , Dai J , Lah JJ , Johnson EC , Seyfried NT , Levey AI , Geschwind DH ((2020) ) Identification of conserved proteomic networks in neurodegenerative dementia. Cell Rep 31: , 107807. |
[16] | Cheng Z , Yin J , Yuan H , Jin C , Zhang F , Wang Z , Liu X , Wu Y , Wang T , Xiao S ((2018) ) Blood-derived plasma protein biomarkers for Alzheimer’s disease in Han Chinese. Front Aging Neurosci 10: , 414. |
[17] | Jiang Y , Zhou X , Ip FC , Chan P , Chen Y , Lai NCH , Cheung K , Lo RMN , Tong EPS , Wong BWY , Chan ALT , Mok VCT , Kwok TCY , Mok KY , Hardy J , Zetterberg H , Fu AKY , Ip NY ((2022) ) Large-scale plasma proteomic profiling identifies a high-performance biomarker panel for Alzheimer’s disease screening and staging. Alzheimers Dement 18: , 88–102. |
[18] | Johnson ECB , Dammer EB , Duong DM , Ping L , Zhou M , Yin L , Higginbotham LA , Guajardo A , White B , Troncoso JC , Thambisetty M , Montine TJ , Lee EB , Trojanowski JQ , Beach TG , Reiman EM , Haroutunian V , Wang M , Schadt E , Zhang B , Dickson DW , Ertekin-Taner N , Golde TE , Petyuk VA , De Jager PL , Bennett DA , Wingo TS , Rangaraju S , Hajjar I , Shulman JM , Lah JJ , Levey AI , Seyfried NT ((2020) ) Large-scale proteomic analysis of Alzheimer’s disease brain and cerebrospinal fluid reveals early changes in energy metabolism associated with microglia and astrocyte activation. Nat Med 26: , 769–780. |
[19] | Johnson EC , Dammer EB , Duong DM , Yin L , Thambisetty M , Troncoso JC , Lah JJ , Levey AI , Seyfried NT ((2018) ) Deep proteomic network analysis of Alzheimer’s disease brain reveals alterations in RNA binding proteins and RNA splicing associated with disease. Mol Neurodegener 13: , 52. |
[20] | Walker KA , Chen J , Zhang J , Fornage M , Yang Y , Zhou L , Grams ME , Tin A , Daya N , Hoogeveen RC , Wu A , Sullivan KJ , Ganz P , Zeger SL , Gudmundsson EF , Emilsson V , Launer LJ , Jennings LL , Gudnason V , Chatterjee N , Gottesman RF , Mosley TH , Boerwinkle E , Ballantyne CM , Coresh J ((2021) ) Large-scale plasma proteomic analysis identifies proteins and pathways associated with dementia risk. Nat Aging 1: , 473–489. |
[21] | Feinleib M , Kannel WB , Garrison RJ , McNamara PM , Castelli WP ((1975) ) The Framingham offspring study. Design and preliminary data. Prev Med 4: , 518–525. |
[22] | Nayor M , Short MI , Rasheed H , Lin H , Jonasson C , Yang Q , Hveem K , Felix JF , Morrison AC , Wild PS ((2020) ) Aptamer-based proteomic platform identifies novel protein predictors of incident heart failure and echocardiographic traits. Circ Heart Fail 13: , e006749. |
[23] | Ngo D , Sinha S , Shen D , Kuhn EW , Keyes MJ , Shi X , Benson MD , O’Sullivan JF , Keshishian H , Farrell LA ((2016) ) Aptamer-based proteomic profiling reveals novel candidate biomarkers and pathways in cardiovascular disease. Circulation 134: , 270–285. |
[24] | DeCarli C , Massaro J , Harvey D , Hald J , Tullberg M , Au R , Beiser A , D’Agostino R , Wolf PA ((2005) ) Measures of brain morphology and infarction in the framingham heart study: Establishing what is normal. Neurobiol Aging 26: , 491–510. |
[25] | Jeerakathil T , Wolf PA , Beiser A , Massaro J , Seshadri S , D’Agostino RB , DeCarli C ((2004) ) Stroke risk profile predicts white matter hyperintensity volume: The Framingham Study. Stroke 35: , 1857–1861. |
[26] | Tan ZS , Beiser AS , Fox CS , Au R , Himali JJ , Debette S , DeCarli C , Vasan RS , Wolf PA , Seshadri S ((2011) ) Association of metabolic dysregulation with volumetric brain magnetic resonance imaging and cognitive markers of subclinical brain aging in middle-aged adults. Diabetes Care 34: , 1766–1770. |
[27] | McGrath ER , Himali JJ , Levy D , Conner SC , DeCarli CS , Pase MP , Courchesne P , Satizabal CL , Vasan RS , Beiser AS ((2019) ) Circulating IGFBP-2: A novel biomarker for incident dementia. Ann Clin Transl Neurol 6: , 1659–1670. |
[28] | Core Team R ((2020) ) R: A language and environment for statistical computing. R Foundation for Statistical Computing. Vienna, Austria. |
[29] | Liang W , Sun F , Zhao Y , Shan L , Lou H ((2020) ) Identification of susceptibility modules and genes for cardiovascular disease in diabetic patients using WGCNA analysis. J Diabetes Res 2020: , 4178639. |
[30] | Wang M , Wang L , Pu L , Li K , Feng T , Zheng P , Li S , Sun M , Yao Y , Jin L ((2020) ) LncRNAs related key pathways and genes in ischemic stroke by weighted gene co-expression network analysis (WGCNA). Genomics 112: , 2302–2308. |
[31] | Benjamini Y , Hochberg Y ((1995) ) Controlling the false discovery rate: A practical and powerful approach to multiple testing. J R Stat Soc B Methodol 57: , 289–300. |
[32] | Fried LP , Borhani NO , Enright P , Furberg CD , Gardin JM , Kronmal RA , Kuller LH , Manolio TA , Mittelmark MB , Newman A , O’Leary DH , Psaty B , Rautaharju P , Tracy RP , Weiler PG ((1991) ) The cardiovascular health study: Design and rationale. Ann Epidemiol 1: , 263–276. |
[33] | Fitzpatrick AL , Kuller LH , Ives DG , Lopez OL , Jagust W , Breitner JC , Jones B , Lyketsos C , Dulberg C ((2004) ) Incidence and prevalence of dementia in the Cardiovascular Health Study. J Am Geriatr Soc 52: , 195–204. |
[34] | Kuller LH , Lopez OL , Jagust WJ , Becker JT , DeKosky ST , Lyketsos C , Kawas C , Breitner JC , Fitzpatrick A , Dulberg C ((2005) ) Determinants of vascular dementia in the Cardiovascular Health Cognition Study. Neurology 64: , 1548–1552. |
[35] | Rea IM , Gibson DS , McGilligan V , McNerlan SE , Alexander HD , Ross OA ((2018) ) Age and age-related diseases: Role of inflammation triggers and cytokines. Front Immunol 9: , 586–586. |
[36] | Minciullo PL , Catalano A , Mandraffino G , Casciaro M , Crucitti A , Maltese G , Morabito N , Lasco A , Gangemi S , Basile G ((2016) ) Inflammaging and anti-inflammaging: The role of cytokines in extreme longevity. Arch Immunol Ther Exp 64: , 111–126. |
[37] | Morrisette-Thomas V , Cohen AA , Fülöp T , Riesco É , Legault V , Li Q , Milot E , Dusseault-Bélanger F , Ferrucci L ((2014) ) Inflamm-aging does not simply reflect increases in pro-inflammatory markers. Mech Ageing Dev 139: , 49–57. |
[38] | Hammond TR , Marsh SE , Stevens B ((2019) ) Immune signaling in neurodegeneration. Immunity 50: , 955–974. |
[39] | Brosseron F , Krauthausen M , Kummer M , Heneka MT ((2014) ) Body fluid cytokine levels in mild cognitive impairment and Alzheimer’s disease: A comparative overview. Mol Neurobiol 50: , 534–544. |
[40] | Koyama A , O’Brien J , Weuve J , Blacker D , Metti AL , Yaffe K ((2012) ) The role of peripheral inflammatory markers in dementia and Alzheimer’s disease: A meta-analysis. J Gerontol A Biol Sci Med Sci 68: , 433–440. |
[41] | Zheng C , Zhou X-W , Wang J-Z ((2016) ) The dual roles of cytokines in Alzheimer’s disease: Update on interleukins, TNF-α, TGF-β and IFN-γ. Transl Neurodegener 5: , 7. |
[42] | Klein H-U , Schäfer M , Bennett DA , Schwender H , De Jager PL ((2020) ) Bayesian integrative analysis of epigenomic and transcriptomic data identifies Alzheimer’s disease candidate genes and networks. PLoS Comput Biol 16: , e1007771. |
[43] | Hollingworth P , Harold D , Sims R , Gerrish A , Lambert J-C , Carrasquillo MM , Abraham R , Hamshere ML , Pahwa JS , Moskvina V , et al. ((2011) ) Common variants at ABCA7, MS4A6A/MS4A4E, EPHA1, CD33 and CD2AP are associated with Alzheimer’s disease. Nat Genet 43: , 429–435. |
[44] | Naj AC , Jun G , Beecham GW , Wang L-S , Vardarajan BN , Buros J , Gallins PJ , Buxbaum JD , Jarvik GP , Crane PK , et al. ((2011) ) Common variants at MS4A4/MS4A6E, CD2AP, CD33 and EPHA1 are associated with late-onset Alzheimer’s disease. Nat Genet 43: , 436–441. |
[45] | Antonell A , Lladó A , Altirriba J , Botta-Orfila T , Balasa M , FernÁndez M , Ferrer I , SÁnchez-Valle R , Molinuevo JL ((2013) ) A preliminary study of the whole-genome expression profile of sporadic and monogenic early-onset Alzheimer’s disease. Neurobiol Aging 34: , 1772–1778. |
[46] | Van Battum EY , Brignani S , Pasterkamp RJ ((2015) ) Axon guidance proteins in neurological disorders. Lancet Neurol 14: , 532–546 . |
[47] | Presumey J , Bialas AR , Carroll MC ((2017) ) Complement system in neural synapse elimination in development and disease. Adv Immunol 135: , 53–79. |
[48] | Sokolowski JD , Mandell JW ((2011) ) Phagocytic clearance in neurodegeneration. Am J Pathol 178: , 1416–1428. |
[49] | Dho SH , Lim JC , Kim LK ((2018) ) Beyond the role of CD55 as a complement component. Immune Netw 18: , e11–e11. |
[50] | Chen M , Xia W ((2020) ) Proteomic profiling of plasma and brain tissue from Alzheimer’s disease patients reveals candidate network of plasma biomarkers. J Alzheimers Dis 76: , 349–368. |
[51] | Sytnyk V , Leshchyns’ka I , Schachner M ((2017) ) Neural cell adhesion molecules of the immunoglobulin superfamily regulate synapse formation, maintenance, and function. Trends Neurosci 40: , 295–308. |
[52] | Lehallier B , Gate D , Schaum N , Nanasi T , Lee SE , Yousef H , Losada PM , Berdnik D , Keller A , Verghese J ((2019) ) Undulating changes in human plasma proteome profiles across the lifespan. Nat Med 25: , 1843–1850. |

