
Brain Derived Neurotrophic Factor Interacts with White Matter Hyperintensities to Influence Processing Speed and Hippocampal Volume in Older Adults
Abstract
Background:
Brain-derived neurotrophic factor (BDNF) is a neurotrophin that plays an important role in regulating synaptic activity and plasticity.
Objective:
Given that type-2 diabetes (T2DM) increases the risk of cognitive decline, and studies have suggested lower BDNF levels may be a risk factor of diabetic neurovascular complications, we sought to investigate total white matter hyperintensities (WMH) as a moderator of the effect of BDNF on hippocampal volume and cognition.
Methods:
Older adults without dementia from the Alzheimer’s Disease Neuroimaging Initiative (N = 454 including 49 with T2DM and 405 without diabetes) underwent neuropsychological evaluation, magnetic resonance imaging to quantify hippocampal and WMH volumes, and blood draw to assess BDNF.
Results:
Adjusting for age, sex, and APOE ɛ4 carrier status, there was a significant interaction between total WMH and BDNF on bilateral hippocampal volume in the non-T2DM group (t = 2.63, p = 0.009). Examination of main effect models with a dichotomous high/low BNDF group revealed a significant main effect for low BDNF (t = –4.98, p < 0.001), such that as WMH increased, bilateral hippocampal volume decreased. There was also a significant interaction between total WMH and BDNF on processing speed in the non-T2DM group (t = 2.91, p = 0.004). There was a significant main effect for low BDNF (t = –3.55, p < 0.001) such that as WMH increased, processing speed decreased. The interactions were not significant in the T2DM group.
Conclusion:
These results further elucidate the protective role that BDNF plays on cognition, as well as the cognitive effects of WMH.
INTRODUCTION
Brain-derived neurotrophic factor (BDNF) is a neurotrophin that plays an important role in regulating synaptic activity, neurotransmission, neuronal repair, and plasticity in the central nervous system. More specifically, BDNF has been linked to learning and memory. It helps neuronal maintenance in the entorhinal cortex [1] and plays a role in regulating long-term potentiation, a type of synaptic plasticity considered as the cellular correlate of long-term memory (LTM) formation [2, 3]. Some studies have suggested that BDNF regulation specifically, and not that of other neurotrophin factors, is associated with LTM formation [4, 5].
Alzheimer’s disease (AD), the most common form of dementia among older adults, often involves synaptic and neuronal degeneration of the hippocampus, and one of the areas where BDNF is expressed is the hippocampus nuclei. In older adults with AD, BDNF plasma and serum levels have repeatedly been shown to be significantly decreased when compared with healthy older adults [6] and those with vascular dementia [7]. This decrease in BDNF may contribute to the pathogenic process of AD through lack of trophic support. One meta-analysis found that in AD, but not mild cognitive impairment (MCI)—which is conceptualized as a transitional stage between normal cognition and dementia—BDNF levels are significantly lower, suggesting that peripheral changes are more easily detected at later stages in the disease [6]. Another found that BDNF levels were significantly positively associated with CSF Aβ42 levels and significantly correlated with medial temporal lobe atrophy [8]. Higher levels of BDNF were correlated with lower hippocampal pro-BDNF levels and higher hippocampal p-Tau accumulation [9]. Despite the significant amount of research on BDNF levels in AD and associations with AD pathology, BDNF has not been widely studied in individuals without dementia, particularly investigating the relationship between BDNF levels and cognition.
One important factor in studying risk for decline in older adults without dementia is white matter hyperintensities (WMH), a marker for small vessel cerebrovascular disease. Total WMH have been shown to be associated with conversion from normal cognition to MCI [10], and one study found that autosomal-dominant AD is associated with increased WMH several years before symptom onset [11]. WMH may cause cognitive decline, particularly in processing speed [12], and WMH studies on the whole suggest that WMH are may contribute to the development of dementia [13]. Although the precise mechanism of the effect of WMH on AD is unknown, regional distribution and volume may play a role [14–16]. WMH are thought to be heterogeneous and have been associated with processes including demyelination, axonal loss due to ischemia or neuronal death, microglia and endothelial activation, and cerebral amyloid angiopathy [17]. The relationship between BDNF and WMH is not well studied, although one study found that number and volume of deep white matter lesions was positively associated with BDNF levels in patients without dementia [18].
Type 2 diabetes mellitus (T2DM) is a condition that increases the risk of cognitive decline, development of dementia including AD, and cardiovascular disease, a leading cause of death in people with T2DM. T2DM is also associated with deficits in multiple domains of cognitive functioning, including memory and executive functions [19, 20]. It is linked to reduced cerebral blood flow, particularly in brain regions implicated in AD such as the medial temporal lobes [21], as well as cerebrovascular disease.
The literature examining the role of BDNF in T2DM is limited but increasing, and several studies have found that the circulating level of BDNF is reduced in individuals with T2DM alone, AD alone, and more reduced in individuals diagnosed with both [22]. Lower BDNF levels have been shown to be correlated with worse delayed memory in T2DM, and there is evidence that decreased insulin resistance is associated with increased release of BDNF [23]. Several studies also suggest that lower BDNF levels may be a risk factor of diabetic neurovascular complications (for review, see [23]).
Since T2DM increases the risk of cognitive decline and development of dementia, and several studies have suggested that lower BDNF levels may be a risk factor of diabetic neurovascular complications, we sought to investigate 1) differences in BDNF levels between those with and without T2DM, and 2) WMH volume, a marker of small vessel cerebrovascular disease, as a moderator on the association of BDNF with both cognition and hippocampal volume in older adults with and without T2DM.
MATERIALS AND METHODS
ADNI data set
Data used in the preparation of this article were obtained from the Alzheimer’s Disease Neuroimaging Initiative (ADNI) databasehttps://adni.loni.usc.edu The ADNI was launched in 2003 as a public-private partnership, led by Principal Investigator Michael W. Weiner, MD. The primary goal of ADNI has been to test whether serial magnetic resonance imaging (MRI), positron emission tomography (PET), other biological markers, and clinical and neuropsychological assessment can be combined to measure the progression of MCI and early AD.
Participants
All participants included in ADNI were between the ages of 55 and 90 years, had completed at least 6 years of education, were Spanish or English speakers, had Geriatric Depression Scale scores <6 (possible score range is 0–15) [24], had modified Hachinski Ischemic Scale scores <4, and were free of any significant neurological disease, major psychiatric conditions, or systemic illness. ADNI was approved by the institutional review boards at participating institutions and written informed consent was obtained. Participants were included in this study if they were not diagnosed with clinical dementia and had BDNF data available at their baseline visit. This resulted in 454 participants. Of these, 49 met criteria for T2DM and 405 did not (see Table 1 for demographics). For an additional post-hoc analysis, participants were classified as cognitively unimpaired (CU) or MCI according to Jak/Bondi actuarial neuropsychological MCI criteria [25].
Table 1
Participant demographics
| T2DM (N = 49) | Non-T2DM (N = 405) | Between-group differences | |
| Age | 74.85±5.40 | 74.91±7.41 | t = –1.53, p = 0.128, d = 0.12 |
| Education | 15.16±3.07 | 15.70±2.99 | t = –0.97, p = 0.335, d = 0.08 |
| Sex | 38 M; 11 F | 248 M; 157 F | χ2 = 12.58, p < 0.001, V = 0.10 |
| Race | 86% White, 10% Black, 2% Asian, 2% More than one race | 94% White, 3% Black, 2% Asian | χ2 = 20.18, p = 0.003, V = 0.12 |
| Cognitive Status | 18 CU; 31 MCI | 147 CU; 258 MCI | χ2 = 2.26, p = 0.133, V = 0.04 |
| APOE Status | 18 APOE ɛ4 carriers; 31 non-carriers | 198 APOE ɛ4 carrier; 207 non-carriers | χ2 = 0.074, p = 0.785, V V = –0.007 |
| Pulse Pressure | 61.21±14.81 | 59.65±13.81 | t = 1.31, p = 0.191, d = 0.11 |
Welch two-sample t-tests were used for evaluating differences in age, education, and pulse pressure between the T2DM and non-T2DM groups. Chi-square tests were used to evaluate differences in sex, race, cognitive status, and APOE ɛ4 carrier status between T2DM and non-T2DM groups. “V” indicates Cramer’s V. “d” indicates Cohen’s d.
BDNF measurement
All plasma based BDNF data were downloaded from the ADNI website https://adni.loni.usc.edu">https://adni.loni.usc.edu/">https://adni.loni.usc.edu. Detailed methods can be found online https://adni.loni.usc.edu/methods/. Briefly, blood samples were collected during baseline visit only, in the morning after an overnight fast, centrifuged to prepare plasma, and frozen on dry ice. Samples underwent an additional freeze–thaw cycle prior to quantification of BDNF. BDNF concentration was analyzed using the multiplex immunoassay panel, which is based on Luminex’s xMAP Technology by Rules-Based Medicine (RBM, Austin, TX).
Diabetes classification
T2DM classification was determined based on the ADNI medical history database [26] or use of glucose-lowering medications [27]. Consistent with previous work in ADNI [26], the following search terms were used to identify participants with T2DM at baseline from medical history: diabetes, diabetic, insulin, insulin-dependent diabetes mellitus, and non-insulin dependent diabetes mellitus. Individuals with type 1 diabetes were excluded.
Neuropsychological scores
Memory recall was measured by the Rey Auditory Verbal Learning Test (RAVLT) as the number of words recalled following a 30-min delay. Recognition memory was calculated from the RAVLT by subtracting false-positive errors from the number of words correctly recognized. Processing speed was measured by time to complete Trail Making Test A. Each of these measures was converted to a z-score that was adjusted for age, education, and sex based on performance of a sample of cognitively normal ADNI participants who remained cognitively normal throughout their participation in the study (n = 274), consistent with previously published results [28]. Memory was chosen because of its previously discussed association with BDNF and cognitive deficits in early AD. Processing speed was examined because of its sensitivity to WMH and vascular risk.
MR image acquisition and analysis
A description of ADNI MRI imaging data acquisition and processing is available onlinehttps://www.loni.usc.edu/. All images were acquired on 1.5 T systems with 3D T1-weighted magnetization-prepared rapid gradient echo sequences in sagittal orientation. A proton density/T2-weighted fast spin echo sequence was obtained and used for quantifying WMH. The ADNI protocol was validated across platforms and all imaging sites passed scanner validation tests [29]. Hippocampal and total intracranial volumes were derived from FreeSurfer. WMH were identified on co-registered T1, T2, and PD-weighted images using an automated method that has been previously described [30, 31]. The T1 image was stripped of nonbrain tissues and nonlinearly aligned to a minimum deformation template [32, 33]. The T2- and PD-weighted images were stripped of nonbrain tissues and warped to the space of the minimum deformation template image based on the T1 alignment and warping parameters. WMH were detected at each voxel based on image intensities of the PD, T1, and T2 images, combined with a spatial prior (the prior probability of WMH occurring at a given voxel) as well as a contextual prior (the conditional probability of WMH occurring at a given voxel based on the presence of WMH at neighboring voxels). A more detailed description of this has been previously reported [34].
Statistical analyses
Prior to analyses, data were examined for violations of assumptions of the statistical procedures employed. Age, sex, education, and APOE ɛ4 status (dichotomous carrier versus noncarrier) were entered into all models as covariates, and education was added when the dependent variable was cognition. Both hippocampal volume and WMH volume were divided by total intracranial volume to account for head size. WMH volume (normalized by total intracranial volume) was log transformed to normalize their non-normal distributions. Cognitive measures were Box-cox transformed to improve normality of their distributions, and outliers were removed from BDNF and hippocampal volume variables using the interquartile range method.
We first used linear regression to examine associations between BDNF level and covariates across the entire sample (collapsing those with and without T2DM). Analyses adjusted for age, sex, APOE ɛ4 status, and diabetes status, but did not control for the covariate when it was the outcome variable.
Differences in BDNF level between those with and without T2DM were identified using ANCOVA. We examined the interaction between total WMH and BDNF by examining the interaction between these two variables on 1) bilateral hippocampal volume and 2) cognition (i.e., memory and processing speed), within each group (T2DM and non-T2DM). When the interaction term was significant, we examined main effects within the T2DM and non-T2DM groups. For each interaction, the relevant variables were entered into a regression analysis with corresponding dependent variable and covariates. When examining main effects, BDNF was dichotomized by median split. In a posthoc analysis, we additionally controlled for use of metformin, since it decreases glucose production by increasing the insulin sensitivity of body tissues, and one of the mechanisms described for BDNF is interfering with insulin resistance. All results remained the same when controlling for metformin.
RESULTS
BDNF and covariates
Across the entire sample, BDNF level was significantly associated with age, such that as age increased, BDNF decreased (t = –2.11, p = 0.035). BDNF was also significantly associated with sex (t = 3.54, p < 0.001) such that females had significantly higher BDNF levels than males (M = 0.36, SD = 0.33 versus M = 0.23, SD = 0.38; p < 0.001). BDNF level was not associated with APOE status (t = 0.11, p = 0.909).
BDNF levels between T2DM groups
ANCOVA models adjusting for age, sex, and APOE ɛ4 carrier status revealed that older adults with T2DM did not show reduced BDNF levels relative to those without T2DM (M = 0.17, SD = 0.40 versus M = 0.28, SD = 0.39; F = 2.73, p = 0.099).
Interaction between total WMH and BDNF on bilateral hippocampal volume
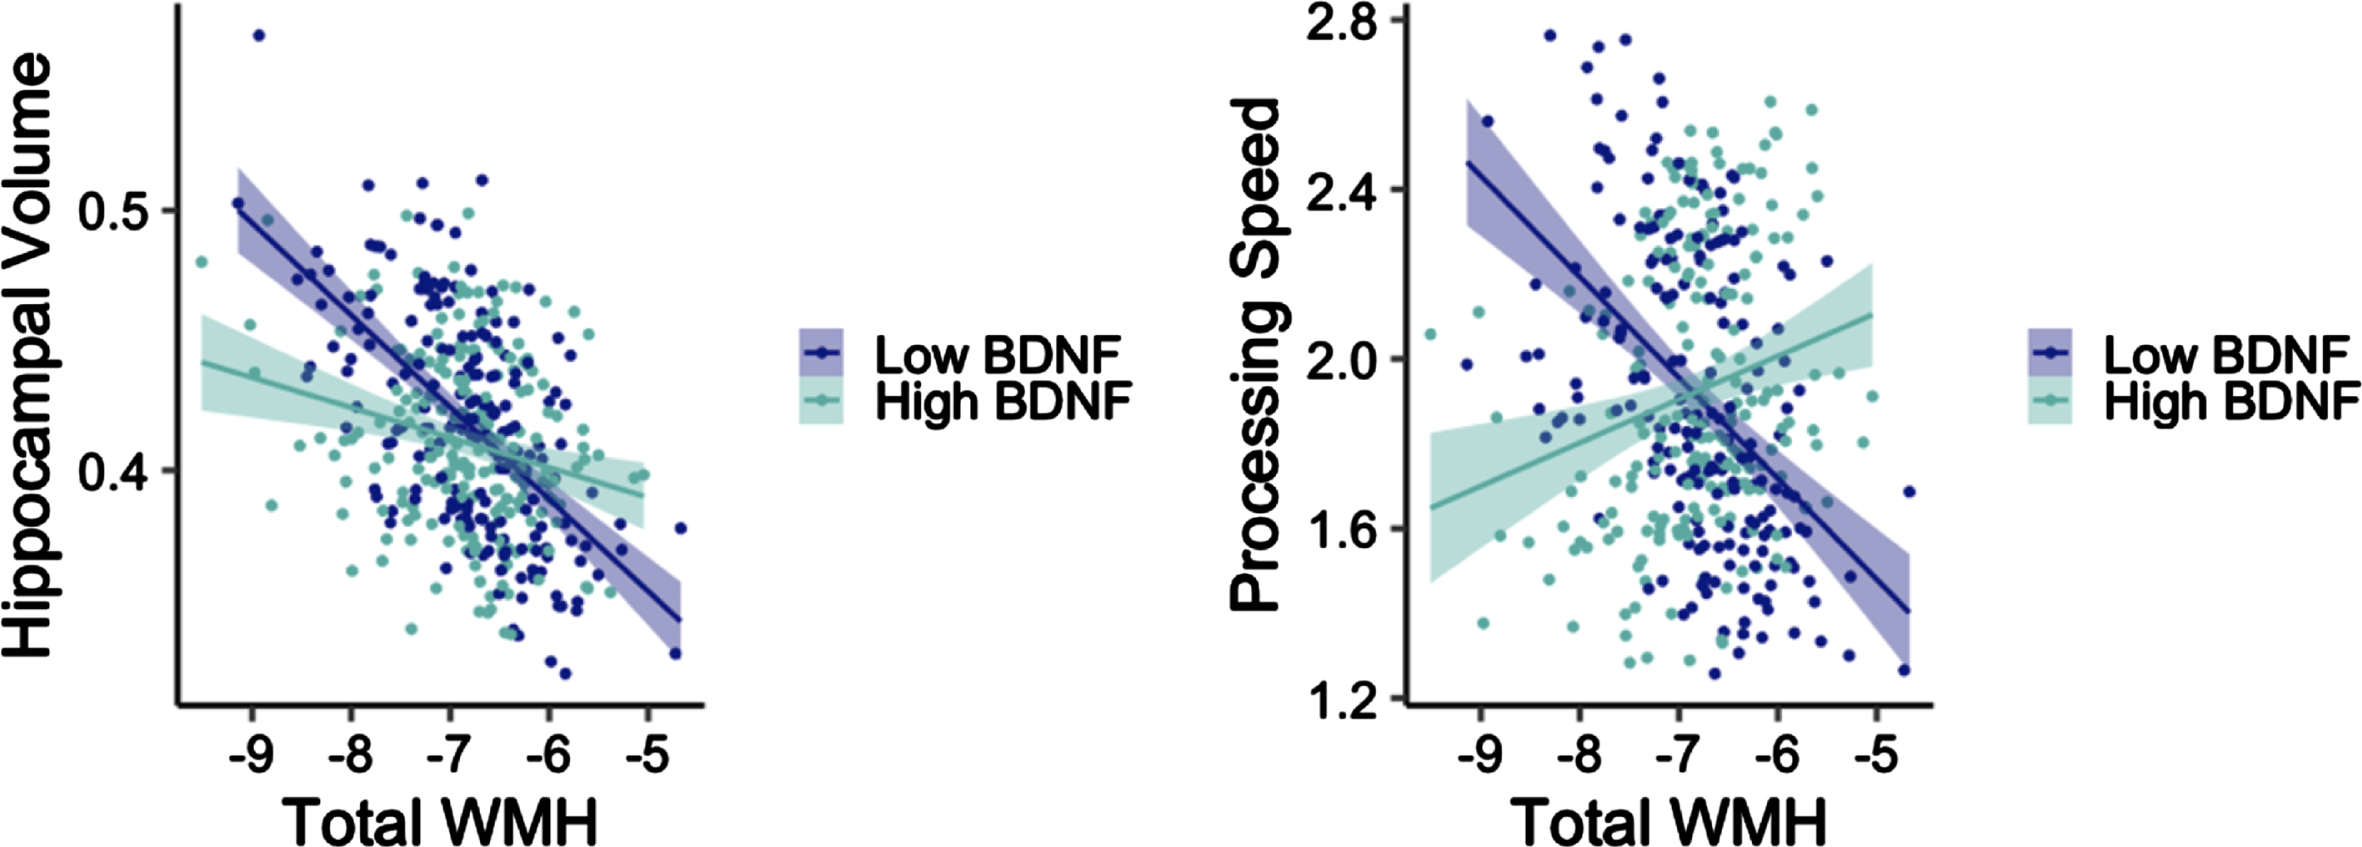
Adjusting for age, sex, and APOE ɛ4 carrier status, there was a significant interaction between total WMH and BDNF on bilateral hippocampal volume in the non-T2DM group (t = 2.63, p = 0.009; Fig. 1). Examination of main effect models with a dichotomous high/low BNDF group revealed a significant main effect for low BDNF (t = –4.98, p < 0.001), such that as WMH increased, bilateral hippocampal volume decreased. The main effect was not significant in the high BDNF group (t = –0.33, p = 0.745). This same interaction was not significant in the T2DM group (t = –0.86, p = 0.399).
Fig. 1
Interactions between WMH volume and BDNF on hippocampal volume (left) and processing speed (right) among older adults without diabetes. Y-axes reflect model-predicted hippocampal volume and processing speed, respectively. X-axes reflect total WMH. Hippocampal volume was normalized by intracranial volume.
Interaction between total WMH and BDNF on cognition
Adjusting for age, sex, APOE ɛ4 carrier status, and education, there was a significant interaction between total WMH and BDNF on processing speed in the non-T2DM group (t = 2.91, p = 0.004; Fig. 1). There was a significant main effect for low BDNF (t = –3.55, p < 0.001) such that as WMH increased, processing speed decreased. The main effect was not significant in the high BDNF group (t = 0.13, p = 0.901). This interaction was not significant in the T2DM group when examining processing speed (t = –1.06, p = 0.297), recall (t = –0.78, p = 0.440), or recognition (t = 0.24, p = 0.813). This interaction was also not significant in the non-T2DM group when examining recall (t = –0.24, p = 0.813) or recognition (t = –0.80, p = 0.427).
DISCUSSION
Our results demonstrate that BDNF level plays a role in the associations between WMH and both hippocampal volume and cognition in those without T2DM. In our sample, older adults with T2DM did not show differences in BDNF levels relative to those without T2DM, after adjusting for demographics and dementia risk factors including age, sex, and APOE ɛ4 carrier status. There were significant interactions between total WMH volume and BDNF on hippocampal volume in the non-T2DM group, such that for those with low BDNF, as WMH increased, bilateral hippocampal volume decreased. There was also a significant interaction between total WMH and BDNF on processing speed in the non-T2DM group, such that for those with low BDNF, as WMH increased, processing speed decreased. These interactions were not significant in the T2DM group.
Our finding that those with T2DM had similar levels of BDNF compared to those without T2DM does not align with literature noting reduced BDNF levels in individuals with T2DM [22, 35, 36]. Importantly, one meta-analysis found that lower levels of BDNF were found in T2DM patients only when they had cognitive impairment [37]. We excluded for dementia, offering another possible explanation for these findings. Additionally, our sample had relatively low vascular risk compared to the general T2DM population because the study excluded for participants with a modified Hachinski Ischemic Scale scores >4. However, in a post-hoc analysis additionally controlling for cognitive status (CU versus MCI), the T2DM group had significantly lower BDNF levels (p = 0.047). Although everyone in the sample did not have a diagnosis of dementia, this indicates a potential effect of subtle cognitive changes on BDNF. One of the main sources of BDNF is platelets, which help regulate glucose metabolism. Low levels of BDNF have been associated with impaired glucose metabolism, and its cerebral output specifically has been shown to be negatively regulated by high plasma glucose levels [35, 38]. In people with T2DM, lower levels of BDNF were associated with obesity and diabetes complications [38]. Importantly, BDNF levels can be increased behaviorally, via exercise, which increases upregulation of BDNF as well as insulin sensitivity. Increased exercise has been linked to increases in BDNF levels, both in healthy controls and individuals with T2DM [39–41].
We also observed an interaction between total WMH and BDNF on both bilateral hippocampal volume and processing speed in individuals without T2DM. For both interactions, there were significant associations in those with low BDNF, where WMH were negatively associated with hippocampal volume and processing speed. The link between BDNF and vascular risk is not yet fully understood. However, plasma BDNF levels have been associated with risk factors for cardiovascular disease, including blood pressure, triglycerides, total cholesterol, and BMI [42]. Several studies have additionally suggested that lower BDNF levels may be a risk factor of diabetic neurovascular complications [23]. More recently, as part of the Framingham Study, high serum BDNF levels were associated with lower levels of WHM in individuals free from stroke or transient ischemic attack, and after 10-year follow-up, lower serum BDNF was associated with increased risk of incident stroke and transient ischemic attack, suggesting that BDNF levels may modify the risk of clinical and subclinical cerebrovascular disease [43]. However, studies examining the relationship between either serum or plasma BDNF and WMH in individuals with T2DM are scarce; more research is needed in this area and the precise mechanism by which BDNF affects vascular risk is unknown. It is important to note that we did not find these interactions between BDNF and WMH on cognition or hippocampal volume in the T2DM group. One possible explanation for this could be a small sample in this group (N = 49) compared to the non-T2DM group (N = 405). Another possibility is that quantifying BDNF levels using plasma may not be an optimal strategy for evaluating neurovascular complications in individuals with T2DM. Furthermore, although the volume of WMH in those with T2DM is often associated with processing speed and attention [44, 45], other research has not found these associations, including a 3-year longitudinal study [46, 47].
There are several limitations to our study worth noting. First, BDNF levels collected in ADNI are quantified in plasma, but recent literature has shown higher reliability of measurement in serum [48, 49]. Also, our sample of individuals with T2DM who had BDNF data collected was small (n = 49), suggesting that these findings be considered preliminary. Moreover, this sample size precluded us from conducting analyses stratified by cognitive diagnosis within participants with T2DM, however, all participants did not have dementia. All participants had modified Hachinski Ischemic Scale scores <4, indicating that they had relatively low vascular risk, likely lower than most individuals with T2DM. This may have contributed to our finding that those with and without T2DM had similar BDNF levels. Despite these limitations, our analyses add novel findings to the field.
Conclusions
The current study examined associations between BDNF, and WMH on hippocampal volume and cognition in individuals with and without T2DM. Analyses revealed that those with T2DM had similar levels of BDNF as those without T2DM. We also observed that the association between WMH and both processing speed and bilateral hippocampal volume depends on BDNF level in individuals without T2DM. These results further elucidate the protective role that BDNF plays on cognitive decline in this population. This is suggested by the interaction between WMH and BDNF on processing speed, where, as BDNF level increases, the relationship between WMH and processing speed increases. To our knowledge, this is the first study to examine WMH and BDNF levels in non-demented individuals with and without T2DM. It contributes additional specificity, particularly in the associations between BDNF and specific cognitive domains. Future work may examine additional neurotrophins, such as insulin-like growth factor-1, which has also been shown to play a protective role in AD [50]. Future research should also investigate these relationships in individuals with AD with and without T2DM.
ACKNOWLEDGMENTS
The authors have no acknowledgments to report.
FUNDING
Sources of funding for this project include VA Clinical Science Research & Development (Career Development Award-2 1IK2CX000938 to K.J.B, Merit Award 1I01CX001842 to K.J.B., and IK2CX001865 to K.R.T.); grants from the National Institutes of Health (National Institute on Aging R01AG063782 to K.J.B., Diversity Supplement R01AG063782A to E.K.B., NIA R03AG070435 to K.R.T., and National Institute on Aging R01AG049810 to M.W.B and P30 AG062429 Research Education Component Scholars Program to E.K.B and K.R.T. The content is solely the responsibility of the authors and does not necessarily represent the official views of the National Institutes of Health.
Data collection and sharing for this project was funded by the Alzheimer’s Disease Neuroimaging Initiative (ADNI) (National Institutes of Health Grant U01 AG024904) and DOD ADNI (Department of Defense award number W81XWH-12-2–0012). ADNI is funded by the National Institute on Aging, the National Institute of Biomedical Imaging and Bioengineering, and through generous contributions from the following: AbbVie, Alzheimer’s Association; Alzheimer’s Drug Discovery Foundation; Araclon Biotech; BioClinica, Inc; Biogen; Bristol-Myers Squibb Company; CereSpir, Inc; Cogstate; Eisai Inc; Elan Pharmaceuticals, Inc; Eli Lilly and Company; EuroImmun; F. Hoffmann-La Roche Ltd and its affiliated company Genentech, Inc; Fujirebio; GE Healthcare; IXICO Ltd; Janssen Alzheimer Immunotherapy Research & Development, LLC.; Johnson & Johnson Pharmaceutical Research & Development LLC.; Lumosity; Lundbeck; Merck & Co, Inc; Meso Scale Diagnostics, LLC.; NeuroRx Research; Neurotrack Technologies; Novartis Pharmaceuticals Corporation; Pfizer Inc; Piramal Imaging; Servier; Takeda Pharmaceutical Company; and Transition Therapeutics. The Canadian Institutes of Health Research is providing funds to support ADNI clinical sites in Canada. Private sector contributions are facilitated by the Foundation for the National Institutes of Health https://www.fnih.org. The grantee organization is the Northern California Institute for Research and Education, and the study is coordinated by the Alzheimer’s Therapeutic Research Institute at the University of Southern California. ADNI data are disseminated by the Laboratory for Neuro Imaging at the University of Southern California.
CONFLICT OF INTEREST
Dr. Bondi serves as a consultant for Roche and receives royalties from Oxford University Press. Drs. Thomas, Bondi, and Bangen are Editorial Board Members of this journal but were not involved in the peer-review process nor had access to any information regarding its peer-review. The other authors report no disclosures.
DATA AVAILABILITY
The data supporting the findings of this study are available via request from the Alzheimer’s Disease Neuroimaging Initiative (ADNI) database https://adni.loni.usc.edu.
REFERENCES
[1] | Nagahara AH , Merrill DA , Coppola G , Tsukada S , Schroeder BE , Shaked GM , Wang L , Blesch A , Kim A , Conner JM , Rockenstein E , Chao MV , Koo EH , Geschwind D , Masliah E , Chiba AA , Tuszynski MH ((2009) ) Neuroprotective effects of brain-derived neurotrophic factor in rodent and primate models of Alzheimer’s disease. Nat Med 15: , 331–337. |
[2] | Bliss TVP , Collingridge GL ((1993) ) A synaptic model of memory: Long-term potentiation in the hippocampus. Nature 361: , 31–39. |
[3] | Martin SJ , Grimwood PD , Morris RGM ((2000) ) Synaptic plasticity and memory: An evaluation of the hypothesis. Annu Rev Neurosci 23: , 649–711. |
[4] | Hennigan A , Callaghan CK , Kealy J , Rouine J , Kelly ÁM ((2009) ) Deficits in LTP and recognition memory in the geneticallyhypertensive rat are associated with decreased expression ofneurotrophic factors and their receptors in the dentate gyrus. Behav Brain Res 197: , 371–377. |
[5] | Rattiner LM ((2004) ) Brain-derived neurotrophic factor and tyrosine kinase receptor B involvement in amygdala-dependent fear conditioning. J Neurosci 24: , 4796–4806. |
[6] | Ng T , Ho C , Tam W , Kua E , Ho R ((2019) ) Decreased serum brain-derived neurotrophic factor (BDNF) levels in patients with Alzheimer’s disease (AD): A systematic review and meta-analysis. Int J Mol Sci 20: , 257. |
[7] | Yasutake C , Kuroda K , Yanagawa T , Okamura T , Yoneda H ((2006) ) Serum BDNF, TNF-α and IL-1β levels in dementia patients: Comonparis between Alzheimer’s disease and vascular dementia. Eur Arch Psychiatry Clin Neurosci 256: , 402–406. |
[8] | Mori Y , Tsuji M , Oguchi T , Kasuga K , Kimura A , Futamura A , Sugimoto A , Kasai H , Kuroda T , Yano S , Hieda S , Kiuchi Y , Ikeuchi T , Ono K ((2021) ) Serum BDNF as a potential biomarker of Alzheimer’s disease: Verification through assessment of serum, cerebrospinal fluid, and medial temporal lobe atrophy. Front Neurol 12: , 653267. |
[9] | Bharani KL , Ledreux A , Gilmore A , Carroll SL , Granholm A-C ((2020) ) Serum pro-BDNF levels correlate with phospho-tau staining in Alzheimer’s disease. Neurobiol Aging 87: , 49–59. |
[10] | Bangen KJ , Preis SR , Delano-Wood L , Wolf PA , Libon DJ , Bondi MW , Au R , DeCarli C , Brickman AM ((2018) ) Baseline white matter hyperintensities and hippocampal volume are associated with conversion from normal cognition to mild cognitive impairment in the Framingham Offspring Study. Alzheimer Dis Assoc Disord 32: , 50–56. |
[11] | Lee S , Viqar F , Zimmerman ME , Narkhede A , Tosto G , Benzinger TLS , Marcus DS , Fagan AM , Goate A , Fox NC , Cairns NJ , Holtzman DM , Buckles V , Ghetti B , McDade E , Martins RN , Saykin AJ , Masters CL , Ringman JM , Ryan NS , Förster S , Laske C , Schofield PR , Sperling RA , Salloway S , Correia S , Jack C , Weiner M , Bateman RJ , Morris JC , Mayeux R , Brickman AM , for the Dominantly Inherited Alzheimer Network ((2016) ) White matter hyperintensities are a core feature of Alzheimer’s disease: Evidence from the dominantly inherited Alzheimer network: White matter hyperintensities in familial AD. Ann Neurol 79: , 929–939. |
[12] | Prins ND , Scheltens P ((2015) ) White matter hyperintensities, cognitive impairment and dementia: An update. Nat Rev Neurol 11: , 157–165. |
[13] | Brickman AM , Zahodne LB , Guzman VA , Narkhede A , Meier IB , Griffith EY , Provenzano FA , Schupf N , Manly JJ , Stern Y ((2015) ) Reconsidering harbingers of dementia: Progression of parietal lobe white matter hyperintensities predicts Alzheimer’s disease incidence. Neurobiol Aging 36: , 27–32. |
[14] | Brickman AM , Provenzano FA , Muraskin J , Manly JJ , Blum S , Apa Z , Stern Y , Brown TR , Luchsinger JA , Mayeux R ((2012) ) Regional white matter hyperintensity volume, not hippocampal atrophy, predicts incident Alzheimer disease in the community. Arch Neurol 69: , 1621–1627. |
[15] | Wiegman AF , Meier IB , Provenzano FA , Schupf N , Manly JJ , Stern Y , Luchsinger JA , Brickman AM ((2013) ) Regional white matter hyperintensity volume and cognition predict death in a multiethnic, community cohort of older adults. J Am Geriatr Soc 61: , 2246–2248. |
[16] | Meier IB , Manly JJ , Provenzano FA , Louie KS , Wasserman BT , Griffith EY , Hector JT , Allocco E , Brickman AM ((2012) ) White matter predictors of cognitive functioning in older adults. J Int Neuropsychol Soc 18: , 414–427. |
[17] | Wardlaw JM , Valdés Hernández MC , Muñoz-Maniega S ((2015) ) What are white matter hyperintensities made of? Relevance tovascular cognitive impairment. J Am Heart Assoc 4: , e001140. |
[18] | Dalby RB , Elfving B , Poulsen PHP , Foldager L , Frandsen J , Videbech P , Rosenberg R ((2013) ) Plasma brain-derived neurotrophic factor and prefrontal white matter integrity in late-onset depression and normal aging. Acta Psychiatr Scand 128: , 387–396. |
[19] | Nooyens ACJ , Baan CA , Spijkerman AMW , Verschuren WMM ((2010) ) Type 2 diabetes and cognitive decline in middle-aged men and women: The Doetinchem Cohort Study. Diabetes Care 33: , 1964–1969. |
[20] | Szémán B , Nagy G , Varga T , Veres-Székely A , Sasvári M , Fitala D , Szöllosi A , Katonai R , Kotyuk E , Somogyi A ((2012) ) Changes in cognitive function in patients with diabetesmellitus. Orv Hetil 153: , 323–329. |
[21] | Bangen KJ , Werhane ML , Weigand AJ , Edmonds EC , Delano-Wood L , Thomas KR , Nation DA , Evangelista ND , Clark AL , Liu TT , Bondi MW ((2018) ) Reduced regional cerebral blood flow relates to poorer cognition in older adults with type 2 diabetes. Front Aging Neurosci 10: , 270. |
[22] | Passaro A , Dalla Nora E , Morieri ML , Soavi C , Sanz JM , Zurlo A , Fellin R , Zuliani G ((2015) ) Brain-derived neurotrophic factor plasma levels: Relationship with dementia and diabetes in the elderly population. J Gerontol A Biol Sci Med Sci 70: , 294–302. |
[23] | Rozanska O , Uruska A , Zozulinska-Ziolkiewicz D ((2020) ) Brain-derived neurotrophic factor and diabetes. Int J Mol Sci 21: , 841. |
[24] | Sheikh JI , Yesavage JA ((1986) ) Geriatric Depression Scale (GDS): Recent evidence and development of a shorter ver-sion. Clin Gerontol 5: , 165–173. |
[25] | Bondi MW , Edmonds EC , Jak AJ , Clark LR , Delano-Wood L , McDonald CR , Nation DA , Libon DJ , Au R , Galasko D ((2014) ) Neuropsychological criteria for mild cognitive impairment improves diagnostic precision, biomarker associations, and progression rates. J Alzheimers Dis 42: , 275–289. |
[26] | Li W , Risacher SL , Huang E , Saykin AJ Alzheimer’sDisease Neuroimaging Initiative ((2016) ) Type 2 diabetes mellitus is associated with brain atrophy and hypometabolism in the ADNI cohort. Neurology 87: , 595–600. |
[27] | Moran C , Beare R , Phan TG , Bruce DG , Callisaya ML , Srikanth V ((2015) ) Type 2 diabetes mellitus and biomarkers of neurodegeneration. Neurology 85: , 1123–1130. |
[28] | Weigand AJ , Thomas KR , Bangen KJ , Eglit GML , Delano-Wood L , Gilbert PE , Brickman AM , Bondi MW , for the Alzheimer’s Disease Neuroimaging Initiative ((2021) ) APOE interacts with tau PET to influence memory independently of amyloid PET in older adults without dementia. Alzheimers Dement 17: , 61–69. |
[29] | Jack CR Jr , Bernstein MA , Fox NC , Thompson P , Alexander G , Harvey D , Borowski B , Britson PJ , Whitwell L.J , Ward C ((2008) ) The Alzheimer’s Disease Neuroimaging Initiative (ADNI): MRI methods. J Magn Reson Imaging 27: , 685–691. |
[30] | Carmichael O ((2010) ) Longitudinal changes in white matter disease and cognition in the first year of the Alzheimer Disease Neuroimaging Initiative. Arch Neurol 67: , 1370. |
[31] | Schwarz C , Fletcher E , DeCarli C , Carmichael O ((2009) ) Fully-automated white matter hyperintensity detection with anatomical prior knowledge and without FLAIR. In Information Processing in Medical Imaging, Prince JL, Pham DL, Myers KJ, eds. Springer Berlin Heidelberg, Berlin, Heidelberg, pp. 239–251. |
[32] | Kochunov P , Lancaster JL , Thompson P , Woods R , Mazziotta J , Hardies J , Fox P ((2001) ) Regional spatial normalization: Toward an optimal target. J Comput Assist Tomogr 25: , 805–816. |
[33] | Rueckert D , Sonoda LI , Hayes C , Hill DL , Leach MO , Hawkes DJ ((1999) ) Nonrigid registration using free-form deformations: Application to breast MR images. IEEE Trans Med Imaging 18: , 712–721. |
[34] | Bangen KJ , Thomas KR , Weigand AJ , Sanchez DL , Delano-Wood L , Edmonds EC , Carmichael OT , Schwarz CG , Brickman AM , Bondi MW ((2020) ) Pattern of regional white matter hyperintensity volume in mild cognitive impairment subtypes and associations with decline in daily functioning. Neurobiol Aging 86: , 134–142. |
[35] | Krabbe KS , Nielsen AR , Krogh-Madsen R , Plomgaard P , Rasmussen P , Erikstrup C , Fischer CP , Lindegaard B , Petersen AMW , Taudorf S , Secher NH , Pilegaard H , Bruunsgaard H , Pedersen BK ((2007) ) Brain-derived neurotrophic factor (BDNF) and type 2 diabetes. Diabetologia 50: , 431–438. |
[36] | Zhen YF , Zhang J , Liu XY , Fang H , Tian LB , Zhou DH , Kosten TR , Zhang XY ((2013) ) Low BDNF is associated with cognitive deficits in patients with type 2 diabetes. Psychopharmacology (Berl) 227: , 93–100. |
[37] | Anita NZ , Zebarth J , Chan B , Wu C-Y , Syed T , Shahrul D , Nguyen MM , Pakosh M , Herrmann N , Lanctot KL ((2022) ) Inflammatory markers in type 2 diabetes with vs. without cognitive impairment; a systematic review and meta-analysis. Brain Behav Immun 100: , 55–69. |
[38] | Li B , Lang N , Cheng Z-F ((2016) ) Serum levels of brain-derived neurotrophic factor are associated with diabetes risk, complications, and obesity: A cohort study from Chinese patients with type 2 diabetes. Mol Neurobiol 53: , 5492–5499. |
[39] | Babaei P , Damirchi A , Mehdipoor M , Tehrani BS ((2014) ) Long term habitual exercise is associated with lower resting level of serum BDNF. Neurosci Lett 566: , 304–308. |
[40] | Brinkmann C , Schäfer L , Masoud M , Latsch J , Lay D , Bloch W , Brixius K ((2017) ) Effects of cycling and exergaming on neurotrophic factors in elderly type 2 diabetic men - a preliminary investigation. Exp Clin Endocrinol Diabetes 125: , 436–440. |
[41] | Miyamoto T , Hashimoto S , Yanamoto H , Ikawa M , Nakano Y , Sekiyama T , Kou K , Kashiwamura S-I , Takeda C , Fujioka H ((2018) ) Response of brain-derived neurotrophic factor to combining cognitive and physical exercise. Eur J Sport Sci 18: , 1119–1127. |
[42] | Golden E , Emiliano A , Maudsley S , Windham BG , Carlson OD , Egan JM , Driscoll I , Ferrucci L , Martin B , Mattson MP ((2010) ) Circulating brain-derived neurotrophic factor and indices of metabolic and cardiovascular health: Data from the Baltimore Longitudinal Study of Aging. PloS One 5: , e10099. |
[43] | Pikula A , Beiser AS , Chen TC , Preis SR , Vorgias D , DeCarli C , Au R , Kelly-Hayes M , Kase CS , Wolf PA ((2013) ) Serum brain–derived neurotrophic factor and vascular endothelial growth factor levels are associated with risk of stroke and vascular brain injury: Framingham study. Stroke 44: , 2768–2775. |
[44] | Mankovsky B , Zherdova N , Van Den Berg E , Biessels G , De Bresser J ((2018) ) Cognitive functioning and structural brain abnormalities in people with Type 2 diabetes mellitus. Diabet Med 35: , 1663–1670. |
[45] | Zhang J , Wang Y , Wang J , Zhou X , Shu N , Wang Y , Zhang Z ((2014) ) White matter integrity disruptions associated with cognitive impairments in type 2 diabetic patients. Diabetes 63: , 3596–3605. |
[46] | Van Elderen S , De Roos A , De Craen A , Westendorp R , Blauw G , Jukema J , Bollen E , Middelkoop H , Van Buchem M , Van Der Grond J ((2010) ) Progression of brain atrophy and cognitive decline in diabetes mellitus: A 3-year follow-up. Neurology 75: , 997–1002. |
[47] | Moran C , Phan TG , Chen J , Blizzard L , Beare R , Venn A , Munch G , Wood AG , Forbes J , Greenaway TM , Pearson S , Srikanth V ((2013) ) Brain atrophy in type 2 diabetes: Regional distribution and influence on cognition. Diabetes Care 36: , 4036–4042. |
[48] | Polacchini A , Metelli G , Francavilla R , Baj G , Florean M , Mascaretti LG , Tongiorgi E ((2015) ) A method for reproducible measurements of serum BDNF: Comonparis of the performance of six commercial assays. Sci Rep 5: , 17989. |
[49] | Polyakova M , Schlögl H , Sacher J , Schmidt-Kassow M , Kaiser J , Stumvoll M , Kratzsch J , Schroeter M ((2017) ) Stability of BDNF in human samples stored up to 6 months and correlations of serum and EDTA-plasma concentrations. Int J Mol Sci 18: , 1189. |
[50] | Ferreira ST ((2021) ) Brain insulin, insulin-like growth factor 1 and glucagon-like peptide 1 signalling in Alzheimer’s disease . J Neuroendocrinol 33: , e12959. |

