
An Operational Definition of ‘Abnormal Cognition’ to Optimize the Prediction of Progression to Dementia: What Are Optimal Cut-Off Points for Univariate and Multivariate Normative Comparisons?
Abstract
Background:
In neuropsychology and neurology, there is no consensus on the definition of abnormal cognition.
Objective:
To operationally define ‘abnormal cognition’ for optimally predicting progression to dementia in a memory clinic sample, and to test whether multivariate profile analysis of cognitive test results improves this prediction compared to standard clinical evaluation.
Methods:
We used longitudinal data from 835 non-demented patients of the Amsterdam Dementia Cohort. For 10 cognitive measures at baseline, we determined which number of abnormal tests and which magnitude of score deviations best predicted progression.
Results:
Predictive ability for progression to dementia of one, two, and three abnormal test scores out of 10 is highly similar (Cox hazard ratios: 3.7–4.1) provided cut-off values are adapted appropriately. Cut-offs have to be less stringent if the number of abnormal tests required increases: the optimal cut-off is z < –1.45 when one deviating score is required, z < –1.15 when two abnormal tests are required, and z < –0.70 when three abnormal tests are required. The profile analysis has similar predictive ability at the cut-off of p < 0.22 (hazard ratio 3.8). A likelihood ratio test showed that this analysis improves prediction of progression to dementia when added to standard clinical evaluation (p < 0.001).
Conclusion:
Abnormal cognition may be defined as one, two, or three abnormal test scores out of 10 if the magnitude of score deviations is adapted accordingly. An abnormal score profile predicts decline to dementia equally well, and improves the prediction when used complimentary to standard clinical evaluation.
INTRODUCTION
In clinical neuropsychology and neurology, there is no consensus on a single definition of abnormal cognition. Many definitions have been coined, such as benign senescent forgetfulness [1], age-associated memory impairment [2], cognitive impairment, no dementia [3], age-associated cognitive decline [4], and subtle cognitive decline [5]. Today, mild cognitive impairment (MCI) is probably the widest known concept [6, 7]. In the DSM-5 this corresponds to Minor Neurocognitive Disorder [8].
Apart from this lack of consensus on how to conceptually define abnormal cognition, an operational definition of abnormal cognition is complicated by some technical aspects. First, there is no consensus on the minimally required deviation of cognitive test scores (i.e., how many standard deviations [SD] below the mean). Typically, in the context of MCI, scores of –1.5 SD below the appropriate normative mean are considered abnormal, but some authoritative definitions consider scores below –1 SD abnormal [8–10]. In the broader context of clinical (neuro) psychology, scores either in the fifth percentile (corresponding to- 1.65 SD) and below, or in the second percentile (corresponding to –2 SD) and below, are thought to reflect impairment [11–13]. Second, there is no consensus on how many cognitive tests, or which proportion of the tests administered, should be abnormal to meet criteria for impairment. Moreover, the required number and magnitude of score deviations, are probably not independent. When one requires more deviating scores in order to classify a person as impaired, the magnitude of these score deviations can probably be smaller than when one requires only one abnormal score. This also depends on the number of tests administered.
In addition to the lack of consensus on conceptually and operationally defining abnormal cognition, there are additional issues that may complicate the interpretation of the neuropsychological examination. First, to evaluate test results, neuropsychologists generally use normative data published in test manuals. Each test has its own normative sample, which may vary in quality and the norms may not always be optimal for each age group. For example, norms for oldest patients are often lacking, some norms were collected decades ago, norms may not always be available in the patient’s language. Second, demographic variables such as age, sex, and level of education influence scores on cognitive tests and should be considered [12]. Not all published norms, however, allow correction for each of these variables. Third, because normative data are mostly collected for each test separately, correlations between tests are not taken into account. Thus, one cannot jointly evaluate scores of several tests. It is therefore impossible to formally judge whether score combinations are unusual. Often clinicians have an intuitive feeling for abnormalities in the cognitive profile, but formal evaluation of whether particular profiles of scores are normal or abnormal is impossible.
The Advanced Neuropsychological Diagnostics Infrastructure (ANDI, http://www.andi.nl) [14] introduces a new way of evaluating neuropsychological test results that solves many of these problems. ANDI consists of a large, representative, aggregated database with neuropsychological test data from over 24,000 healthy people. ANDI provides regression-based norms that are simultaneously corrected for all relevant demographic variables [15]. Moreover, ANDI has information on correlations between tests and therefore provides the possibility to evaluate the profile of test scores by multivariate normative comparison (MNC). This method is a more sensitive way to analyze neuropsychological tests results [16–18]. Using such a profile analysis enables the detection of subtle cognitive deficits that would go unnoticed in traditional analysis of neuropsychological test results [19, 20].
The first aim of the current study was to find the optimal combination of magnitude and number of abnormal scores in order to operationalize the definition of abnormal cognition. Our criterium was success to predict progression to dementia. That is, we examined which number of abnormal tests and which magnitude of score deviations at baseline best predicted progression to dementia. In doing so, we also included often used solutions, such as one abnormal score of 1.5 SD below the appropriate mean. Secondly, we investigated what cut-off score should be used for the multivariate profile analysis offered by ANDI in order to best predict progression to dementia. After the optimal cut-off scores had been determined, we investigated how well they predicted progression to dementia. Finally, we investigated whether the multivariate profile analysis can be used in standard clinical practice to better predict progression to dementia. In order to address these aims, we used neuropsychological data from memory clinic patients and normative data from the ANDI database.
MATERIALS AND METHODS
Patients
The patient data came from the Amsterdam Dementia Cohort [21]. The patients were referred by general practitioners and other health care professionals to Alzheimer center Amsterdam, Amsterdam UMC because of cognitive complaints. All patients had their baseline visit at this memory clinic between January 1993 and March 2016.
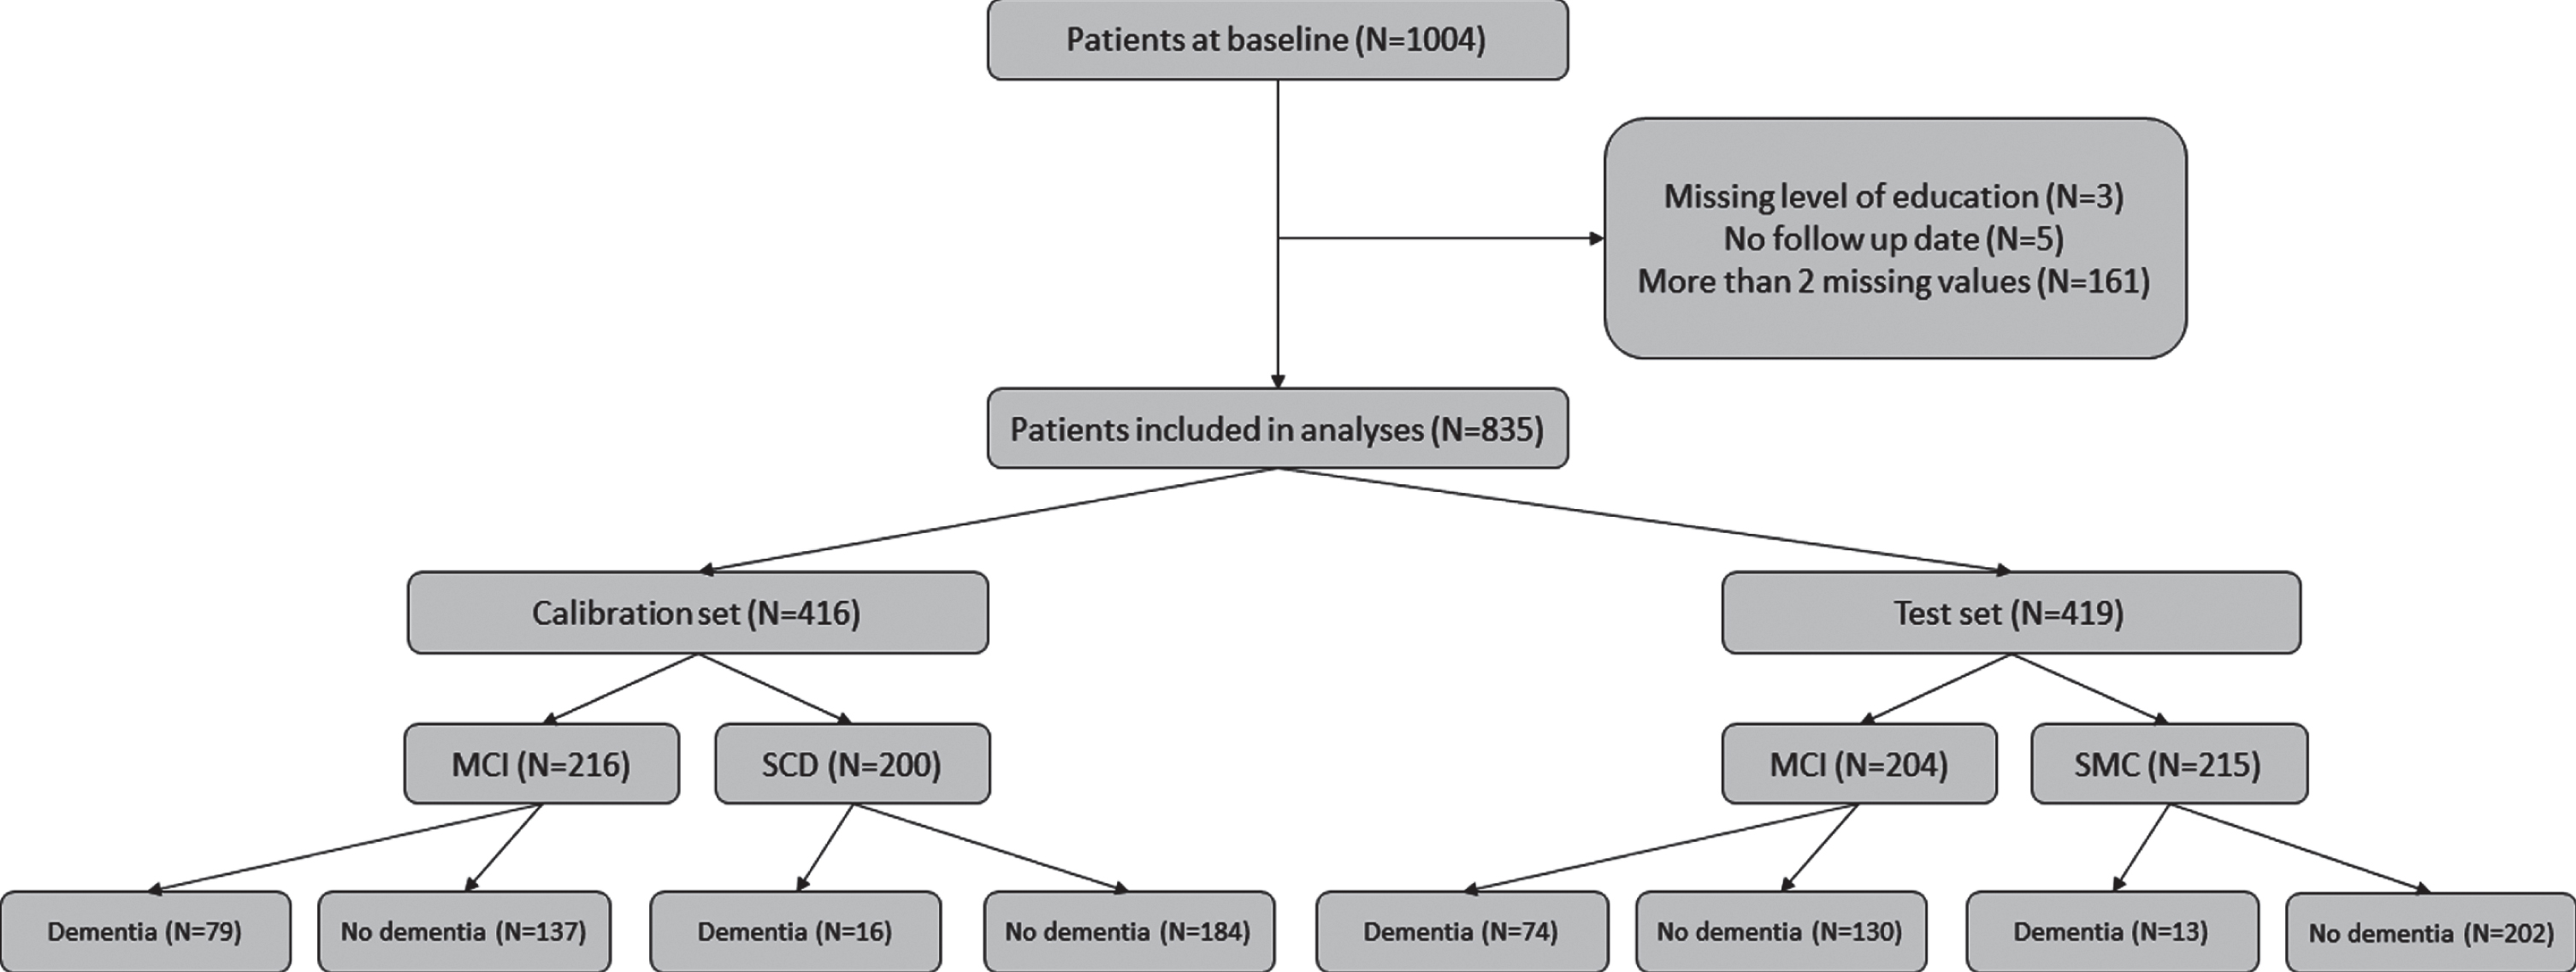
In total, 1,004 non-demented patients were considered for inclusion. Patients were excluded if they 1) had received a dementia diagnosis at baseline, 2) had not been followed-up, or 3) had more than one missing value on the cognitive test battery (see below). This left 835 patients for the current analysis (for an overview see Fig. 1). The mean age was 64.3 years (SD = 8.5, range 32–87) and 61% of the patients were male. The follow-up period ranged from 6 to 214 months (17 years) (median number of months was 28). The local ethical review board approved the study, and all patients provided informed consent for their clinical data to be used for research purposes.
Fig. 1
Flow chart describing the inclusion of patients and their progress to dementia over time.
Diagnostic procedures
The diagnostic work-up has been described in detail elsewhere [21]. In brief, for each patient it consisted of a medical and neurological evaluation by a neurologist, an assessment of vital functions, informant-based history, assessment of needs by a specialized dementia nurse, a neuropsychological examination, magnetic resonance imaging, and ancillary laboratory assessments. Each year, the patients were invited for a follow-up visit with a neurologist and a neuropsychologist. The diagnosis at baseline and at each follow-up visit was evaluated in a multidisciplinary consensus meeting.
Patients were labeled as MCI (N = 420), if they fulfilled the Petersen criteria [7] until 2012 and the NIA-AA criteria [9] from 2012 onwards. Patients were labeled as having subjective cognitive decline (SCD) (N = 415), when clinical investigations were normal and cognitive performance was within normal limits (i.e., criteria for MCI, dementia or psychiatric disorder not fulfilled [22]). These decisions were based on test score evaluations using conventional, published normative data, and on all other available information.
Dementia diagnosis
At follow-up, dementia due to AD was diagnosed according to the National Institute of Neurological and Communicative Disorders and Stroke and the Alzheimer’s Disease and Related Disorders Association criteria (until 2012) or NIA-AA criteria [23, 24]. Other forms of dementia were diagnosed according to consensus criteria [25–28]. For the current study, all forms of dementia were collapsed, so the main outcome measure was any type of dementia.
Materials
Neuropsychological tests
All neuropsychological tests that overlapped between the patient test battery and the ANDI database were used for the current analysis. As a screening tool for cognitive impairment, the Mini-Mental State Examination (MMSE) was used [29]. To assess memory, the Dutch version of the Rey Auditory Verbal Learning Test [30] immediate and delayed recall was used. To assess verbal fluency, category fluency (animals) and the Dutch version of the Controlled Word Association Test (letter fluency) were used [31]. For attention, the Trail Making Test part A [32] and Stroop color word test [33] color naming and word reading were used. For executive functioning, the Trail Making Test part B [32] and the Stroop color word test [33] interference condition were used. These six tests (10 test variables) were used in the current analysis. Note, however, that the total administered battery varied over the years and was flexible to some extent. That is, some patients received additional tests, and some received fewer or a different selection of tests, depending on what the neuropsychologist deemed necessary. In general, more tests were administered in the clinical assessment than were used in the current analysis.
ANDI normative control sample and profile of test scores
All scores in the ANDI database have been transformed to normality and standardized to demographically corrected z-scores, the matching corrections were applied to patients’ scores. A detailed overview of the ANDI data handling procedure can be found in de Vent et al. [14].
Supplementary Material 1 gives an overview of tests used in the current analyses and of the characteristics of the ANDI normative data.
Analyses
Univariate: Calibration of number and magnitude of score deviations
The first step was to operationally define ‘abnormal cognition’. We did this by determining both the number of tests that should be abnormal and the magnitude of the abnormality in order to optimize prediction of dementia at follow-up. We randomly split our data in two sets. In the first set (N = 416; calibration set), we selected the number and magnitude of deviations that best predicted dementia status at follow-up. In order to do so, we fitted Cox-regressions (proportional hazards regressions) [34] in which time from baseline to the event—diagnosis of dementia—was the dependent variable; dementia-free survival time was computed as number of days from baseline to the last follow-up without dementia. Age was included as a continuous covariate as the prevalence of dementia increases with age [35]. For each Cox-regression we varied the number of deviating test scores from 1 to 3 deviations (out of the 10 possible score deviations) and we varied the magnitude of the deviations in z-scores ranging from 0 to –3 (in 60 steps of 0.05). Thus, a total of 180 (3×60) combinations were evaluated. The combination with the best fit of the Cox-regression was the combination that best predicted dementia status at follow-up. Fit of the Cox-regression was evaluated using the concordance of the regression model [36]. The concordance (or c index) is a measure of predictive discrimination and is defined as the proportion of all patient pairs in which the predictions (patient will decline to dementia or not) and outcomes are concordant. A value of 0.5 indicates no predictive discrimination and a value of 1.0 indicates perfect separation of patients with different outcomes.
Multivariate: Calibration of magnitude of profile deviation
We also calibrated the MNC [16] by fitting Cox-regressions. Thus, we determined the magnitude of profile deviation best predicting progression to dementia. As the MNC-method gives a single test statistic that indicates whether or not a profile is abnormal, only the magnitude of the abnormal profile needed to be calibrated. An abnormal profile can be either positive (abnormally good) or negative (abnormally poor). Only the patients with a negatively deviating profile were considered as having abnormal cognition. This amounts to one-tailed statistical testing.
For the univariate analysis of number and magnitude of score deviations, deviation was defined per variable. For the current multivariate analysis, deviation is defined for all variables at the same time. Therefore, we took the p-value of negatively deviating profiles as the measure of abnormality and varied the p-value cut-off to discover what p-value leads to best prediction of progression to dementia. We examined cut-off p-values ranging from 0 to 1 (in 1000 steps of 0.001) to select the p-value that best predicted which patients would progress to dementia.
Predicting dementia status at follow up
After the best cut-off scores had been calibrated, the second half of the data (N = 419; test set) was used to test how well the univariate cognitive status (based on one test, two tests and three tests) and MNC-status predicted progression to dementia. Cox-regressions were conducted again with time from baseline to the event (diagnosis of dementia) as the dependent variable. The discrete independent variable was univariate cognitive status (based on one test, two tests and three tests) or the MNC status. Age was again included as a continuous covariate.
Diagnostic overlap
We also calculated Cohen’s kappa’s [37] in order to investigate whether each method labeled the same patients as having abnormal cognition (inter-rater reliability).
Adding profile analysis to standard clinical evaluation
Finally, we tested whether the MNC profile analysis could be used complimentary to standard clinical evaluation. We performed Cox-regression in a stepwise procedure. In the first step, the syndrome diagnosis (MCI or SCD) as acquired in standard clinical practice was used to predict time from baseline to the event (dementia). Age was included as a continuous covariate. In the second step, the patients’ MNC-status (normal or abnormal) was also included to see whether it had added value over the MCI status to predict progression to dementia. Added value was tested by means of a likelihood ratio test.
RESULTS
Progression to dementia
Over time, 182 of the 835 patients progressed to dementia. Of these, 133 had probable AD, five had possible AD, 10 had frontotemporal dementia, 20 had vascular dementia, six had dementia with Lewy bodies, and eight had a different type of dementia. Figure 1 gives an overview of the inclusion of patients.
Calibration of magnitude and number of test score deviations for univariate and multivariate analysis
The first step was to investigate how many abnormal scores there should be and how large they should be to best predict progression to dementia. For this calibration, a random half (calibration set) of the data was used (N = 416) (see Supplementary Material). One, two, and three abnormal scores all produced similar results in terms of how well they predicted decline to dementia at follow-up, as the highest concordance obtained in all three was around 0.70. However, the cut off points producing the best result differed. For one abnormal test (z = –1.45), we needed to be stricter than for two (z = –1.15) and three abnormal scores (z = –0.70), and for two we needed to be stricter than for three.
For the MNC status, the calibration showed a p-value of 0.22 (one-tailed) had to be selected as the best value to predict progression to dementia. Thus, patients were predicted to progress to dementia if they showed an abnormal test profile worse than that of the lowest scoring 22% of the healthy population.
Testing the prediction of progression to dementia
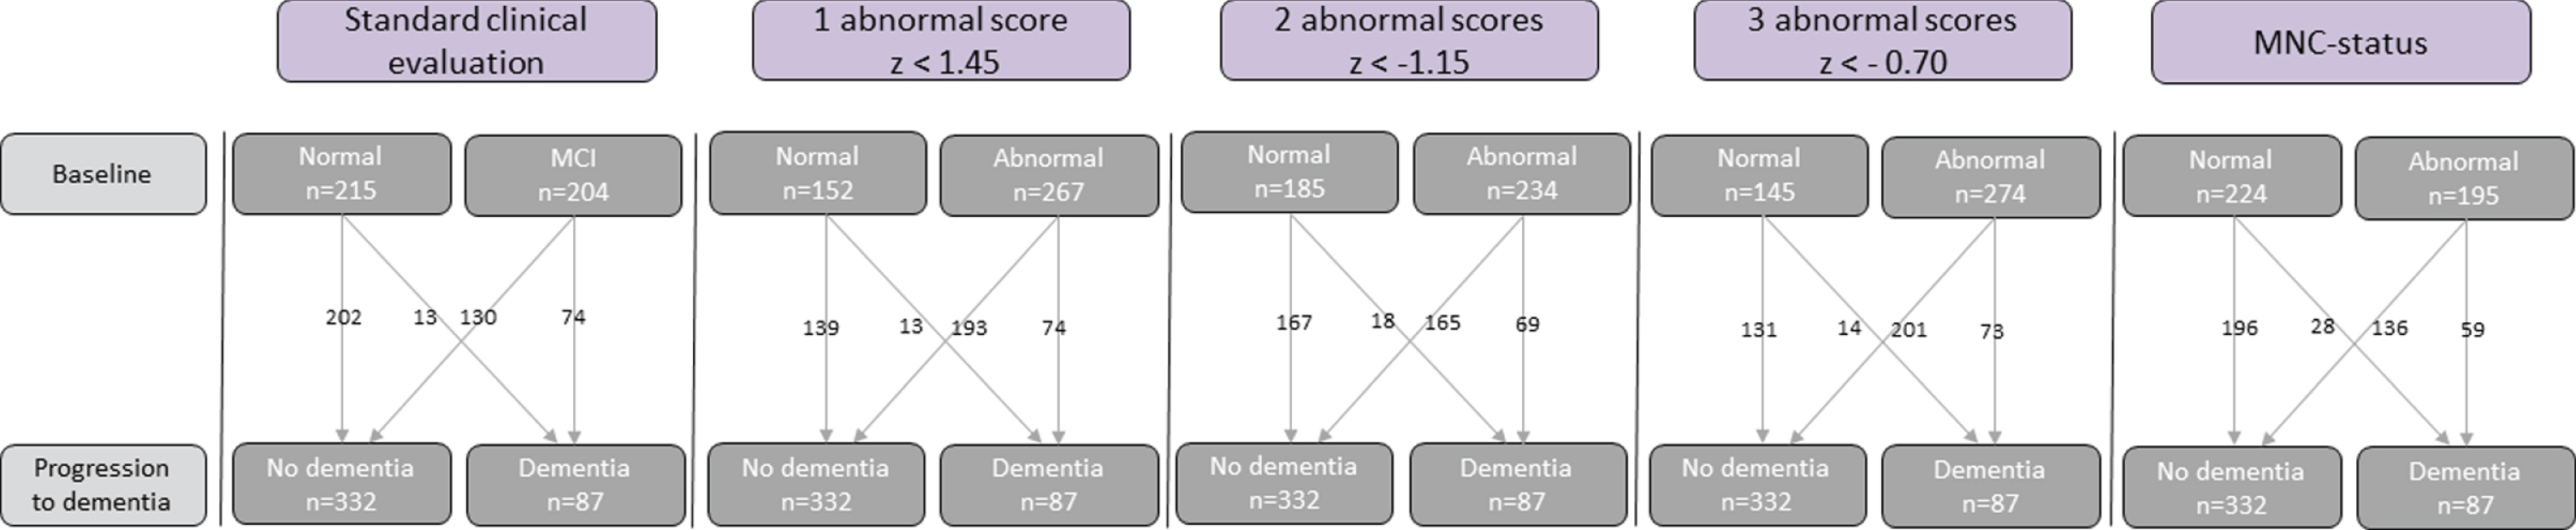
The second half of the data (the test set) (N = 419) was used to assign patients into cognitively normal and cognitively abnormal based on the univariate operationalizations of cognitively abnormal (one, two, and three abnormal scores) and MNC status. Table 1 gives an overview of characteristics of subgroups determined according to each method. Figure 2 gives an overview of progression to dementia for each method.
Table 1
Demographic and clinical characteristics of the three groups, MCI (established by standard clinical evaluation), univariate cognitive status based on 1, 2 or 3 abnormal scores, or by MNC status
| Standard clinical evaluation | 1 abnormal score z < 1.45 | 2 abnormal scores z< –1.15 | 3 abnormal scores z< –0.70 | MNC status | ||||||
| Normal cognition | MCI | Normal cognition | Abnormal cognition | Normal cognition | Abnormal cognition | Normal cognition | Abnormal cognition | Normal MNC-status | Abnormal MNC-status | |
| N = 215 | N = 204 | N = 152 | N = 267 | N = 185 | N = 234 | N = 145 | N = 274 | N = 224 | N = 195 | |
| (51.3%) | (48.7%) | (36.3%) | (62.7%) | (44.2%) | (55.8%) | (34.6%) | (65.4) | (53.5%) | (46.5%) | |
| Age (SD) | 62.4 (8.8) | 67.1 (7.1) | 63.9 (7.7) | 65.1 (8.7) | 63.9 (8.0) | 65.3 (8.6) | 64.0 (7.8) | 65.0 (8.6) | 64.4 (7.9) | 65.0 (8.8) |
| Sex M/F | 130/85 | 140/64 | 96/56 | 174/93 | 123/62 | 147/87 | 89/56 | 181/93 | 149/75 | 121/74 |
| MMSE | 28.5 (1.3) | 27.1 (1.7) | 28.3 (1.2) | 27.4 (1.8) | 28.4 (1.3) | 27.3 (1.8) | 28.6 (1.3) | 27.4 (1.7) | 28.3 (1.3) | 27.2 (1.8) |
| RAVLT-total | 40.4 (8.9) | 31.0 (7.3) | 41.9 (8.5) | 32.3 (8.1) | 40.8 (8.8) | 31.9 (8.0) | 41.9 (9.0) | 32.6 (8.0) | 39.3 (9.3) | 31.8 (7.9) |
| RAVLT-delayed | 8.1 (2.9) | 3.8 (2.7) | 8.6 (2.6) | 4.5 (3.1) | 8.0 (3.1) | 4.4 (3.0) | 8.3 (3.2) | 4.8 (3.1) | 7.7 (3.0) | 4.1 (3.1) |
| Animal fluency | 22.2 (5.4) | 18.6 (4.7) | 23.4 (5.0) | 18.7 (4.8) | 23.3 (5.1) | 18.1 (4.4) | 23.9 (9.7) | 18.6 (4.7) | 22.2 (5.3) | 18.4 (4.6) |
| COWAT | 35.8 (11.0) | 32.9 (11.6) | 39.5 (9.8) | 31.9 (11.5) | 38.8 (10.4) | 30.8 (10.9) | 39.4 (9.7) | 31.7 (11.3) | 36.6 (10.5) | 31.7 (11.8) |
| TMTa | 39.1 (13.9) | 46.0 (17.5) | 35.6 (10.7) | 46.4 (17.4) | 35.9 (10.5) | 47.6 (17.8) | 34.9 (9.8) | 46.4 (17.3) | 37.5 (11.2) | 48.2 (18.8) |
| TMTb | 89.6 (35.2) | 129.6 (64.6) | 83.9 (26.2) | 123.4 (62.1) | 85.2 (26.5) | 127.8 (64.3) | 83.6 (30.3) | 122.5 (60.6) | 89.6 (31.4) | 131.7 (67.3) |
| Stroop-words | 47.2 (11.9) | 48.5 (10.5) | 43.6 (5.6) | 50.2 (12.9) | 43.5 (5.5) | 51.3 (13.3) | 42.3 (4.6) | 50.8 (12.6) | 44.9 (6.1) | 51.2 (14.1) |
| Stroop-colors | 64.4 (15.1) | 68.0 (15.5) | 59.2 (8.5) | 70.2 (17.0) | 59.3 (8.3) | 71.7 (17.4) | 57.6 (8.2) | 70.7 (16.4) | 60.9 (9.2) | 72.3 (18.5) |
| Stroop-col.word | 108.5 (29.2) | 128.5 (41.2) | 100.0 (18.4) | 128.7 (41.4) | 100.9 (21.7) | 132.0 (41.4) | 98.3 (21.8) | 128.8 (39.6) | 103.0 (21.5) | 135.8 (43.7) |
MMSE, Mini-Mental State Examination; RAVLT, Rey Auditory Verbal Learning Test; COWAT, Controlled Oral Word Association Test; TMT, Trail Making Test; Stroop, Stroop Color-Word Test.
Fig. 2
Classification of cognition by the five indicators of abnormal cognition: Conventional-MCI diagnosis, univariate cognitive status based on 1, 2, or 3 abnormal scores, and MNC status.
To test how well the univariate cognitive status (one, two, and three abnormal scores) and MNC status predicted progression to dementia, the same Cox-regressions (with age as a covariate) were conducted. An overview of the results can be found in Table 2.
Table 2
Hazard ratios, their confidence intervals, c-index, and p-values of the survival analysis. The models have been corrected for age
| Factor | Hazard Ratio | 95% CI | c-index | p |
| 1 abnormal score, cut-off z < –1.45 | 4.13 | 2.28–7.47 | 0.70 | <0.001 |
| 2 abnormal score, cut-off z < –1.15 | 3.68 | 2.17–6.24 | 0.70 | <0.001 |
| 3 abnormal score, cut-off z < –0.70 | 4.02 | 2.26–7.16 | 0.73 | <0.001 |
| MNC status, cut-off p < 0.22 | 3.77 | 2.39–5.97 | 0.72 | <0.001 |
Univariate cognitive status
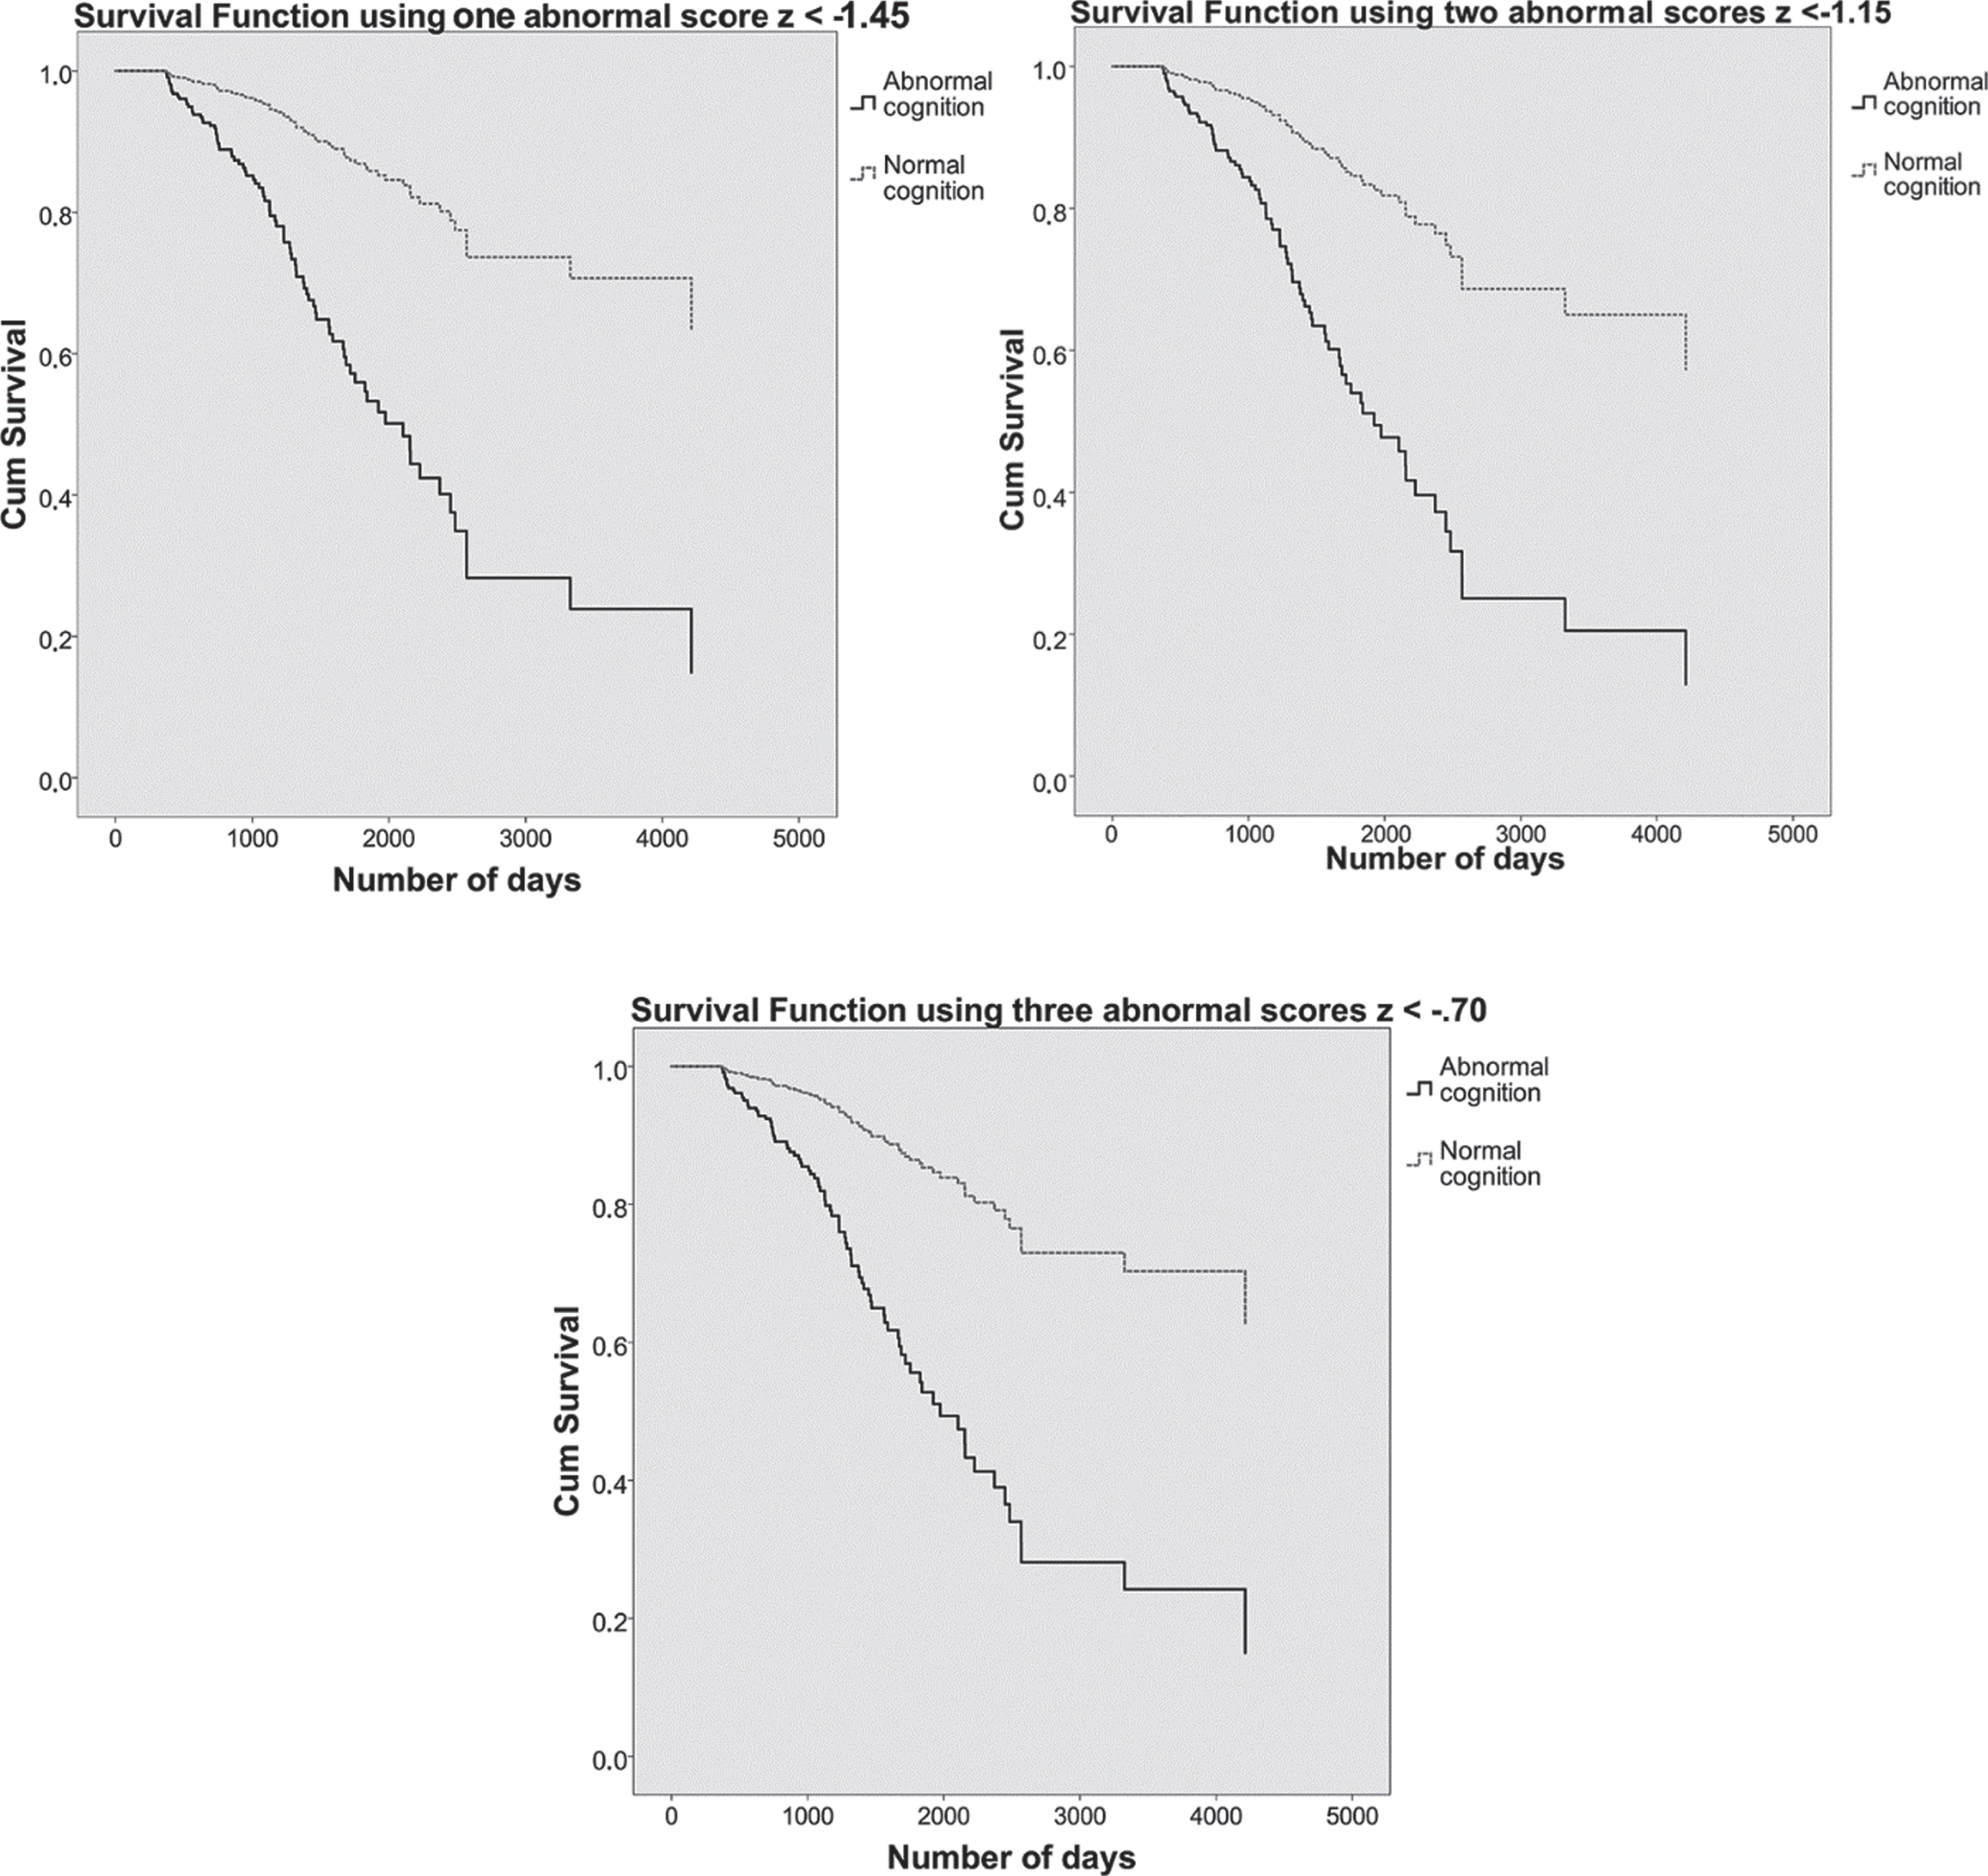
Because the 1, 2, and 3 abnormal scores predicted progression to dementia about equally well in the calibration process, we evaluated all three. Using one abnormal score of z < –1.45, two abnormal scores of z < –1.15, or three abnormal scores of z < –0.70, showed that patients with abnormal cognition were about four times as likely to have a dementia diagnosis at follow up compared to patients with normal cognition. Figure 3 shows the survival curves for each of the three univariate methods.
Fig. 3
On the top left, the survival curves using one abnormal score of z < –1.45 are plotted. On the top right, the survival curves using two abnormal scores of z < –1.15. Below, the survival curves using three abnormal scores of z < –0.70. Patients with normal cognition are shown in dashed grey lines and patients with abnormal cognition in solid black lines. The y-axis shows cumulative (dementia free) survival across time, number of days participated is plotted on the x-axis.
MNC status
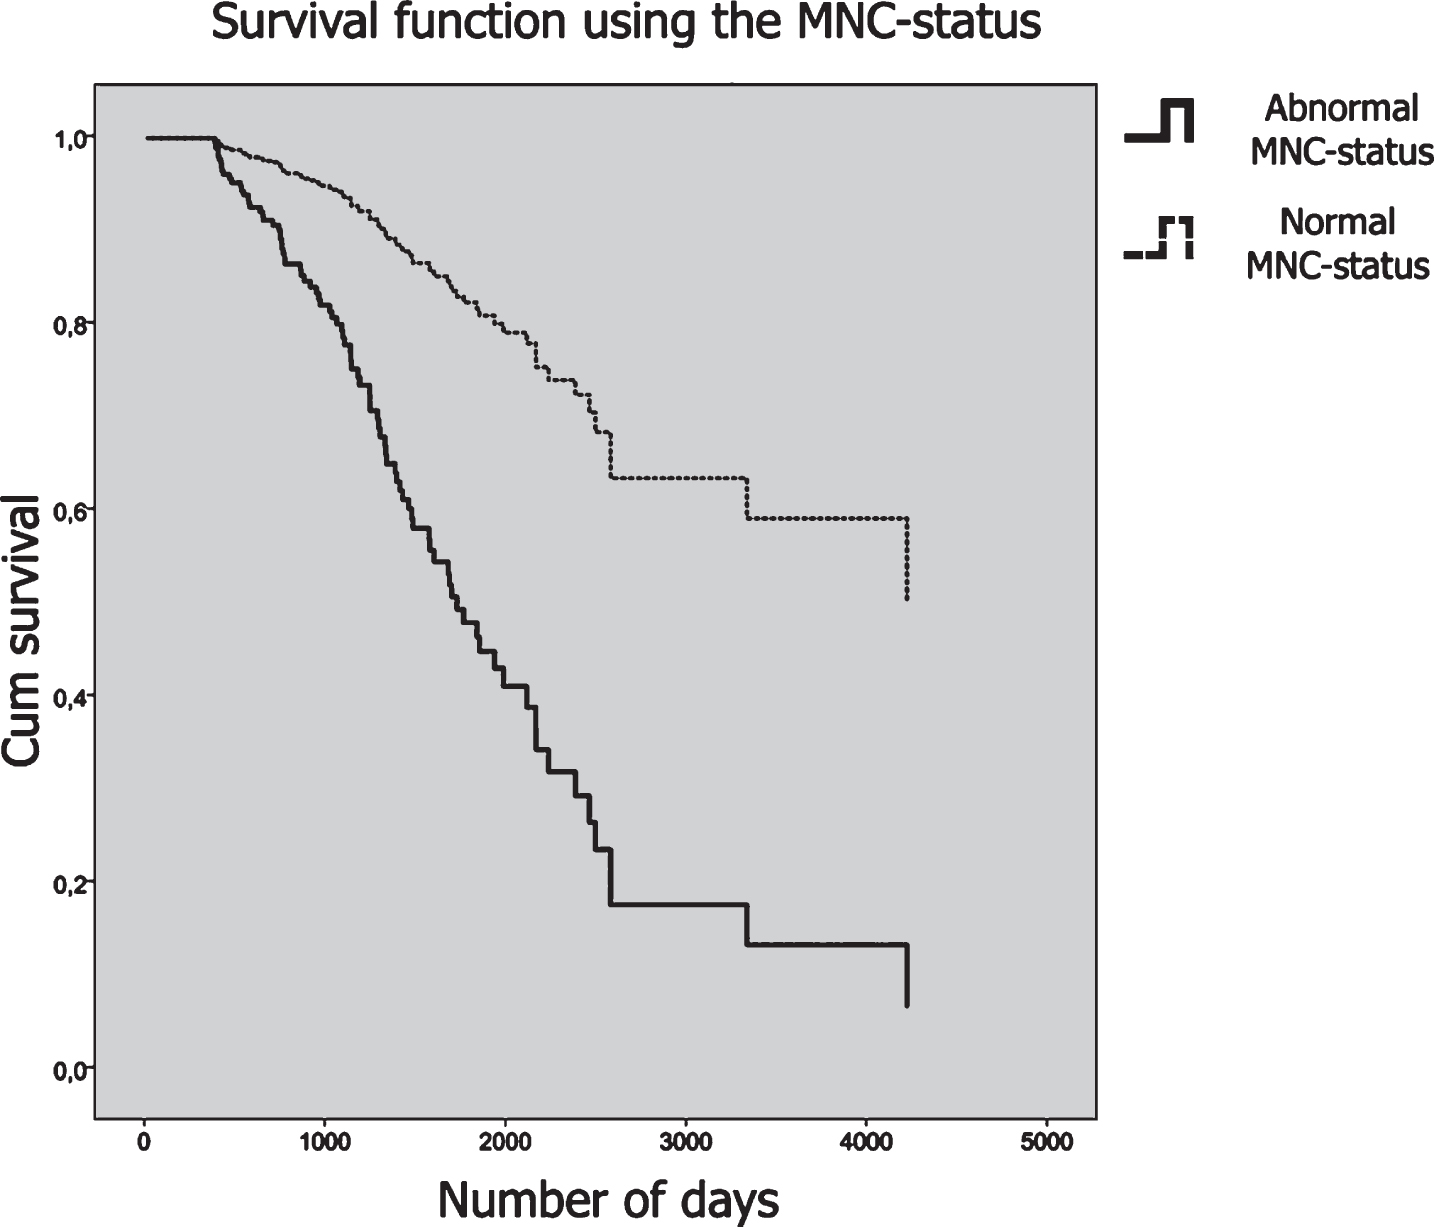
The MNC profile analysis showed that when using the optimum cut-off score of p < 0.22, patients with an abnormal profile were almost 4 times as likely to have a dementia status at follow-up. Figure 4 shows the survival curves plotted for the MNC status.
Fig. 4
Survival curves plotted for the MNC status. Patients who had an abnormal MNC-status are plotted in a solid line, and patients with a normal MNC-status are plotted in a dashed line. The y-axis shows cumulative survival across time and the number of days is plotted on the x-axis.
Diagnostic overlap
In order to examine whether each method labeled the same individuals as having abnormal cognition, Cohen’s kappa’s [37] were calculated, which can be found in Supplementary Material 3. There was substantial agreement between the MNC and using 1 abnormal score (cut-off z < –1.45) and 2 abnormal scores (cut-off z < –1.15). There was moderate agreement between using the MNC profile analysis and using 3 abnormal scores with a cut-off score of z < –0.70 [38].
Added value of the MNC status to MCI status.
Finally, we evaluated whether the MNC profile analysis would add to the predictive value of the clinical evaluation (i.e., MCI versus SCD syndrome diagnosis). To this end, likelihood ratio tests were performed. Block 1 consisted of the syndrome diagnosis (MCI/SCD) and age as predictors of progression to dementia. In the second block we added the MNC status (i.e., normal or abnormal profile based on p < 0.22). Adding the MNC status improved the prediction of the conventional MCI diagnosis (χ²(1) = 13.45, p < 0.001). This means that the MNC status adds unique information about the patient on top of the MCI status and increases the ability to predict dementia at follow-up.
DISCUSSION
In the current study we evaluated how ‘abnormal cognition’ should be defined (based on neuropsychological test results) in order to best predict progression to dementia. We did so in a large group of non-demented patients who were diagnosed and followed in an academic memory clinic. We used the Advanced Neuropsychological Diagnostics Infrastructure (ANDI), which allows comparison of each patient to a large representative normative sample (with corrections for age, sex, and level of education) while circumventing problems typically found in neuropsychological practice (outdated norms, no reference data for the old-old, interpretation changes when shifting age groups). During the calibration process we found that when evaluating 10 neuropsychological test measures, the best cut-off for one abnormal score (out of ten test scores) was z < –1.45, for two abnormal scores z < –1.15, and for three abnormal scores z < –0.70. The method of MNC predicted decline to dementia best at a cut-off of p < 0.22. When testing these cut-off points, we found that they all performed similarly well. Patients who had abnormal cognition by one of these definitions were about four times as likely to progress to dementia compared to the patients who had normal cognition. There was a good agreement between these definitions of abnormal cognition. We also found that even though we used different criteria (one, two, three abnormal test results or abnormal cognitive profile based on the MNC), mostly the same individuals were diagnosed as having abnormal cognition.
Finally, we found that adding the MNC profile analysis to a standard clinical evaluation (i.e., MCI diagnosis) led to a better prediction of which patients would progress to dementia.
The MNC profile analysis predicted similarly well as the univariate criterion methods (one, two, or three abnormal scores). Our optimal cut-off score p < 0.22 (one-tailed) was far more lenient than when an equivalent of –1.5 SD, i.e., a p-value of <0.067 (one-tailed), would be used. This implies that when one looks at a patient’s entire profile, certain combinations of small abnormalities may already predict progression to dementia. It also shows that we are far too strict when we use the popular one-tailed p value of <0.05. This would lead to an unnecessarily poor detection of abnormal cognition. Note, however, that when using the MNC profile analysis, it is important to keep in mind which patient population we are assessing. A conventional choice of 0.05 (one-tailed) should probably be used when investigating a population in which cognitive deficits are not a priori expected, for example, when a sample from the general population is screened. But when looking at a group of people with cognitive complaints who present at a clinic because of these complaints, the a priori chances of having some form of cognitive deficit is higher. How much higher is something worth investigating empirically, as we did in our current study. We found that for these memory clinic patients, a rather high p-value (0.22 one-tailed) results in the best predictive power. Note that this is a one-tailed p-value, implying that the patients, who are abnormal by this criterion, show a score profile that is worse than that of the 22% of cognitively normal persons with the most negatively deviating profiles.
This study is not the first that aimed at improving the criteria used to define abnormal cognition. Most previous definitions are consensus criteria based on expert opinions. The current study adds to this body of work by providing empirically derived cut-off points. Our results show that the criteria that have been used in the field thus far are justifiable. That is, scores –1.5 SD below the appropriate normative mean, or between –1 and –2 SD are justly considered abnormal [8–10]. However, our results show that this is the case when one abnormal score out of 10 is used (z < 1.45). When more abnormal scores (two or three) are required, the magnitude of the deviation should be less strict. Thus, if the number of required deviating scores varies, the magnitude of the deviations should be adjusted accordingly (few abnormal scores require large magnitude of deviations and vice versa).
Bondi et al. [39] also proposed an improved definition of abnormal cognition that outperformed conventional MCI criteria in predicting which patients would decline to Alzheimer’s type dementia. They used six neuropsychological measures and defined abnormal cognition as either 1) two measures one SD below the age-corrected mean in one cognitive domain, or 2) one such abnormal score in each of three cognitive domains, or 3) as functional dependence (but not as much as to qualify for a dementia diagnosis). Adding a functional dependence measure, for example the cognitive functional composite (CFC) questionnaire [40] creates the benefit of finding individuals who are already compromised in their daily lives and thus will decline to dementia more quickly. We, however, were looking for a way to detect cognitive abnormality at an earlier stage (before functional deterioration sets in). Bondi and colleagues used a cut-off score of –1 SD on two tests in one domain. This criterion is corroborated by the current results, as we found that for two abnormal scores, a cut-off score of z < 1.15 gave the best prediction when considering two subnormal scores. For three scores, Bondi and colleagues also used –1 SD as a cut-off score. Our results indicate that in this case a z-value < –0.70 may be better.
We investigated whether the MNC profile analysis might be useful as an addition to a standard clinical evaluation. A patient might have an abnormal profile without any abnormal test scores. Thus, over and above a conventional MCI diagnosis, information about the patient’s cognitive profile is a valuable addition for predicting whether the patient will progress to dementia and will bolster the experience-based insights clinicians already use in their assessments.
This study has some limitations. First, the proportion of individuals labelled as cognitively abnormal depends on the number of tests used. We included 10 test variables. We would like to stress that the optimal cut-off values may be different when a test battery with, say, 5, 15, or 20 test variables is applied. Second, because only a few tests were used, not all relevant cognitive domains were assessed (for example, language tests were not included). Third, more neuropsychological tests were used in establishing MCI than were used in establishing the MNC-status (as only the tests that overlapped between the patient battery and the ANDI database could be used). For future research it would be worthwhile to set up a study that evaluates the MNC-status with the same tests that were used for the conventional diagnostic procedure. Fourth, the mean age of the patient population was 64 years, which is quite young for a dementia cohort. There were more men (64%) than women, which is also not typical for the dementia population. This is due to the fact that these patients were recruited in an academic hospital specializing in early onset dementia. Moreover, the patients were not demented (at baseline). Therefore, the findings of our study might not be representative for the dementia population as a whole and should be replicated in older samples and in samples with more women. Fifth our findings may be specific for the setting of a memory clinic of an academic hospital. Further research should investigate whether the cut-offs fount in this sample are also feasible for other community-based cohorts. Sixth, we did not investigate different types of dementia. It would be worthwhile for future studies to specifically look at particular dementia types. Finally, we focused only on neuropsychological assessment and did not use neurochemical and neuroimaging biomarkers as predictors. Since combining various types of biomarkers is a powerful strategy of predicting progression to [41–44], a future study may extend the current results by incorporating these predictors as well.
In conclusion, when evaluating neuropsychological test results, abnormal cognition can be defined as having either one, two, or three abnormal scores as long as the magnitude of the score deviations is adjusted accordingly. This means that when only one abnormal score is required the magnitude of this abnormality needs to be larger compared to two or three abnormal test scores. Using a multivariate profile analysis gives additional information about cognition even when a patient already satisfies the conventional MCI criteria. This profile analysis can, thus, further improve the prediction of progression to dementia.
ACKNOWLEDGMENTS
This study and the construction of the ANDI database was financed by The Netherlands (NWO) (grant number MaGW 480-12-015). Patient data were collected at Alzheimer Center Amsterdam which is part of the neurodegeneration research program of the Neuroscience Campus Amsterdam. Alzheimer Center Amsterdam is supported by Stichting Alzheimer Nederland and Stichting VUmc fonds. WvdF holds the Pasman chair.
Authors’ disclosures available online (https://www.j-alz.com/manuscript-disclosures/20-0811r1).
SUPPLEMENTARY MATERIAL
[1] The supplementary material is available in the electronic version of this article: https://dx.doi.org/10.3233/JAD-200811.
REFERENCES
[1] | Kral VA ((1962) ) Senescent forgetfulness: Benign and malignant. Can Med Assoc J 86: , 257–260. |
[2] | Crook T , Bartus RT , Ferris SH , Whitehouse P , Cohen GD , Gershon S ((1986) ) Age-associated memory impairment: Proposed diagnostic criteria and measures of clinical change—report of a national institute of mental health work group. Dev Neuropsychol 2: , 261–276. |
[3] | Graham JE , Rockwood K , Beattie BL , Eastwood R , Gauthier S , Tuokko H , McDowell I ((1997) ) Prevalence and severity of cognitive impairment with and without dementia in an elderly population. Lancet 349: , 1793–1796. |
[4] | Levy R ((1994) ) Aging-associated cognitive decline. Psychoger 6: , 63–68. |
[5] | Edmonds EC , Weigand AJ , Thomas KR , Eppig J , Delano-Wood L , Galasko DR , Salmon DP , Bondi MW ((2018) ) Increasing inaccuracy of self-reported subjective cognitive complaints over 24 months in empirically derived subtypes of mild cognitive impairment. J Int Neuropsychol Soc 24: , 842–853. |
[6] | Flicker C , Ferris SH , Reisberg B ((1991) ) Mild cognitive impairment in the elderly: Predictors of dementia. Neurology 41: , 1006–1009. |
[7] | Petersen RC , Smith GE , Waring SC , Ivnik RJ , Tangalos EG , Kokmen E ((1999) ) Mild cognitive impairment: Clinical characterization and outcome. Arch Neurol 56: , 303–308. |
[8] | American Psychiatric Association ((2013) ) Diagnostic and statisticalmanual ofmental disorders (DSM-5®). American Psychiatric Publishing, Washington, DC. |
[9] | Albert MS , DeKosky ST , Dickson D , Dubois B , Feldman HH , Fox NC , Gamst A , Holtzman DM , Jagust WJ , Petersen RC , Snyder PJ , Carrilo MC , Thies B , Phelps CH ((2011) ) The diagnosis of mild cognitive impairment due to Alzheimer’s disease: Recommendations from the National Institute on Aging-Alzheimer’s Association workgroups on diagnostic guidelines for Alzheimer’s disease. Dement 7: , 270–279. |
[10] | Petersen RC , Morris JC ((2005) ) Mild cognitive impairment as a clinical entity and treatment target. Arch Neurol 62: , 1160–1163. |
[11] | Strauss E , Sherman EM , Spreen O ((2006) ) A compendium of neuropsychological tests: Administration, norms, and commentary. American Chemical Society. |
[12] | Lezak MD , Howieson DB , Bigler ED , Tranel D ((2012) ) Neuropsychological assessment (5th ed.). Oxford University Press, New York, NY. |
[13] | Bigler ED ((2012) ) Symptom validity testing, effort, and neuropsychological assessment. J Int Neuropsychol Soc 18: , 632–640. |
[14] | de Vent NR , Agelink van Rentergem JA , Schmand BA , Murre JM ; ANDI Consortium, Huizenga HM ((2016) ) Advanced Neuropsychological Diagnostics Infrastructure (ANDI): A normative database created from control datasets. Front Psychol 7: , 1601. |
[15] | Testa SM , Winicki JM , Pearlson GD , Gordon B , Schretlen DJ ((2009) ) Accounting for estimated IQ in neuropsychological test performance with regression-based techniques. J Int Neuropsychol Soc 15: , 1012–1022. |
[16] | Huizenga HM , Smeding H , Grasman RP , Schmand B ((2007) ) Multivariate normative comparisons. Neuropsychologia 45: , 2534–2542. |
[17] | Agelink van Rentergem JAA , Murre JM , Huizenga HM ((2017) ) Multivariate normative comparisons using an aggregated database. PLOS One 12: , e0173218. |
[18] | Agelink van Rentergem JA , de Vent NR , Schmand BA , Murre JM , Huizenga HM ((2018) ) Multivariate normative comparisons for neuropsychological assessment by a multilevel factor structure or multiple imputation approach. Assess 30: , 436–449. |
[19] | van Rentergem JA , de Vent NR , Huizenga HM , Murre JMJ , Schmand BA ((2019) ) Predicting progression to Parkinson’s disease dementia using multivariate normative comparisons. J Int Neuropsychol Soc 25: , 678–687. |
[20] | Su T , Schouten J , Geurtsen GJ , Wit FW , Stolte IG , Prins M , Portegies P , Caan MWA , Reiss P , Majoie CB , Schmand BA ((2015) ) Multivariate normative comparison, a novel method for more reliably detecting cognitive impairment in HIV infection. AIDS 29: , 547–557. |
[21] | Van Der Flier WM , Scheltens P ((2018) ) Amsterdam dementia cohort: Performing research to optimize care. J Alzheimers Dis 62: , 1091–1111. |
[22] | Jessen F , Amariglio RE , van Boxtel M , Breteler M , Ceccaldi M , Chételat G , Dubois B , Dufouil C , Ellis KA , van der Flier WM , Glodzik L , van Harten AC , de Leon MJ , McHugh P , Mielke MM , Molinuevo JL , Mosconi L , Osorio RS , Perrotin A , Petersen RC , Rabin LA , Rami L , Reisberg B , Rentz DM , Sachdev PS , de la Sayette V , Saykin AJ , Scheltens P , Shulman MB , Slavin MJ , Sperling RA , Stewart R , Uspenskaya O , Vellas B , Visser PJ , Wagner M ; Subjective Cognitive Decline Initiative (SCD-I) Working Group ((2014) ) A conceptual framework for research on subjective cognitive decline in preclinical Alzheimer’s disease. Dement 10: , 844–852. |
[23] | Dubois B , Feldman HH , Jacova C , DeKosky ST , Barberger-Gateau P , Cummings J , Delacourte A , Galasko D , Gauthier S , Jicha G , Merugo K , O’Brien J , Pasquier F , Robert P , Rossor M , Salloway S , Stern Y , Visser PJ , Scheltens P ((2007) ) Research criteria for the diagnosis of Alzheimer’s disease: Revising the NINCDS–ADRDA criteria. Lancet Neurol 6: , 734–746. |
[24] | McKhann GM , Knopman DS , Chertkow H , Hyman BT , Jack CR , Kawas CH , Klunk WE , Koroshetz WJ , Manly JJ , Mayeux R , Mohs RC , Morris JC , Rossor MN , Scheltens P , Carrillo MC , Thies B , Weintraub S , Phelps CH ((2011) ) The diagnosis of dementia due to Alzheimer’s disease: Recommendations from the National Institute on Aging-Alzheimer’s Association workgroups on diagnostic guidelines for Alzheimer’s disease. Dement 7: , 263–269. |
[25] | Román GC , Tatemichi TK , Erkinjuntti T , Cummings JL , Masdeu JC , Garcia JA , Amaducci L , Orgogozo JM , Hofman A , Moody DM , O’Brien MD , Yamaguchi T , Grafman J , Drayer BP , Bennett DA , Fischer M , Ogata J , Kokmen E , Bermejo F , Wolf PA , Gorelick PB , Blick KL , Pajeau AK , Bell MA , DeCarli C , Culebras A , Korczyn AD , Bogousslavsky J , Hartmann A , Scheinberg ((1993) ) Vascular dementia diagnostic criteria for research studies: Report of the NINDS-AIREN International Workshop. Neurology 43: , 250–250. |
[26] | Neary D , Snowden JS , Gustafson L , Passant U , Stuss D , Black SASA , Freedman M , Kertesz A , Robert PH , Albert M , Boone K , Miller BL , Cummings J , Benson DF ((1998) ) Frontotemporal lobar degeneration: A consensus on clinical diagnostic criteria. Neurology 51: , 1546–1554. |
[27] | McKeith IG , Dickson DW , Lowe J , Emre M , O’brien JT , Feldman H , Cummings J , Duda JE , Lippa C , Perry EK , Aarsland D , Arai H , Ballard CG , Boeve B , Burn DJ , Costa D , Del Ser T , Dubois B , Galasko D , Gauthier S , Goetz CG , Gomez-Tortosa E , Halliday G , Hansen LA , Hardy J , Iwatsubo T , Kalaria RN , Kaufer D , Kenny RA , Korczyn A , Kosaka K , Lee VMY , Lees A , Litvan I , Londos E , Lopez OL , Minoshima S , Mizuno Y , Molina JA , Mukaetova-Ladinska EB , Pasquier F , Perry RH , Schulz JB , Trojanowski JQ , Yamada M ((2005) ) Diagnosis and management of dementia with Lewy bodies third report of the DLB consortium. Neurology 65: , 1863–1872. |
[28] | Rascovsky K , Hodges JR , Knopman D , Mendez MF , Kramer JH , Neuhaus J , van Swieten JC , Seelaar H , Dopper EGP , Onyike CU , Hillis AE , Josephs KA , Boeve BF , Kertesz A , Seeley WW , Rankin KP , Johnson JK , Gorno-Tempini ML , Rosen H , Prioleau-Latham CE , Lee A , Kipps CM , Lillo P , Piguet O , Rohrer JD , Rossor MN , Warren JD , Fox NC , Galasko D , Salmon DP , Black SE , Mesulam M , Weintraub S , Dickerson BC , Diehl-Schmid J , Pasquier F , Deramecourt V , Lebet F , Pijnenburg Y , Chow TW , Manes F , Grafman J , Cappa SF , Freedman M , Grossman M , Miller BL ((2011) ) Sensitivity of revised diagnostic criteria for the behavioural variant of frontotemporal dementia. Brain 134: , 2456–2477. |
[29] | Folstein MF , Folstein SE , McHugh PR ((1975) ) “Mini-mental state”: A practical method for grading the cognitive state of patients for the clinician. J Psychiatr Res 12: , 189–198. |
[30] | Rey A ((1964) ) L’examen clinique en psychologie. Presses Universitaires de France, Paris, France. |
[31] | Benton AL , Hamsher K ((1983) ) Multilingual Aphasia Examination. AJA Associates, Iowa City. |
[32] | Reitan RM ((1992) ) Trail Making Test: Manual for administration and scoring. Reitan Neuropsychological Laboratory, Tucson, AZ. |
[33] | Stroop JR ((1935) ) Studies of interference in serial verbal reactions. J Exp Psychol 18: , 643. |
[34] | Cox DR ((1972) ) Regression models and life-tables.187-202. J R Stat Soc Series B Methodol 34: . |
[35] | Ott A , Breteler MM , Harskamp FV , Stijnen T , Hofman A ((1998) ) Incidence and risk of dementia: The Rotterdam Study. Am J Epidemiol 147: , 574–580. |
[36] | Harrell FE , Lee KL , Mark DB ((1996) ) Multivariable prognostic models: Issues in developing models, evaluating assumptions and adequacy, and measuring and reducing errors. Stat Med 15: , 361–387. |
[37] | Cohen J ((1960) ) A coefficient of agreement for nominal scales. Psychol Meas 20,: , 37–46. |
[38] | Landis JR , Koch GG ((1977) ) The measurement of observer agreement for categorical data. Biometrics 33: , 159–174. |
[39] | Bondi MW , Edmonds EC , Jak AJ , Clark LR , Delano-Wood L , McDonald CR , Nation DA , Libon DJ , Rhoda A , Douglas G , Salmon DP ((2014) ) Neuropsychological criteria for mild cognitive impairment improves diagnostic precision, biomarker associations, and progression rates. J Alzheimers Dis 42: , 275–289. |
[40] | Jutten RJ , Harrison J , de Jong FJ , Aleman A , Ritchie CW , Scheltens P , Sikkes SA ((2017) ) A composite measure of cognitive and functional progression in Alzheimer’s disease: Design of the Capturing Changes in Cognition study. Dement 3: , 130–138. |
[41] | Virk GK , Poljak A , Braidy N , Sachdev PS ((2018) ) CSF and blood biomarkers of early-onset Alzheimer’s disease: A systematic review and meta-analysis. Dement 14: , 1158. |
[42] | Olsson B , Lautner R , Andreasson U , Öhrfelt A , Portelius E , Bjerke M , Hölttä M , Rosén C , Olsson C , Strobel G , Wu E , Dakin K , Petzold M , Blennow K , Zetterberg H ((2016) ) CSF and blood biomarkers for the diagnosis of Alzheimer’s disease: A systematic review and meta-analysis. Lancet Neurol 15: , 673–684. |
[43] | Ruan Q , D’Onofrio G , Sancarlo D , Bao Z , Greco A , Yu Z ((2016) ) Potential neuroimaging biomarkers of pathologic brain changes in mild cognitive impairment and Alzheimer’s disease: A systematic review. BMC Geriatr 16: , 104. |
[44] | Blennow K , Mattsson N , Schöll M , Hansson O , Zetterberg H ((2015) ) Amyloid biomarkers in Alzheimer’s disease. Trends Pharmacol Sci 36: , 297–309. |

