
Multimodal Magnetic Resonance Imaging in Alzheimer’s Disease Patients at Prodromal Stage
Abstract
One objective of modern neuroimaging is to identify markers that can aid in diagnosis, monitor disease progression, and impact long-term drug analysis. In this study, physiopathological modifications in seven subcortical structures of patients with mild cognitive impairment (MCI) due to Alzheimer’s disease (AD) were characterized by simultaneously measuring quantitative magnetic resonance parameters that are sensitive to complementary tissue characteristics (e.g., volume atrophy, shape changes, microstructural damage, and iron deposition). Fourteen MCI patients and fourteen matched, healthy subjects underwent 3T-magnetic resonance imaging with whole-brain, T1-weighted, T2*-weighted, and diffusion-tensor imaging scans. Volume, shape, mean R2*, mean diffusivity (MD), and mean fractional anisotropy (FA) in the thalamus, hippocampus, putamen, amygdala, caudate nucleus, pallidum, and accumbens were compared between MCI patients and healthy subjects. Comparisons were then performed using voxel-based analyses of R2*, MD, FA maps, and voxel-based morphometry to determine which subregions showed the greatest difference for each parameter. With respect to the micro- and macro-structural patterns of damage, our results suggest that different and distinct physiopathological processes are present in the prodromal phase of AD. MCI patients had significant atrophy and microstructural changes within their hippocampi and amygdalae, which are known to be affected in the prodromal stage of AD. This suggests that the amygdala is affected in the same, direct physiopathological process as the hippocampus. Conversely, atrophy alone was observed within the thalamus and putamen, which are not directly involved in AD pathogenesis. This latter result may reflect another mechanism, whereby atrophy is linked to indirect physiopathological processes.
INTRODUCTION
In the past few decades, it has been proposed that Alzheimer’s disease (AD), the most common neurodegenerative disease, might be reliably diagnosed at earlier stages, i.e., in preclinical phases or at the point of mild cognitive impairment (MCI) [1]. In particular, MCI with a high likelihood of progression to full-blown AD is a subtype of MCI (MCI-due-to-AD), supported by both neuropsychological and neuropathological evidence, and represents the highest risk factor for developing dementia over time [2].
A particularly promising approach in neurodegenerative research is based on the innovative use of acutely sensitive imaging techniques, i.e., magnetic resonance imaging (MRI), which can provide reliable diagnostic markers of early structural modifications. Indeed, atrophy within the hippocampus in MCI patients has been consistently reported as the best structural predictor of conversion to AD [3]. However, hippocampal atrophy is associated with a wide range of other neurological pathologies, thus limiting its specificity for AD [4–6]. While a number of studies have focused their analysis on the hippocampus, we suggest that amygdalar volume may be as useful as hippocampal volume for the diagnosis of early AD and could be, in addition, an independent marker of cognitive decline [7–9].
Recently, it has been showed that, apart from volume and grey-matter density, another useful metric, the shape of the subcortical structure, can be extracted from T1 images. The shape analysis of subcortical nuclei has already been used to successfully discriminate Parkinson’s disease patients from healthy controls, and correlated with motor symptoms [10]. The studies conducted with AD patients, however, have focused mainly on the hippocampus [11, 12], and only a few have investigated other subcortical structures [13].
Complementary to volumetric and morphometric indexes, another sensitive MRI biomarker is the microstructural changes measured by diffusion tensor imaging (DTI). DTI has classically been used to evaluate white matter bundles and measures the degree of anisotropy using a fractional anisotropy (FA) index. Another use of DTI parameters is the measurement of mean diffusivity (MD) in grey matter, which is thought to reflect microstructural integrity [14]. In fact, elevated MD and decreased FA are thought to be a reflection of the progressive loss of barriers that restrict the motion of water molecules in tissue compartments—a phenomenon known to be associated with neuronal loss and disruption of myelin sheaths in AD [15]. Previous works have demonstrated the interest of measuring these DTI indexes to describe physiological aging [16], and also to measure pathological changes in Parkinson’s disease [17] and MCI [18]. Higher MD in patients with MCI has been found within both the left and right hippocampi [18, 19], or only within the left hippocampus when using manual region-of-interest (ROI) computations [20]. This result has also been found when considering MCI subjects versus healthy controls [21], leading to the conclusion that it is important to measure DTI indexes as they can provide additional information about early degeneration in AD. However, there is some conflict with this conclusion, as some studies report no significant difference in MD within the hippocampus when comparing AD patients to healthy controls [22, 23]. These discrepancies could be caused by several factors, such as heterogeneity within the patient group, different DTI acquisition schemes (i.e., number of directions, intensity of the b0 field), or differences in how ROIs are defined (i.e., ROIs within subcortical structures or the entire structure).
Volumetry, shape, and MD are not the only markers available in MRI-based analyses. Several MRI methods have been evaluated for their ability to quantify brain iron deposits in neurodegenerative diseases. Indeed, iron metabolism dysregulation and iron accumulation in the brain are implicated in the pathogenesis of many neurodegenerative diseases, including AD (reviewed by Zecca et al. [24]). A recent study conducted on the pulvinar nucleus of AD patients found a significant drop in the T2* signal, which could be associated with iron deposits [25]. In 2009, Zhu and colleagues used phase-corrected MR imaging and found that, relative to controls, AD patients had a significant increase of the iron content in their dentate nucleus, caudate nucleus, putamen, parietal cortex, and bilateral hippocampi [26]. Similarly, a 14-T study conducted on postmortem hippocampal tissues of AD patients concluded that the variance in the distribution of R2* values in the region of interest within the hippocampus was significantly different between AD patients and controls [27]. One interesting conclusion of this postmortem study is that the increase of iron deposits seemed to preclude the incidence of significant atrophy.
An approach measuring MR parameters sensitive to complementary tissue characteristics (e.g., volume atrophy and shape, iron deposition, and microstructural damage) in the early stages of AD could have great potential for investigating pathological changes. This approach is feasible, as multimodal MRI was previously used to characterize the physiological aging of deep grey matter nuclei in healthy subjects [16] or to quantify pathological changes in Parkinson’s disease patients [17].
In the present study, we simultaneously measured volume, shape, DTI scalars, and T2* relaxation rates in seven deep, grey matter structures (thalamus, caudate nucleus, putamen, pallidum, hippocampus, amygdala, and accumbens) in patients with MCI-due-to-AD and healthy controls. These subcortical structures have been selected because they are all known to be affected by at least one of the biomarkers investigated in this study, which are atrophy (for all of the structures) [3, 7?9, 28]; microstructural integrity (for the hippocampus, pallidum, thalamus, and caudate) [19, 18, 28]; and iron deposits (for the caudate nucleus, putamen, and bilateral hippocampi) [26]. The nucleus accumbens was also investigated because it was recently noted by Liu et al. that the volume of this structure was decreased in MCI compared to controls [29]. Furthermore, in 2015, Yi et al. demonstrated that the volume loss of the nucleus accumbens was associated with an increased risk of progression from MCI to AD [30].
The aim of this work was to investigate the pattern of macro- and micro-structural pathophysiological changes in a cohort of patients with MCI-due-to-AD. By acquiring parameters pertaining to both micro- and macro-structure, we were also able to study the relationship between these different parameters and how they relate to disease pathophysiology. These findings would be relevant for a better understanding of AD progression in several different structures of thebrain.
MATERIALS AND METHODS
Participants
Study participants included 14 patients older than 65 years of age and in the prodromal stage of AD and 14 matched, healthy controls. All AD patients came from the outpatient memory clinic (Neurology Department, University Hospital, Toulouse, France) and presented with a memory complaint at least six months prior to enrollment (Table 1). All participants gave their written informed consent. This study was approved by the local ethics committee (Comité de Protection des Personnes Sud-Ouest et Outre-MER 1) and the French Agency for Safety and Security of Medical Devices (Agence Francaise de Sécurité Sanitaire des Produits de Santé, reference A90605-58).
Pre-inclusion assessment
Magnetic resonance imaging
A brain MRI was performed on all participants using a Philips 3T (Intera Achieva, Philips, Best, The Netherlands). A high-resolution anatomical image, using a three-dimensional (3D) T1-weighted sequence (in-plane resolution: 1 × 1 mm; slice thickness: 1 mm; 160 contiguous slices) and a T2-weighted sequence (reconstructed resolution: 0.45 × 0.45 × 3 mm3; 43 slices) were obtained. Three consecutive T2*-weighted, gradient-echo, whole-brain volumes were acquired using a segmented echo-planar imaging sequence [in-plane resolution: 1.8 × 1.8, slice thickness: 1.8 mm, 66 slices, matrix size: 128 × 128 mm, repetition time: (TR) 100 ms] with three different echo times (TE) (12 ms, 30 ms, and 40 ms). Diffusion-weighted volume measurements were acquired using a spin-echo EPI (TE/TR = 55/11,031 ms; bandwidth = 3,026.4 Hz/voxel; matrix = 108 × 106; 56 slices; voxel size: 2.00 × 2.00 × 2.01 mm3) with 32 isotropically distributed orientations for the diffusion-sensitizing gradients at a b-value of 1,000 s/mm² and a b = 0 images.
Fluorodeoxyglucose-positron emission tomography (FDG-PET) scan
Scans were performed on a Biograph 6 TruePoint Hirez (Siemens Medical Solutions, Munich, Germany) hybrid PET/computed tomography (CT) scanner (3D-detection mode, producing images with 1 × 1 × 1.5 mm voxels and a spatial resolution of approximately 5-mm full width at half maximum at the field of view centered). Cerebral emission scans began an average of 20 min after the injection of 1.85 MBq/kg weight of FDG and lasted for 10 min. Both CT and PET scans were acquired. PET data were corrected for partial volume effects. Two independent nuclear medicine physicians with extensive experience in reading FDG-PET scans, and blind to clinical information, examined all FDG-PET scans at inclusion. A three-point scale was used for rating FDG-PET profiles (0 = normal, 1 = temporo-parietal hypometabolism suggestive of AD, 2 = other). Inter-rater agreement was estimated by calculating κ and its 95% CI.
Cerebrospinal fluid (CSF) biomarker sampling
CSF samples were obtained by a lumbar puncture in the patient group. The samples were centrifuged for 10 min at 1,500 rpm at 4°C to remove cells, aliquoted to 0.4-mL samples in polypropylene tubes, and stored at –80°C until analysis. CSF biomarker levels of total tau (T-Tau), phospho-tau (P-Tau), Aβ42, and Aβ40 were measured using a sandwich ELISA method (Innogenetics, Gent, Belgium) according to the manufacturer’s instructions. We also calculated ratios derived from single biomarkers, including the Innotest Amyloid Tau Index (IATI), combining Aβ42 and T-Tau concentrations as follows: IATI = Aβ42 / [240 +(1.18 × T-Tau)], and the Aβ42/Aβ40 ratio.
Inclusion and exclusion criteria
Following pre-inclusion assessment, patients were enrolled in the present study if they met the following criteria for MCI-due-to-AD [2]: CDR = 0.5; the sum of the three free recalls ≤17/48, and/or the sum of the three free and cued recalls ≤40/48 on the FCSRT [31], and one or more of the following features: medial temporal lobe atrophy in at least one hemisphere (Scheltens score for > 1 for at least one visual rater); temporo-parietal hypometabolism pattern on cerebral FDG-PET scan (score = 1 for at least one visual rater); and/or, when P-Tau≥60 pg/mL or IATI >0.8, the Aβ42/Aβ40 ratio was calculated and a score <0.045 was considered to be compatible with AD diagnosis. Patients with significant white matter T2 hyperintensities (F&S score >2 for at least one visual rater) were excluded.
Cognitively normal subjects were included if they had no memory complaint, no neurological or psychiatric disease history, and no first-degree relatives with AD. They were excluded if they showed significant white matter hyperintensities on their T2-weighted MR images (F&S score >2 for at least one visual rater) or any cognitive impairment on the pre- or post-inclusion neuropsychological assessment (test scores below -2 standard deviations according to the norms). Control patients underwent the same neuropsychological assessment and the same imaging examination (i.e., MRI, PET) as MCI patients. Any neurological or psychiatric disease history was grounds for exclusion. For more details, see [32].
Neuropsychological tests
Once screened and consented, patients underwent several neuropsychological tests, including the Mini-Mental State Examination (MMSE) to assess global cognitive state, the 4-Instrumental Activities of Daily Living test to assess daily–life autonomy, and the Rey-Osterrieth Complex Figure Test (ROCF) to assess visual memory [33].
Imaging and analysis
Seven bilateral structures were automatically segmented from T1 images using FIRST [34, 35] (FMRIB’s Integrated Registration and Segmentation Tool) 5.0 (FSLv5), which included the thalamus, caudate nucleus, putamen, pallidum, hippocampus, amygdala, and accumbens.
Data were analyzed using the FMRIB Software Library (FSL [36–38]) 3.1.8 (http://www.fmrib.ox.ac.uk/fsl/) and locally written MATLAB (version 7.10.0, The Mathworks Inc.) scripts. To minimize the effects of head movements during acquisition, the four T2*-weighted images were corrected by applying a full affine (mutual information cost function) alignment of each image to a mean image that corresponded to the average of the four T2*-weighted images. From these images and for each subject, we performed a voxel-by-voxel, non-linear, least-squares fitting of the data acquired at the four TEs to obtain a mono-exponential signal decay curve [i.e., S(t) = S0e–t/T2*, where t = echo time, S = measured data, S0 = multiplicative constant, and T2* = effective transverse relaxation time]. The T2* (and R2* = 1/T2*) values were thus calculated for each voxel. The mean image was finally registered on the brain-extracted [39] T1-weighted volume using a full-affine transformation (normalized mutual information cost function). From the diffusion-weighted volumes, fractional anisotropy (FA) and mean diffusivity (MD) (FMRIB’s Diffusion Toolbox –FSLv5) were calculated. The mean b0 image was registered on the brain-extracted T1-weighted volume using a full-affine transformation (normalized mutual information cost function), and the transformation matrix was then applied to the maps of MD and FA. Thus, T1-weighted, R2*, MD, and FA maps were within the individual spatial space.
Region-based analysis
For the ROI analysis, four MRI-derived parameters were calculated for each segmented structure: normalized volume (i.e., the absolute volume of each structure multiplied by the scaling between the individual brain and the standard space calculated by SIENAX [39], part of FSL [38]), and the averages of MD, FA, and R2*. The parameters and the methods for their extraction were calculated in accordance to previous work [17].
Shape analysis
Using a deformable mesh model, FIRST creates a surface composed by a set of triangles for each subcortical structure. This network is composed of a set of triangles, and the apex of each adjoining triangle is called a vertex. For each structure, the number of vertices is fixed across subjects, allowing vertices comparisons between groups and subjects. The investigation of differences in the spatial location of each vertex in two groups or the correlation between vertex position and another variable are examples of the types of shape analyses that can be performed using FIRST [34, 35]. Although the vertices retain correspondence, the surfaces reside in native image spaces and thus have an arbitrary orientation/position. Therefore, the surfaces have to be aligned to a common space prior to any analysis. The mean surface from the FIRST model [in MNI (Montreal Neurological Institute) 152 space] is used as the target to which the surfaces from individual subjects are then aligned. Pose (rotation and translation) is removed to minimize the sum-of-squares differences between the corresponding vertices of a subject’s surface and the mean surface.
Voxel-based analysis of mean diffusivity, fractional anisotropy, and R2*
For voxel-based analysis, in order to take into account the inter-subject differences in brain global volume, the T1-weighted images of each subject were registered on the MNI template using a non-linear registration (sum-of-squared differences cost function). This spatial transformation was applied to each map previously registered in the native space of the subject (R2*, FA, and MD) for each subject.
Voxel-based morphometry (VBM)
VBM was performed using the implemented FSL tool, FSL-VBM v1.1 [40] and an optimized VBM protocol [41]. Briefly, all the T1 images were first brain extracted and then segmented into images of grey matter (GM), white matter (WM), and CSF. GM images were then non-linearly registered [42] to the grey matter ICBM-152 template, concatenated, and averaged. The resulting image was then flipped along the x-axis and both images where averaged again to create the first GM template. Then, GM images of all participants were non-linearly registered to this study-specific template and, using the same final steps, a second “non-linear” GM template was generated. This “non-linear” template was then finally used to register all the GM images and the registered images of all subjects were multiplied by the Jacobian of the warp field, in order to introduce a compensation (or “modulation”) to correct for local expansion or contraction. The corrected, registered images were then concatenated and smoothed by a Gaussian kernel (sigma = 4 mm).
Statistical analysis
Shape analysis
After pose removal using 6DOF registration, group comparisons of vertices were carried out using F-statistics [35]. The significance of these tests was calculated using a MonteCarlo simulation combined with a threshold-free cluster enhancement technique, as implemented in the FSL Randomise script [43, 44]. T-values obtained in the non-permuted data were compared against a null distribution calculated using 5,000 random permutations of the data. For the groups comparison, the images were thresholded at p < 0.05 and corrected for multiple comparisons. Results are presented as the percentage of significant surface and were considered relevant when the surface changes represented more than 5% of the total surface of the structure.
Region-based analysis
For region-based analysis, the normalized volumes and averages of MD, FA, and R2* of the segmented areas were calculated. First, they were compared with a repeated measures analysis of variance (ANOVA) using a 4-factor design, anatomical region, lateralization, modality (volume, MD, FA, R2*) and diagnostic as categorical predictor. Then for each modality, a repeated measures ANOVA was conducted using a 3-factor design, which included two between-structures factors [i.e., anatomical region and lateralization (left and right hemisphere)] and one between-subject factor (diagnostic). For the significant interactions in the second repeated measures ANOVA, a between-groups t-test was conducted.
To assess the relationship between the atrophy of subcortical areas and their modifications in microstructural integrity or in iron deposition, a Spearman’s rank order correlation was performed within the patient group and between the average of each quantitative parameters (MD, FA, and R2*) and the volume for each region of interest.
To investigate changes between quantitative parameters (volume, MD, and R2*) and cognitive measures, Spearman’s rank order correlations were performed within the patient group, between the mean left and right measurements for each of these parameters and the sum of the three free recalls, sum of the three free and cued recalls on the FCSRT, and scores obtained at the Rey-Osterrieth Complex Figure (ROCF). Only correlations which stayed significant after removing extreme values were kept.
Finally, logistic regression and receiver operating characteristic (ROC) curves were carried out using MR parameters and structures that were significant according to the region-of-interest analysis. All combinations among these pairs were tested to determine the combinations with the best discriminating power. A repeated 10-fold cross-validation was performed to calculate the area under the ROC curve for each combination. Combinations with areas under the curve >95% are reported.
Voxel-based analysis
Inter-group comparisons were performed on R2* and MD maps for each voxel, with and without masking for structures that showed significant differences in the volumetric analysis, using non-parametric t-tests (permutation tests; 5,000 repetitions) and with a significance threshold of p < 0.05 (Threshold-Free Cluster Enhancement corrected) with mask and p < 0.001 throughout. For the whole-brain analyses, maps were smoothed using a Gaussian kernel (sigma = 2 mm).
Logistic regression and receiver operating characteristic (ROC) curves were carried out using clusters of voxels that were significant according to the voxel-based analysis. All combinations among these pairs were tested to determine the combinations with the best discriminating power. A repeated 10-fold cross-validation was performed to calculate the area-under-the-ROC curve for each combination. Combinations with areas under the curve >95% are reported.
Voxel-based morphometry
Grey-matter density inter-group comparisons were performed using non-parametric t-tests (permutation tests, 5,000 repetitions) and were considered significant for p < 0.05 (Threshold-Free Cluster Enhancement and multiple-comparisons corrected).
RESULTS
The first repeated measures ANOVA using a 4-factor design [anatomical region, lateralization, modality (volume, MD, FA, R2*), and diagnostic as a categorical predictor] revealed a significant main effect of modality × diagnosis [F(3,78) = 16.68; p < 0.001], structure × diagnosis [F(6,156) = 3.55; p < 0.001], and modality × structure x diagnosis [F(18,468) = 3.54; p < 0.001]. There was no effect of modality alone. A post hoc Scheffé test of structure x diagnosis revealed a significant difference in the hippocampus between control subjects and MCI patients (p < 0.05). A second post hoc Scheffé test of modality × structure × diagnosis revealed a significant difference between MCI-due-to-AD and controls in the hippocampal volume (p < 0.001).
Region-based analysis: volumetry
The repeated measures ANOVA analyses showed a significant main effect of diagnosis [F(1,26) = 16.694; p < 0.001], and a significant main effect of structure x diagnosis [F(6,156) = 3.540; p < 0.003]. T-tests showed a statistically significant reduced volume in patients, compared to controls, for the following structures: the thalamus bilaterally (right: p < 0.08; left: p < 0.05), the putamen bilaterally (right: p < 0.025; left: p < 0.009), the hippocampus bilaterally (right: p < 0.005; left: p < 0.0001), the right amygdala (p < 0.007), and the left accumbens (p < 0.03) (Table 2).
Shape analysis
After correcting for multiple comparisons, inferior and superior views revealed bilateral localized and symmetrical shape differences throughout the hippocampus. The thalamus and putamen also had some shape differences, but the changes were not as symmetric as they were for the hippocampus (Fig. 1). Indeed, the surface of the right thalamus showed more local changes (23% ) than the left thalamus (7.3% ). Inversely, the putamen of the left hemisphere showed greater shape modifications (14% ) than the right hemisphere (3% ). The surface changes within the right amygdala (1.8% ) were under the significance threshold, which was defined as a change greater than or equal to 5% . These results are summarized in Table 3.
Region-based analysis of microstructural parameters: Mean diffusivity, fractional anisotropy, and R2*
Mean diffusivity
The repeated measures ANOVA conducted on the seven brain structures showed a main effect for diagnosis [F(1,26) = 9.13; p < 0.006] and an interaction of structure × diagnosis [F(6,156) = 3.12; p < 0.006]. T-tests showed significantly higher MD values in the right (p < 0.05) and left (p < 0.01) hippocampi and in the right amygdala (p < 0.05) in MCI-due-to-AD patients compared to healthy controls (Table 4).
Fractional anisotropy
No significant differences in fractional anisotropy were found in the regions included in this study.
R2*
No significant differences in relaxometry R2* were found in the regions included in this study.
Correlations and predictive analysis
There were no significant correlations between quantitative parameters (MD, FA, and R2*) and the volume for the regions included in this study. Correlation analysis between cognitive scores and MRI parameters revealed a statistically significant correlation (after Bonferroni correction) between the R2* in the amygdala and the ROCF (r = –0.68; p < 0.0125). Trends towards significance (p < 0.05) were also found for R2* in the hippocampus and the ROCF (r= –0.54), and for the MD in the hippocampus and the ROCF (r= –0.56). No correlation was found between R2* and MD.
Logistic regression analysis showed that the hippocampal volume alone was not sufficient to discriminate at a rate greater than 95% between MCI-due-to-AD and controls (92% with volume of the left hippocampus). Of note, the 95% threshold was reached with the combination of two markers, volume of the right thalamus and volume of the left hippocampus. Using the MD or volume in the right amygdala, anarea-under-the-curve (AUC) of 98% was reached when this value is combined to the left putaminal and hippocampal volumes. Finally, when combining either the MD of the left hippocampus, the right amygdala, or the left amygdala with the volume of the right thalamus and volume of the left hippocampus, we obtained an AUC of 96% .
Voxel-based analyses
Mean diffusivity
After masking the four structures selected previously according to volumetric analysis (thalamus, hippocampus, putamen, and amygdala), permutation tests showed higher MD values in MCI-due-to-AD patients compared to controls within the bilateral hippocampus structures (right: 167 voxels; left: 104 voxels; p < 0.05) after threshold-free, cluster-enhancement correction (Fig. 2 and Table 4).
Whole-brain results were quite consistent with the results obtained using the four-structure mask, showing mainly higher MD values in MCI-due-to-AD patients compared to healthy controls, in both hippocampi and in the right amygdala after threshold-free, cluster-enhancement correction (p < 0.001) (Table 5).
R2*
After masking the four structures selected previously according the volumetric analysis (thalamus, hippocampus, putamen, and amygdala) and after threshold-free, cluster-enhancement correction, permutation tests did not show any significant differences between MCI-due-to-AD patients compared to controls, with respect to R2*. Even without masking and after threshold-free cluster-enhancement correction (p < 0.05), this result was consistent and no clusters were significant.
Voxel-based morphometry
Using non-parametric t-tests, the inter-group comparison grouped two clusters symmetrically, the hippocampus and amygdala in each hemisphere, after correcting for multiple comparisons (p < 0.05). This analysis revealed the presence of significant grey matter atrophy mainly in these two structures in MCI-due-to-AD patients compared to healthy subjects (Fig. 3).
Predictive analysis
Logistic regression analysis (based on the cluster of voxels that was significant according to the voxel-based analysis) confirmed that the left VBM cluster (left hippocampus plus left amygdala) alone does not strongly discriminate (AUC of 92% ) between MCI-due-to-AD patients and controls, using our threshold of >95% discrimination. However, when considering only a single marker, this marker was the most powerful one. With two markers [the mean diffusivity of the right amygdala without mask and the left cluster obtained using the VBM (left hippocampus plus left amygdala)], a high degree of discrimination (AUC of 94% ) was reached. Conversely, an AUC of 93% was achieved using the MD of the left hippocampus (masked) and the left cluster of the VBM. Finally, combining either the MD of the right amygdala (masked) with left VBM cluster, the MD of the right amygdala (not masked) with the right VBM cluster (right hippocampus plus right amygdala), or both of the VBM clusters, we obtained an AUC of92% .
DISCUSSION
In this study, we used a combination of MRI parameters sensitive to pathological changes [atrophy, local volume (i.e., shape changes), microstructural damages, and iron accumulation] to explore the hippocampus and other subcortical structures in order to obtain complementary information about shape modifications in MCI-due-to-AD patients. Our study enabled us to follow the premises of the disease through different subcortical structures of interest, including the hippocampus, amygdala, thalamus, and putamen. We found several concomitant patterns of changes in different MRI-related parameters that may be related to AD pathogenesis. Our results suggest that distinct physiopathological processes are evident even in the prodromal phase of AD. These patterns are described throughout the discussion.
A notable conclusion from this work was a characterization of the profile of changes in the concomitant modifications of volume and MD. Our volumetry results confirmed the presence of significant hippocampal atrophy in MCI-due-to-AD patients, compared with controls [7, 8]. The volumetry analysis also revealed a significant loss of volume in the right amygdala of MCI-due-to-AD subjects, compared to controls. This observation is in accordance with previous studies conducted on AD patients, showing a volume reduction of the amygdala using different techniques like voxel-based morphometry [45], or a manual segmentation of regions of interest [46]. The shape analysis confirmed the presence of local atrophy within the hippocampus and revealed surface changes that were almost symmetrical. More interestingly, the shape analysis revealed that this atrophy was not global, but specific to certain aspects of the hippocampal structure. Although patients were at an early stage of the disease, these shape modifications were consistent with results obtained by several groups demonstrating atrophy in the dorsolateral part of the hippocampal head (CA1), and in the presubiculum area in AD patients [47–50]. For the amygdala, the shape analysis showed a significant local atrophy, but the extent of this atrophy was under our threshold of 5% of the total surface and this result has rarely been observed in prodromal AD patients versus controls [28]. However, some studies investigating the shape of the amygdala conducted at more advanced stages of the disease have identified a local atrophy in the basomedial and basolateral areas of this structure [51–53]. It should be noted, however, that the limited extent of the atrophy observed with a shape analysis has to be considered carefully, as the amygdala is a small structure that could reach the limit-of-detection of the mesh method with a defined number of vertices. Our study supports these former results by demonstrating a strong reduction of the grey-matter density within the entire, bilateral hippocampus and amygdala using a voxel-based morphometry analysis. In addition to the former parameters related to atrophy, we observed an increase of MD in the hippocampus and the amygdala, suggesting a loss of microstructural integrity within these structures in MCI-due-to-AD patients. Although this observation of an elevated MD within the hippocampus is not consistently reported in the literature [18, 20], some authors have shown that an increase of MD within this particular structure can be a better predictor of MCI converters than hippocampal atrophy [54]. Regarding the amygdala, an increase in MD is a widely known result in AD patients [19, 22, 55], but has not yet been observed in MCI subjects. The results from our region-based analysis are quite consistent with these studies and are confirmed by a whole-brain, voxel-based analysis, which further confirmed that the increase of MD (and, thus, the presence of microstructural changes) occurs deep within those structures, far from the border and not on the surface of the structure. This led us to conclude that the microstructural changes observed were not a reflection of the macro-structural changes that could induce a methodological bias (i.e., partial-volume effect). The lack of correlation between the MD value and volumes in those regions supports the lack of a relationship between markers. In addition, if the increase of MD was due to partial volume, we would have also found a decrease of FA. On the contrary, our findings showed a specific increase of MD without a concomitant decrease in FA. Previous studies comparing patients in the early stages of AD to non-diseased controls showed hippocampus atrophy without MD changes, and MD changes in the amygdala without atrophy [18], while our results found both atrophy and MD changes. These discrepancies could be explained by different inclusion criteria, particularly with respect to the definition of “early” AD. It was also interesting to note that the FA did not reveal any significant variations in the hippocampus and the amygdala. This result was expected, as FA is a marker of fiber orientation and is typically used to assess white-matter integrity. It, according to literature, has never revealed any significant differences in those two structures between prodromal AD patients and healthy subjects, but changes were observed in full-blown AD patients [56].
In terms of the linkage between structural changes and memory scores, correlation analyses showed a negative significant correlation between ROCF score and R2* in the amygdala. This result is interesting as the amygdala is involved in the memory process. A trend to a negative significant correlation of ROCF scores with both hippocampal MD and R2* values was also observed. As elevation of mean diffusivity and R2* are a reflection of the structural degeneration, it was expected that they would be linked to memory scores. This correlation concerning the MD is interesting because it is complementary to the difference that we found at the group level. However, the correlation with R2* is more difficult to explain, as we did not find any significant group differences regarding this parameter and only found significant correlations with the ROCF test. The absence of correlation with other memory tests could be explained by looking at our population and the fact that our patients were at a prodromal stage of AD, so memory impairments may not have been remarkable.
When looking at iron deposits, we did not find any significant changes in the region-based analysis when considering both the hippocampus and the amygdala. This result was confirmed by our voxel-based analysis, which did not reveal hippocampal or amygdalar sub-parts sensitive to iron deposits. Regarding the hippocampus, this result contrasts with previous studies, which found the presence of iron deposits in the hippocampus of AD patients using histopathological-based methods [27] or in vivo approaches [57]. This discrepancy could be due to the strength of the magnetic field used in our study, since a higher field is known to increase the sensitivity to iron species [58, 59]. Alternatively, our results could also be due to our patients having only an early stage of the disease or a smaller sample size. Larger studies focused on improving the sensitivity of this approach will be necessary to conclude if the 3T magnet has the ability to detect iron deposits in the hippocampus of MCI-due-to-AD patients. The lack of iron changes in the amygdala in MCI-due-to-AD seems to be in accordance with a previous post-mortem study [60]. However, as the current MRI approach was not able to detect iron deposits in the hippocampus such as was previously reported [57], we cannot conclusively state that there were no iron deposits in the amygdala. While this is true, we would like to point out that there has not been any previous literature documenting an increase of iron in the amygdala of prodromal AD patients.
As the hippocampus is known to be one of the first structures affected by the AD [61], it was interesting that we found the presence of hippocampal atrophy in vivo, along with loss of microstructural integrity (revealed by an elevation of MD) even at a prodromal stage of AD. The amygdala is also known to be affected in the first stages of the AD [61, 62] and, while still a matter of debate, post-mortem studies have identified significant atrophy within this structure [63]. Furthermore, it has been demonstrated that the amygdala is affected both by neurofibrillary tangles and plaques in post-mortem patients who were in the first stages of AD. The modifications are generally described as similar to those affecting the hippocampus [64–66]. So, in the same way as the hippocampus, the amygdala seems to be affected by direct physiopathological processes in AD. Our results have revealed the same pattern of atrophy within the hippocampus and the amygdala, along with, for both of these structures, a loss of microstructural integrity. Thus, these results are in agreement with the former prevailing theories of AD etiology.
Contrary to previous results demonstrating that the profile of subcortical changes resulted from a concomitant modification of both volume and MD, the results discussed below concern only a modification of volume. Indeed, looking at volume, we found the presence of significant atrophy bilaterally throughout the thalamus in MCI-due-to-AD patients compared with controls. This finding has rarely been studied in MCI subjects, as most of these studies focus solely on the hippocampus [13, 67]. Even more rarely, this observation was found in prodromal patients versus control [28]. Different techniques have been used more frequently, however, to document atrophy in later-stage AD patients versus controls, such as voxel-based morphometry [45] or a manual segmentation of regions of interest [46]. These results are consistent with the supposed role of thalamic atrophy in memory deficits inherent in AD [68]. The volumetric region-based analysis also revealed a significant bilateral atrophy of the putamen in MCI-due-to-AD patients. However, the left putamen had a greater volume loss than the right. This result has been widely described by other studies of AD patients, but rarely for patients in the prodromal stage [28]. Our shape analysis also revealed a bilateral local volume modification that was almost symmetrical on the dorsal part of the thalami and strongly asymmetrical on the ventral part. Of note, the ventral part of the right thalamus was the region with the most surface changes. The shape analysis also demonstrated extended-shape changes on the left putamen. The former result of local atrophy of the ventrolateral part of the thalamus has already been observed in a study of shape modifications induced by AD at a mild cognitive impairment stage and also at a later stage of the disease [13]. Atrophy in the aforementioned nuclei is supported by two independent (although derived from the same images) analyses: (1) the shape analysis, which represented a local deformation of the analyzed structure; and (2) the volumetric analysis by region of interest, which reflected more a global atrophy of the structures.
Contrary to the results obtained with the volumetric analysis, the VBM analysis did not detect any reduction of grey-matter density within the thalami or the putamen of MCI-due-to-AD patients compared to controls. But, while known to be efficient for the cortex, this VBM technique is less sensitive for sub-cortical structures [10]. Noting strong bilateral modifications in both volume and shape of the thalamus and of the left putamen, one could assume that these changes may be linked to microstructural changes; however, we did not find a significant increase of MD, FA, or R2* within those structures, even at the sites of atrophy. The result of an elevation of MD within the thalamus has already been reported by Cherubini et al. [18] but only for AD patients against controls. On the other hand, the absence of an increase in putaminal MD is in agreement with a previous DTI study [28]. Furthermore, while FA was previously found to be reduced within the thalamus in the literature [69, 70], we did not report any change in FA in any of the structures investigated. This latter result is supported by our voxel-based analysis, which was conducted on the entire brain without any a priori consideration. This discrepancy could be explained by the use of a different acquisition scheme for the DTI parameters (directions and number of directions) or by the fact that we were studying AD patients in the very early stages of their disease. The absence of a difference in R2*, while expected given the fact that no previous MRI study has revealed increased iron deposits within the thalamus or the putamen, should be taken carefully since the sensitivity to iron could be enhanced with an increased field [58, 59]. Further, the presence of atrophy without microstructural changes might be explained by the fact both of these structures are part of the structures that are affected last by AD. It seems that thalamic and left putaminal atrophy in the presence of conserved microstructural integrity is a reliable feature of early-stage AD.
In the present work, we also conducted a discriminant analysis between MCI-due-to-AD patients and controls based on MRI markers. While atrophy within the hippocampus in MCI patients has been consistently reported as the best structural predictor of conversion to AD [3], the results obtained with logistic regression analysis showed that, taken alone, the hippocampal volume was not sufficient to discriminate healthy subjects from MCI-due-to-AD patients (92% AUC). From the region-based analysis, combining left hippocampal and right thalamic volume, a threshold of 95% AUC was reached. However, contrary to what we expected, the amygdalar volume or MD alone did not prove to be a better predictor than the hippocampal volume. But, when combining either MD or the volume of the right amygdala with two other markers, such as the volume of the left hippocampus and putamen, a discrimination rate of 98% was reached. From the voxel-based analysis, the best threshold of discrimination (94% ) was achieved by combining two markers, the MD of the right amygdala without mask and the left cluster obtained with VBM (left hippocampus plus left amygdala).
Taken together, our study highlights the different micro- and macro-structural patterns of damage that are present in the prodromal phase of AD and suggest that different and possible distinct physiopathological processes are taking place. Indeed, it is well known that the hippocampus is one of the first and most significantly affected structures in AD [61], and our study recapitulates this by finding atrophy and modifications of hippocampal microstructural integrity, even in patients with the earliest phases of AD. The amygdala is also affected in the first stage of AD [61, 62]. Even though this is still a matter of debate, post-mortem studies have described significant atrophy within the amygdala [63], which was linked to substantial neuronal loss in AD patients [71]. It has been further shown that the amygdala is affected by both plaques and neurofibrillary tangle pathology in patients who died with mild stages of AD. These changes are noted to be generally similar to the changes that occur within the hippocampus [64–66]. So, similar to the hippocampus, the amygdala could be affected by direct physiopathological processes in AD. Our results support this hypothesis, as we observe the same pattern of atrophy with a concomitant modification of microstructure in both structures. Conversely, the thalamus and the putamen are not directly involved in AD pathogenesis. Our results showed atrophy without microstructural modifications. These findings could reflect another pattern of changes affecting these structures, such as through an indirect physiopathological pathway. A possible hypothesis related to such an indirect mechanism might be that the thalamus could be linked to the deafferentation between the hippocampus and thalamus, which are part of the same circuit (Papez circuit [72]). The cause for the observation of putaminal indirect damage remains unclear. Nevertheless, the interpretation about the hypothesis of an indirect mechanism remains to be further investigated.
Finally, these results highlight the importance of measuring volumetry along with microstructural indices when investigating the structural changes related to AD. The main limitation of this work is the small cohort, which led to the study having limited statistical power. Hence, these results should be confirmed on larger cohort of highly selected MCI-due-to-AD patients. Furthermore, prospective longitudinal studies following large cohorts of patients with MCI-due-to-AD through their conversion to AD will be crucial to confirm the existence of these two physiopathological processes (direct and indirect), and to accurately document the brain modifications that occur as a result of the progression of the disease.
DISCLOSURE STATEMENT
Authors’ disclosures available online (http://www.j-alz.com/manuscript-disclosures/15-0353r2).
REFERENCES
[1] | Petersen RC , Smith GE , Waring SC , Ivnik RJ , Tangalos EG , Kokmen E ((1999) ) Mild cognitive impairment: Clinical characterization and outcome. Arch Neurol 56: , 303–308. |
[2] | Albert MS , DeKosky ST , Dickson D , Dubois B , Feldman HH , Fox NC , Gamst A , Holtzman DM , Jagust WJ , Petersen RC , Snyder PJ , Carrillo MC , Thies B , Phelps CH ((2011) ) The diagnosis of mild cognitive impairment due to Alzheimer’s disease: Recommendations from the National Institute on Aging-Alzheimer’s Association workgroups on diagnostic guidelines for Alzheimer’s disease. Alzheimers Dement 7: , 270–279. |
[3] | Apostolova LG , Dutton RA , Dinov ID , Hayashi KM , Toga AW , Cummings JL , Thompson PM ((2006) ) Conversion of mild cognitive impairment to Alzheimer disease predicted by hippocampal atrophy maps. Arch Neurol 63: , 693–699. |
[4] | Wright IC , Rabe-Hesketh S , Woodruff PW , David AS , Murray RM , Bullmore ET ((2000) ) Meta-analysis of regional brain volumes in schizophrenia. Am J Psychiatry 157: , 16–25. |
[5] | Scher AI , Xu Y , Korf ESC , Hartley SW , Witter MP , Scheltens P , White LR , Thompson PM , Toga AW , Valentino DJ , Launer LJ ((2011) ) Hippocampal morphometry in population-based incident Alzheimer’s disease and vascular dementia: The HAAS. J Neurol Neurosurg Psychiatry 82: , 373–376. |
[6] | van de Pol L , Gertz H-J , Scheltens P , Wolf H ((2011) ) Hippocampal atrophy in subcortical vascular dementia. Neurodegener Dis 8: , 465–469. |
[7] | Chételat G , Desgranges B , De La Sayette V , Viader F , Eustache F , Baron J-C ((2002) ) Mapping gray matter loss with voxel-based morphometry in mild cognitive impairment. Neuroreport 13: , 1939–1943. |
[8] | Bell-McGinty S , Lopez OL , Meltzer CC , Scanlon JM , Whyte EM , Dekosky ST , Becker JT ((2005) ) Differential cortical atrophy in subgroups of mild cognitive impairment. Arch Neurol 62: , 1393–1397. |
[9] | Klein-Koerkamp Y , Heckemann RA , Ramdeen KT , Moreaud O , Keignart S , Krainik A , Hammers A , Baciu M , Hot P , for the Alzheimer’s Disease Neuroimaging, Initiative ((2014) ) Amygdalar atrophy in early Alzheimer’s disease. Curr Alzheimer Res 11: , 239–252. |
[10] | Nemmi F , Sabatini U , Rascol O , Péran P ((2015) ) Parkinson’s disease and local atrophy in subcortical nuclei: Insight from shape analysis. Neurobiol Aging 36: , 424–433. |
[11] | Ferrarini L1 , Frisoni GB , Pievani M , Reiber JH , Ganzola R , Milles J ((2009) ) Morphological hippocampal markers for automated detection of Alzheimer’s disease and mild cognitive impairment converters in magnetic resonance images. J Alzheimers Dis 17: , 643–659. |
[12] | Shen K , Fripp J , Mériaudeau F , Chételat G , Salvado O , Bourgeat P , Alzheimer’s Disease Neuroimaging Initiative ((2012) ) Detecting global and local hippocampal shape changes in Alzheimer’s disease using statistical shape models. Neuroimage 59: , 2155–2166. |
[13] | Qiu A , Fennema-Notestine C , Dale AM , Miller MI , Alzheimer’s Disease Neuroimaging Initiative ((2009) ) Regional shape abnormalities in mild cognitive impairment and Alzheimer’s disease. Neuroimage 45: , 656–661. |
[14] | Syková E ((2004) ) Extrasynaptic volume transmission and diffusion parameters of the extracellular space. Neuroscience 129: , 861–876. |
[15] | Kantarci K , Avula R , Senjem ML , Samikoglu AR , Zhang B , Weigand SD , Przybelski SA , Edmonson HA , Vemuri P , Knopman DS , Ferman TJ , Boeve BF , Petersen RC , Jack CR ((2010) ) Dementia with Lewy bodies and Alzheimer disease: Neurodegenerative patterns characterized by DTI. Neurology 74: , 1814–1821. |
[16] | Cherubini A , Péran P , Caltagirone C , Sabatini U , Spalletta G ((2009) ) Aging of subcortical nuclei: Microstructural, mineralization and atrophy modifications measured in vivo using MRI. Neuroimage 48: , 29–36. |
[17] | Péran P , Cherubini A , Assogna F , Piras F , Quattrocchi C , Peppe A , Celsis P , Rascol O , Démonet J-F , Stefani A , Pierantozzi M , Pontieri FE , Caltagirone C , Spalletta G , Sabatini U ((2010) ) Magnetic resonance imaging markers of Parkinson’s disease nigrostriatal signature. Brain 133: , 3423–3433. |
[18] | Cherubini A , Péran P , Spoletini I , Di Paola M , Di Iulio F , Hagberg GE , Sancesario G , Gianni W , Bossù P , Caltagirone C , Sabatini U , Spalletta G ((2010) ) Combined volumetry and DTI in subcortical structures of mild cognitive impairment and Alzheimer’s disease patients. J Alzheimers Dis 19: , 1273–1282. |
[19] | Kantarci K , Jack CRJ , Xu YC , Campeau NG , O’Brien PC , Smith GE , Ivnik RJ , Boeve BF , Kokmen E , Tangalos EG , Petersen RC ((2001) ) Mild cognitive impairment and Alzheimer disease: Regional diffusivity of water. Radiology 219: , 101–107. |
[20] | Fellgiebel A , Wille P , Müller MJ , Winterer G , Scheurich A , Vucurevic G , Schmidt LG , Stoeter P ((2004) ) Ultrastructural hippocampal and white matter alterations in mild cognitive impairment: A diffusion tensor imaging study. Dement Geriatr Cogn Disord 18: , 101–108. |
[21] | Scola E , Bozzali M , Agosta F , Magnani G , Franceschi M , Sormani MP , Cercignani M , Pagani E , Falautano M , Filippi M , Falini A ((2010) ) A diffusion tensor MRI study of patients with MCI and AD with a 2-year clinical follow-up. J Neurol Neurosurg Psychiatry 81: , 798–805. |
[22] | Hanyu H , Sakurai H , Iwamoto T , Takasaki M , Shindo H , Abe K ((1998) ) Diffusion-weighted MR imaging of the hippocampus and temporal white matter in Alzheimer’s disease. J Neurol Sci 156: , 195–200. |
[23] | Naggara O , Oppenheim C , Rieu D , Raoux N , Rodrigo S , Dalla Barba G , Meder J-F ((2006) ) Diffusion tensor imaging in early Alzheimer’s disease. Psychiatry Res 146: , 243–249. |
[24] | Zecca L , Youdim MBH , Riederer P , Connor JR , Crichton RR ((2004) ) Iron, brain ageing and neurodegenerative disorders. Nat Rev Neurosci 5: , 863–873. |
[25] | Moon W-J , Kim H-J , Roh HG , Choi JW , Han S-H ((2012) ) Fluid-attenuated inversion recovery hypointensity of the pulvinar nucleus of patients with Alzheimer disease: Its possible association with iron accumulation as evidenced by the t2(*) map. Korean J Radiol 13: , 674–683. |
[26] | Zhu W-Z , Zhong W , Wang W , Zhan C-J , Wang C-Y , Qi J-P , Wang J-Z , Lei T ((2009) ) Quantitative MR phase-corrected imaging to investigate increased brain iron deposition of patients with Alzheimer disease. Radiology 253: , 497–504. |
[27] | Antharam V , Collingwood JF , Bullivant J-P , Davidson MR , Chandra S , Mikhaylova A , Finnegan ME , Batich C , Forder JR , Dobson J ((2012) ) High field magnetic resonance microscopy of the human hippocampus in Alzheimer’s disease: Quantitative imaging and correlation with iron. Neuroimage 59: , 1249–1260. |
[28] | Li Y , He H , Dong H , Feng X , Xie G , Zhang L ((2013) ) Discriminative analysis of early-stage Alzheimer’s disease and normal aging with automatic segmentation technique in subcortical gray matter structures: A multicenter in vivo MRI volumetric and DTI study. Acta Radiol 54: , 1191–1200. |
[29] | Liu Y , Paajanen T , Zhang Y , Westman E , Wahlund L-O , Simmons A , Tunnard C , Sobow T , Mecocci P , Tsolaki M , Vellas B , Muehlboeck S , Evans A , Spenger C , Lovestone S , Soininen H , AddNeuroMed Consortium ((2010) ) Analysis of regional MRI volumes and thicknesses as predictors of conversion from mild cognitive impairment to Alzheimer’s disease. Neurobiol. Aging 31: , 1375–1385. |
[30] | Yi H-A , Möller C , Dieleman N , Bouwman FH , Barkhof F , Scheltens P , van der Flier WM , Vrenken H ((2015) ) Relation between subcortical grey matter atrophy and conversion from mild cognitive impairment to Alzheimer’s disease. J Neurol Neurosurg Psychiatry, doi: 10.1136/jnnp-2014-309105 |
[31] | Sarazin M , Berr C , De Rotrou J , Fabrigoule C , Pasquier F , Legrain S , Michel B , Puel M , Volteau M , Touchon J , Verny M , Dubois B ((2007) ) Amnestic syndrome of the medial temporal type identifies prodromal AD: A longitudinal study. Neurology 69: , 1859–1867. |
[32] | Saint-Aubert L , Barbeau EJ , Péran P , Nemmi F , Vervueren C , Mirabel H , Payoux P , Hitzel A , Bonneville F , Gramada R , Tafani M , Vincent C , Puel M , Dechaumont S , Chollet F , Pariente J ((2013) ) Cortical florbetapir-PET amyloid load in prodromal Alzheimer’s disease patients. EJNMMI Res 3: , 43. |
[33] | Strauss E , Sherman E , Spreen O ((2006) ) A Compendium of Neuropsychological Tests, Oxford University Press, Oxford. |
[34] | Patenaude B ((2007) ) Bayesian statistical models of shape and appearance for subcortical brain segmentation. D.Phil. Thesis, University of Oxford, UK. |
[35] | Patenaude B , Smith SM , Kennedy DN , Jenkinson M ((2011) ) A Bayesian model of shape and appearance for subcortical brain segmentation. Neuroimage 56: , 907–922. |
[36] | Jenkinson M , Beckmann CF , Behrens TEJ , Woolrich MW , Smith SM ((2012) ) FSL. Neuroimage 62: , 782–790. |
[37] | Woolrich MW , Jbabdi S , Patenaude B , Chappell M , Makni S , Behrens T , Beckmann C , Jenkinson M , Smith SM ((2009) ) Bayesian analysis of neuroimaging data in FSL. Neuroimage 45: , S173–S186. |
[38] | Smith SM , Jenkinson M , Woolrich MW , Beckmann CF , Behrens TEJ , Johansen-Berg H , Bannister PR , De Luca M , Drobnjak I , Flitney DE , Niazy RK , Saunders J , Vickers J , Zhang Y , De Stefano N , Brady JM , Matthews PM ((2004) ) Advances in functional and structural MR image analysis and implementation as FSL. Neuroimage 23: (Suppl 1), S208–S219. |
[39] | Smith SM ((2002) ) Fast robust automated brain extraction. Hum Brain Mapp 17: , 143–155. |
[40] | Douaud G , Smith S , Jenkinson M , Behrens T , Johansen-Berg H , Vickers J , James S , Voets N , Watkins K , Matthews PM , James A ((2007) ) Anatomically related grey and white matter abnormalities in adolescent-onset schizophrenia. Brain J Neurol 130: , 2375–2386. |
[41] | Good CD , Johnsrude IS , Ashburner J , Henson RN , Friston KJ , Frackowiak RS ((2001) ) A voxel-based morphometric study of ageing in 465 normal adult human brains. Neuroimage 14: , 21–36. |
[42] | Anderson M , Jenkinson M , Smith S ((2007) ) Non-linear registration, aka Spatial normalisation. FMRIB Technical Report TR07JA2. |
[43] | Nichols TE , Holmes AP ((2002) ) Nonparametric permutation tests for functional neuroimaging: A primer with examples. Hum Brain Mapp 15: , 1–25. |
[44] | Hayasaka S ((2003) ) Validating cluster size inference: random field and permutation methods. Neuroimage 20: , 2343–2356. |
[45] | Baron JC , Chételat G , Desgranges B , Perchey G , Landeau B , de la Sayette V , Eustache F ((2001) ) in vivo mapping of gray matter loss with voxel-based morphometry in mild Alzheimer’s Disease. Neuroimage 14: , 298–309. |
[46] | Krasuski JS , Alexander GE , Horwitz B , Daly EM , Murphy DG , Rapoport SI , Schapiro MB ((1998) ) Volumes of medial temporal lobe structures in patients with Alzheimer’s disease and mild cognitive impairment (and in healthy controls). Biol Psychiatry 43: , 60–68. |
[47] | Frisoni GB , Ganzola R , Canu E , Rub U , Pizzini FB , Alessandrini F , Zoccatelli G , Beltramello A , Caltagirone C , Thompson PM ((2008) ) Mapping local hippocampal changes in Alzheimer’s disease and normal ageing with MRI at 3 Tesla. Brain 131: , 3266–3276. |
[48] | Wang L , Swank JS , Glick IE , Gado MH , Miller MI , Morris JC , Csernansky JG ((2003) ) Changes in hippocampal volume and shape across time distinguish dementia of the Alzheimer type from healthy aging. Neuroimage 20: , 667–682. |
[49] | Apostolova LG , Dinov ID , Dutton RA , Hayashi KM , Toga AW , Cummings JL , Thompson PM ((2006) ) 3D comparison of hippocampal atrophy in amnestic mild cognitive impairment and Alzheimer’s disease. Brain 129: , 2867–2873 . |
[50] | Becker JT , Davis SW , Hayashi KM , Meltzer CC , Toga AW , Lopez OL , Thompson PM , Imaging Methods, Analysis in Geriatrics Research, Group ((2006) ) Three-dimensional patterns of hippocampal atrophy in mild cognitive impairment. Arch Neurol 63: , 97–101. |
[51] | Cavedo E , Boccardi M , Ganzola R , Canu E , Beltramello A , Caltagirone C , Thompson PM , Frisoni GB ((2011) ) Local amygdala structural differences with 3T MRI in patients with Alzheimer disease. Neurology 76: , 727–733. |
[52] | Cavedo E , Pievani M , Boccardi M , Galluzzi S , Bocchetta M , Bonetti M , Thompson PM , Frisoni GB ((2014) ) Medial temporal atrophy in early and late-onset Alzheimer’s disease. Neurobiol Aging 35: , 2004–2012. |
[53] | Miller MI , Younes L , Ratnanather JT , Brown T , Trinh H , Lee DS , Tward D , Mahon PB , Mori S , Albert M , BIOCARD Research Team ((2015) ) Amygdalar atrophy in symptomatic Alzheimer’s disease based on diffeomorphometry: The BIOCARD cohort. Neurobiol Aging 36: (Suppl 1), S3–S10. |
[54] | Fellgiebel A , Dellani PR , Greverus D , Scheurich A , Stoeter P , Müller MJ ((2006) ) Predicting conversion to dementia in mild cognitive impairment by volumetric and diffusivity measurements of the hippocampus. Psychiatry Res 146: , 283–287. |
[55] | Ray KM , Wang H , Chu Y , Chen Y-F , Bert A , Hasso AN , Su M-Y ((2006) ) Mild cognitive impairment: Apparent diffusion coefficient in regional gray matter and white matter structures. Radiology 241: , 197–205. |
[56] | Ramani A , Jensen JH , Helpern JA ((2006) ) Quantitative MR imaging in Alzheimer disease. Radiology 241: , 26–44. |
[57] | Raven EP , Lu PH , Tishler TA , Heydari P , Bartzokis G ((2013) ) Increased iron levels and decreased tissue integrity in hippocampus of Alzheimer’s disease detected in vivo with magnetic resonance imaging. J Alzheimers Dis 37: , 127–136. |
[58] | Yao B , Li T-Q , Gelderen P , van Shmueli K , de Zwart JA , Duyn JH ((2009) ) Susceptibility contrast in high field MRI of human brain as a function of tissue iron content. Neuroimage 44: , 1259–1266. |
[59] | Luccichenti G , Giugni E , Péran P , Cherubini A , Barba C , Bivona U , Formisano R , Sabatini U ((2010) ) 3 Tesla is twice as sensitive as 1.5 Tesla magnetic resonance imaging in the assessment of diffuse axonal injury in traumatic brain injury patients. Funct Neurol 25: , 109–114 . |
[60] | Deibel MA , Ehmann WD , Markesbery WR ((1996) ) Copper, iron, and zinc imbalances in severely degenerated brain regions in Alzheimer’s disease: Possible relation to oxidative stress. J Neurol Sci 143: , 137–142. |
[61] | Braak H , Braak E , Yilmazer D , de Vos RA , Jansen EN , Bohl J ((1996) ) Pattern of brain destruction in Parkinson’s and Alzheimer’s diseases. J Neural Transm 103: , 455–490. |
[62] | Poulin SP , Dautoff R , Morris JC , Barrett LF , Dickerson BC , Alzheimer’s Disease Neuroimaging Initiative ((2011) ) Amygdala atrophy is prominent in early Alzheimer’s disease and relates to symptom severity. Psychiatry Res 194: , 7–13. |
[63] | Scott SA , DeKosky ST , Scheff SW ((1991) ) Volumetric atrophy of the amygdala in Alzheimer’s disease: Quantitative serial reconstruction. Neurology 41: , 351–356. |
[64] | Price JL , Davis PB , Morris JC , White DL ((1991) ) The distribution of tangles, plaques and related immunohistochemical markers in healthy aging and Alzheimer’s disease. Neurobiol Aging 12: , 295–312. |
[65] | Arriagada PV , Growdon JH , Hedley-Whyte ET , Hyman BT ((1992) ) Neurofibrillary tangles but not senile plaques parallel duration and severity of Alzheimer’s disease. Neurology 42: , 631–639. |
[66] | Price JL , Morris JC ((1999) ) Tangles and plaques in nondemented aging and “preclinical” Alzheimer’s disease. Ann Neurol 45: , 358–368. |
[67] | Pedro T , Weiler M , Yasuda CL , D’Abreu A , Damasceno BP , Cendes F , Balthazar MLF ((2012) ) Volumetric brain changes in thalamus, corpus callosum and medial temporal structures: mild Alzheimer’s disease compared with amnestic mild cognitive impairment. Dement Geriatr Cogn Disord 34: , 149–155. |
[68] | Desgranges B , Baron JC , de la Sayette V , Petit-Taboué MC , Benali K , Landeau B , Lechevalier B , Eustache F ((1998) ) The neural substrates of memory systems impairment in Alzheimer’s disease. A PET study of resting brain glucose utilization. Brain J Neurol 121: (Pt 4), 611–631. |
[69] | Rose SE , Janke AL , Chalk JB ((2008) ) Gray and white matter changes in Alzheimer’s disease: A diffusion tensor imaging study. J Magn Reson Imaging JMRI 27: , 20–26. |
[70] | Canu E1 , McLaren DG , Fitzgerald ME , Bendlin BB , Zoccatelli G , Alessandrini F , Pizzini FB , Ricciardi GK , Beltramello A , Johnson SC , Frisoni GB ((2011) ) Mapping the structural brain changes in Alzheimer’s disease: The independent contribution of two imaging modalities. J Alzheimers Dis 26: (Suppl. 3), 263–274. |
[71] | Scott SA , DeKosky ST , Sparks DL , Knox CA , Scheff SW ((1992) ) Amygdala cell loss and atrophy in Alzheimer’s disease. Ann. Neurol 32: , 555–563. |
[72] | Papez JW ((1995) ) A proposed mechanism of emotion. 1937. J Neuropsychiatry Clin Neurosci 7: , 103–112. |
Figures and Tables
Fig.1
Shape modifications between MCI-due-to-AD patients and healthy controls in dorsal and ventral views. Areas in orange represent localization with significant shape modification (p < 0.05 corrected for multiple comparisons).
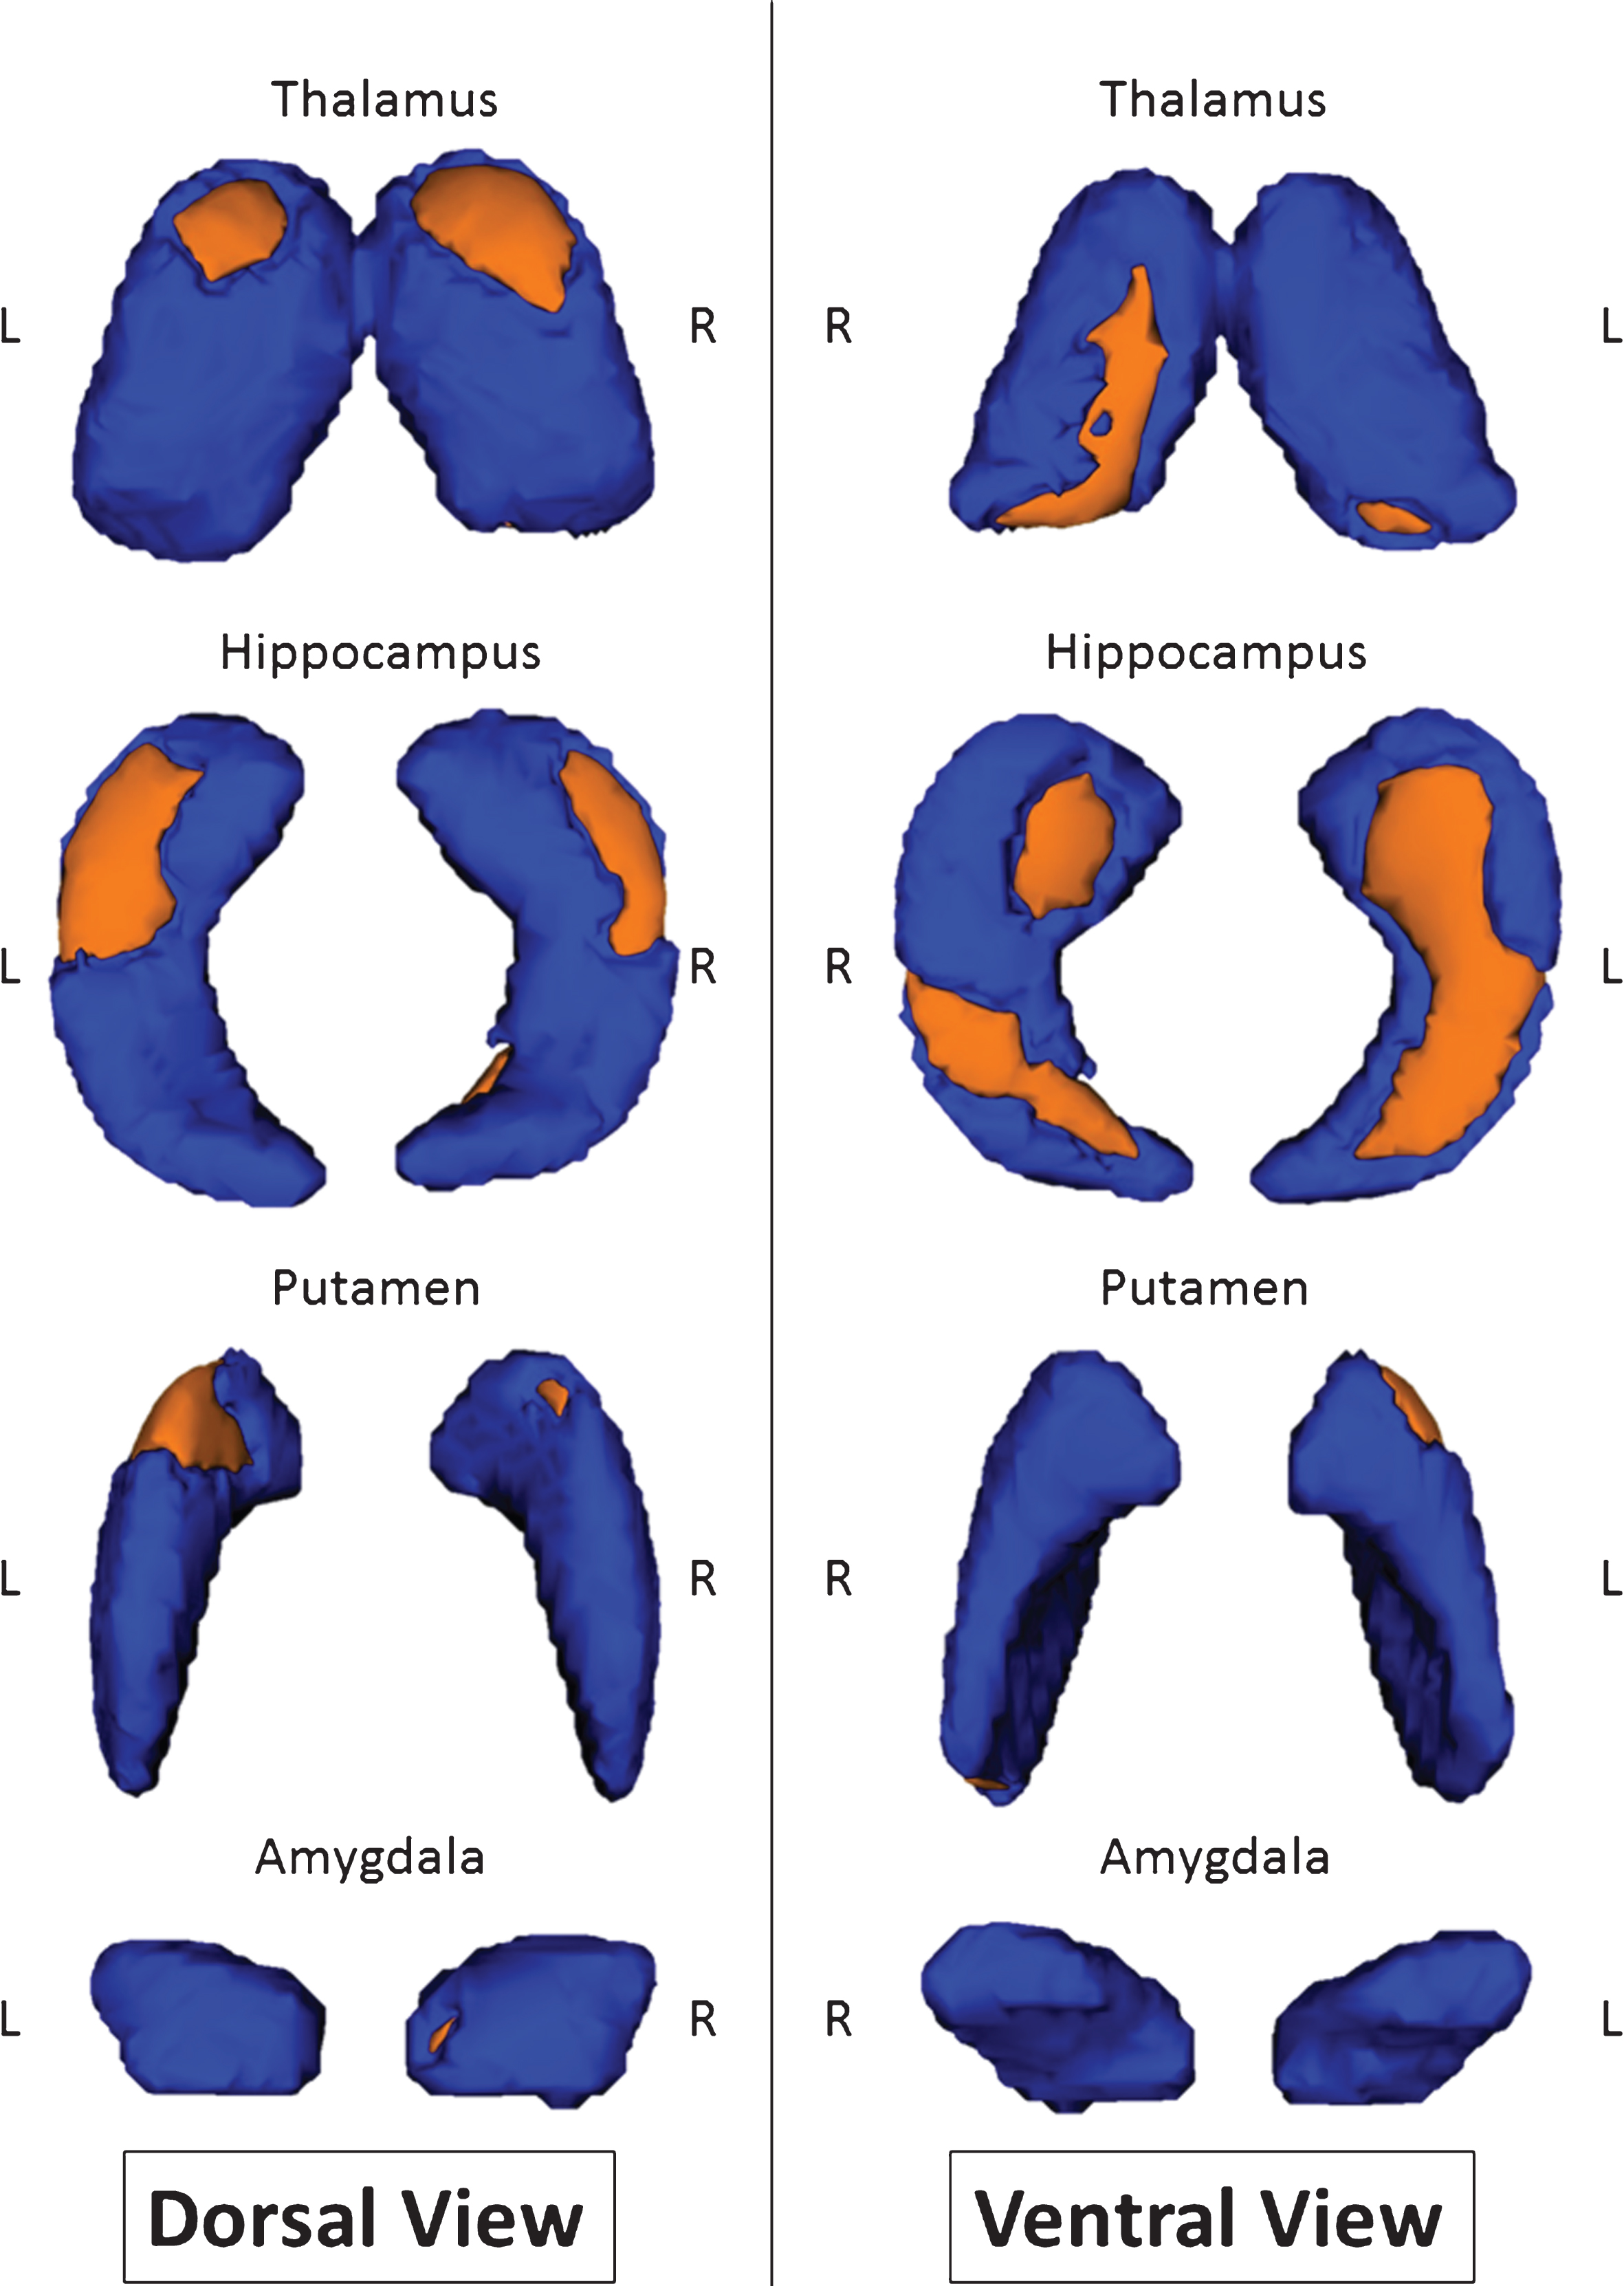
Fig.2
Voxel-based analysis of mean diffusivity with mask composed of both thalami, both hippocampi, both putamen, and both amygdala with threshold of significance of p < 0.05 and threshold-free cluster enhancement corrected in MCI-due-to-AD patients versus healthy controls (A, anterior; I, inferior; L, left; P, posterior; R, right; S, superior).
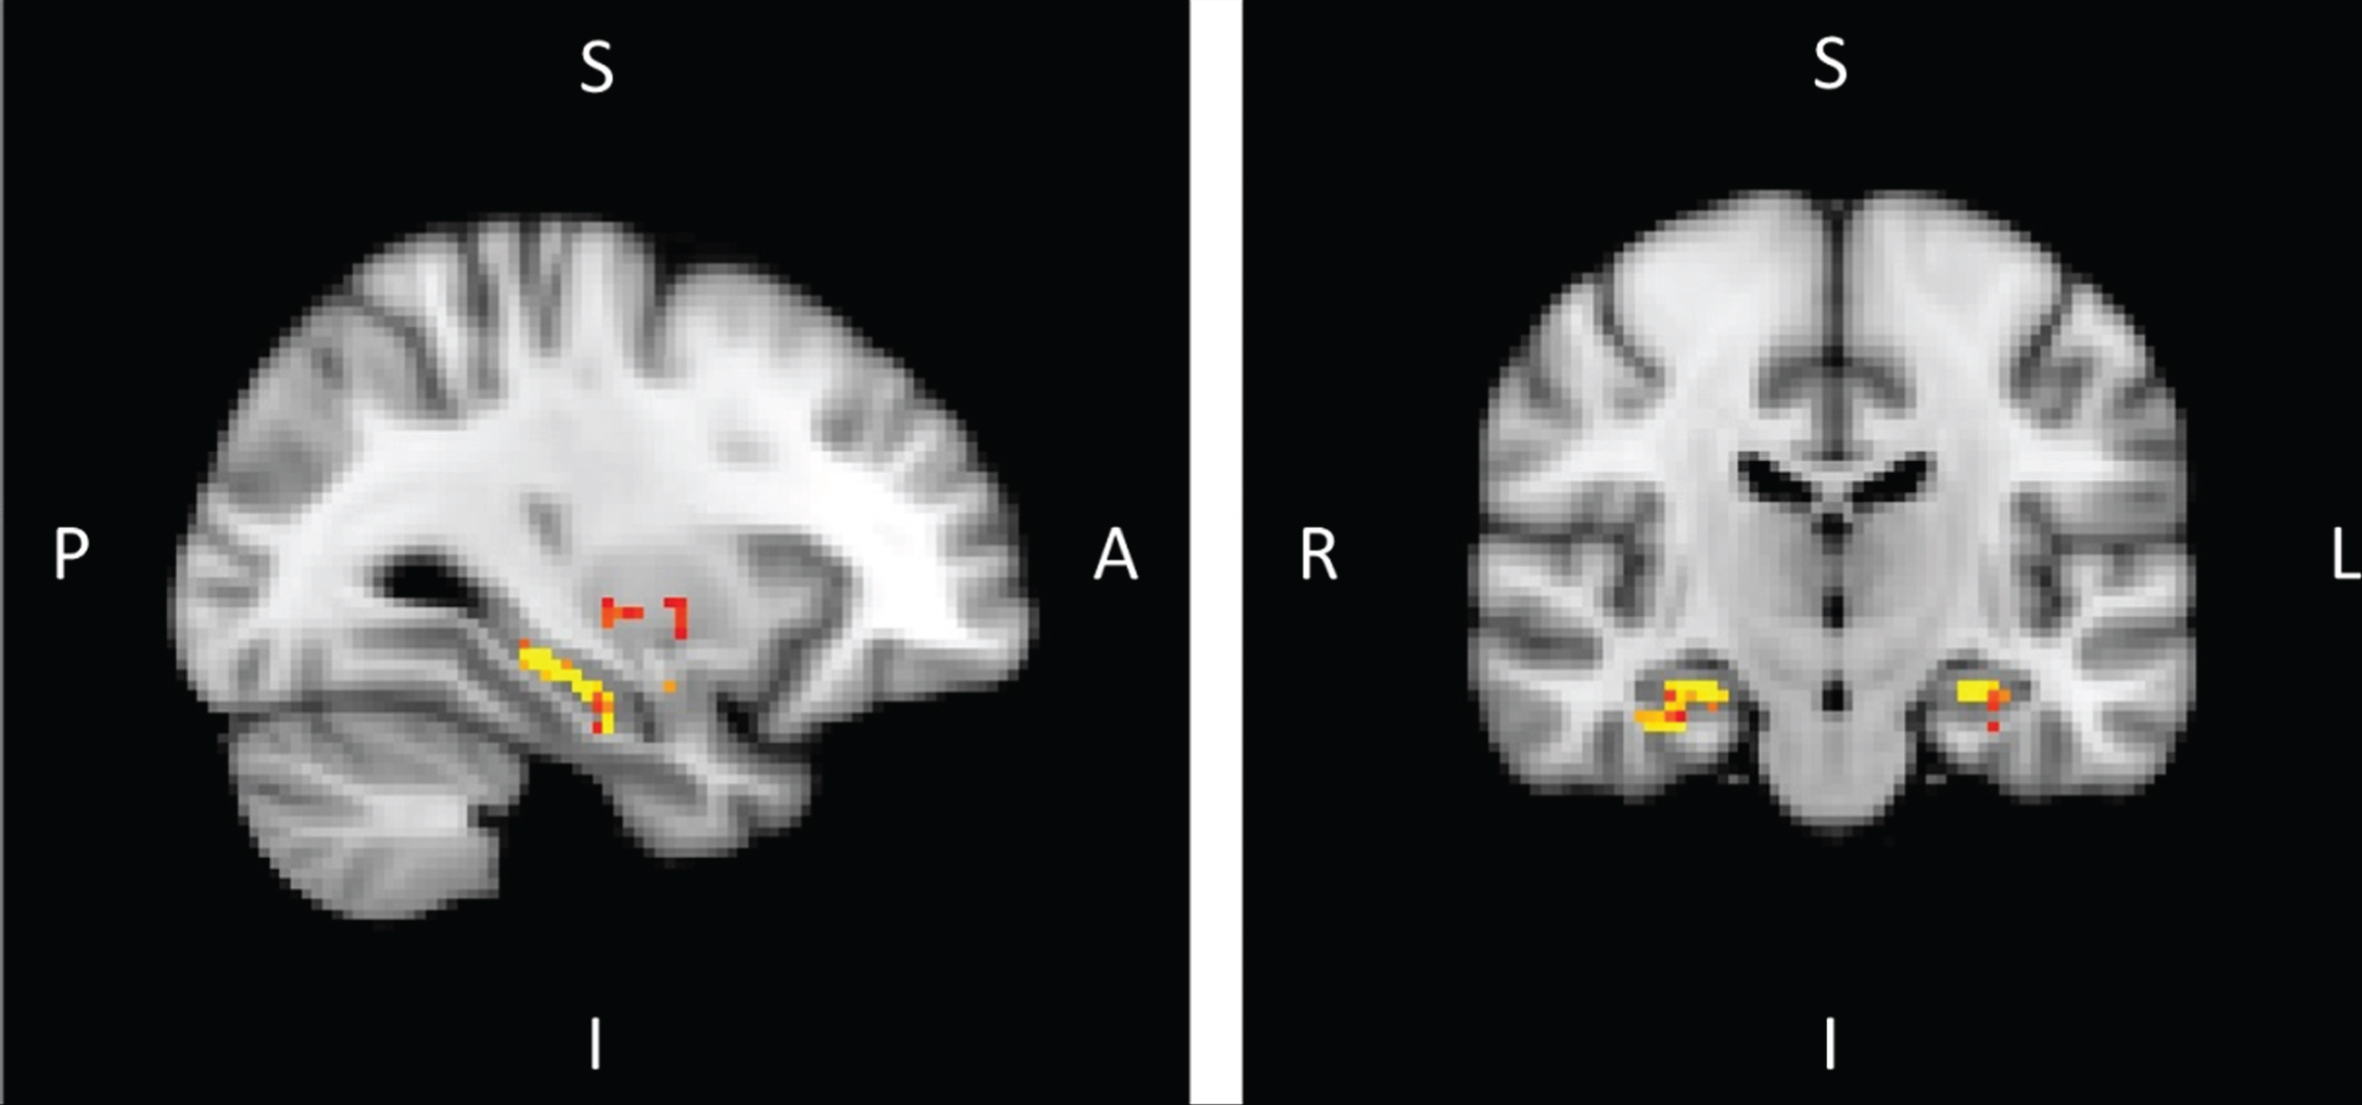
Fig.3
Voxel-based morphometry in MCI-due-to-AD patients versus healthy controls corrected for multiple comparison (p < 0.05) (A, anterior; I, inferior; L, left; P, posterior; R, right; S, superior)
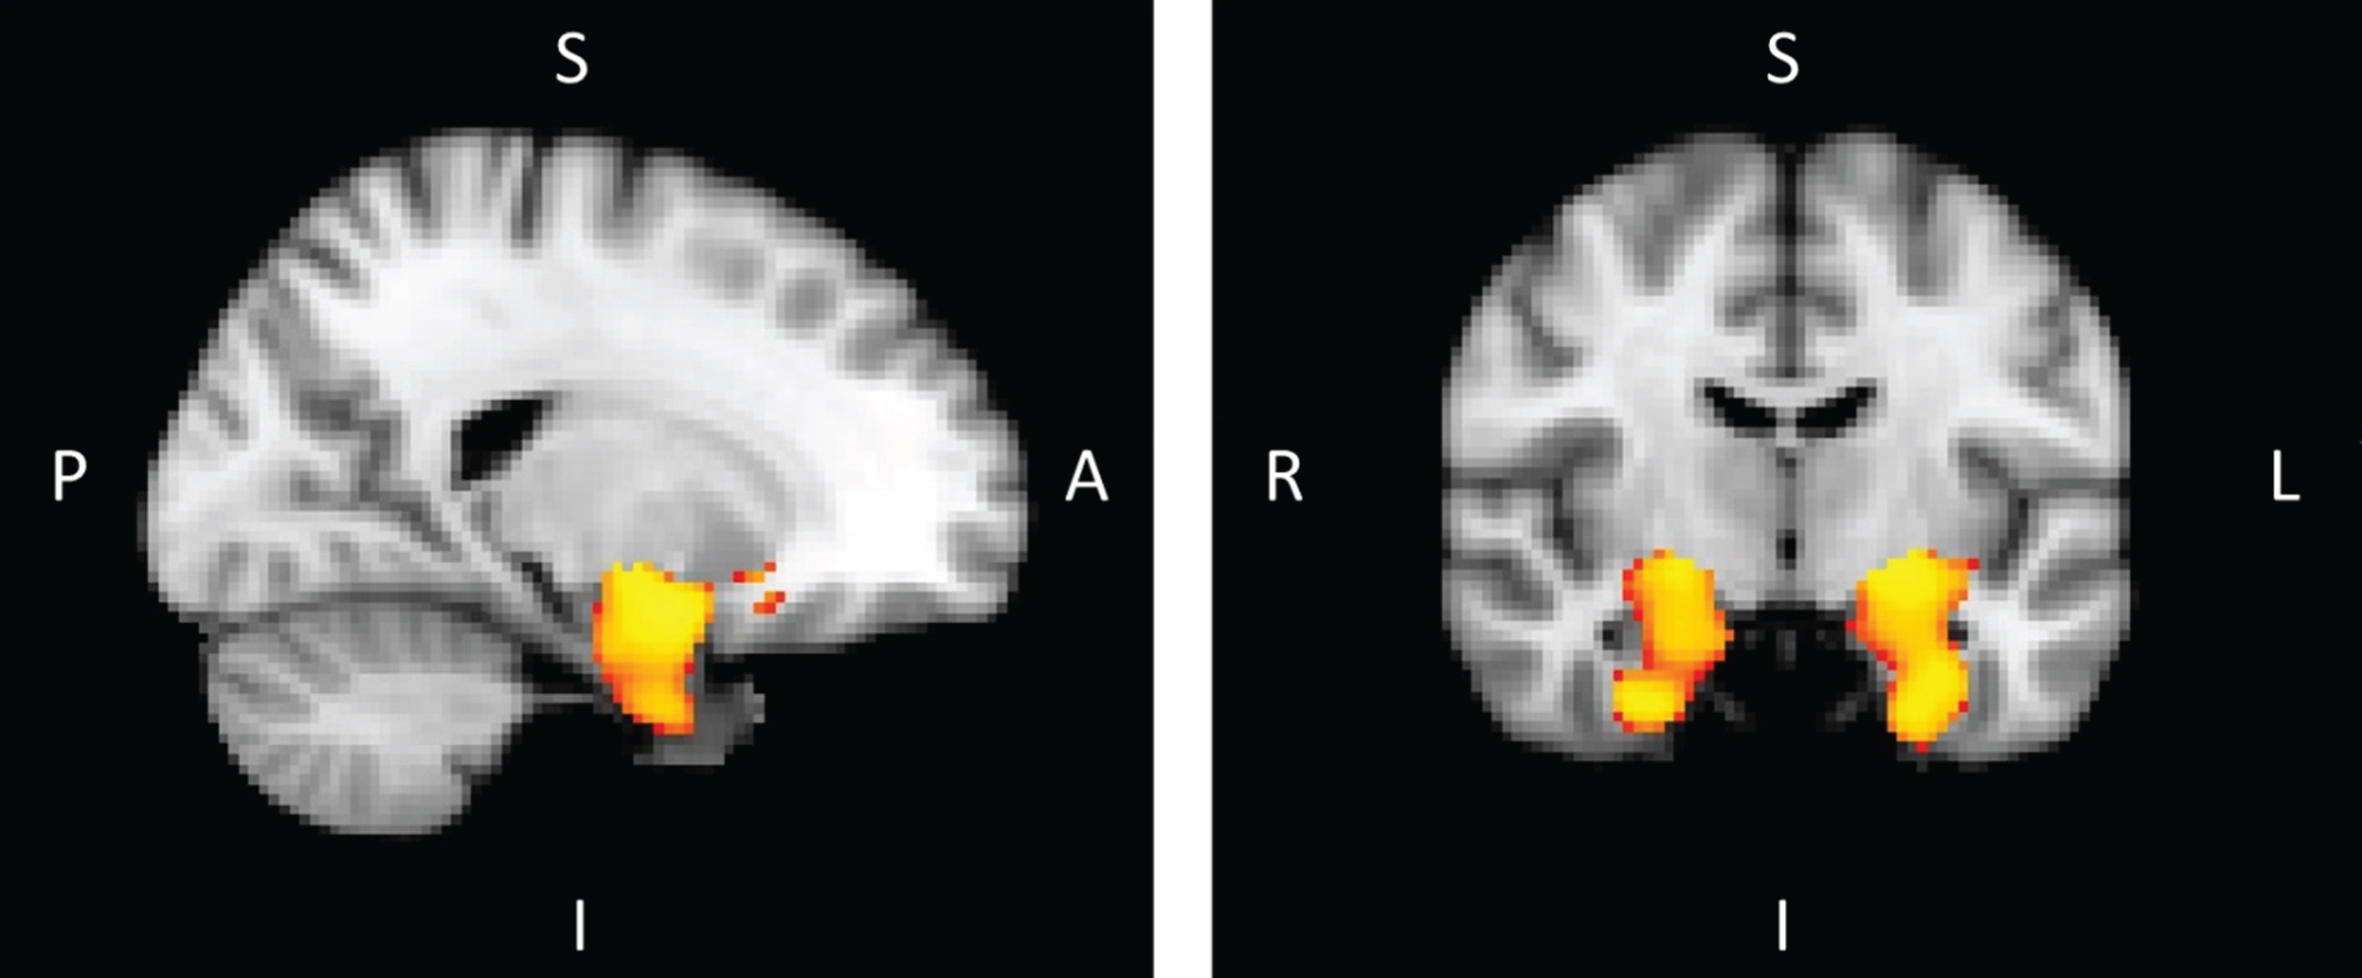
Table 1
Population description
| MCI-due-to-AD patients | Control subjects | p value | |
| Number of participants | 14 | 14 | NA |
| Age | 71.1 ± 4.7 | 70.9 ± 4.6 | 0.936 |
| Gender | 7M/7F | 6M/8F | 0.717 |
| Level of education | 11.0 ± 2.9 | 11.9 ± 2.8 | 0.436 |
| Daily-life autonomy CDR scale | 0.5 ± 0.0 | 0.0 ± 0.0 | <0.001* |
| FCSRT sum of free recalls (/48) | 12.6 ± 4.3 | 32.3 ± 5.0 | <0.001* |
| FCSRT sum of free +cued recalls (/48) | 32.4 ± 10.0 | 46.5 ± 2.1 | <0.001* |
| Rey-Osterrieth Complex Figure | 8.6 ± 5.8 | 19.9 ± 6.6 | <0.001* |
| MMSE | 25.8 ± 1.5 | 28.4 ± 0.8 | <0.001* |
CDR, clinical dementia rating; FCSRT, Free and Cued Selective Reminding Test; MMSE, Mini-Mental State Examination; *Stands for <0.001.
Table 2
Normalized volumes and standard deviation [mm3] of the subcortical areas in MCI-due-to-AD patients (AD) and healthy controls (HC)
| Structure | Lateralization | Mean AD | Standard Deviation AD | Mean HC | Standard Deviation HC | p value (vol AD versus vol HC)* |
| Thalamus | Right | 8888.16 | 622.37 | 9459.30 | 389.61 | <0.008 |
| Left | 9359.32 | 686.09 | 9890.16 | 662.66 | <0.05 | |
| Caudate | Right | 4601.67 | 520.51 | 4735.18 | 568.47 | n.s. |
| Left | 4147.76 | 616.79 | 4449.21 | 618.40 | n.s. | |
| Putamen | Right | 5337.11 | 573.16 | 5869.91 | 605.16 | <0.03 |
| Left | 5439.62 | 385.45 | 5932.40 | 514.50 | <0.009 | |
| Pallidum | Right | 2506.98 | 438.29 | 2700.36 | 566.38 | n.s. |
| Left | 2562.02 | 399.97 | 2796.99 | 682.85 | n.s. | |
| Hippocampus | Right | 3857.03 | 836.32 | 4673.19 | 528.33 | <0.005 |
| Left | 3594.97 | 463.65 | 4610.65 | 454.72 | <0.0001 | |
| Amygdala | Right | 1318.06 | 339.16 | 1602.18 | 112.88 | <0.007 |
| Left | 1212.21 | 274.30 | 1378.96 | 288.48 | n.s. | |
| Accumbens | Right | 314.10 | 102.97 | 387.63 | 118.28 | n.s. |
| Left | 386.39 | 111.71 | 507.19 | 155.73 | <0.03 |
NS, non significant; AD, Alzheimer’s disease *Last column computed using a Student’s t-test.
Table 3
Percentage of significant surface changes
| Structure | Lateralization | Percent of surface changes |
| Thalamus | Right | 23.0% |
| Left | 7.3% | |
| Hippocampus | Right | 28.9% |
| Left | 40.3% | |
| Putamen | Right | 3.0% |
| Left | 14.0% | |
| Amygdala | Right | 1.8% |
| Left | 0% |
Table 4
Mean diffusivity (MD) [×10–3 mm²s–1] of the subcortical areas in MCI-due-to-AD patients and healthy controls
| Structure | Lateralization | Mean MD for AD subjects (×10–3) | Mean MD for healthy subjects | t-value | p value |
| Thalamus | Right | 9.09 | 9.06 | 0.20 | n.s |
| Left | 9.07 | 8.94 | 0.66 | n.s | |
| Caudate | Right | 8.89 | 8.67 | 0.80 | n.s |
| Left | 8.44 | 8.45 | –0.05 | n.s | |
| Putamen | Right | 7.29 | 7.34 | –0.42 | n.s |
| Left | 7.27 | 7.21 | 0.65 | n.s | |
| Pallidum | Right | 7.43 | 7.35 | 0.55 | n.s |
| Left | 7.28 | 7.28 | –0.01 | n.s | |
| Hippocampus | Right | 11.92 | 10.65 | 2.62 | 0.015* |
| Left | 11.25 | 10.33 | 2.88 | 0.008** | |
| Amygdala | Right | 9.11 | 8.37 | 2.09 | 0.046* |
| Left | 8.66 | 8.08 | 1.22 | n.s | |
| Accumbens | Right | 7.65 | 7.63 | 0.16 | n.s |
| Left | 7.54 | 7.45 | 0.48 | n.s |
NS, not significant; MD, mean diffusivity; AD, Alzheimer’s disease *p < 0.05; **p < 0.01.
Table 5
Size of the clusters (voxel) obtained by voxel-based analysis of mean diffusivity with mask (thalami, hippocampi, both putamen, both amygdala) and without mask in MCI-due-to-AD patients versus healthy control
| Structure | Lateralization | Cluster size (voxel) | Coordinates | ||
| X | Y | Z | |||
| With mask | |||||
| Amygdala | Right | 20 | 18 | –4 | –16 |
| Hippocampus | Left | 104 | –28 | –36 | –8 |
| Right | 167 | 28 | –14 | –24 | |
| Whole brain | |||||
| Amygdala | Right | 241 | 26 | –2 | –18 |
| Hippocampus | Left | 339 | –28 | –14 | –28 |
| Right | 452 | 32 | –12 | –30 | |

