
Predictor-corrector models for lightweight massive machine-type communications in Industry 4.0
Abstract
Future Industry 4.0 scenarios are characterized by seamless integration between computational and physical processes. To achieve this objective, dense platforms made of small sensing nodes and other resource constraint devices are ubiquitously deployed. All these devices have a limited number of computational resources, just enough to perform the simple operation they are in charge of. The remaining operations are delegated to powerful gateways that manage sensing nodes, but resources are never unlimited, and as more and more devices are deployed on Industry 4.0 platforms, gateways present more problems to handle massive machine-type communications. Although the problems are diverse, those related to security are especially critical. To enable sensing nodes to establish secure communications, several semiconductor companies are currently promoting a new generation of devices based on Physical Unclonable Functions, whose usage grows every year in many real industrial scenarios. Those hardware devices do not consume any computational resource but force the gateway to keep large key-value catalogues for each individual node. In this context, memory usage is not scalable and processing delays increase exponentially with each new node on the platform. In this paper, we address this challenge through predictor-corrector models, representing the key-value catalogues. Models are mathematically complex, but we argue that they consume less computational resources than current approaches. The lightweight models are based on complex functions managed as Laurent series, cubic spline interpolations, and Boolean functions also developed as series. Unknown parameters in these models are predicted, and eventually corrected to calculate the output value for each given key. The initial parameters are based on the Kane Yee formula. An experimental analysis and a performance evaluation are provided in the experimental section, showing that the proposed approach causes a significant reduction in the resource consumption.
1.Introduction
Industry 4.0 [1] is typically defined as the next industrial revolution, characterized by the seamless integration of computational and physical processes. Paradigms such as Cyber-Physical Systems [2] or Artificial Intelligence [3] are usually referred to enabling technologies in future Industry 4.0 scenarios. However, current challenges related to Industry 4.0 technologies are closer to the hardware level than to knowledge or data management. Actually, how this seamless integration between the cyber and physical world may be achieved through currently existing sensors, actuators, programming languages and recognition technologies [35] is a major open question [4].
In general, ubiquitous platforms including thousands of hardware devices per square kilometer are deployed to monitor and control physical processes in a tight and real-time manner [61]. These devices are usually manufactured as sensing nodes whose computational resources are sparse and only enough to capture data and transmit it to a central gateway using point-to-point communications [5]. Feedback control algorithms, orchestration and resource allocation mechanisms, communication management protocols and other similar computationally heavy technologies are delegated to gateways, placed at the central point of a star topology network, and where more resources and available [6]. Also, with such several devices, human intervention is totally inefficient, and devices must operate autonomously. This also affects communications, which must follow machine-type communication (MTC) [7] standards and solutions.
One of the key problems in MTC is the way in which communications are secured. Although several powerful security technologies are currently available (elliptic curves, trust management, etc.), they are usually too computationally heavy for Industry 4.0 nodes [8]. In this context, hardware solutions are employed and, nowadays, Physical Unclonable Functions (PUF) are the most promising and popular solution among all existing proposals. PUF are hardware devices with unpredictable behavior, so its output (known as ‘response’) is unique for any given input (known as ‘challenge’) [9]. So, this output is a fingerprint that enables authentication and cryptographic applications with no computational cost. As this random behavior is inherited from uncontrolled factors during manufacturing, by now, responses cannot be predicted or replicated.
Many different PUF implementations have been reported, but currently, those based on silicon circuits are the ones more commonly employed in major industrial systems. For example, SRAM PUF chips are now commercialized by several leader semiconductor companies for edge-to-cloud securization in factories [36] and legacy SCADA systems [37]. In SRAM PUF, security solutions take advantage of the random differences in the threshold voltages of transistors making up the static RAM memories to create unique identifiers. When powered up, each memory cell will take its preferred state (zero or one), creating a unique, random, and unclonable binary pattern.
As, by now, PUF responses to challenges cannot be calculated or estimated, the only way to enable gateways to learn about the nodes’ PUF responses is a registration process [10]. During this registration process, PUF is tested, and all challenge-response pairs are stored in a key-value database accessed by the gateway. Then, gateways may look for the appropriate response for any given challenge.
However, Industry 4.0 is becoming increasingly massive, and paradigms such as 5G envision up to one million devices per square kilometer [11]. Although the resources are usually abundant, for such massive platforms, the memory usage is not scalable and information access and processing delays grows exponentially. Thus, massive key-value databases become very resource consuming, and can even produce congestion and unavailability of gateway [12] (because of the lack of memory for other computational processes and/or the huge delays in accessing such a massive database). Considering that gateways are placed at the central point of a start topology network, this finally causes Industry 4.0 to shut down. Then, new lightweight approaches are required to allow Industry 4.0 platforms to deal with secure massive machine-type communications.
Therefore, the objective of this paper is to develop a lightweight solution for secure massive machine-type communications (mMTC) in Industry 4.0 scenarios. The solution is based on predictor-corrector differential models, representing the challenge-response functions in PUF. Models are mathematically complex, but we argue that they consume less computational resources than current approaches. The lightweight models are based on complex functions managed as Laurent series, cubic spline interpolations, and Boolean functions also developed as series. Unknown parameters in those models are predicted, and eventually corrected, to calculate the output value for each given key. The initial parameters are based on the Kane Yee formula [31].
Briefly, the main novelties and advantages of this new approach based on algebraic methods are:
• Reduced computational resource consumption (memory and processing delay), This new algebraic technology can be implemented in several different scenarios, including those where edge devices have a (very) limited computational power.
• Improved scalability, enabling even future envisioned applications with up to one million devices per square kilometer.
• Enhanced flexibility and multi-PUF support. The proposed predictor-corrector model is very flexible and can be applied to all silicon-based PUF with no required software update or adaptation. Even different PUF technologies can coexists using the same software process, and PUF may change dynamically.
The remainder of the paper is organized as follows. Section 2 presents the state of the art in PUF modeling and mMTC management techniques. Section 3 presents the proposed solution, including the predictor-corrector method. Section 4 describes the experimental evaluation; Section 5 discusses the obtained results; and Section 6 concludes the paper.
2.State of the art
This section presents an overview of the currently reported mechanisms for PUF modeling and massive machine-type communication management, with a special interest in security solutions.
2.1Massive machine-type communications management
Among all the challenges introduced by 5G mobile networks and Industry 4.0 systems (both have similar requirements), mMTC is probably the least studied paradigm.
With up to one million devices per square kilometer, different works have identified four basic challenges to be addressed [22]: Quality-of-Service provision, physical access, transmission scheduling (including spectrum issues, transmission schemes, resource management, traffic characterization and low-power communications), and congestion management. In this work we describe an innovative transmission scheme for secure communications, considering resource consumption and management aspects too.
Anyway, all these issues are related to communication protocols or media resources. Thus, solutions such as new MAC protocols where access is much more multiplexes to allow all devices to communicate [23] have been reported.
Focusing on the security issues, works are sparse. Many different proposals on secure (not massive) machine type communications were reported in the past for 4G cellular communications [38, 39]. However, currently, authors are working on making next generation mMTC feasible at physical level (spectrum and energy management, traffic conformation, etc.) [40], and security technologies are not understood as a priority yet [41]. This is mainly because other primary challenges in mMTC are still open and prevent security solutions to operate correctly in real scenarios (for example, the mitigation of co-channel interferences, the accurate channel information capture, or the dynamic device management). Besides, reported security mechanisms are very low-level. Some works report new link-level protocols for massive access, where headers are calculated through physical security techniques [42]. While others propose innovative carrier selection algorithms, modulation schemes and array antenna designs [43] to enhance precision in the power radiation and protect massive communications against physical intruders.
But all these schemes present two basic problems. First, attacks at network or application level are not addressed, and mMTC implementing these physical security technologies are still vulnerable against network sniffing or spoofing attacks (among others). And second, physical security is very rigid, and requires the entire communication stack to get adapted to the characteristics and capabilities of the security layer. This is very inefficient and costly, while flexible security solutions being able to adapt to different scenarios, architectures and user equipment are preferred.
In this paper, on the other hand, we describe a new secure communication scheme which may be applied at several different levels (including link, network and application levels), with high flexibility, as it can adapt (even dynamically) to many hardware technologies (such as different types of microprocessors, sensors, actuators, single-board computers, etc.) and system architectures (from distributed computing schemes, to centralized star-topologized solutions and from isolated local infrastructures to cloud deployments).
But actually, these problems have been already studied by some authors. Thus, some lightweight authentication schemes based on random numbers can be found [28]. However, the results show that this approach is only feasible for applications where latency is not a critical parameter (500 ms is the expected value), and no evidence about the resource consumption in these mechanisms is provided. Similarly, device-type authentication mechanisms where unique devices’ fingerprints are obtained from spectrum patterns have been reported [44]. But in this approach, gateways must store every single device fingerprint, which introduces severe limitations in scalability (although this fact is not deeply studied). Moreover, cryptographic solutions for secure mMTC have also been reported [29], but results show that resource consumption still grows exponentially with the number of devices, although at a lower rate.
In fact, the impact of security schemes on infrastructure cost or size; or the resources these new approaches consume are not addressed. Only exploratory works on these issues, proposing some challenges and research opportunities, can be found for some specific scenarios (such as heterogenous networks) [24].
In that way, currently reported authentication and cryptographic technologies require large amounts of memory resources, and present scalability problems which may prevent them to be implemented in the most extreme and dense mMTC scenarios (i.e., one million devices per square kilometer). On the contrary, the new technology reported in this paper highly reduces the required memory consumption (up to 60%) and improves scalability achieving a linear complexity (with the number of user devices) instead of the traditional exponential evolution.
Finally, resource consumption reduction, currently, is only addressed from the data engineering perspective. Solutions for data compaction and aggregation in mMTC [25], cooperative techniques to manage massive data efficiently [26], and machine learning techniques to find relationships among all received information [27] and remove redundancies have been reported. Nevertheless, all these approaches cannot be applied to security solutions.
2.2Physical Unclonable Functions modeling
In the last ten years, many different types of PUF have been reported. From optical resonant rings [9] to resonant structures [10]. However, all these PUF are very complex and must be complemented with heavy-measure instruments. On the contrary, PUF based on time domain or memory are supported by silicon circuits and are easy to integrate in Industry 4.0 sensing nodes [9]. This section is focused on those kinds of PUF.
Silicon-based PUF take advantages of small and random variations within materials, which cause circuits to response slightly different to the same excitation at electrical and physical level [46]. Signals may propagate at different speeds through the material, or thresholds voltages may change. Although these variations are usually very small to be noticeable, when an enough number of silicon-based devices are connected, the global effect can be easily detected. For example, in a common arbiter PUF one hundred and twenty-eight two-to-one multiplexers are connected in cascade to make noticeable the different speed propagation through the two channels [45].
In general, PUF are characterized by three basic properties: reliability, uniqueness and randomness [13]. Reliability forces a strong PUF to generate the same response to the same challenge every time that it is posed in equivalent conditions. Thus, a deterministic equivalence function could be defined between challenges and responses. However, uniqueness implies that every PUF circuit has a totally different behavior. So, those equivalence functions cannot be generic, and randomness causes PUF to be erratic (and obviously non-linear), so close challenges cannot generate similar responses. Actually, all responses in a strong PUF should be statistically independent.
However, practical implementations of PUF meet these characteristics at different levels. The intra-chip distance (in bits) measures how different are responses when the same PUF is excited several times with the same challenge. While inter-chip distance (also in bits) measures how different are the responses when different PUF are excited several times with the same challenge. Considering a PUF implementation with a 256-bit response, the maximum inter-chip distance is 150 bits [47]. So different PUF, even in the best situation, have around 100 bits (almost 40%) in common. On average inter-chip distance is 128 bits (50%), but it can be as small as 100 bits (so different PUF may share up to 60% of bits). However, intra-chip distance has a much better behavior [47]. The average distance is 20 bits (around 8% of the key length), and the maximum is only 30 bits (less than 12%), while the minimum value for intra-chip distance is very close to zero. Then, the challenge-response relation can be considered strong and deterministic.
This context, where intra-chip distances are reduced, but inter-chip distances (although higher) allow different PUF to share 50% of bits (on average) makes mathematical models for PUF feasible [16]. Different authors have addressed this open issue from different perspectives, although works on this topic are still sparse.
Table 1
State of the art in PUF modeling
| Reference | Approach | Model type | Supporting technology | Comments |
|---|---|---|---|---|
| [14] | Attack | Generic | Machine learning | High computational cost |
| [15] | Attack | Generic | Machine learning | High computational cost |
| [18] | Attack | Generic | Machine learning | High computational cost |
| [19] | Attack | Generic | Machine learning | High computational cost |
| [20] | Attack | Specific | Numerical model | Valid only for some PUF |
| [13] | Analysis | Specific | Numerical model | Valid only for some PUF |
| [16] | Attack | Generic | Algebraic framework | No challenge-response function provided |
| [17] | Attack | Generic | Algebraic framework | No challenge-response function provided |
Considering the potential existence of a strong and deterministic mathematical relation between challenges and responses, but its non-obvious analytical expression, several authors have proposed supervised learning technologies to capture and replicate the behavior of PUF. Models for bistable ring (BR) PUF [14] or twisted bistable ring (TBR) PUF [15] (both PUF based on feedback loops made of multiplexers and NOR gates which must achieve a stable state – the key-) have been reported. Typical solutions are based on support vector machines (SVM) [18]. Some authors have even analyzed different types of algorithms (SVM, genetic algorithms, etc.) to identify the best learning technique to replicate the behavior of PUF [19].
However, these models present some problems. First, they are useful (accuracy above 95%) as attacking technologies [20], where they must only replicate the behavior of one specific PUF circuit. But when they are employed to model the behavior of an entire PUF technology (several different circuits), accuracy highly decreases and SVM models show an error slightly below 50% (47%, approximately, to be precise) [15]. Even, for some authors, that means the PUF technology is resistant to machine learning models [21]. Second, these modeling technologies are not flexible, and different techniques and models must be deployed to precisely replicate different PUF behavior. Then, in mMTC scenarios, major software updates and algorithm trainings are needed when new PUF are deployed. This fact makes it difficult the dynamic evolution of hardware and the coexistence of different PUF technologies.
On the contrary, the proposed prediction-corrector model in this paper shows an average accuracy up to 50% better than SVM-models (depends on the configuration). Besides, the proposed solution is very flexible and can be applied to all kinds of silicon-based PUF. The model, thanks to the correction stage, is continuously refined with no additional effort, so no software update or new training is required.
When models fail because of a reduced accuracy, many authors propose the creation of large key-value databases [48] where the challenge-response pairs are maintained, but this approach is not scalable. In very dense mMTC scenarios (up to one million devices per square kilometer) those databases would be massive and searching times too high to be compatible with communication streams. In this approach, actually, memory consumption and processing delays increase exponentially with the number of devices [49], contrary to the new algebraic model proposed in this work where a linear evolution is achieved.
A second group of PUF models are based on physical laws. In this case, models of the physical phenomena supporting the PUF behavior are proposed. Typically, models describe the behavior of transistors and other silicon-based elements [13]. These models are considerably lighter than SVM, but they require a deep knowledge of PUF implementation (voltage thresholds with an extreme precision, conductivity, magnetic permeability, etc.). That may not be realistic in most massive scenarios, where different hardware technologies coexist and mMTC users cannot operate an electronic laboratory to acquire all this information from every single device. In commercial and engineering applications this approach is not feasible.
Finally, some authors are reporting exploratory work on how generic models could be achieved [16]. In this approach, no analytic mathematical model is proposed, but a general algebraic framework that describes the properties that these models should meet and how feasible they are [17]. In general, the results prove that these models are achievable, although they do not clearly show how they can be identified or managed. In this paper we explore and advance in this direction. We propose a general model, based on different lightweight mathematical expressions. It cannot generate responses with full precision, but it can be automatically adjusted through a prediction-correction process.
Table 1 summarizes previous discussion.
3.A predictor corrector model for mMTC
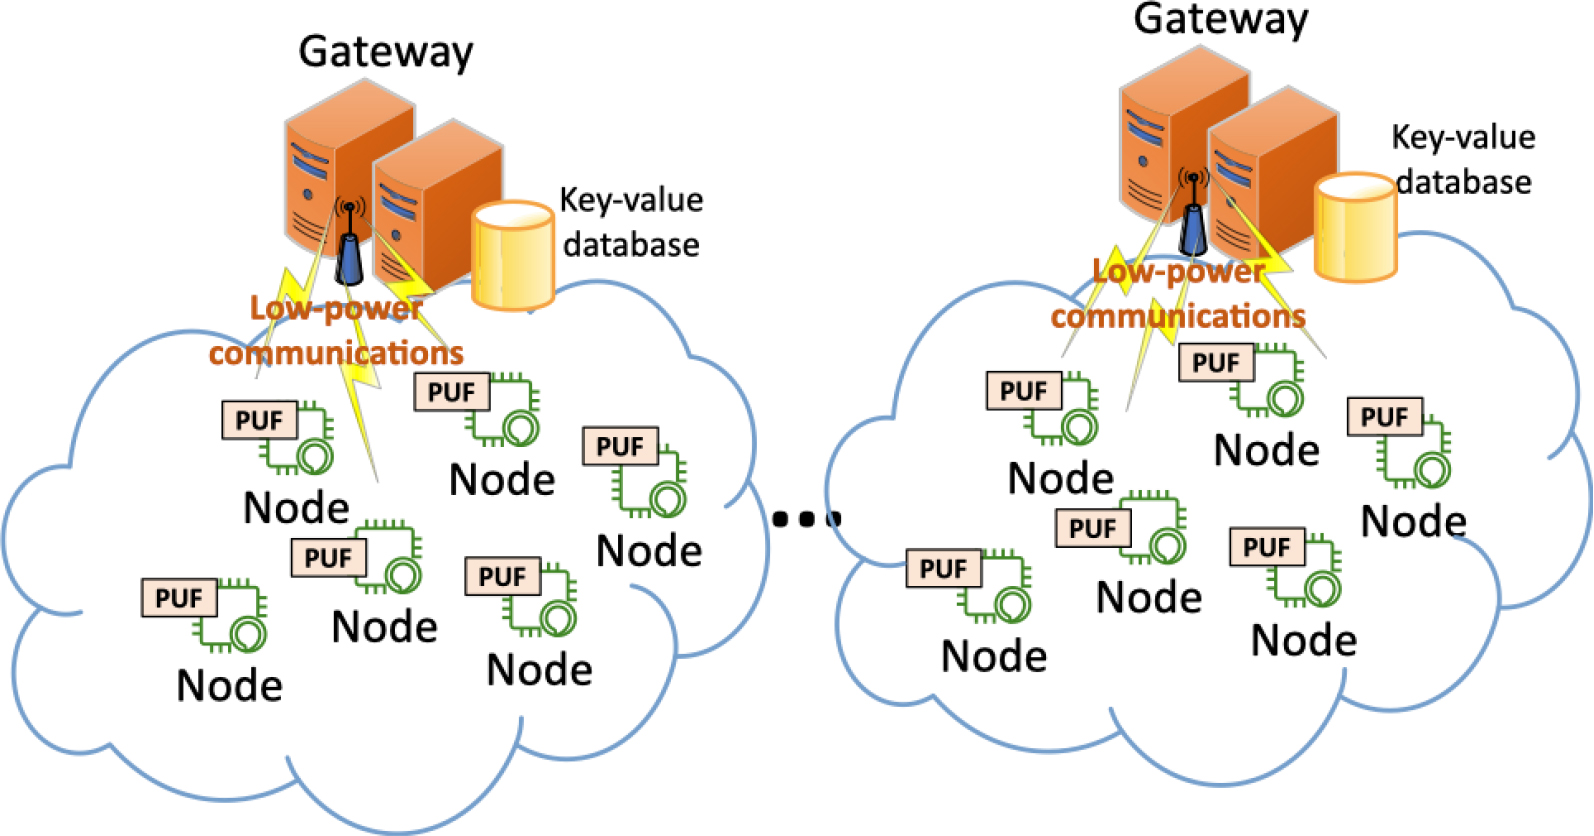
In this Section, we propose a predictor-corrector model to enable lightweight secure mMTC. The mathematical model and algorithm described are supported by Industry 4.0 architecture in Fig. 1.
In our scenario, Industry 4.0 systems consist of up to one million devices per square kilometer. Thousands of devices are connected through low-power communications to one gateway. Devices (or sensing nodes) are resource-constrained and employ Physical Unclonable Functions to generate keys and protect communications. On the other hand, gateways have a high computational power and access to great data storage capabilities. Using those resources, gateways can execute complex mathematical operations and maintain in a key-value database some challenge-response pairs (or, eventually, the full catalogue) of the PUF of nodes.
The approach proposed in this paper requires minor and negligible changes in the sensing nodes, so their resources are not affected. While, in gateways, we highly reduce the memory consumption and processing time, by replacing full catalogues in databases by complex predictor-corrector mathematical models.
In general, PUF can be analyzed at three different abstraction levels. First, as silicon-based materials under an electromagnetic excitation [13]. Second, as binary (Boolean) logical circuits managing binary words [16]. And third, as numerical mathematical functions [15] (this last one is the most common approach in machine learning models and other similar techniques). However, all these approaches face the same challenge: it is extremely complicated to accurately model the entire PUF behavior, and all the variables that affect it, using only techniques at one abstraction level. Some phenomena, such as voltage thresholds or signal filtering, are very easily described using electromagnetic and signal propagation laws. Nevertheless, some other, such as the cascade connections of logical devices, are more precisely analyzed using binary circuits. Moreover, for example, the inference of PUF responses for similar challenges shows a lower error when using mathematical functions (because of the extremely high precision required to physical models to distinguish two very close challenges and responses).
Figure 1.
Industry 4.0 architecture.
This problem, at the end, is the cause of the poor performance of these models (accuracy is around 50% [15] when they operate independently). As well as the reason why massive key-value databases, with an exhaustive description of all challenge-response pairs, are the common feasible solution for real mMTC scenarios (despite their resource consumption and scalability problems).
As a possible solution, in this paper we propose a combined model, where each PUF item is analyzed in parallel using these three abstraction levels. First, models operate independently and, later, results are aggregated so they can compensate the inaccuracies of each other. This enables us to reduce the complexity and computational cost of models, as they do not have to describe all the variables affecting the PUF behavior. For example, we can use algebraic models instead of machine learning techniques, which are much more flexible and allow the coexistence of different PUF technologies in the same scenario.
But the actual accuracy and significance of every model is unknown a priori. Then, a predictor-corrector scheme is deployed in order to refine models and weights continuously according to real exchanged challenge-response pairs between user devices and gateways. This approach allows the solution to learn from the hardware platform and adapt to it dynamically, without heavy training processes or major software updates.
Although each model could manage different precisions (word lengths or information bits), in this work we are assuming all three models produce responses or results with the same number of true information bits (in real applications, and considering the state of the art, 256 bits would be a usual number). Later, using different weights during the aggregation, the number of significant figures in each model may be limited if needed (never increased). In any case, the final combined result will have the same number of true information bits than every independent model (for example, 256-bit responses in a common real mMTC application).
Figure 2.
Proposed predictor-corrector model.
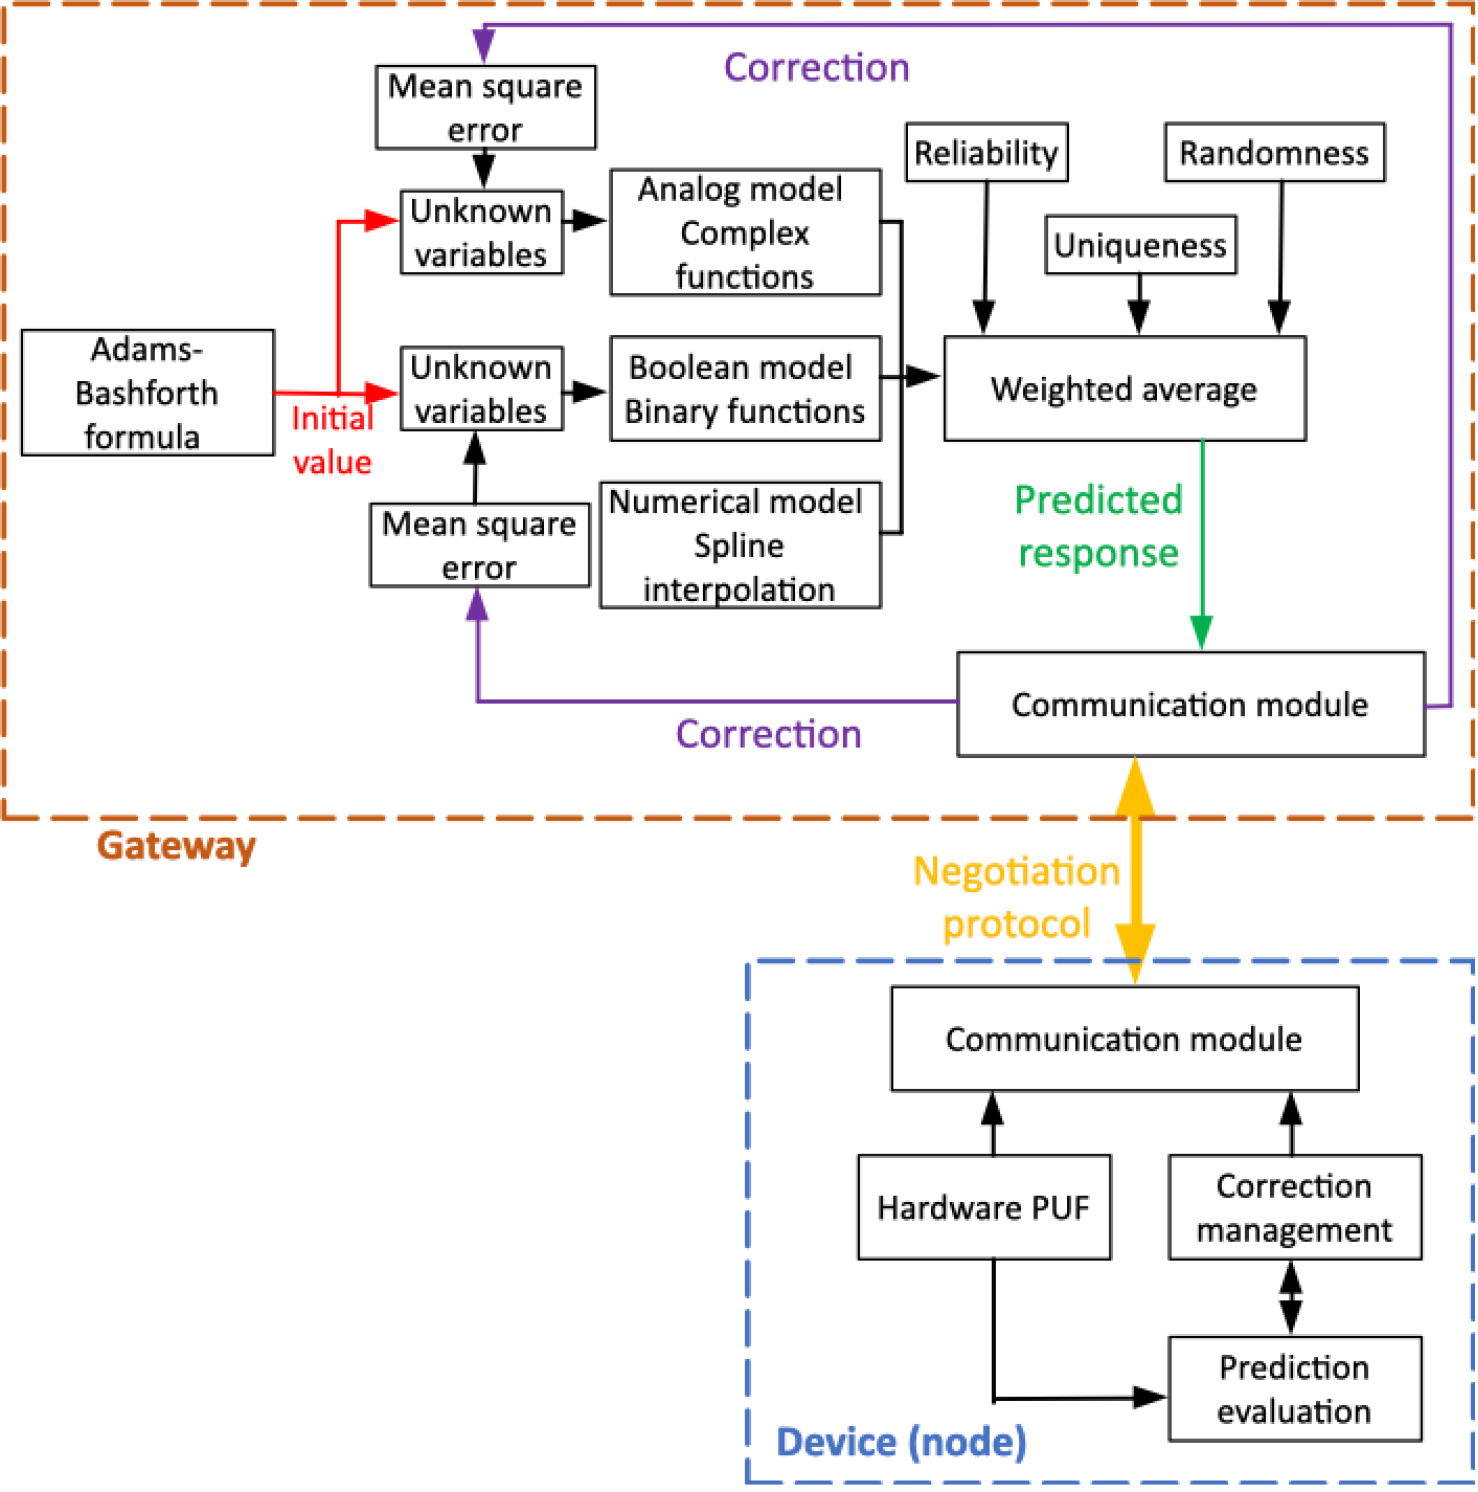
Figure 2 shows the general scheme for the proposed predictor-corrector model. In our model, PUF responses to challenges can be predicted by combining three different models: an analog model, a Boolean model, and a numerical model. In the analog model, PUF are understood as a physical material media. Analog signals that excite the material are represented through the complex envelope, whereas the PUF response is estimated through an unknown complex function. In the Boolean model, PUF are represented by multidimensional binary inputs (response), and Boolean unknown functions generating a binary response. Finally, numerical models understand PUF as a complex real function. Challenges and responses are represented using real numbers, and responses are estimated through an interpolation scheme.
All unknown functions include a collection of unknown variables which may be initially estimated using the Kane Yee formula (prediction) [31] and later corrected and refined through the Mean Square Error (MSE) algorithm (correction).
These three models, in order to generate the final predicted responses, are combined in a weighted average where the reliability, randomness, and uniqueness of each model are taken into account.
Finally, the prediction-correction process is not unilateral and requires the participation of sensing nodes. These nodes must negotiate to identify whether the gateways’ predictions are good or should be corrected according to their hardware PUF. A negotiation protocol is proposed to address this final issue. In this protocol, devices (nodes) will perform just two simple mathematical operations, to determine if the predicted value is acceptable or not.
The next subsections describe all details about each one of these three components.
3.1Analog model: PUF as a propagation media
Every time-domain or memory-based PUF consists of an electronic silicon circuit. This circuit may be analyzed from different perspectives, but at a physical level it is a silicon material under an electromagnetic excitation. This electromagnetic excitation
(1)
(2)
The material will generate a response
Reliable PUF are time invariant and then, the relation between the challenge and the response is a function
(3)
However, passband signals include two types of information: frequency information and amplitude information. Thus, every passband function may be represented through two new complex subsignals Eq. (4): the complex envelope
(4)
(5)
(6)
Figure 3.
In-phase signal calculation scheme.
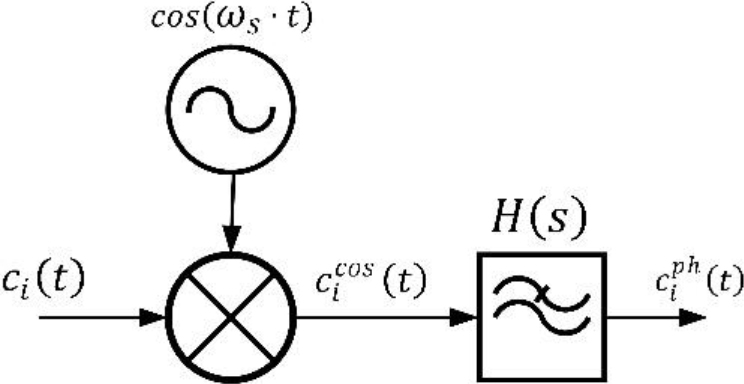
To calculate the complex envelope two baseband signals only with amplitude information must be obtained: the in-phase signal
(7)
Many different filters could be used, but we are looking for a precise response estimation, so we are using a Butterworth filter as it does not show distortion in the pass band. The bandwidth will be
(8)
(9)
If required or desired, different filter types (Chebyshev, elliptical, etc.) could be employed too. Although distortion may appear in the pass and/or the stop band, and that might affect the model’s precision (i.e., the distance between two PUF responses in one PUF item associated to two very close challenges), weights during the aggregation stage (see Section 3.4) will mitigate this impact. As we’ll explain later (see Section 3.4) weights are proportional (exponentially) to the inter-challenge distance (37), and accurate models are highly strengthened. So, the impact of any distortion in the combined final result (prediction) would be negligible.
Using the convolution and the Laplace inverse transform the in-phase and quadrature signals may be calculated Eq. (3.1).
(10)
On the other hand, the frequency signal
(11)
(12)
The same process may be applied to response signal
(13)
With this approach, function
At this point, functions
(14)
(15)
(16)
(17)
(18)
Thus, unknown function
On the other hand, Taylor series will be employed to develop real function
(19)
The previous model is adequate for analog signals. However, the challenges in gateways are not managed as electromagnetic waves, but as a binary number
(20)
(21)
3.2Boolean model: PUF as a binary function
As time-domain or memory-based PUF consists of a digital electronic silicon circuit, it can be modeled through Boolean functions and relations. In this scenario, challenges are represented by binary numbers
(22)
(23)
To define our mathematical model, we are developing the function
We consider the definition of positive cofactor
(24)
(25)
Equally, any derivation
At this point and considering the Reed-Muller expansion Eq. (27), we can propose an expansion as a binary polynomial for function
(26)
(27)
(28)
(29)
In this case we must remember that coefficients
Those coefficients will initially be estimated through the Kane Yee formula (see Section 3.5) and the transformation functions
3.3Numerical model: Cubic spline interpolation
Boolean models (see Section 3.2) are lightweight and very easy to manipulate and compute. However, they may cause great transitory fluctuations in the PUF response predictions. As the number of bits representing the challenge,
To reduce this effect, in our proposal, the Boolean model is combined with a numerical model. In this approach, binary numbers representing the challenge
A similar approach to those described in Sections 3.1 and 3.2 could be employed, but then the obtained model will suffer similar problems to those described ones. The aim of this numerical model is to compensate these inefficiencies. To do that we are using an interpolation technique based on cubic splines, which is characterized by its smooth behavior.
A spline is a differentiable curve
(30)
(31)
But this curve
(32)
In this case, all these unknown variables may be calculated using the same restrictions described above (continuity and derivable). They define a system with
(33)
On the other hand, in order to correct and improve the model, the value of
| Algorithm 1: Spline solving algorithm |
|---|
| Input Known |
| Parameters |
| Output Unknown parameters |
| for |
| |
| |
| end for |
| |
| |
| for |
| |
| |
| end for |
| for |
| |
| end for |
When the spline
(34)
3.4Prediction algorithm
At this point, when a new prediction must be made, three different responses are obtained: the one from the analog model
For each PUF item, a set of three different models (and responses) is generated; but as all three models refer to the same device, they are not independent but moderately correlated. This correlation, besides, increases, as the prediction-correction mechanism refines the models and all of them get closer to the real PUF item’s behavior. Therefore, the combined result of these three responses does not vary randomly but converges to a final value where models can compensate and mitigate the inaccuracies of each other.
Thus, before generating the final and global response
(35)
Weights
PUF noise
(36)
The inter-challenge distance
Besides,
(37)
In general, the probability of two independent responses
Finally, the PUF stability
(38)
Now, in order to calculate each weight
This function must be monotonically non-decreasing in the interval
(39)
With these requirements, we propose an exponential function as the mapping function Eq. (40). In this function we are considering three real parameters
(40)
(41)
(42)
3.5Correction process
Figure 4 shows a flow chart for the correction process in the proposed predictor-corrector model.
This process starts with an initial configuration stage. At this stage, probably carried out before node deployment, a real and physical challenge-response pair
After that and before any transmission is allowed, the predictor model must be defined. To do that, parameters
These initial
However, the complexity of the hardware structure in most PUF make quite impossible to solve this problem in an analytical manner. Therefore, numerical methods are needed. In our predictor-corrector model we are using the Kane Yee formula.
The Kane Yee formula [31] is a numerical method for initial boundary value problems based on finite differences in the time domain (FDTD). It was specifically designed for solving the Maxwell equations, by replacing spatial and temporal derivatives using central finite differences.
Finally, as said before, to calculate parameters
Regarding functions
(43)
(44)
This approach is very scalable. Different strategies could be employed to solve this optimization problem Eqs (3.5–44), but even classic methods can achieve a result in a few tenths of a second [55]. In that way, only one gateway could manage up to ten thousand devices with a key renovation period
Anyway, MSE (minimization) is a generic algorithm, but the proposed predictor-corrector scheme allows the integration of other optimization solutions, adapted to the characteristic of specific Industry 4.0 scenarios. For example, the Harmony search algorithm [53] might be implemented in scenarios where the pitch adjustment and/or the harmony memory consideration rules make sense.
Once all these coefficients are obtained and the models are set up for the predictions, the system may initiate mMTC. To maintain a high security level, secret keys are renovated each
Figure 4.
Correction algorithm.
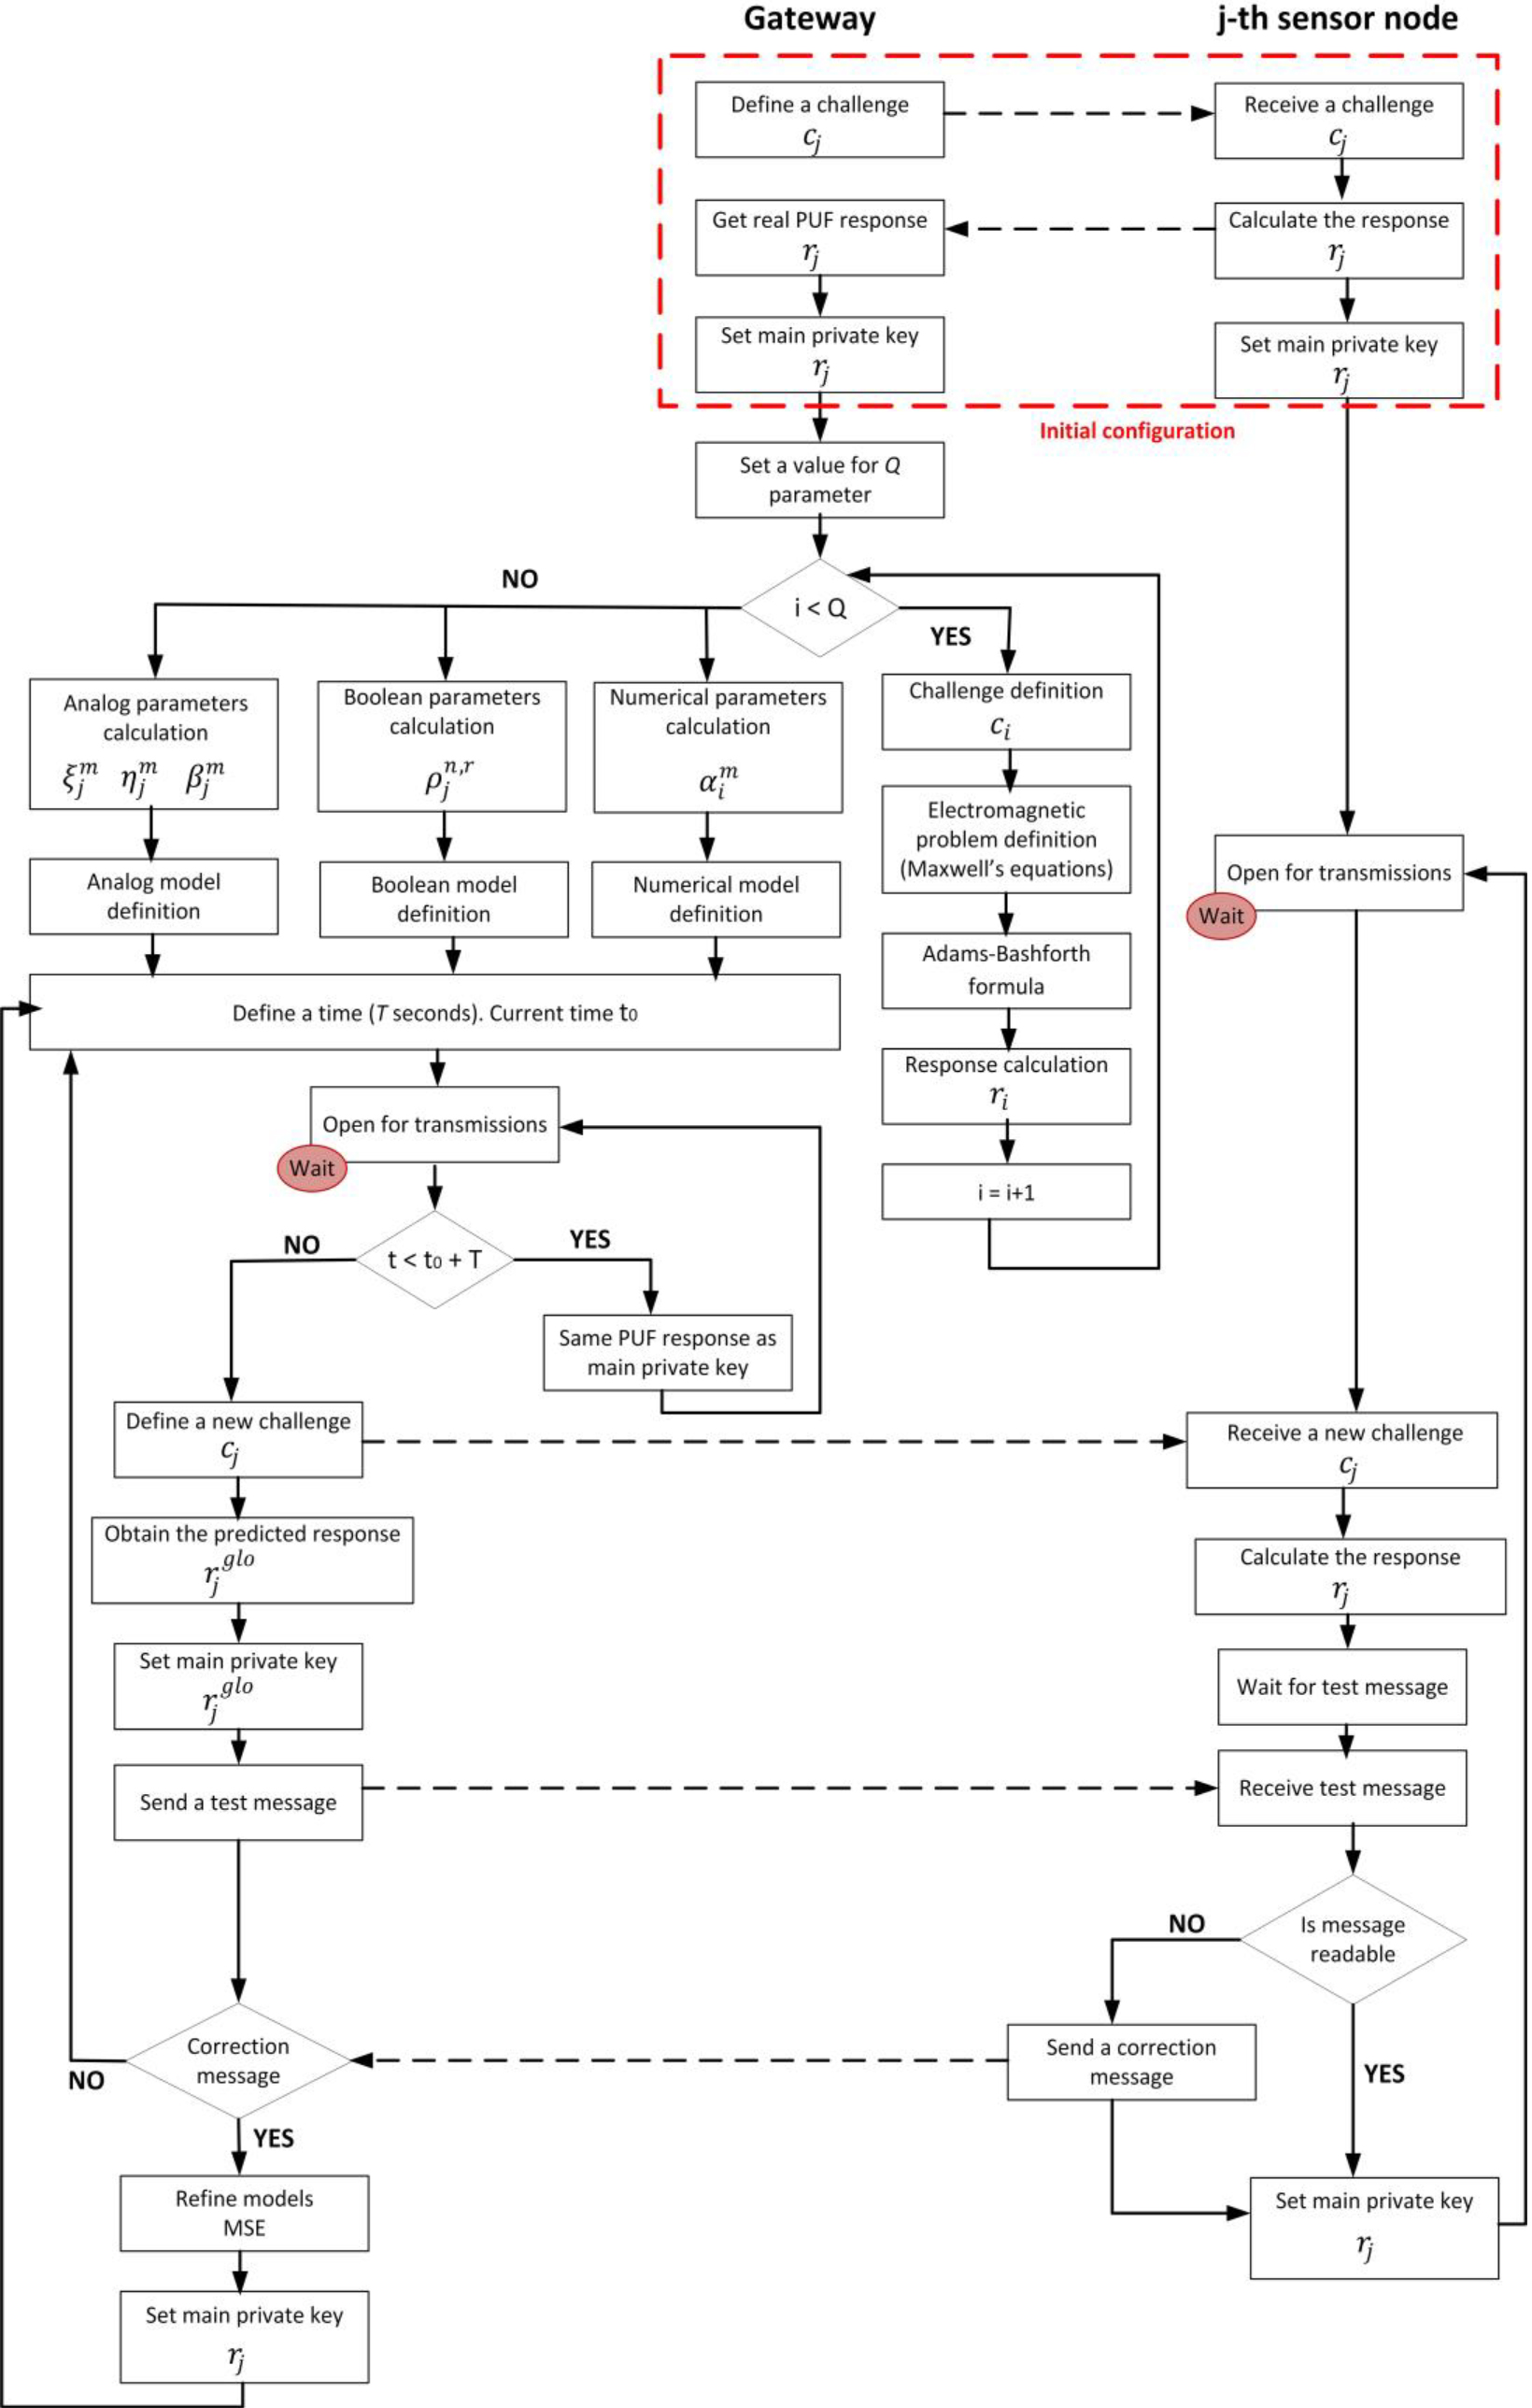
Figure 5.
Proposed data formats for the test message and the correction message.
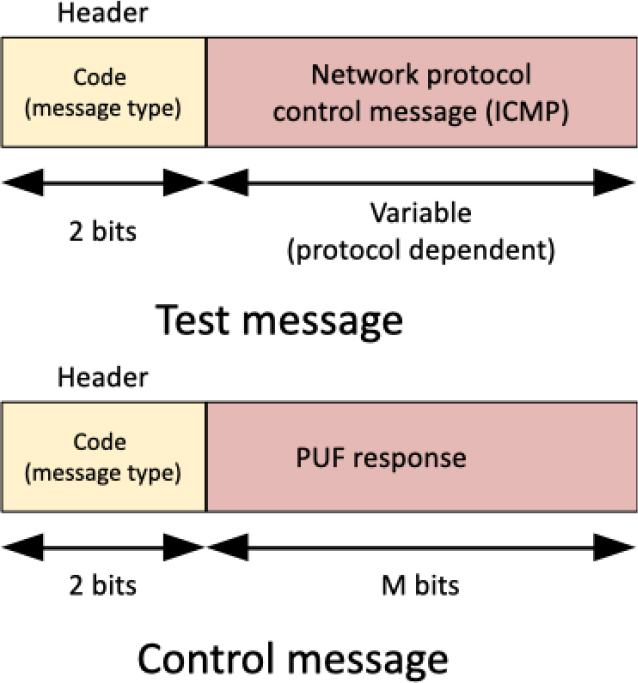
Before applying any change, the sensor node waits for a gateway test message. The “open for transmissions” state is the waiting point (and the end of the natural flow of the proposed correction algorithm for user devices too). See Fig. 4. This message is encrypted using the predicted response
If the control message is decrypted by the node, the predicted response is correct, and the secret key is updated. If control message is unintelligible, thus means that the predictor model has made a mistake and it must be corrected. A correction message is sent to the gateway. This message contains the correct response
After receiving this message, the gateway recalculates all parameters in the analog, Boolean, and numerical models, by refining the calculation of models’ parameters Eqs (3.5–44) and the weights
The secret key is finally updated to the new PUF response and mMTC are available with the new security configuration.
4.Experimental validation
In order to evaluate the proposed technologies for lightweight mMTC, an experimental validation was carried out. The experimental validation was mainly based on simulation scenarios. Using simulation tools, it is possible to evaluate very precisely the performance of the proposed predictor-corrector scheme, guaranteeing exogenous phenomena, such as noise, delays, or transmission errors, do not affect the results. Besides, using simulations, it is possible to run and evaluate all algorithms in their original implementation, without any modification to extract measurements, communicate to the data repository, etc. Simulation tools can monitor the entire scenario behavior unobtrusively.
In order to guarantee that simulation results represent accurately the performance of a real deployment, hardware devices and sensor data are not computational models but replay processes fed by repositories with real physical information coming from real deployments (more details are provided below).
The proposed validation consisted of two different phases: The first one is focused on a numerical analysis of the proposed solution, while the second one was based on a performance analysis.
All simulations were supported by a scenario that describes an Industry 4.0 application, where mMTC must be used. Three different sensor nodes were considered in the simulation: temperature sensors, quality air sensors and humidity sensors. The scenario represented a large infrastructure, such as a production center with several production lines, ovens, etc. The simulated scenario had an area of 4000 square meters, and different device densities were considered in different experiments (see Section 4.2). Twenty gateways were considered in this scenario, each one managing all devices deployed in a region of 200 square meters. Regions covered by different gateways did not overlap.
All sensor nodes and gateways were based on a model that represents a real device. The sensor node model represented an ESP-32 device with different peripherals. Some nodes were provided with the LM35 temperature sensor. This is an analog sensor, with high precision, to measure temperature using the Celsius scale. Other nodes were provided with the DHT-11 humidity sensor. This is a digital sensor that measures the amount (percentage) of vapor in the air and uses an eight-bit word to codify the result. Finally, some other nodes were provided with the CCS811 air quality sensor. This is a digital sensor with an I2C interface, which monitors the Volatile Organic Compounds (VOC) and the equivalent carbon dioxide reading (eCO2). On the other hand, the model for gateways is based on a Linux server with 50 GB RAM and 10TB of long-term storage capacity.
In order to ensure that the simulation scenario represent accurately a real physical deployment, sensor data are not generated by a computational model, but they are “reproduced” by a replay process using real information coming from a real Industry 4.0 deployment implementing the same sensors and technologies [59].
Regarding PUF, three different implementations, based on different technologies, were randomly associated to sensor nodes. Those technologies were: a multiplexer-based arbiter PUF [32], the butterfly PUF based on D flipflops [33] and a magnetic PUF based on exchange bias effect [10]. In this case, to preserve the random, reliable and unique behavior of original PUF, nodes were provided with a catalogue of challenge-response pairs taken from real measurements over physical PUF implementations.
To perform the experiments, the simulation scenario was implemented and executed using MATLAB 2017a software. All simulations were performed using a Linux architecture (Ubuntu 20.04 LTS) with the following hardware characteristics: Dell R540 Rack 2U, 96 GB RAM, two processors Intel Xeon Silver 4114 2.2G, HD 2TB SATA 7,2K rpm. All simulations represented an operation time of seventy-two (72) hours. Each simulation was repeated twelve times, and final results were obtained as the average of all partial results. Deviations or mean errors are not discussed unless they go above the standard limits for this kind of experiments and their value, then, turns relevant. Typically, deviations up to 10% around the average value are not significant and can be associated to common experimental errors.
Some variables and parameters in the proposed model were employed as independent variables during the experiments, but some other had a fixed value for the entire experimental phase. Table 2 shows the configuration parameters and their values.
The proposed values were obtained through a heuristic process, where different parameter sets were tested until the entire predictor-corrector scheme achieved its optimum operation point (although we cannot guarantee it in its global optimum configuration). All these parameters are not correlated and can be changed independently.
Variables not included in Table 2 will be employed as control parameter in the experiments.
Table 2
Configuration parameters
| Parameter | Value | Parameter | Value |
|---|---|---|---|
|
| 10 bits |
| 1 MHz |
|
| 10 bits |
| 0.1 hour |
|
| 5 |
| 10 seconds |
|
| 5 |
| 12 |
|
| 5 |
| 15 |
4.1Numerical analysis: Methodology
In order to study the behavior of the proposed solution from a numerical point of view, the quality of predicted responses was monitored, as well as the quality of the correction process. To do that, we monitored four variables: non-corrected correct predictions, corrected correct predictions, non-corrected wrong predictions and corrected wrong predictions. In addition, for all these groups and predicted responses, the normalized Hamming distance between the real response and the predicted one is also measured.
These variables were monitored both as a global parameter for the entire simulation scenario, but partial studies for different types of PUF were also done. The experiment was repeated for different values of
All those variables were calculated offline, as the proposed predictor-corrector algorithm does not have information about which predictions are truly correct or not while running. Even less about corrected correct predictions and non-corrected wrong predictions. For the correction algorithm (see Section 3.5) the only knowledge available is which predicted responses can actually decrypt the correction message coming from the
Using those variables, the following statistics were calculated to validate the behavior of the proposed corrector scheme: sensitivity, specificity, precision, and accuracy. On the other hand, in order to evaluate the behavior of the predictor model, we employed the mean normalized Hamming distance between real and predicted responses and the correct prediction rate.
Ideally, these results should be compared to other previous models (SVM models, for example), but that was not feasible in this case. Mainly, because machine learning models require large datasets to be trained, and we lacked that resource for the PUF items and technologies under consideration. Other datasets could be employed, but then two critical problems emerge. On the one hand, comparison would not be scientifically relevant. And, on the other hand, previous works typically employ datasets describing only one PUF technology; while in our approach we would like to evaluate and highlight its flexibility to operate with several PUF technologies at the same time. We faced a similar situation with physical models, as we could not determine the value of some very relevant parameters in those models such as the voltage threshold of transistors.
Finally, the probability density function (PDF) of PUF responses is also calculated for all three PUF technologies and the proposed predictor-corrector model. PDF is obtained calculating the normalized histogram for all the challenge-response pairs generated during the simulation. Overlapping and comparing the PDF for the real physical PUF, and the PDF for the proposed predictor-corrector algorithm, we can identify biases or patterns to be removed from the proposed models in order to increase and improve their accuracy and performance.
4.2Performance analysis: Methodology
The main characteristic of the proposed solution is its computationally lightweight implementation, and, besides, its scalability, which must fit the requirements of mMTC.
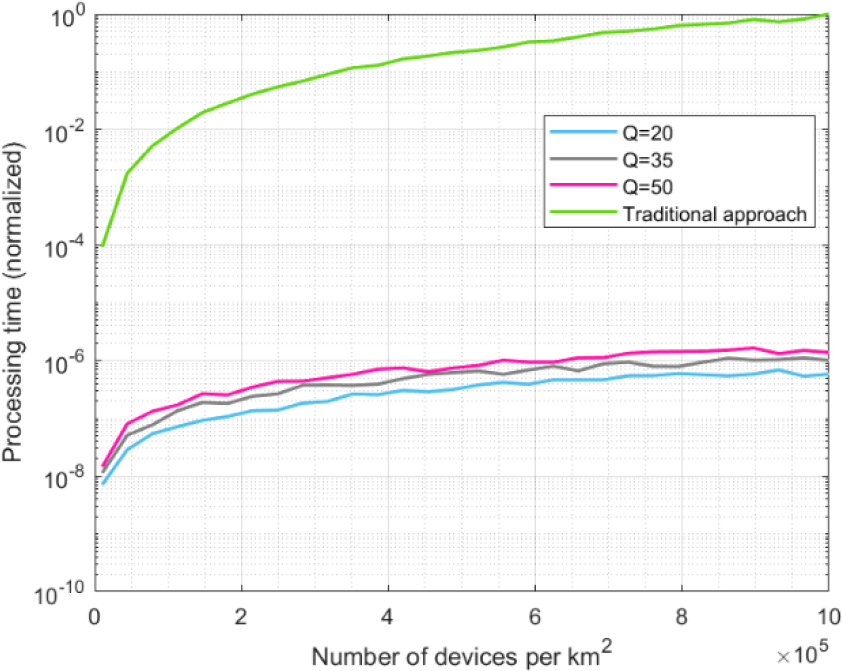
Thus, in this second phase, we evaluate two different variables: the memory usage of the proposed predictor-corrector model in the gateways and the computation delay in the gateways. We are also analyzing their evolution with the number of devices in the scenario in order to study the scalability. The experiment was repeated for different values of
On the other hand, we will compare the results obtained with the processing delay and memory usage of the traditional approach, based on key-value databases were all the challenge-response pairs are stored.
Finally, we are proving some results from real devices. The proposed corrector algorithm was implemented on a hardware ESP-32 device. The memory usage and the processing time required by the proposed scheme are monitored to ensure it matches the reduced capacities of sensor nodes.
5.Results and discussions
In this section we present and discuss the results from the experiments described in Section 4. Section 5.1 introduces and analyzes the main results, while Section 5.2 discusses the limitations of the proposed technology, considering the previous results.
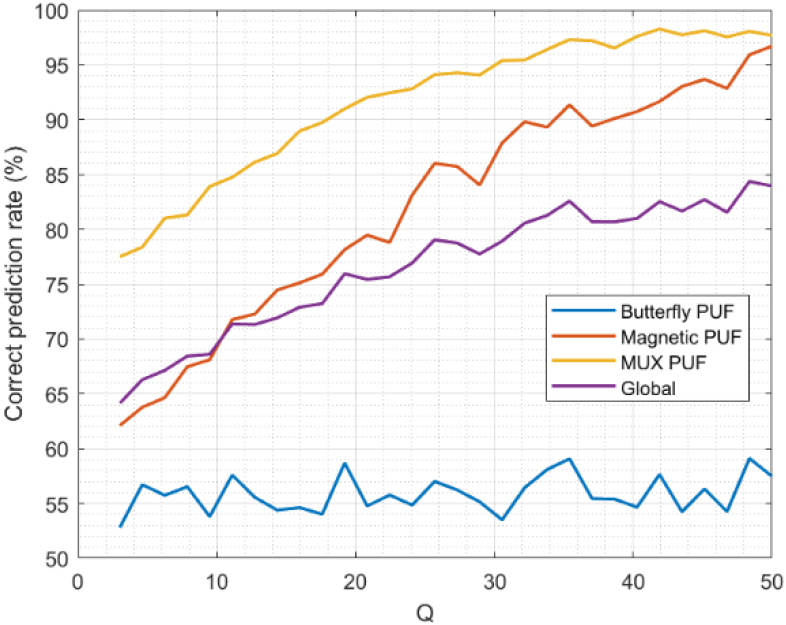
Figure 6.
Correct prediction rate.
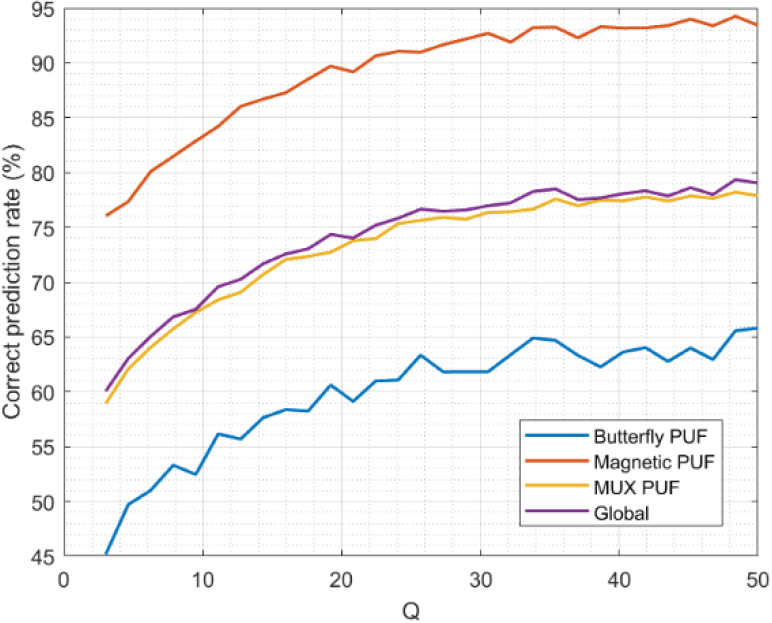
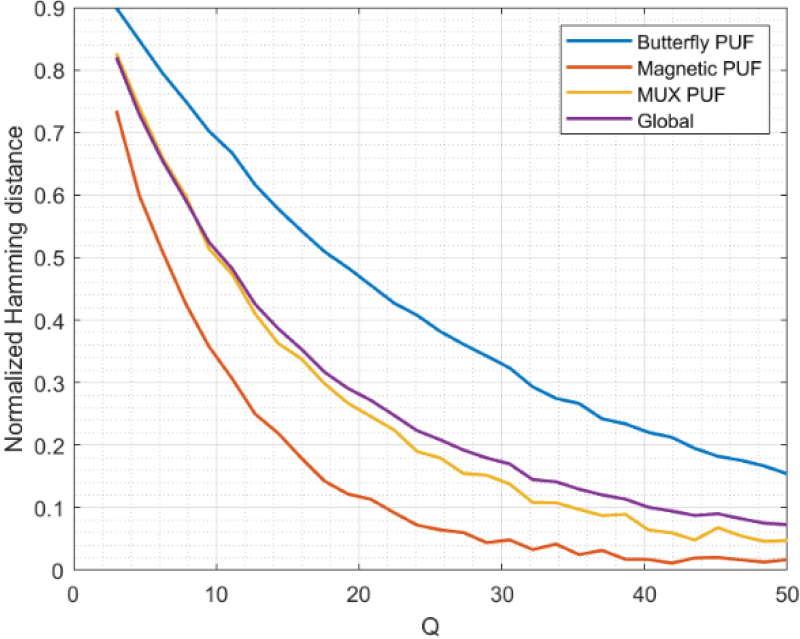
Figure 7.
Hamming distance.
5.1Experimental results
First, we discuss the results from the numerical analysis. Figure 6 shows the correct prediction rate for the different PUF technologies and the global results for the entire scenario.
As can be seen, the correct prediction rate increases as the value for
Figure 8.
Sensitivity.
The long-term correct prediction rate for the proposed model is around 78%. This includes all the historical predictions, but it is expected the correct prediction rate to be lower at the first operation moments and, as time passes, achieve this value. However, this rate is not the same for all PUF technologies. Magnetic PUF shows a correct prediction rate very high, around 94% at long-term. That’s because Maxwell’s laws with very simple boundary conditions (materials are usually parallelepiped) are enough to model this type of PUF technologies in a very exact manner. While the Butterfly PUF model, as this PUF is an unstable digital circuit based on feedback oscillating loops, is not able to achieve that rate, and the long-term correct prediction rate is around 63%. Finally, the MUX-based arbitrator PUF is a balance. Their behavior is stable, but the initial and boundary conditions are complex. In general, the model for MUX-based PUF shows a correct prediction rate (77%) very close to the aggregated global results for all PUF technologies. In conclusion, the proposed predictor model has a good behavior. Most of the predicted responses are correct, so the correction process must be triggered only in approximately 22% of cases. This will help our approach to be lightweight, more scalable, and much more efficient than traditional mechanisms for secure mMTC.
Similar results and conclusions are obtained if we go through the Hamming distance (see Fig. 7). As can be seen, the distance tends to reduce as the value for
Figure 8 shows the sensitivity of the proposed predictor model. As sensitivity is greater than 80%, it means that, in the worst case, only 20% of correct predictions are considered wrong predictions. As communications in Industry 4.0 are envisioned to be ultrareliable, this problem is not quite relevant, but it is still present. Actually, if we focus on a more realistic situation (
Contrary to the correct prediction rate, in this case, MUX-based PUF is the technology showing the lowest sensitivity. This may be explained by the nature of these PUF. As it is based on delays, responses are not fully reliable for long periods: as materials degrade, the temporal response changes. Therefore, although the predicted response may be correct, the sensor node may not be able to decrypt the test message using the physical PUF response, triggering the correction process. This effect, in any case, is present in any infrastructure based on arbiter PUF and must not be identified as a weakness for the proposed solution.
Figure 9.
Specificity.
On the other hand, in Fig. 9 we display the results obtained for specificity. One relevant observation is the constant value we obtain in specificity for Butterfly PUF. In this case, the specificity is around 55%, regardless of the value for
Regarding magnetic and MUX-based PUF, specificity does evolve with changes in
Figure 10.
Precision.
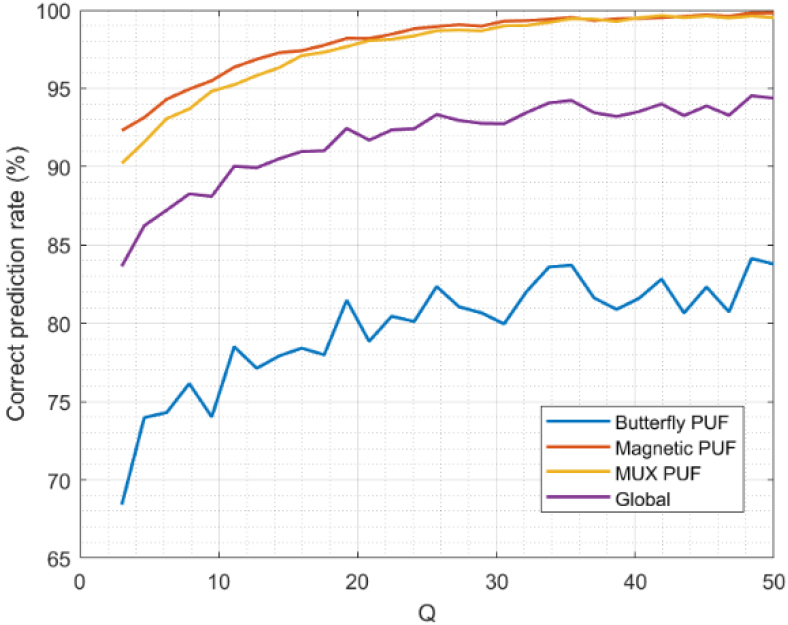
Figure 10 shows the precision for the proposed predictor-corrector mode. As can be seen, magnetic and MUX-based PUF have very high precision values (up to 98% for
As the precision for the global scenario includes all technologies previously analyzed, the precision value is a balance and reaches 95% for a good enough model (
All reported values are very high. The predictor model is precise enough to allow for a sparse execution of the correction process. So, the lightweight character of the proposed schemes and its scheme is preserved in mMTC scenarios.
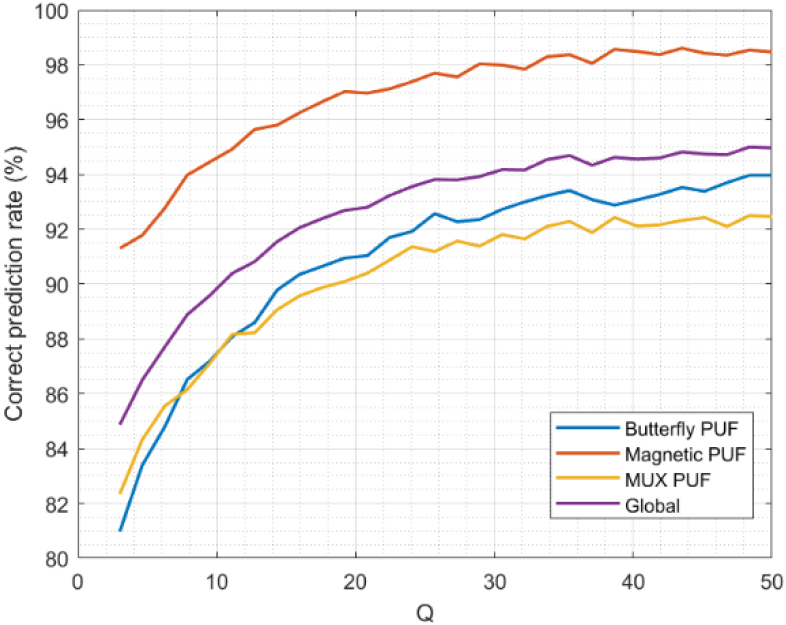
Figure 11.
Accuracy.
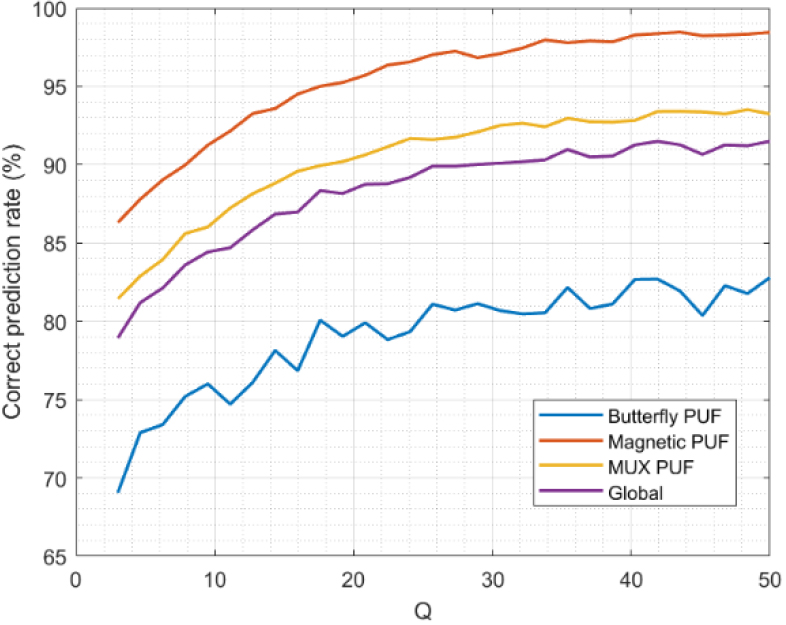
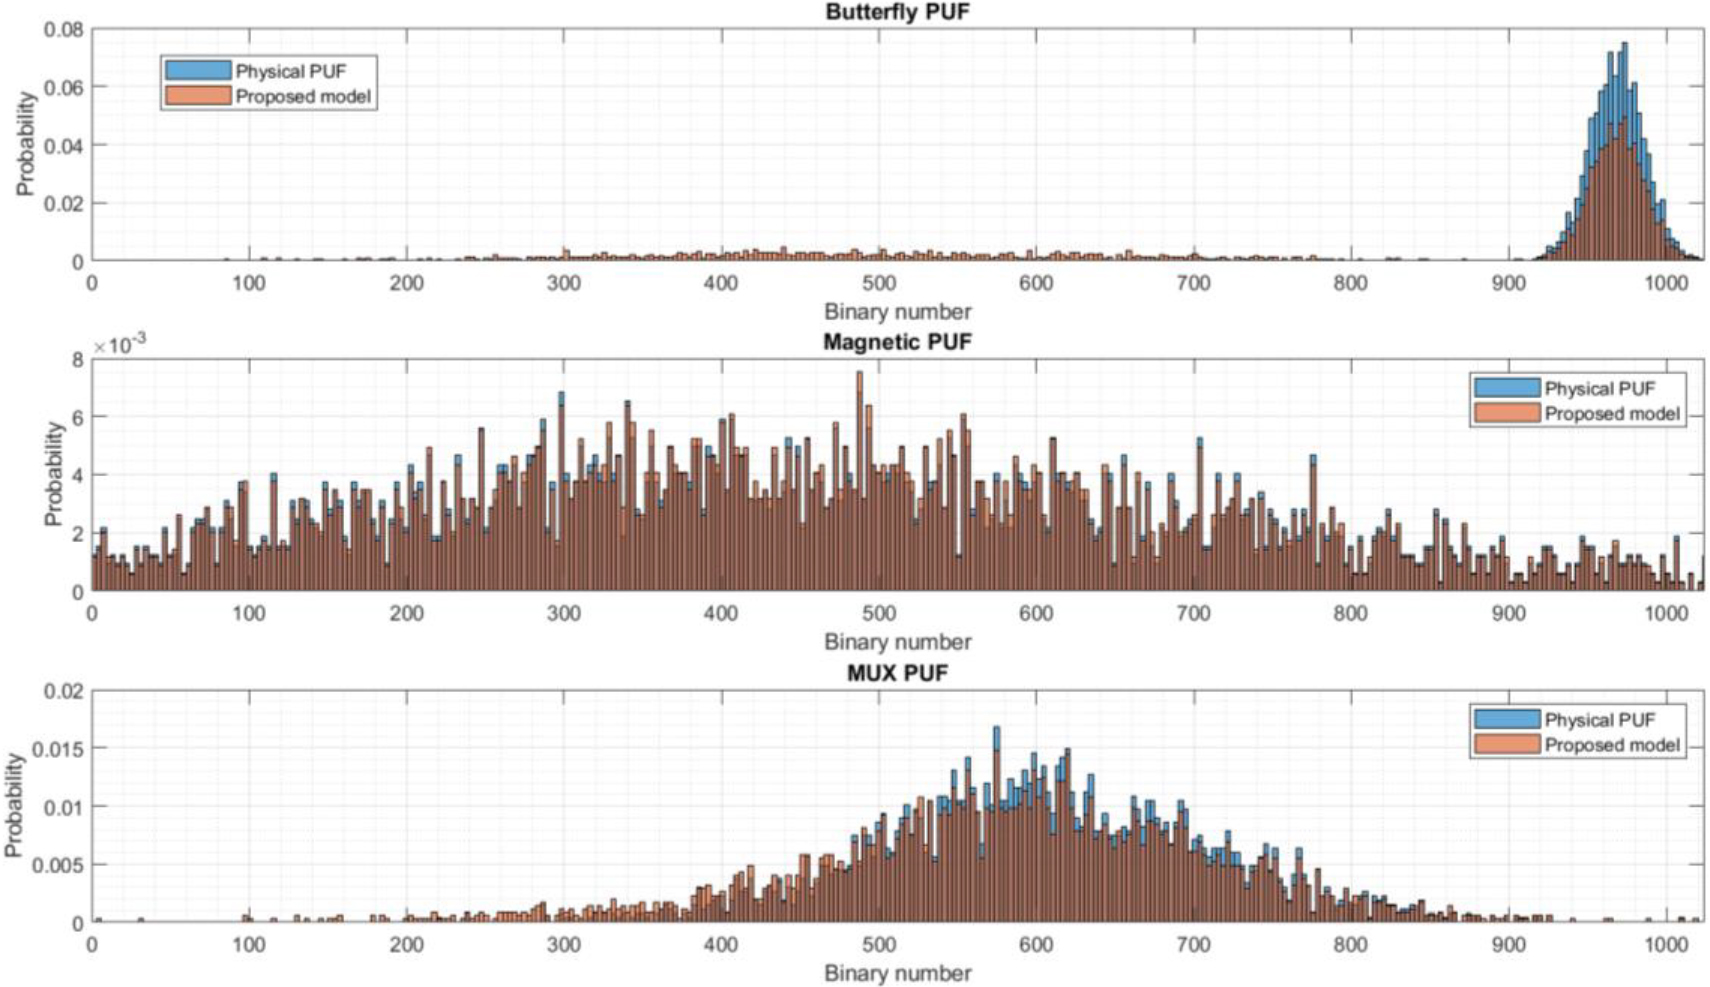
Figure 12.
Probability density function.
Finally, Fig. 11 shows the accuracy of the model. This represents the percentage of non-corrected correct predictions and the corrected wrong predictions (i.e., percentage of times the corrector model did a correct classification). The global value for all PUF is close to 90% for
In these hybrid scenarios, where different PUF technologies coexist, the proposed predictor-corrector model (and its accuracy) could be enhanced using swarm intelligence techniques [50]. Solving the optimization problem (3.5–44) through this technique (instead the initially proposed MSE in this paper), new and optimum values for the models’ parameters could be found.
Finally, Fig. 12 shows the PDF for all three PUF technologies and the proposed predictor-corrector scheme. For this experiment, we are considering a configuration were
As can be seen, butterfly PUF tend to generate responses with a large majority of bits one. This phenomenon has been reported in the literature before [60], and one possible explanation is because the “high state” is more stable than the “low state” for most flip-flops. However, the proposed predictor-corrector method is not designed to generate similar or identical responses within a reduced interval to different challenges, but just the opposite (different challenges must generate different responses). Then, there is a very low but still non-zero probability associated to responses in other regions, whose aggregation is close to 40% of all generated responses.
On the other hand, magnetic PUF has a totally different behavior. In this case, responses distribute homogenously within the possible variation range (although probability seems to be slightly higher in the central region). And the proposed model is able to replicate this behavior accurately, as unique challenge-response pairs are more easily modeled through algebraic frameworks.
Finally, MUX-based PUF show a PDF function somehow in the middle of the two previous PUF technologies. Although this third PDF is not as narrow as the Butterfly PUF’s one, probability is still mostly concentrated around the central region with a small deviation to the higher values. The proposed predictor-corrector scheme can replicate this behavior, but its PDF is still wider, and around 10% of the aggregated probability is spread in regions where the real physical PUF do not generate responses.
The second phase of the experimental validation consisted of a performance evaluation. Figure 13 shows the memory usage (normalized). As the absolute memory consumption depends on the selected operating system, its version, the employed hardware and, in our simulation scenario, on the MATLAB software (all of them external causes to the scenario under study), we are only studying the memory consumption scalability. Therefore, the results of memory usage are normalized to study the tendencies.
Figure 13.
Memory usage.
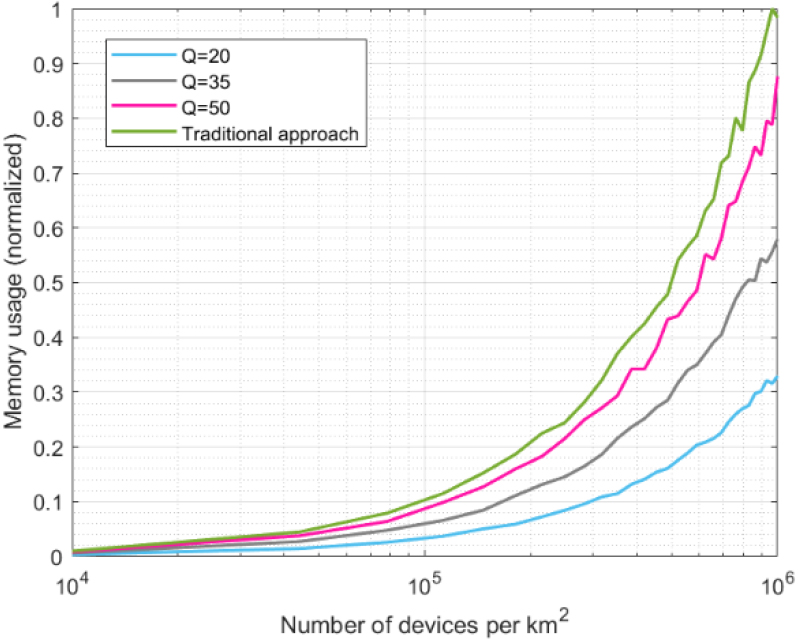
In this second experimental phase, results from the proposed predictor-corrector scheme are compared to the traditional approach (see Section 4.2). This consists of an architecture where challenge-response pairs are not calculated through a computational model but stored in an exhaustive key-value database describing the entire PUF behavior for every single PUF item.
For these analyses, three different values for
Figure 14.
Processing delay.
As can be seen, memory consumption evolves linearly with the number of devices in all cases (Fig. 13 is a logarithm on the horizontal axis). However, consumption evolution varies among the approaches described. All approaches have a similar memory consumption for low device densities (10000 devices per square kilometer). However, when the device density goes up from 100000 devices/km
Table 3
Resource consumption in sensor nodes: results
| Use of RAM | Use of program space | Mathematical operations | Processing delay |
|---|---|---|---|
| 2% | 3% | 452 | 987 |
Additionally, thanks to these improvement in memory scalability, Industry 4.0 systems will be prepared for future upcoming scenarios without needing an enlargement of the network infrastructure (which may be costly, may increase the network management tasks, …). For example, 6G technologies are envisioned to operate in massive scenarios with up to ten million devices per square kilometers [34] (ten times more than the current 5G networks). Systems implementing our approach could increase their capacity and integrate such enormous number of hardware nodes, without requiring additional gateways or processing (or edge) servers.
Figure 14 shows the results for the processing delay. As can be seen, there is a huge difference. Although the proposed solution presents a linear evolution, the traditional approach shows an exponential increase (Fig. 14 is logarithmic on the vertical axis). This is caused by the double search required in the traditional PUF and mMTC management strategy: first, the gateway must look for table or database where the challenge-response pairs for a specific PUF are stored, later, the gateway must look for the specific pair to be employed.
As can be seen in Fig. 13, the processing delay is one million higher in the traditional approach than in any configuration for the proposed predictor-corrector solution. Although variations are also observed for different values of the
In manufacturing logistics, the balance between accuracy and computational performance is critical. Therefore, it is essential to jointly analyze results from both experimental phases. Differences in the processing delay (Fig. 14) are not significant, and then the most accurate configuration would be preferred (
Finally, and considering these results (Figs 13 and 14), we can conclude that the proposed predictor-corrector model is computationally lightweight and scalable enough for mMTC scenarios and Industry 4.0 applications.
Although the focus of the proposed predictor-corrector model is the gateway managing a large number of sensor nodes, it is also important to ensure that the proposed corrector procedure may be implemented in resource-constrained nodes. Table 3 shows the computational resources required from a real ESP-32 when implementing the proposed predictor-corrector model.
As can be seen, consumptions are very reduced, and only 2% of the RAM memory and 3% of the program space are consumed. Mathematical operations are consistent with traditional decryption algorithms (only one cell as the test message is no longer than one hundred bits). Besides, the processing delay is similar to other algorithms reported for resource constrained nodes [6].
5.2Limitations
The main limitation of the proposed technology is its inability to model optical PUF and other similar non silicon-based PUF technologies. Mainly because only silicon-based PUF can be successfully modeled as binary systems or functions. Besides, technologies such as resonant optical rings cannot be modeled as a transmission medium, so the analog model is not valid either. Although, currently, silicon-based PUF is the common (and almost unique) technology in Industry 4.0 and mMTC scenarios, the proposed predictor-corrector scheme cannot be extended to applications supported by optical or hybrid PUF techniques.
On the other hand, there are limitations to the key space, depending on the considered PUF technology. As seen before, those PUF supported by unstable phenomena (resonances or oscillations, for example) show a lower accuracy and specificity. Thus, valid keys must keep a higher distance among them, in order to ensure a correct detection, and the key space (for a given key length, in bits) is then reduced. This also makes systems more vulnerable against brute force attacks, among others. Mitigation actions could be needed.
Moreover, the proposed scheme requires gateways to have computational capabilities. So, this predictor-corrector scheme is not appropriate for those scenarios where gateways are just brokers, routers or switches to concentrate information and deliver it to cloud servers (centralized architectures). Edge computing architectures and other similar distributed architectures are the suitable scenario for the proposed approach.
Additionally, further analyses are required to guarantee the feasibility of this new predictor-corrector scheme in 6G communication scenarios, where up to ten million devices moving with speeds up to one thousand kilometers per hour are expected [34]. As several message exchanges are needed to complete the proposed corrector algorithm and the key selection procedure, the full flow could not be completed under those extreme mobility conditions.
Finally, results about resource consumption in microcontrollers are based on a system-on-chip device (ESP32) where the communication firmware is embedded and provided by the manufacturer. Other devices, where the full communication stack must be stored in the user programming space, may have very hard limits to the user variables and consumed memory. Further and specific analyses are needed to study the compatibility of the proposed predictor-corrector algorithm with those devices.
6.Conclusions
In this paper, we propose a predictor-corrector model to enable lightweight management of secure massive machine-type communication in Industry 4.0 scenarios. Models focus on Physical Unclonable Functions included in most Industry 4.0 sensing nodes. The lightweight models are based on complex functions managed as Laurent series, cubic spline interpolations, and Boolean functions also developed as series. Unknown parameters in these models are predicted and eventually corrected to calculate the output value for each given key. The initial parameters are based on the Kane Yee formula.
In general, we can conclude that the proposed predictor-corrector model enables secure mMTC communication in Industry 4.0 scenarios. Results show that it is lightweight and scalable. Memory usage in gateways reduces by up to 60%, while processing delay may decrease by one million times compared to the traditional approach (where all PUF challenge-response pairs are stored in databases). Besides, sensitivity, specificity, precision, and accuracy are above 80% in general scenarios, reaching value around 90% (or higher) under certain circumstances.
As a global conclusion, algebraic frameworks are a valid approach to model the behavior of Physical Unclonable Functions. They achieve, or even improve, the accuracy of other approaches such as SVM models, but with a higher flexibility. Computational resource consumption (mainly memory) is much more reduced than in traditional key-value databases where exhaustive challenge-response pair catalogues are maintained. As a result, scalability is highly improved.
Future works will analyze the impact of other models in the performance of the predictor-corrector scheme (additional to the analog, Boolean and interpolation models described in this paper). For example, nature-inspired algorithms [51] can be used to replicate very accurately the behavior of many physical phenomena. Additionally, SVM-based models (although current approaches have a poor performance) will be improved using customized kernels [52] and incorporated to the predictor-corrector scheme, in order to analyze their impact on the global precision and accuracy.
On the other hand, the proposed model will be deployed in real Industry 4.0 scenarios to analyze its performance under non-ideal conditions in future works.
Acknowledgments
The publication is produced within the framework of Ramón Alcarria and Borja Bordel research projects on the occasion of their stay at Argonne National Laboratory (José Castillejo’s 2021 grant). This work is supported by Comunidad de Madrid within the framework of the Multiannual Agreement with Universidad Politécnica de Madrid to encourage research by young doctors (PRINCE project).
References
[1] | Ghobakhloo M. Industry 40, digitization, and opportunities for sustainability. Journal of cleaner production. (2020) ; 252: : 119869. |
[2] | Zanero S. Cyber-physical systems. Computer. (2017) ; 50: (4): 14-16. |
[3] | Bordel B, Alcarria R, Robles T. Recognizing human activities in Industry 40 scenarios through an analysis-modeling-recognition algorithm and context labels. Integrated Computer-Aided Engineering (2022) ; 29: (1): 83-103. |
[4] | Xu LD, Xu EL, Li L. Industry 40: state of the art and future trends. International Journal of Production Research. (2018) ; 56: (8): 2941-2962. |
[5] | Pace P, Aloi G, Gravina R, Caliciuri G, Fortino G, Liotta A. An edge-based architecture to support efficient applications for healthcare industry 40. IEEE Transactions on Industrial Informatics. (2018) ; 15: (1): 481-489. |
[6] | Bordel B, Alcarria R, Robles T. Lightweight encryption for short-range wireless biometric authentication systems in Industry 40. Integrated Computer-Aided Engineering. (2022) ; 29: (2): 153-173. |
[7] | Haesik K. Massive Machine Type Communication Systems. In Design and Optimization for 5G; Wireless Communications; IeeE (2020) ; 343-395, doi: 10.1002/9781119494492.ch9. |
[8] | Abdaoui A, Erbad A, Al-Ali AK, Mohamed A, Guizani, M. Fuzzy Elliptic Curve Cryptography for Authentication in Internet of Things. IEEE Internet of Things Journal. (2021) ; 9: (12): 9987-9998. |
[9] | Gao Y, Al-Sarawi SF, Abbott D. Physical unclonable functions. Nature Electronics. (2020) ; 3: (2): 81-91. |
[10] | Pérez-Jiménez M, Sánchez BB, Migliorini A, Alcarria R. Protecting private communications in cyber-physical systems through physical unclonable functions. Electronics. (2019) ; 8: (4): 390. |
[11] | Bockelmann C, Pratas N, Nikopour H, Au K, Svensson T, Stefanovic C, Popovski P, et al. Massive machine-type communications in 5G: Physical and MAC-layer solutions. IEEE Communications Magazine. (2016) ; 54: (9): 59-65. |
[12] | Bordel B, Miguel C, Alcarria R, Robles T. A hardware-supported algorithm for self-managed and choreographed task execution in sensor networks. Sensors. (2018) ; 18: (3): 812. |
[13] | Xu Y, Lao Y, Liu W, Zhang Z, You X, Zhang C. Mathematical modeling analysis of strong physical unclonable functions. IEEE Transactions on Computer-Aided Design of Integrated Circuits and Systems. (2020) ; 39: (12): 4426-4438. |
[14] | Xu X, Rührmair U, Holcomb DE, Burleson W. Security evaluation and enhancement of bistable ring PUFs. In International Workshop on Radio Frequency Identification: Security and Privacy Issues; Springer, Cham (2015) June. 3-16. |
[15] | Khalafalla M, Elmohr MA, Gebotys C. Going deep: Using deep learning techniques with simplified mathematical models against XOR BR and TBR PUFs (attacks and countermeasures). In 2020; IEEE International Symposium on Hardware Oriented Security and Trust (HOST); IEEE; (2020) Dec. 80-90. |
[16] | Ganji F, Tajik S, Fäßler F, Seifert JP. Having no mathematical model may not secure PUFs. Journal of Cryptographic Engineering. (2017) ; 7: (2): 113-128. |
[17] | Ganji F, Tajik S, Fäßler F, Seifert JP. Strong machine learning attack against PUFs with no mathematical model. In International Conference on Cryptographic Hardware and Embedded Systems; Springer, Berlin, Heidelberg; (2016) Aug. 391-411. |
[18] | Kumar S, Niamat M. Machine learning based Modeling Attacks on a Configurable PUF. In NAECON 2018-IEEE; National Aerospace and Electronics Conference; IEEE; (2018) Jul. 169-173. |
[19] | Hazari NA, Oun A, Niamat M. Analysis and machine learning vulnerability assessment of XOR-inverter based ring oscillator PUF design. In 20 |
[20] | Rajan A, Sankaran S. Lightweight and Attack-resilient PUF for Internet of Things. In 2020 IEEE International Symposium on Smart Electronic Systems (iSES) (Formerly iNiS); IEEE; (2022) Dec. 139-142. |
[21] | Tanaka Y, Bian S, Hiromoto M, Sato T. Coin flipping PUF: A novel PUF with improved resistance against machine learning attacks. IEEE Transactions on Circuits and Systems II: Express Briefs. (2018) ; 65: (5): 602-606. |
[22] | Sharma SK, Wang X. Toward massive machine type communications in ultra-dense cellular IoT networks: Current issues and machine learning-assisted solutions. IEEE Communications Surveys & Tutorials. (2019) ; 22: (1): 426-471. |
[23] | Bockelmann C, Pratas N, Nikopour H, Au K, Svensson T, Stefanovic C, Popovski P, et al. Massive machine-type communications in 5G: Physical and MAC-layer solutions. IEEE Communications Magazine. (2016) ; 54: (9): 59-65. |
[24] | Zhao C, Huang L, Zhao Y, Du X. Secure machine-type communications toward LTE heterogeneous networks. IEEE Wireless Communications. (2017) ; 24: (1): 82-87. |
[25] | Salam T, Rehman WU, Tao X. Data aggregation in massive machine type communication: Challenges and solutions. IEEE Access. (2019) ; 7: : 41921-41946. |
[26] | Salam T, Rehman WU, Tao X. Cooperative data aggregation and dynamic resource allocation for massive machine type communication. IEEE Access. (2018) ; 6: : 4145-4158. |
[27] | Bai Y, Ai B, Chen W. Deep learning based fast multiuser detection for massive machine-type communication. In 20 |
[28] | Pratas NK, Pattathil S, Stefanović Č, Popovski P. Massive machine-type communication (mMTC) access with integrated authentication. In 2017 IEEE International Conference on Communications (ICC); IEEE; (2017) May. 1-6. |
[29] | Roychoudhury P, Roychoudhury B, Saikia DK. A secure Device-to-Device communication scheme for massive Machine Type Communication. Computers & Security. (2021) ; 108: : 102370. |
[30] | Yanushkevich SN, Shmerko VP. Taylor expansion of logic functions: From conventional to nanoscale design. In Int. TICSP Workshop on Spectral Methods and Multirate Signal Processing (2004) ; 1-7. |
[31] | Yee K. Numerical solution of initial boundary value problems involvi’g Maxw’ll’s equations in isotropic media. IEEE Transactions on antennas and propagation. (1966) ; 14: (3): 302-307. |
[32] | Sahoo DP, Mukhopadhyay D, Chakraborty RS, Nguyen PH. A multiplexer-based arbiter PUF composition with enhanced reliability and security. IEEE Transactions on Computers. (2017) ; 67: (3): 403-417. |
[33] | Xu X, Liang H, Huang Z, Jiang C, Ouyang Y, Fang X, Ni T, et al. A highly reliable butterfly PUF in SRAM-based FPGAs. IEICE Electronics Express. (2017) ; 14: : 20170551. |
[34] | Bhat JR, Alqahtani SA. 6G ecosystem: Current status and future perspective. IEEE Access. (2021) ; 9: : 43134-43167. |
[35] | Ahmadlou M, Adeli H. Enhanced probabilistic neural network with local decision circles: A robust classifier. Integrated Computer-Aided Engineering. (2010) ; 17: (3): 197-210. |
[36] | Satpathy SK, Mathew SK, Kumar R, Suresh V, Anders MA, Kaul H, Agarwal A, et al. An all-digital unified physically unclonable function and true random number generator featuring self-calibrating hierarchical Von Neumann extraction in 14-nm tri-gate CMOS. IEEE Journal of Solid-State Circuits. (2019) ; 54: (4): 1074-1085. |
[37] | Gomez Rivera AO, Tosh DK, Ghosh U. Resilient sensor authentication in SCADA by integrating physical unclonable function and blockchain. Cluster Computing. (2022) ; 25: : 1869-1883. |
[38] | Lai C, Li H, Lu R, Jiang R, Shen X. LGTH: A lightweight group authentication protocol for machine-type communication in LTE networks. In 2013 IEEE global communications conference (GLOBECOM); IEEE; (2013) Dec. 832-837. |
[39] | Choi D, Choi HK, Lee SY. A group-based security protocol for machine-type communications in LTE-advanced. Wireless Networks. (2015) ; 21: : 405-419. |
[40] | Cai Y, Wei Z, Li R, Ng DWK, Yuan J. Joint trajectory and resource allocation design for energy-efficient secure UAV communication systems. IEEE Transactions on Communications. (2020) ; 68: (7): 4536-4553. |
[41] | Chen X, Ng DWK, Yu W, Larsson EG, Al-Dhahir N, Schober R. Massive access for 5G and beyond. IEEE Journal on Selected Areas in Communications. (2020) ; 39: (3): 615-637. |
[42] | Qi Q, Chen X, Zhong C, Zhang Z. Physical layer security for massive access in cellular Internet of Things. Science China Information Sciences. (2020) ; 63: : 1-12. |
[43] | Shu F, Wu X, Hu J, Li J, Chen R, Wang J. Secure and precise wireless transmission for random-subcarrier-selection-based directional modulation transmit antenna array. IEEE Journal on Selected Areas in Communications. (2018) ; 36: (4): 890-904. |
[44] | Marchal S, Miettinen M, Nguyen TD, Sadeghi AR, Asokan N. Audi: Toward autonomous iot device-type identification using periodic communication. IEEE Journal on Selected Areas in Communications. (2019) ; 37: (6): 1402-1412. |
[45] | Momeni H, Ghazizadeh A, Sharifi F. Multi-valued logic arbiter PUF designs based on CNTFETs. Computers and Electrical Engineering. (2022) ; 102: : 108295. |
[46] | Yehoshuva C, Raja Adhithan R, Nalla Anandakumar N. A survey of security attacks on silicon based weak PUF architectures. In Security in Computing and Communications 8 |
[47] | Herder C, Yu MD, Koushanfar F, Devadas S. Physical unclonable functions and applications: A tutorial. Proceedings of the IEEE; IEEE; (2014) ; 102: (8): 1126-1141. |
[48] | Wu J, Liu X, Liu X, Tang Z, Huang Z, Lin W, Lin X, et al. A High-Security mutual authentication system based on structural color-based physical unclonable functions labels. Chemical Engineering Journal. (2022) ; 439: : 135601. |
[49] | Shanta AS, Majumder MB, Hasan MS, Rose GS. Physically unclonable and reconfigurable computing system (purcs) for hardware security applications. IEEE Transactions on Computer-Aided Design of Integrated Circuits and Systems. (2020) ; 40: (3): 405-418. |
[50] | Akhand MAH, Ayon SI, Shahriyar SA, Siddique N, Adeli H. Discrete spider monkey optimization for travelling salesman problem. Applied Soft Computing. (2020) ; 86: : 105887. |
[51] | Siddique N, Adeli H. Nature-inspired chemical reaction ptimization algorithms. Cognitive Computation. (2017) ; 9: : 411-422. |
[52] | Wang J, Zhong D, Adeli H, Wang D, Liu M. Smart bacteria-foraging algorithm-based customized kernel support vector regression and enhanced probabilistic neural network for compaction quality assessment and control of earth-rock dam. Expert Systems. (2018) ; 35: (6): e12357. |
[53] | Siddique N, Adeli H. Harmony search algorithm and its variants. International Journal of Pattern Recognition and Artificial Intelligence. (2015) ; 29: (08): 1539001. |
[54] | Yang H, Zeng X, Wu X. An approach to solving Maxwell’s equations in time domain. Journal of Mathematical Analysis and Applications. (2023) ; 518: (1): 126678. |
[55] | Henrion D, Lasserre JB, Mevissen M. Mean squared error minimization for inverse moment problems. Applied Mathematics & Optimization. (2014) ; 70: (1): 83-110. |
[56] | Van den Abeele F, Haxhibeqiri J, Moerman I, Hoebeke J. Scalability analysis of large-scale LoRaWAN networks in ns-3. IEEE Internet of Things Journal. (2017) ; 4: (6): 2186-2198. |
[57] | He Z, Chen W, Zhang L, Chi G, Gao Q, Harn L. A highly reliable arbiter PUF with improved uniqueness in FPGA implementation using Bit-Self-Test. IEEE Access. (2020) ; 8: : 181751-181762. |
[58] | Amsaad F, Razaque A, Baza M, Kose S, Bhatia S, Srivastava G. An efficient and reliable lightweight PUF for IoT-based applications. In 2021 IEEE international conference on communications workshops (ICC Workshops); IEEE; (2021) Jun. 1-6. |
[59] | Bordel B, Alcarria R, de la Torre G, Carretero I, Robles T. Increasing the Efficiency and Workers Wellbeing in the European Bakery Industry: An Industry 40. Case Study. In Information Technology and Systems: Proceedings of ICITS (2022) ; Springer International Publishing; 646-658. |
[60] | Khan S, Shah AP, Chouhan SS, Gupta N, Pandey JG, Vishvakarma SK. A symmetric D flip-flop based PUF with improved uniqueness. Microelectronics Reliability. (2020) ; 106: : 113595. |
[61] | Roda-Sanchez L, Olivares T, Garrido-Hidalgo C, de la Vara JL, Fernandez-Caballero A. Human-robot interaction in Industry 40 based on an Internet of Things real-time gesture control system. Integrated Computer-Aided Engineering. (2021) ; 28: (2): 159-175. |

