
High resolution flow (HR Flow) and Glazing Flow in cases of hepatic flow changes: Comparison to color-coded Doppler sonography (CCDS)
Abstract
AIM:
To evaluate the possibilities of flow detection using high resolution flow (HR Flow) and Glazing Flow technique in patients with liver parenchymal changes and flow changes in comparison to color-coded Doppler sonography (CCDS).
MATERIAL AND METHODS:
All examinations were performed using a multi frequency matrix convex probe with high resolution technique (SC6-1U/Resona7, Mindray, Shenzhen, China) by one experienced examiner to evaluate the venous, portal venous and arterial liver flow with digital documentation of the dynamic flow parameters like peak systolic flow, end-diastolic flow and resistance index. For liver parenchymal stiffness changes shear wave elastography was performed with at least 10 measurements. By two independent readers an elevation was performed to evaluate the image quality and the degree of flow artefacts, from 0 = not available to 5 points with excellent image quality without flow artefacts.
RESULTS:
All 40 patients (24 men, 16 women, age 27–83 years, mean 56±5 years) showed morphology changes from B-Mode of the liver parenchyma to inhomogeneous tissue with higher stiffness evaluated by the shear wave elastography (1.45 m/s up to 2.79 m/s±1.79 m/s, considering F1 up to F4 fibrosis) and in 15 cases histopathologically proven liver cirrhosis. In 9 cases after non-acute thrombosis flow reduction of the portal vein was the reason for the diameter less than 5 mm. Flow parameters for the venous flow were between 8 cm/s up to 29 cm/s, mean 14±4 cm/s, for the hepatic portal vein 5 cm/s up to 57 cm/s, mean 17±5 cm/s, for the hepatic artery systolic flow between 50 cm/s up to 127±33 cm/s, end-diastolic flow from 22 cm/s up to 47±8 cm/s. Resistance index for the hepatic artery was between 0.41 up to 0.73, mean 0.67±0.25. The image quality for CCDS over all cases was evaluated for CCDS between 1 up to 4. The mean quality was 2.5±0.5, for HR Flow in combination with Glazing Flow 3±0.5, with significant differences for the 2 readers (P < 0.01).
CONCLUSION:
Combination of HR Flow with Glazing Flow could be helpful to evaluate morphological und hemodynamic changes of liver arterial flow, portal venous and venous flow. Reduction of flow artefacts in combination with a higher image quality could be helpful for optimizing the digital measurements also for follow up examinations.
1Introduction
Most ultrasound machines allow rapid assessment of liver perfusion using color-coded Doppler sonography (CCDS) in the hands of experienced examiners. This includes flow changes of the portal vein (PV), hepatic artery (HA) and hepatic veins. Anatomical and functional changes can also be detected. CCDS can be used to assess the vessel wall and lumen on the B-scan, color can be used to assess the direction and extent of flow changes, and Doppler can be used to assess hemodynamic changes such as flow acceleration, flow reductions, turbulence, retrograde flow components, respiratory modulation, and more. Intraluminal changes can also be recorded well with CCDS, such as changes after venous thrombosis or arterial stenosis. Intraluminal CCDS is the most commonly used imaging technique to image hemodynamic flow changes [1–4].
It should be noted that correct flow assessment with CCDS is dependent on the experience of the investigators and artifacts can be a critical limitation. For example, correct assessment of hemodynamics and detection of flow velocities are dependent on the angle of incidence. Ideally, the angle of incidence should be between 30 to 60 degrees. Flow detection is not possible at 90 degrees of transducer angle. The most common artifacts include pulsation artifacts, aliasing and blooming artifacts. It is also difficult to detect low and high flow simultaneously with different adjustment of pulse repetition frequency or scale, color gain and filters.
New approaches to improve flow detection with color-coded methods include improved spatial and temporal resolution with matrix probes and partial 3D acquisitions, such as with ultrasound CT technology or comparable methods. Through additional modification of amplitude amplification, high resolution flow (HR Flow) can be combined with proportional 3D visualization (Glazing Flow) [5, 6]. The aim is to detect vessel wall changes in high image quality to avoid overdrawing of the vessel wall, to compensate for angle-dependent poorer flow detection and to facilitate the detection of hemodynamic parameters [2–4].
Assessment of liver perfusion is difficult when parenchymal changes are present that can lead to lumen reduction of vessels and changes in morphology, as in liver fibrosis or cirrhosis. In addition to well-established B-scan criteria such as changes in liver surface, echogenicity, and vessel density, shear wave elastography is increasingly being used to detect liver tissue compaction [7–12].
The aim of this first clinical evaluation was to assess to what extent an improved assessment of liver perfusion with fewer artifacts can be achieved in patients with liver fibrosis to cirrhosis by combining HR and Glazing Flow using a multifrequency convex probe with state-of-the-art ultrasound equipment.
2Material and methods
In a prospective study, ultrasound examinations from the hepatology outpatient clinic were performed in addition to clinical and laboratory chemistry examinations performed on the same day. Venous, portal venous and arterial liver perfusion as well as fibrosis values were recorded using shear wave elastography. The study was approved by the ethics committee of the University Regensburg, Germany (21-2220-104).
All ultrasound examinations were performed by an experienced examiner (> 3000 examinations per year, > 20 years) with a multifrequency convex probe (SC6-1U/Mindray, Shenzhen, China) on a modern high performance ultrasound machine (Resona 7, Mindray, Shenzhen, China). Digital examinations in standard sections of the liver in B-scan, measurements of the parenchyma at relevant sites of intercostal and subcostal with shear wave elastography (at least 10 measurements) were documented and flow examinations with CCDS and in combination HR Flow with Glazing Flow technique and stored in PACS.
The technical background of HR Flow is based on a continuous detection of the sequences to each point in the color window. Compared to color Doppler, in which the entire B-mode image is built up sequentially and then the flow velocities are sampled, in HR Flow a continuous sampling of the flow velocities takes place and only parts of the B-mode image are updated between these sequences [5]. This would lead to a decrease in B-scan quality in a conventional B-scan method with the sampling of each individual crystal. With Zone Sonography technology, compared to digital beamformers, groups of crystals are driven simultaneously rather than each crystal individually to capture the image signals of these formed zones simultaneously. This technique reduces the time for image data acquisition by 90% . This time gain can be invested in flow detection. Continuous sampling of sequences in HR Flow in combination with Zone Sonography technology helps to enhance weak echoes from blood cells and improve spatial resolution in color Doppler.
Glazing Flow is a novel method to visualize 2D color information in 3D. With the help of this advancement, both a clearer delineation from the surrounding tissue and a better differentiation of vessels that are close to each other or crossing each other is achieved. Glazing Flow can be used in color Doppler, power Doppler and HR Flow mode. This 3D visualization method adds depth and height information to the conventional display, which more accurately maps the color flow information into a 3D appearance. The display of color Doppler signals in Glazing Flow helps in the differentiability of vascular structures. When combined with HR Flow, there is an improvement in the identification of slow flow velocities, which are more clearly highlighted in Glazing Flow, which is sometimes difficult to see with conventional visualization techniques.
Ideally, flow imaging under functional and hemodynamic changes should be as artifact-free, diagnostically meaningful, and hemodynamically representative as possible. The aim was to image high and low flow simultaneously and to avoid artifacts such as blooming and aliasing even under unfavorable acoustic conditions. For CCDS and HR Flow, color gain, pulse repetition frequency (PRF/scale), and wall filter were adjusted according to vessel region and flow dynamics.
Criteria for liver parenchymal changes were comparison of echogenicity to the kidney parenchyma, which was as unchanged as possible, iso-echogenic, hyperechogenic as in steatosis and hypoechogenic as in reduced fatness or fibrosis, and assessment of liver angle and surface, so irregular and wavy in cirrhosis.
Liver perfusion was examined at the hepatic vein star for all 3 hepatic veins, at the hilus and in both liver lobes for the portal vein and in the course of the portal vein at the hilus of the hepatic artery. Angular corrections and measurement volumes were adjusted in size and extent to match the course of the vessel. Documentation was performed with single images and also short cine loops up to a maximum of 10 s in DICOM format. For comparison of CCDS and HR Flow with Glazing Flow, the sectional plane was maintained as well as all other image parameters.
All digitally stored images were off-line assessed by independent reading by 2 investigators with respect to image quality and avoidance of artifacts. A scale was used with 0: not assessable, 1: clear artifacts and poor image quality, 2: artifacts and moderate image quality, 3: satisfactory image quality, proportionate artifacts, 4: good image quality, low artifacts, 5: no artifacts, highest image quality.
3Statistics
Numerical data were expressed as arithmetic means with standard deviation, and the categorical variables as numbers and percentages. The Wilcoxon rank sum test was used to compare non-normal variables and t-test for normal distribution. The agreement between the two readers in assigning image quality was assessed using Cohen’s weighted kappa (κ) statistic. Differences with a p value less than 0.05 were considered significant.
4Results
Forty patients (24 men, 16 women) with a mean age 56±5 years from 27–83 years were included. No malignant tumors were detected, while in 20 cases regenerative nodules were found. B-Mode analyses showed morphology changes of the normal homogenous liver parenchyma to inhomogeneous tissue with higher stiffness evaluated by shear wave elastography (1.45 m/s up to 2.79±1.79 m/s, considering F1 up to F4 fibrosis) and in 15 cases histopathological proven liver cirrhosis.
Table 1 and Table 2 are summarizing the results of the statistically evaluations from the reading corresponding to imaging with comparison CCDS with HR Flow in combination with Glazing Flow (Figs. 1–3).
Table 1
CCDS image scores of image quality of readers A and reader B
| Reader A | |||||
| Reader B | 1 | 2 | 3 | 4 | |
| 1 | 2 | 0 | 0 | 0 | 2 (5.0% ) |
| 2 | 1 | 12 | 1 | 0 | 14 (35.0% ) |
| 3 | 0 | 8 | 15 | 0 | 23 (57.5% ) |
| 4 | 0 | 0 | 0 | 1 | 1 (2.5% ) |
| 3 (7.5% ) | 20 (50.0% ) | 16 (40.0% ) | 1 (2.5% ) | 40 | |
| Weighted Kappaa | 0.633 | ||||
| Standard error | 0.108 | ||||
| 95% CI | 0.422 to 0.844 | ||||
aLinear weights.
Table 2
HR Flow image scores of image quality of readers A and reader B
| Reader A | ||||||
| Reader B | 1 | 2 | 3 | 4 | 5 | |
| 1 | 2 | 0 | 0 | 0 | 0 | 2 (5.0% ) |
| 2 | 0 | 0 | 0 | 0 | 0 | 0 (0.0% ) |
| 3 | 0 | 2 | 14 | 1 | 0 | 17 (42.5% ) |
| 4 | 0 | 1 | 3 | 11 | 1 | 16 (40.0% ) |
| 5 | 0 | 0 | 0 | 3 | 2 | 5 (12.5% ) |
| 2 (5.0% ) | 3 (7.5% ) | 17 (42.5% ) | 15 (37.5% ) | 3 (7.5% ) | 40 | |
| Weighted Kappaa | 0.681 | |||||
| Standard error | 0.091 | |||||
| 95% CI | 0.503 to 0.859 | |||||
aLinear weights.
Table 1 shows the inter-rater reliability for CCDS images sing Cohen’s Kappa, a robust measure for qualitative (categorical) items.
With a kappa of 0.633±0.108, there was good agreement between the two radiologists. The agreement for image assessment by Doppler method was highest in level 2 with 50.0% . The mean rank for image quality was 2.32 for the first reviewer and 2.67 for the second reviewer. The mean ranks did not differ for the two reviewers (p = 0.698).
The assessment of image quality for the HR Flow technique was shown in Table 2.
With a kappa of 0.681±0.091, there was a strong agreement between the two readers. The agreement for image assessment by HR Flow method was highest in level 3 with 42.5% . The mean rank for image quality was 3.36 for the first reviewer and 3.67 for the second reviewer. The mean ranks did not differ (p = 0.330).
Judged image quality was significantly superior to CCDS images for HR technology for both readers (Reader 1: p < 0.0001; Reader 2: p < 0.0001).
In 9 patients with non-acute thrombosis flow reduction of the portal vein occurred (due to vessel diameters of less than 5 mm). In all these cases contrast enhanced computed tomography (CT) confirmed the findings: lumen reduction of the portal vein after older thrombosis and changes of the arterial flow with signs of portal hypertension. The maximal flow velocity was less than 12 cm/s. In addition, in 3 patients a partial reverse flow could be detected as sign of severe changes of reduced intrahepatic venous flow.
Venous flow velocities were between 8 cm/s up to 29 cm/s (mean: 14±4 cm/s) for the hepatic portal vein 5 cm/s up to 57 cm/s (mean: 17±5 cm/s). In patients with severe liver fibrosis or cirrhosis the diameter of liver veins was less than 5 mm at maximum. In 7 cases of additional right heart failure a dilation of the liver veins up to 10 mm was found.
Systolic flow velocities in the hepatic artery were between 50 cm/s up to 127±33 cm/s (mean: 102±8.3 cm/s), end-diastolic flow from 22 cm/s up to 47±8 cm/s. In cases of older portal vein thromboses a higher flow in the hepatic artery could be detected with enlarged diameters > 3 mm and in cases of severe cirrhosis also signs of cavernous transformation with collateral flow to the enlarged spleen and to the epigastric vessels.
The resistance index (RI) for the hepatic artery was between 0.41 up to 0.73 (mean: 0.67±0.25). Normal values are between 0.5 and 0.7. Reduced levels were a sign of reduced hepatic arterial flow, one reason could be an arterial stenosis. Elevated levels of RI could be found in cases of collateral flow after portal vein thrombosis, in cases of inflammatory reaction or in cases of intrahepatic micro- or macro-fistulas, like in 2 cases of hepatic Osler disease.
The following three cases show improved visualization of the hepatic artery, portal vein and hepatic veins using HR and Glazing Flow compared to CCDS.
In Fig. 1 an unclear vascularised liver lesion at the hepatic hilus is shown which was classified as portal vein aneurysm.
Fig. 1a
MRI in T2 weighted sequence with unclear vascularised structure (arrow) at the hepatic hilus with signal change.
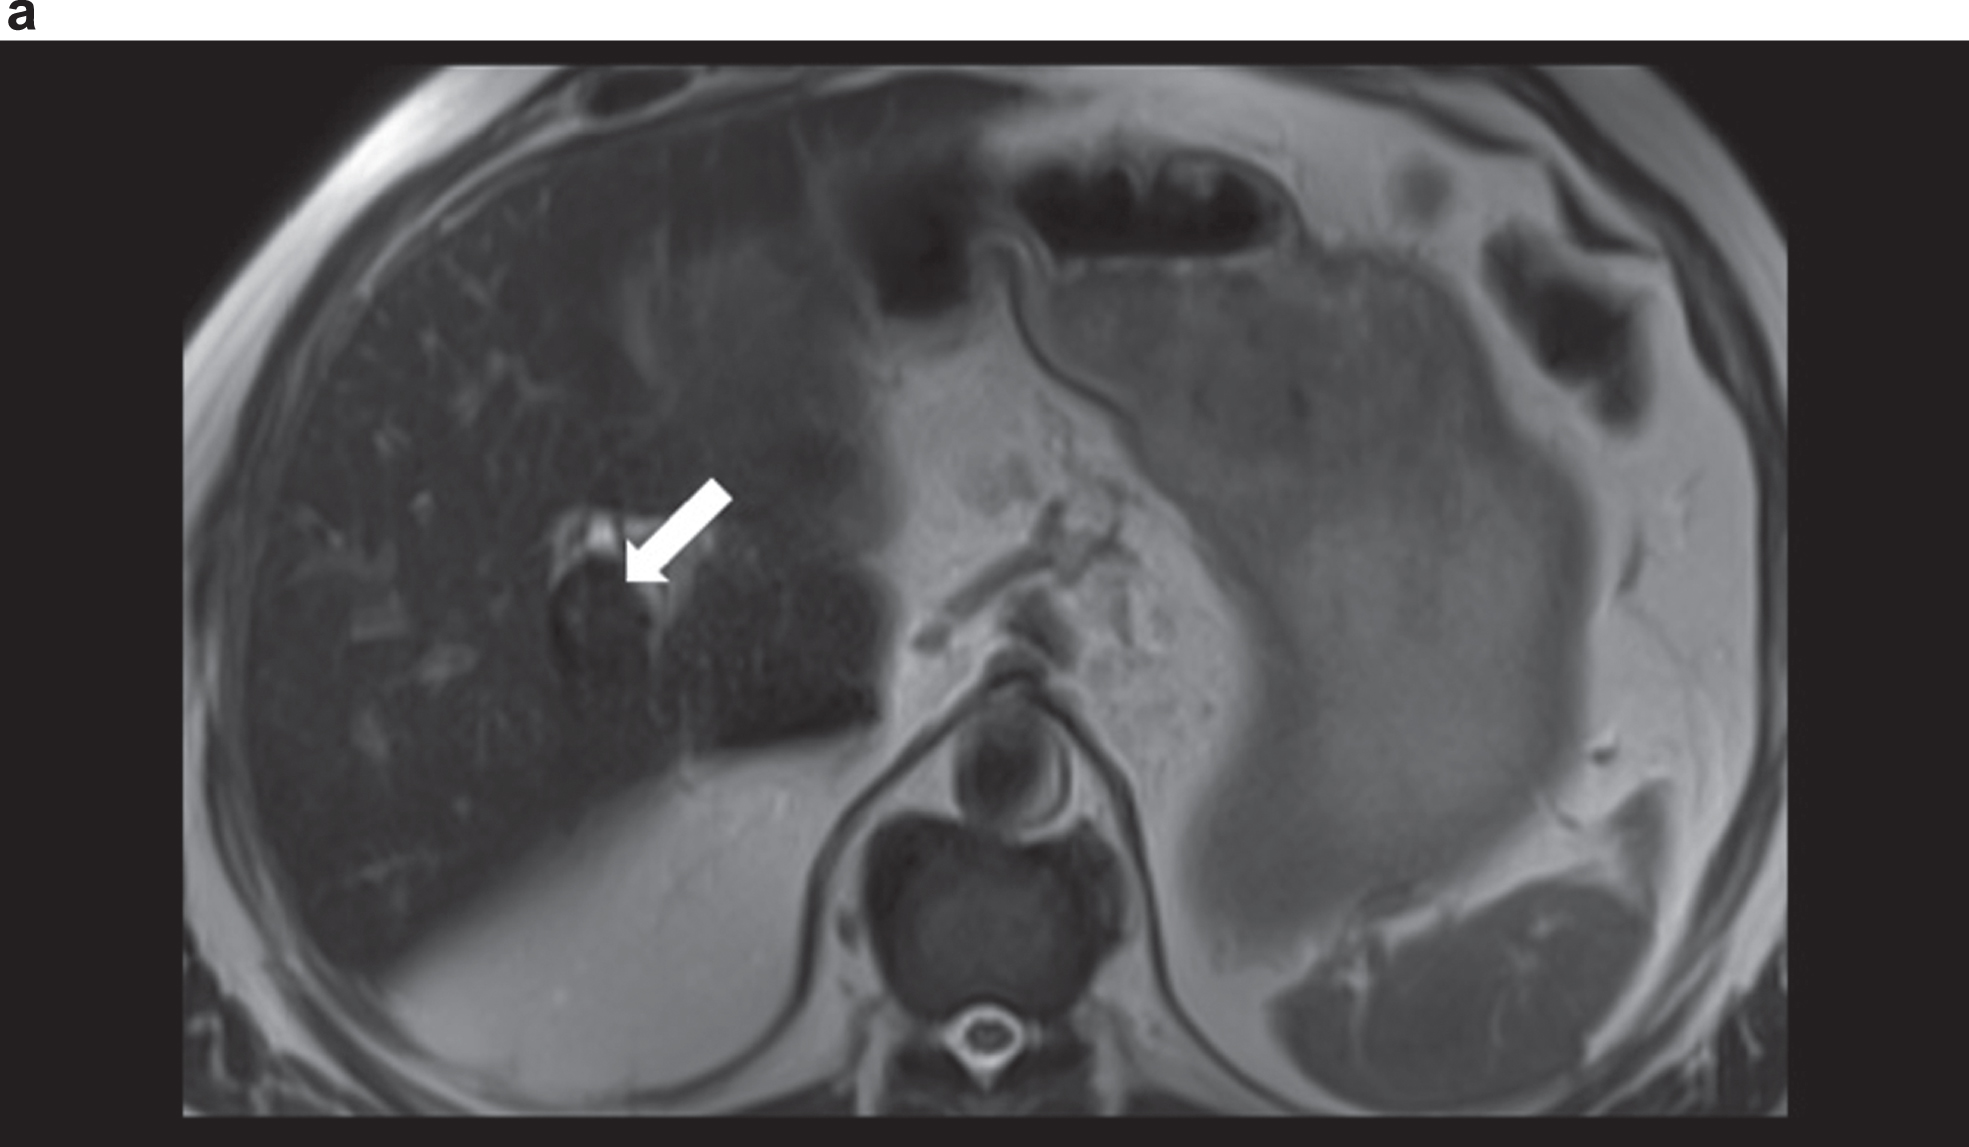
Fig. 1b
Comparison of CCDS and HR and Glazing Flow for a more precise assessment of the portal venous aneurysm close to the hilus (portal vein aneurysm) with a diameter of up to 2.54 cm. Less artefacts with display in HR and Glazing Flow mode.
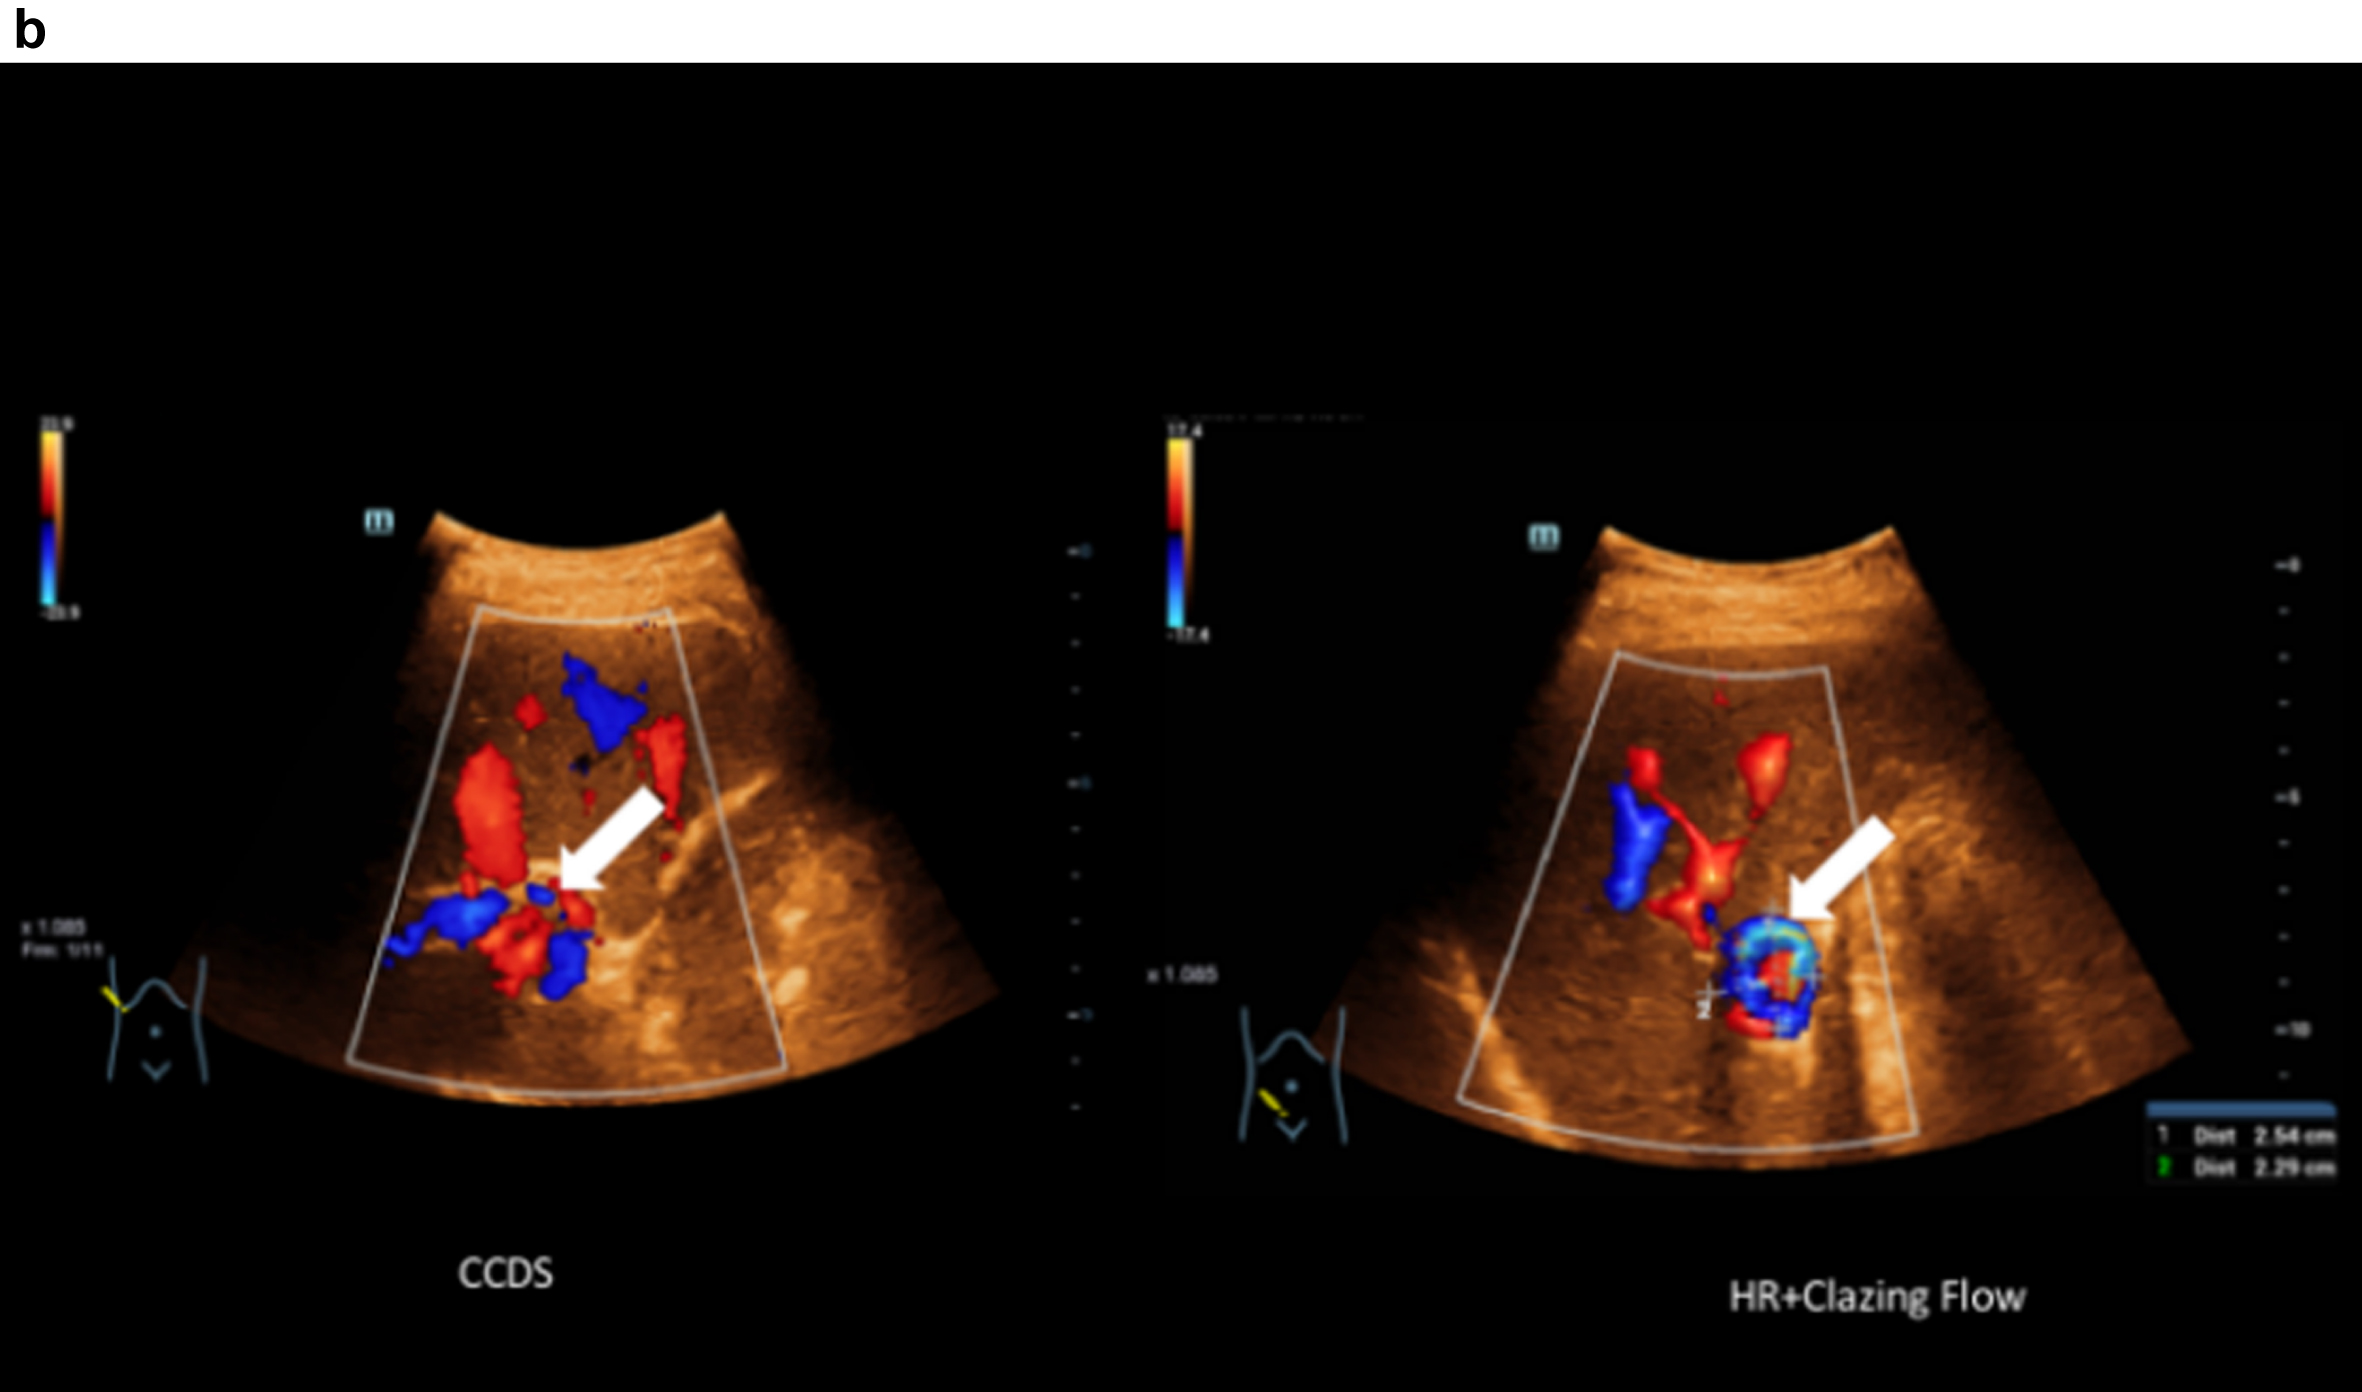
Fig. 1c
Haemodynamic assessment of portal vein aneurysm with the combination CCDS and HR and Glazing Flow with flow up to 44 cm/s.
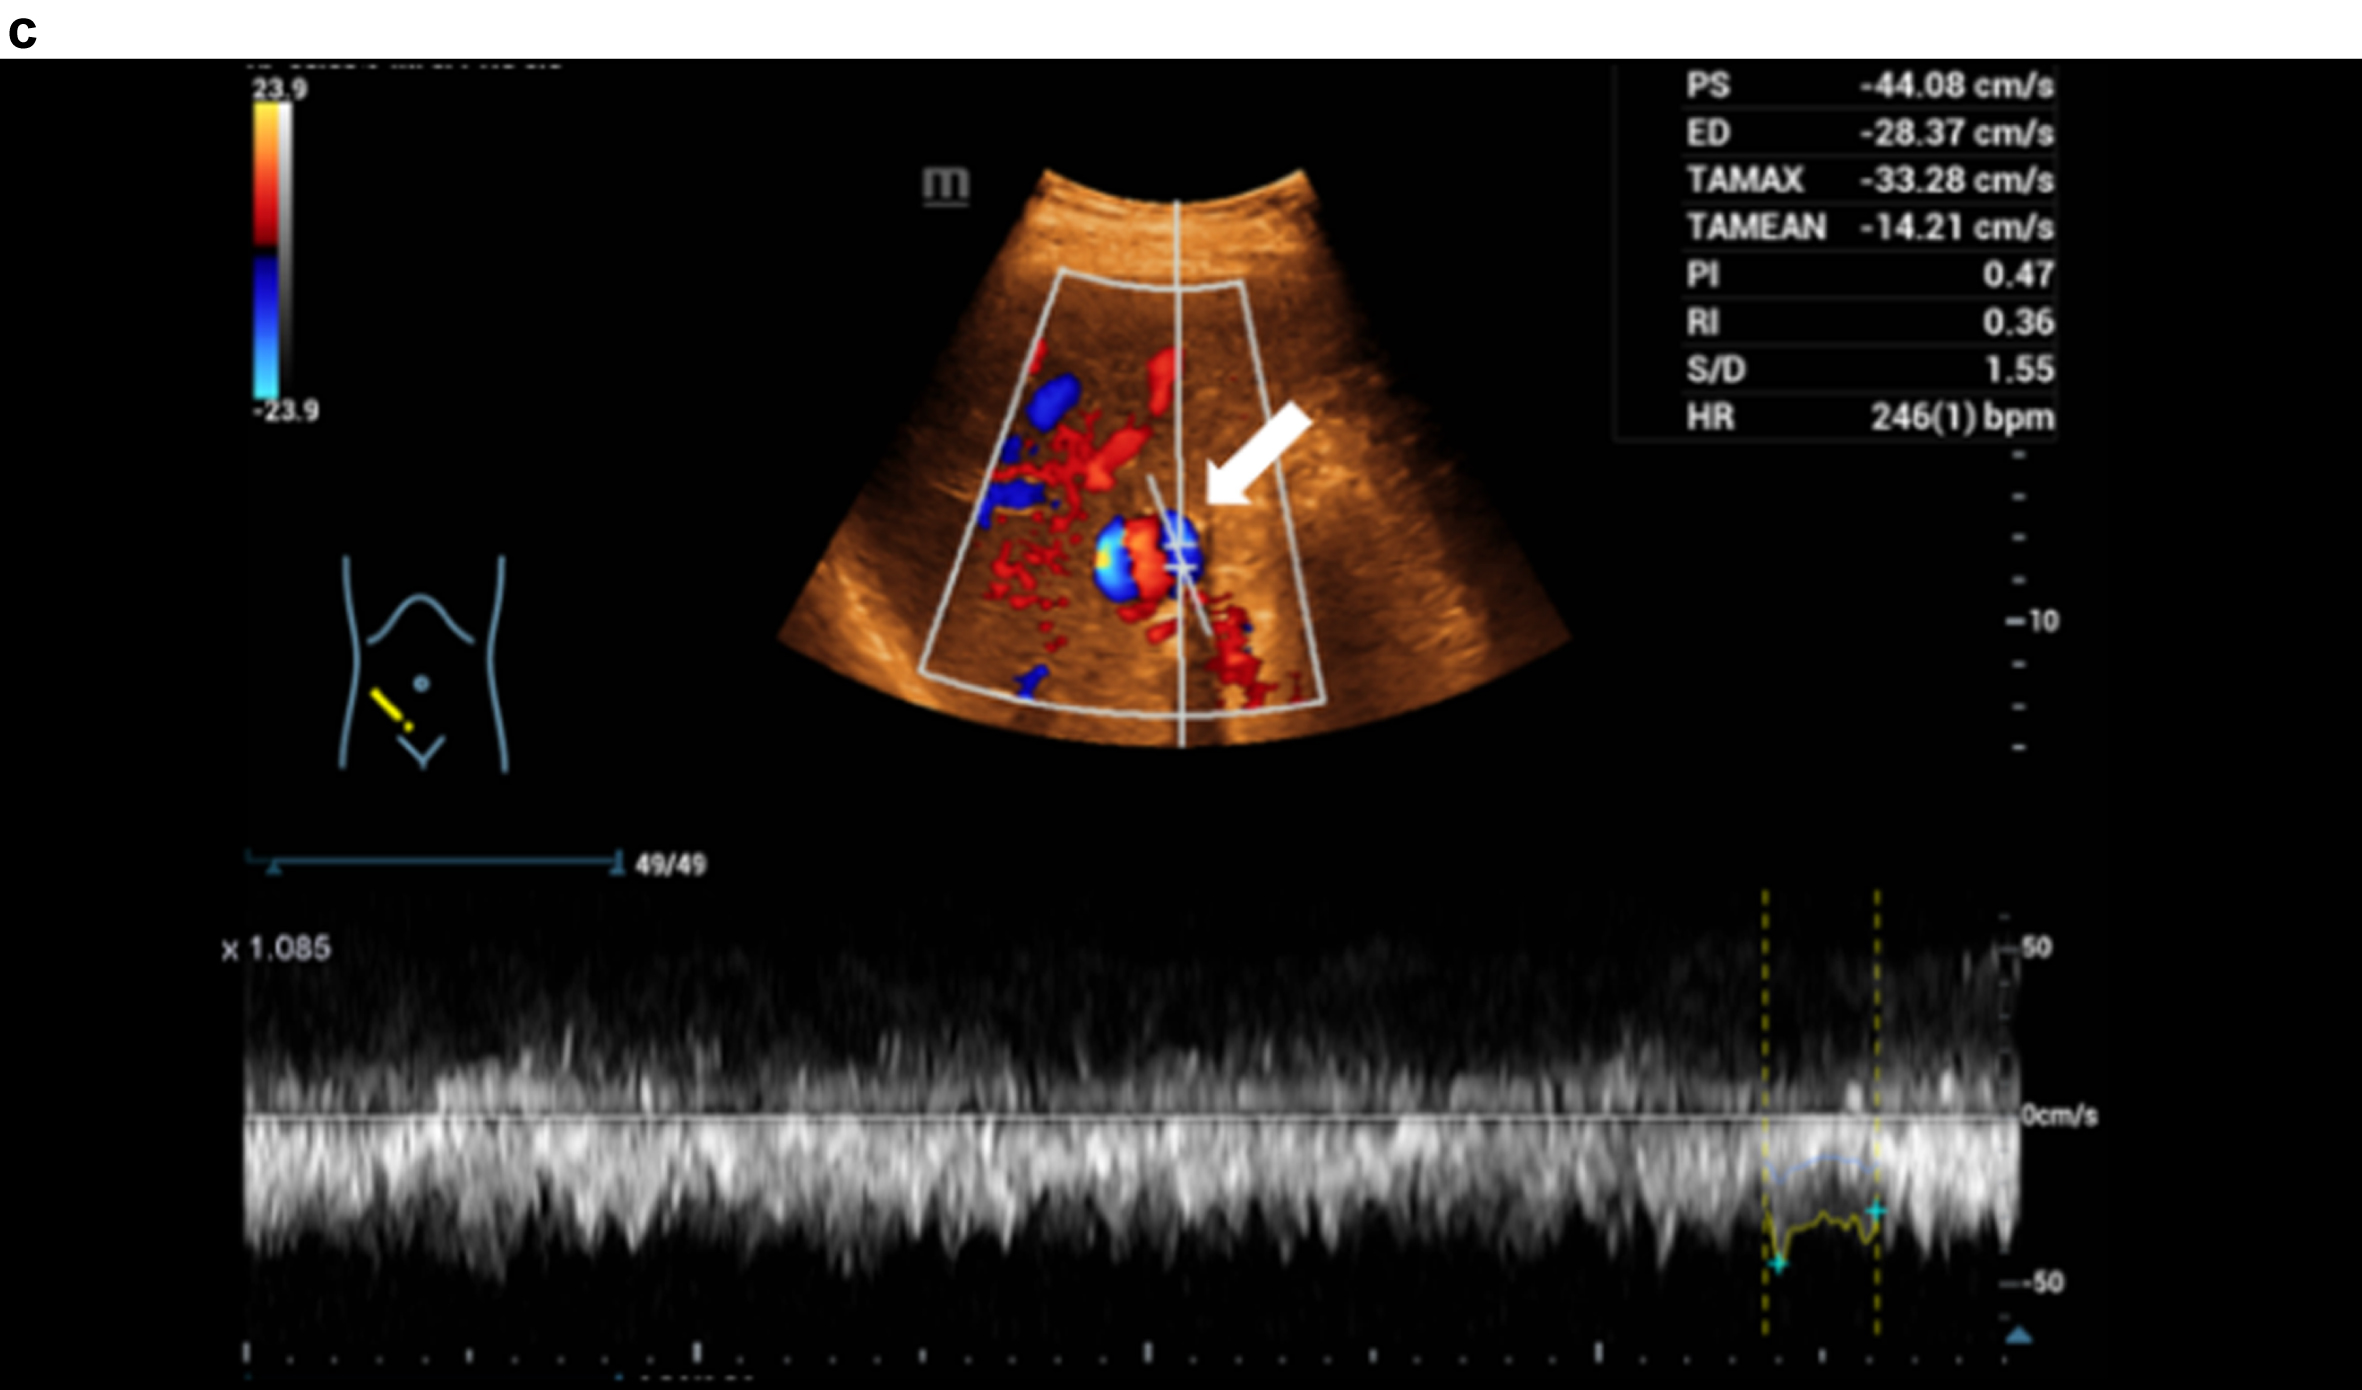
Figure 2 shows an angiosarcoma which is demonstrated by contrast-enhanced CT, CEUS, HR and Glazing Flow. Also an additional shear wave elastography of the liver was performed.
Fig. 2a
Contrast-enhanced CT showing an irregular hepatic artery (arrow), inhomogeneous contrast of the liver in cirrhosis and changes in angiosarcoma in the right lobe of the liver.
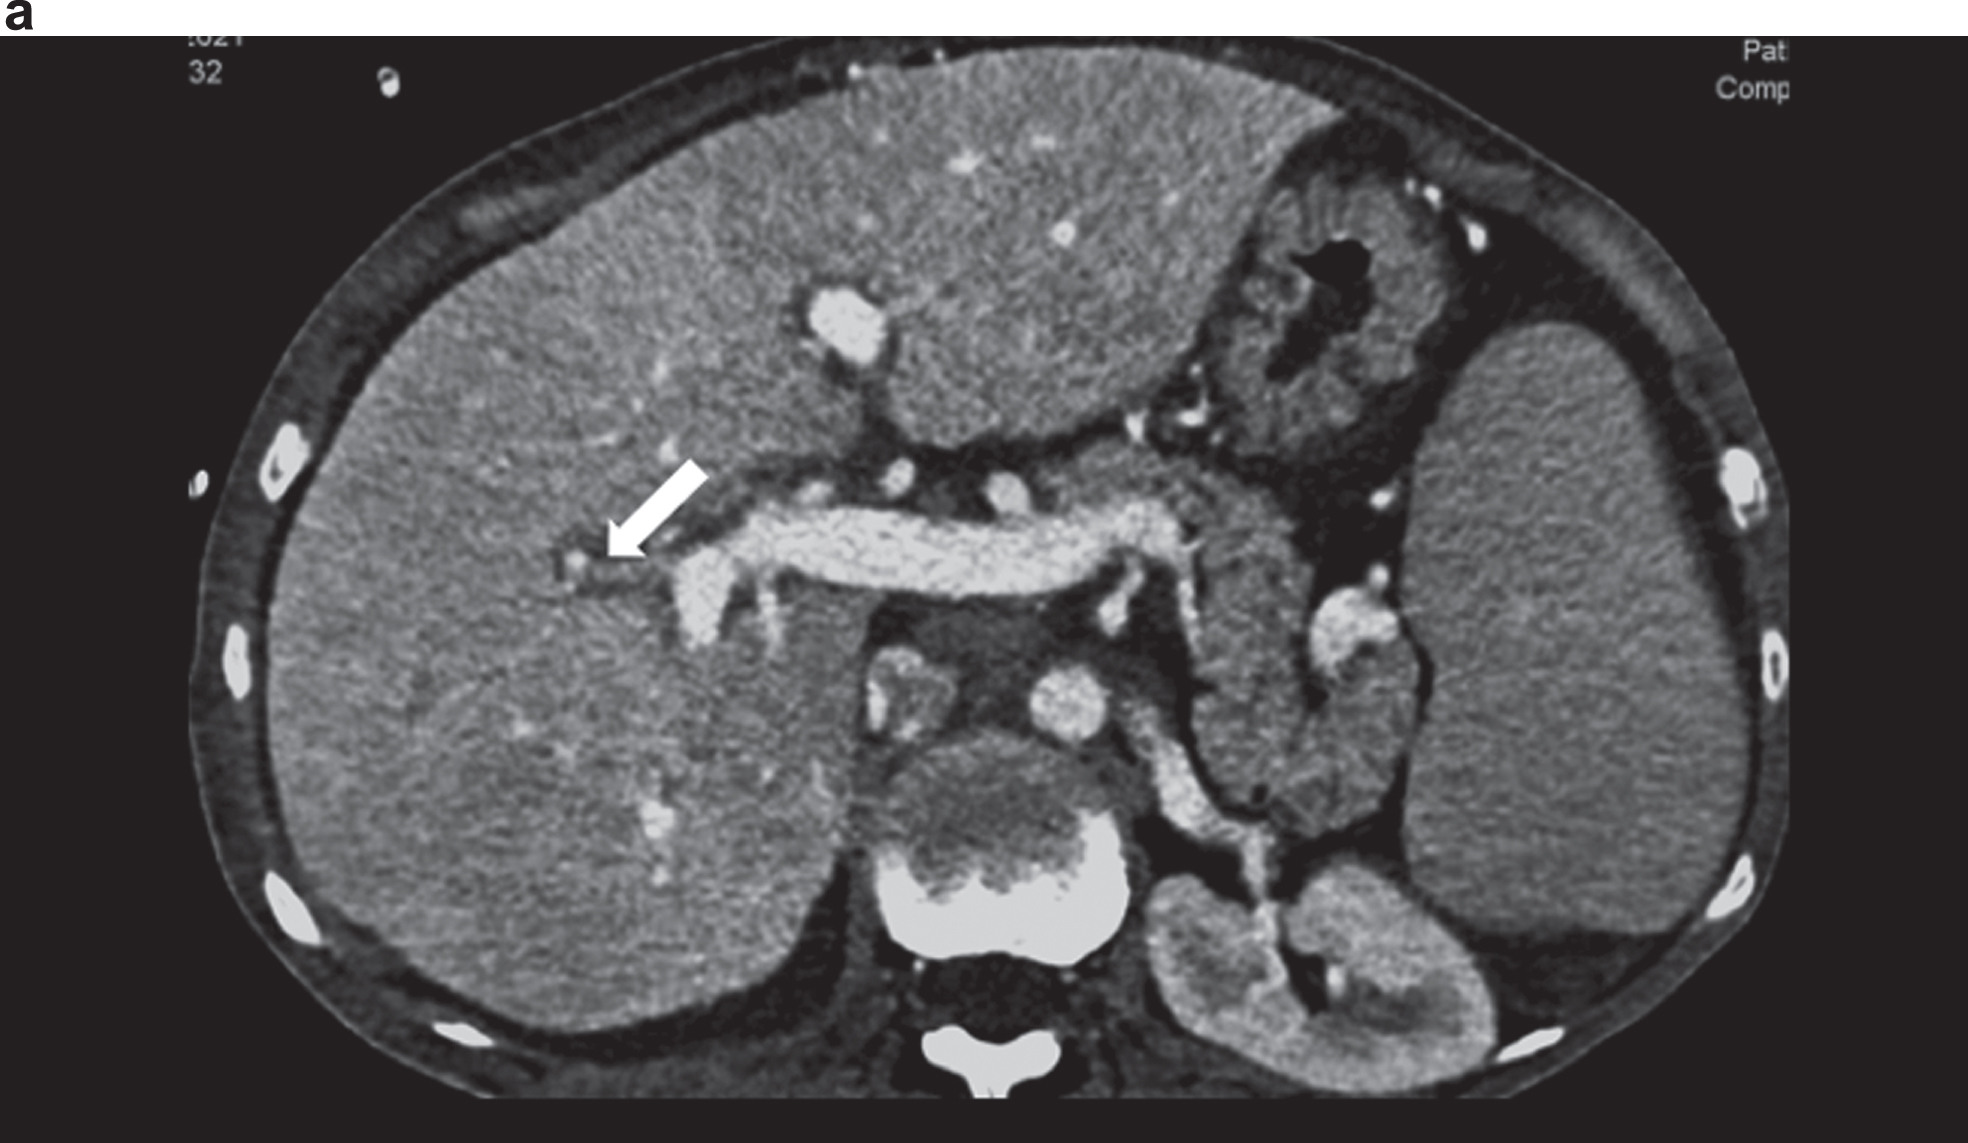
Fig. 2b
Contrast medium sonography (CEUS) with detection of the irregular early liver contrast and the elongated hepatic artery (arrow). Inhomogeneous liver in the grey image.
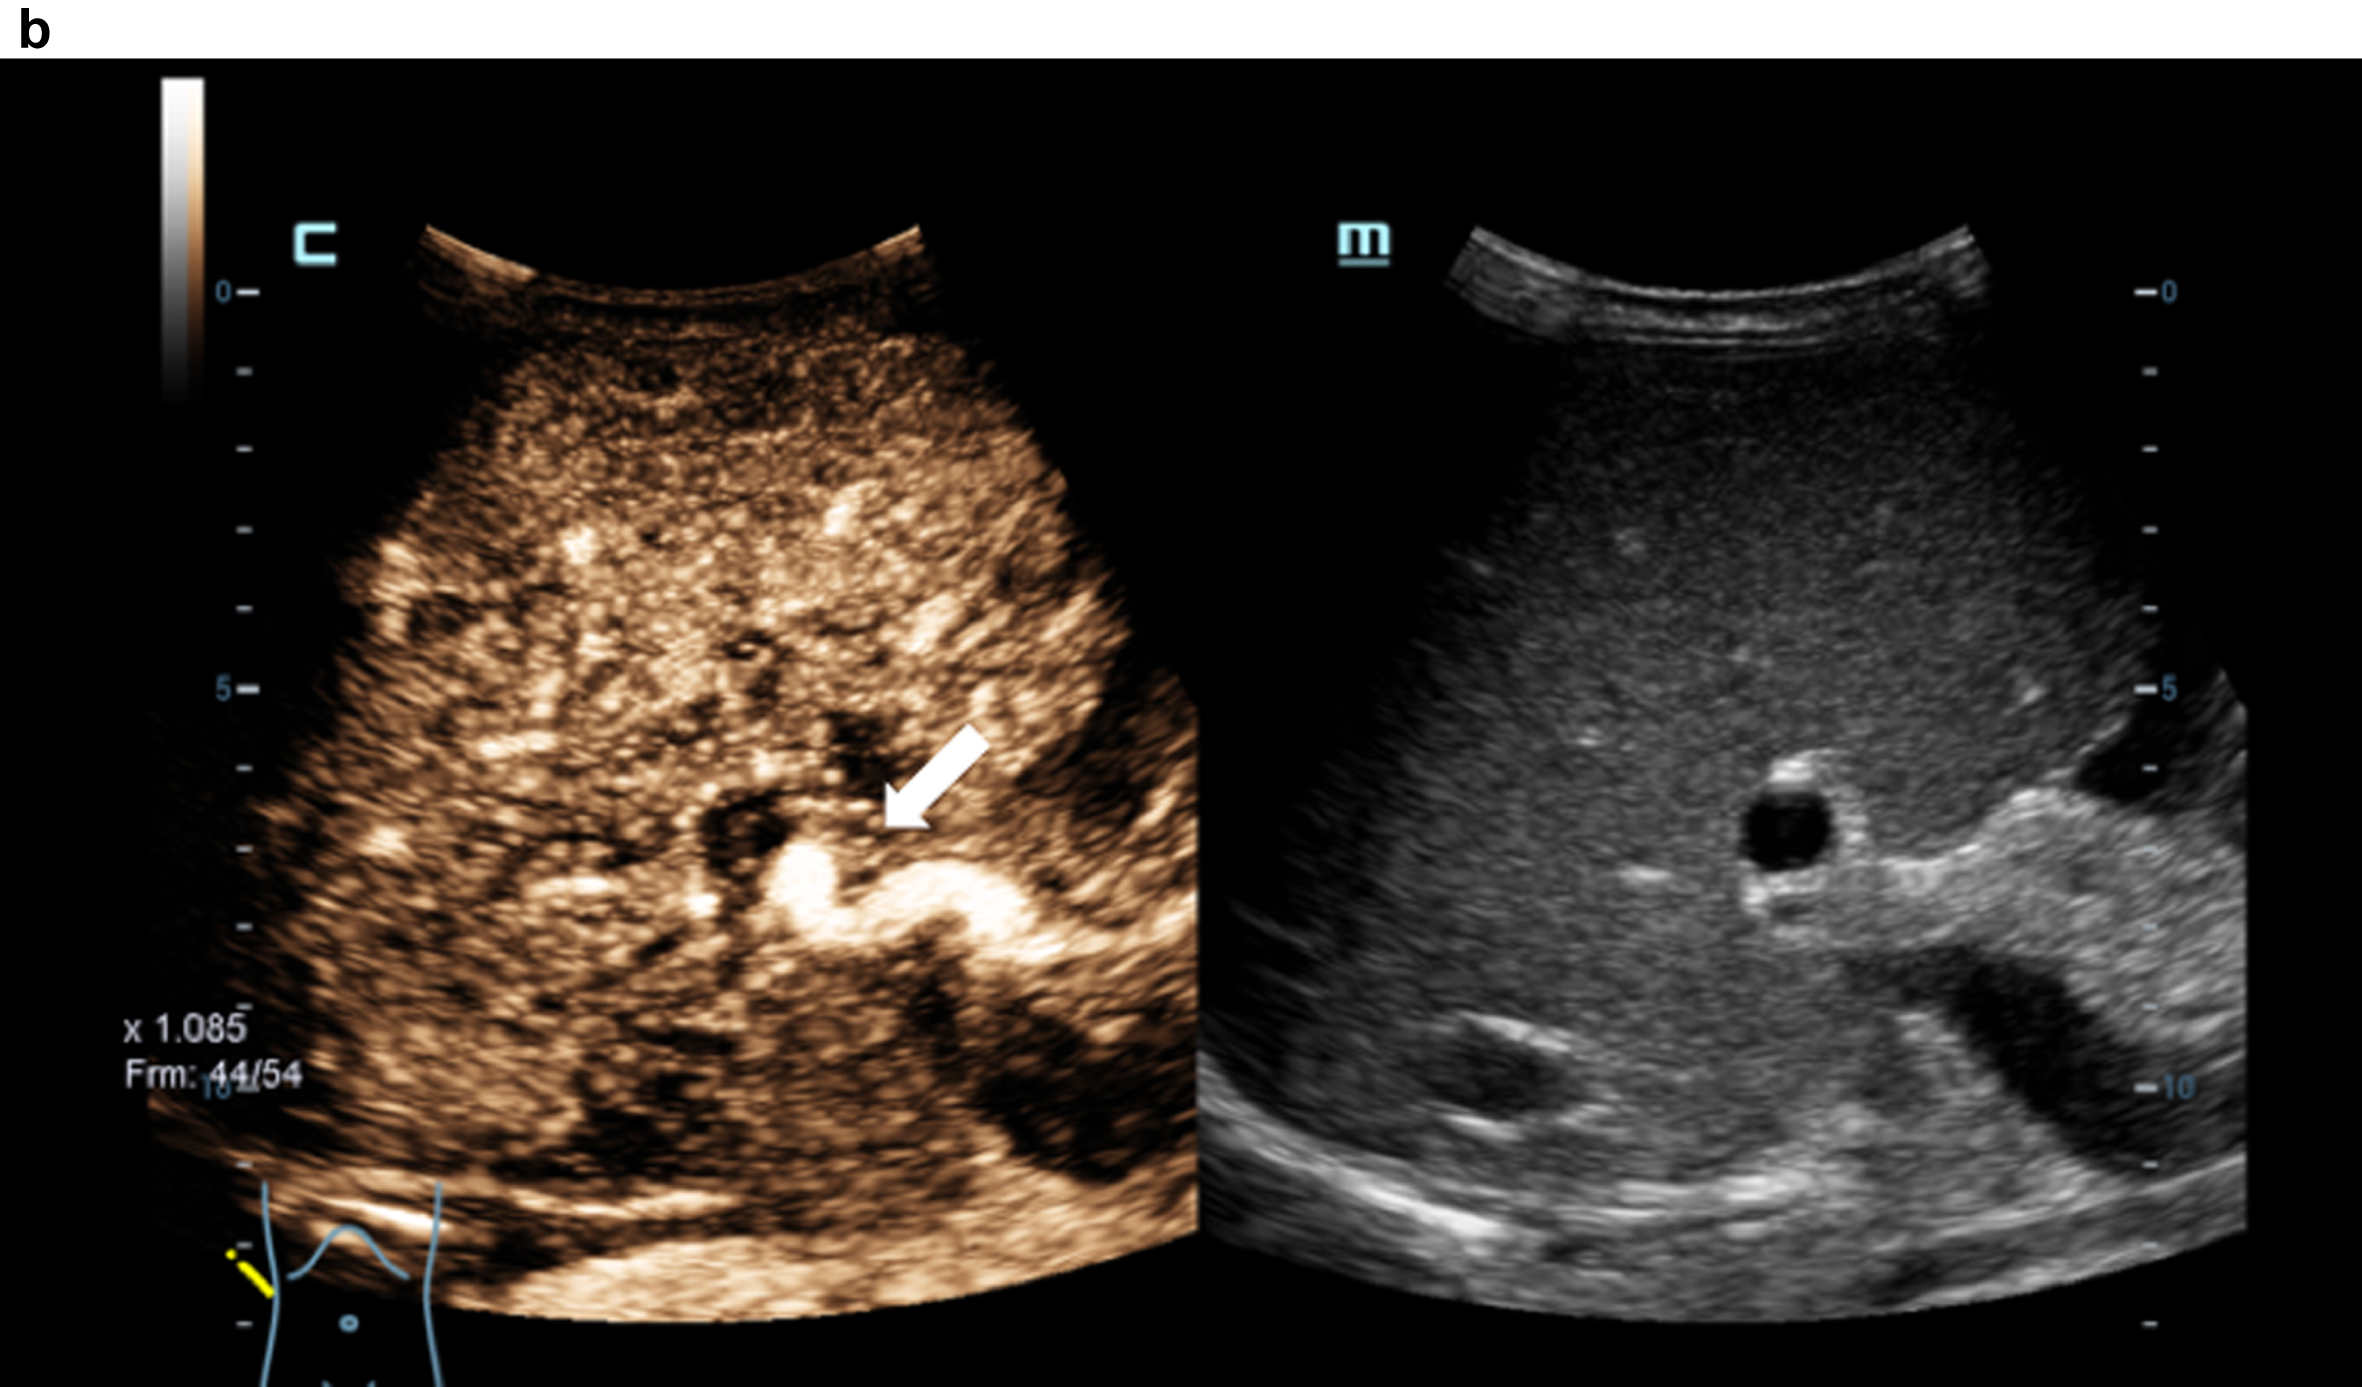
Fig. 2c
STQ shear wave elastography and readings up to 3.37 m/s as clear densification of the liver in cirrhosis.
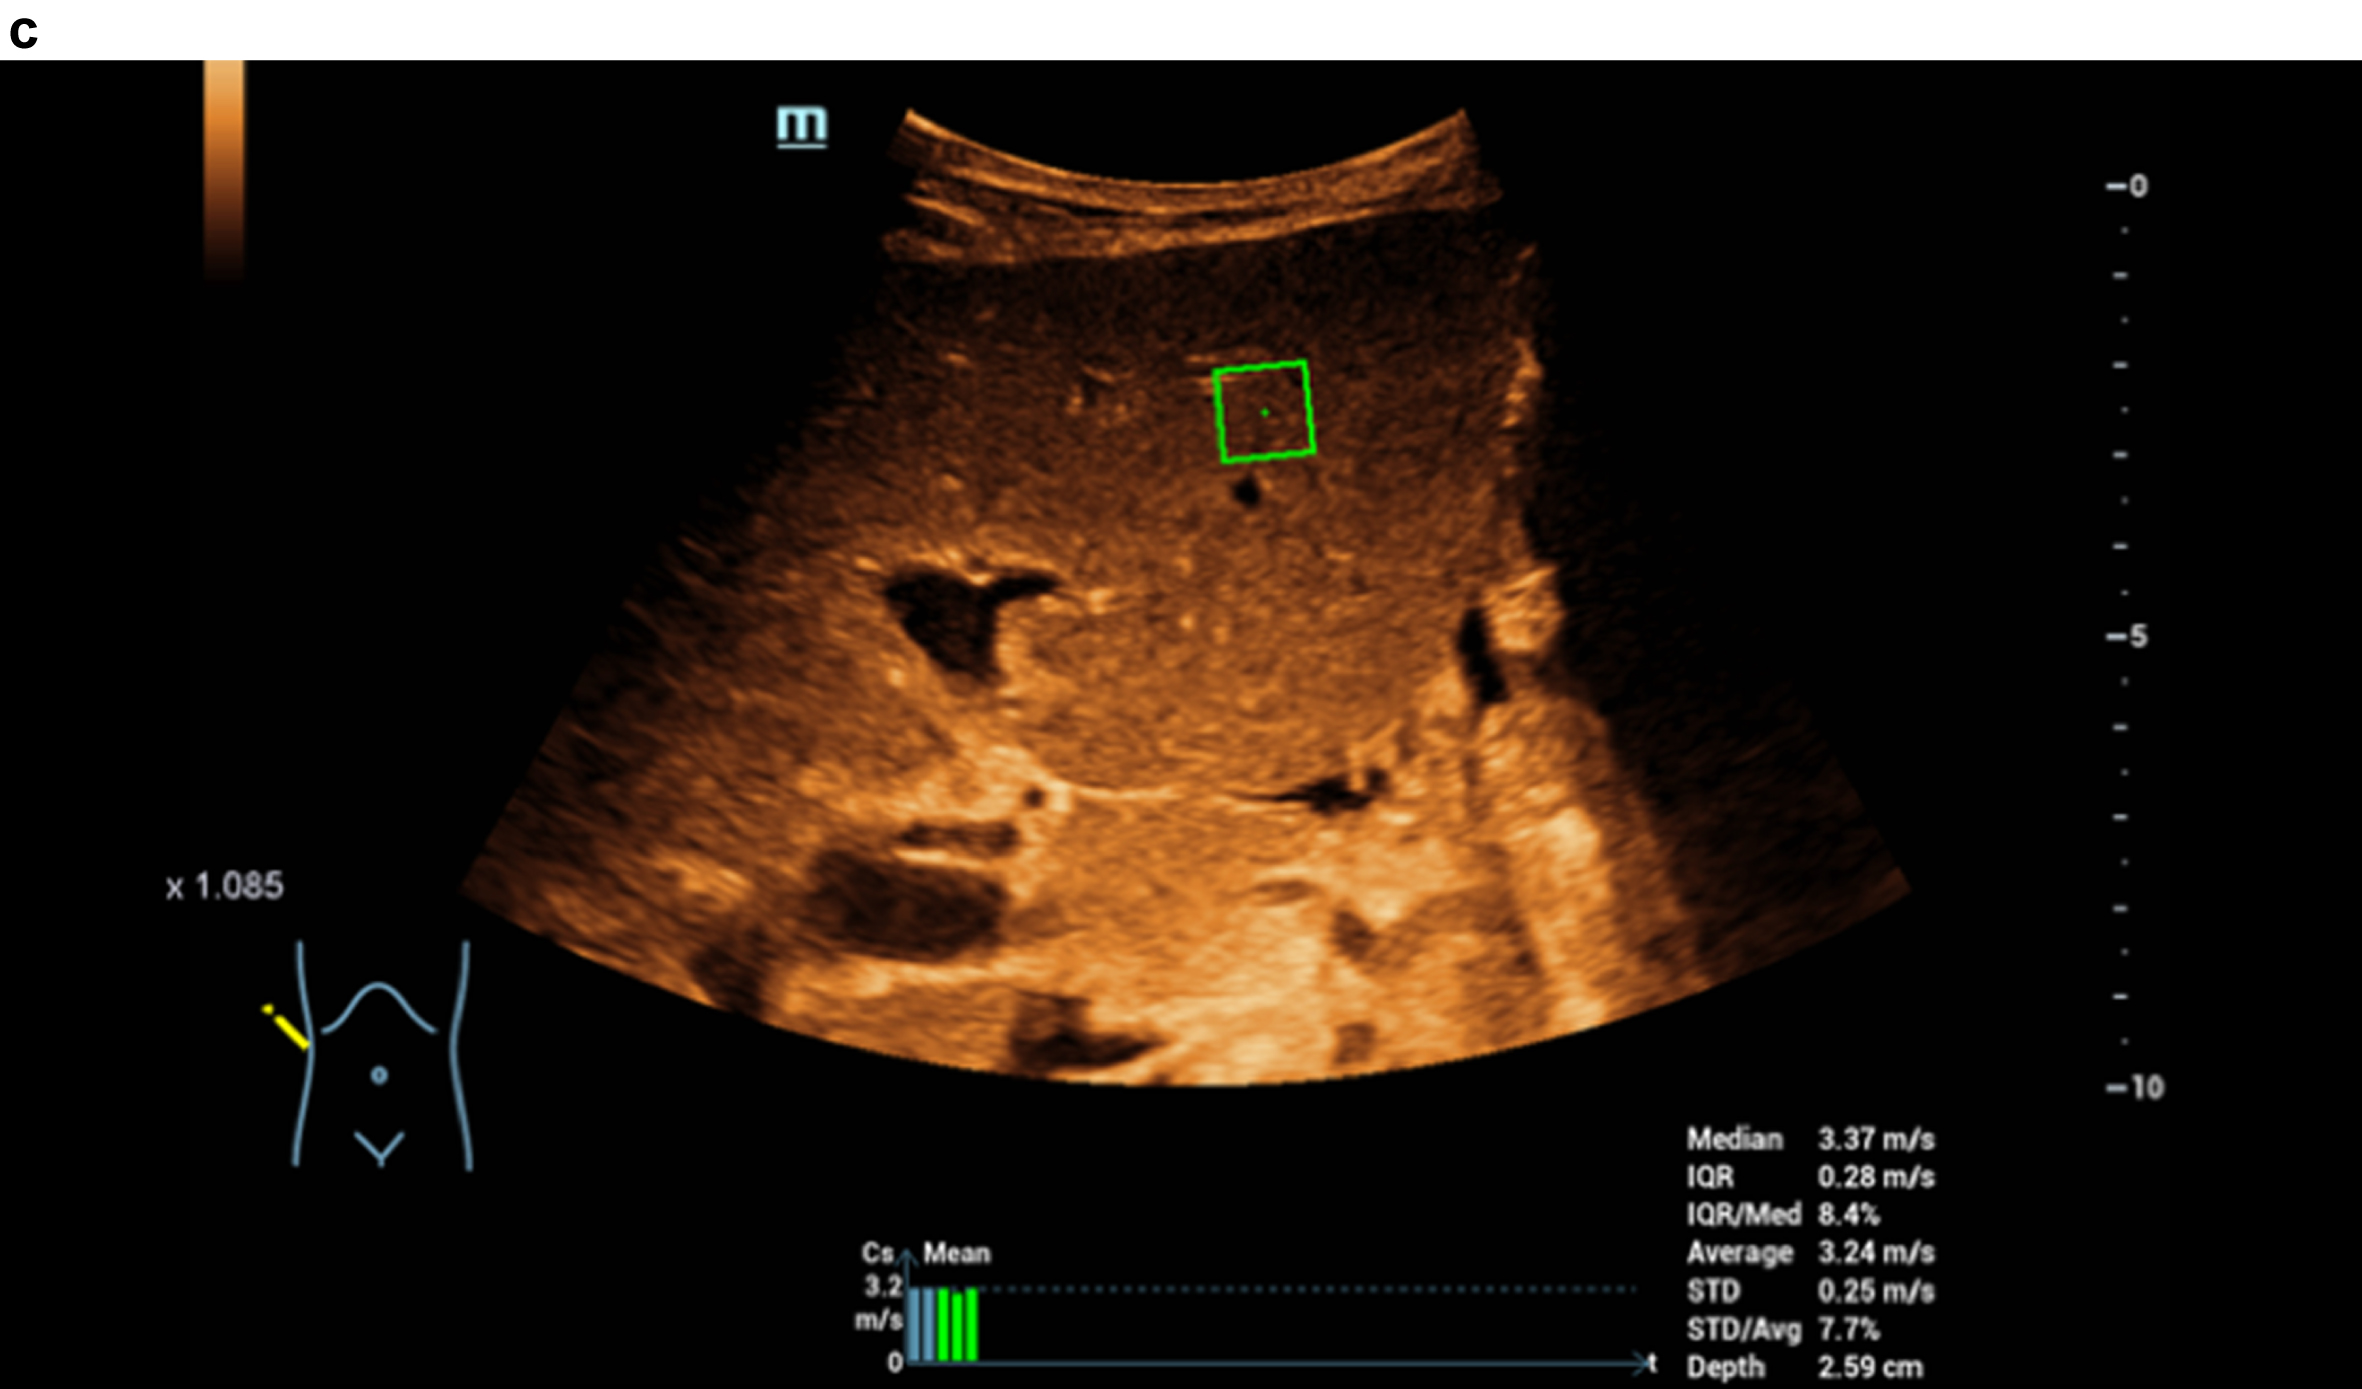
Fig. 2d
Color-coded evaluation of fatty liver with shear wave elastography showing signs of cirrhosis. Highest quality indicator (5 green marks).
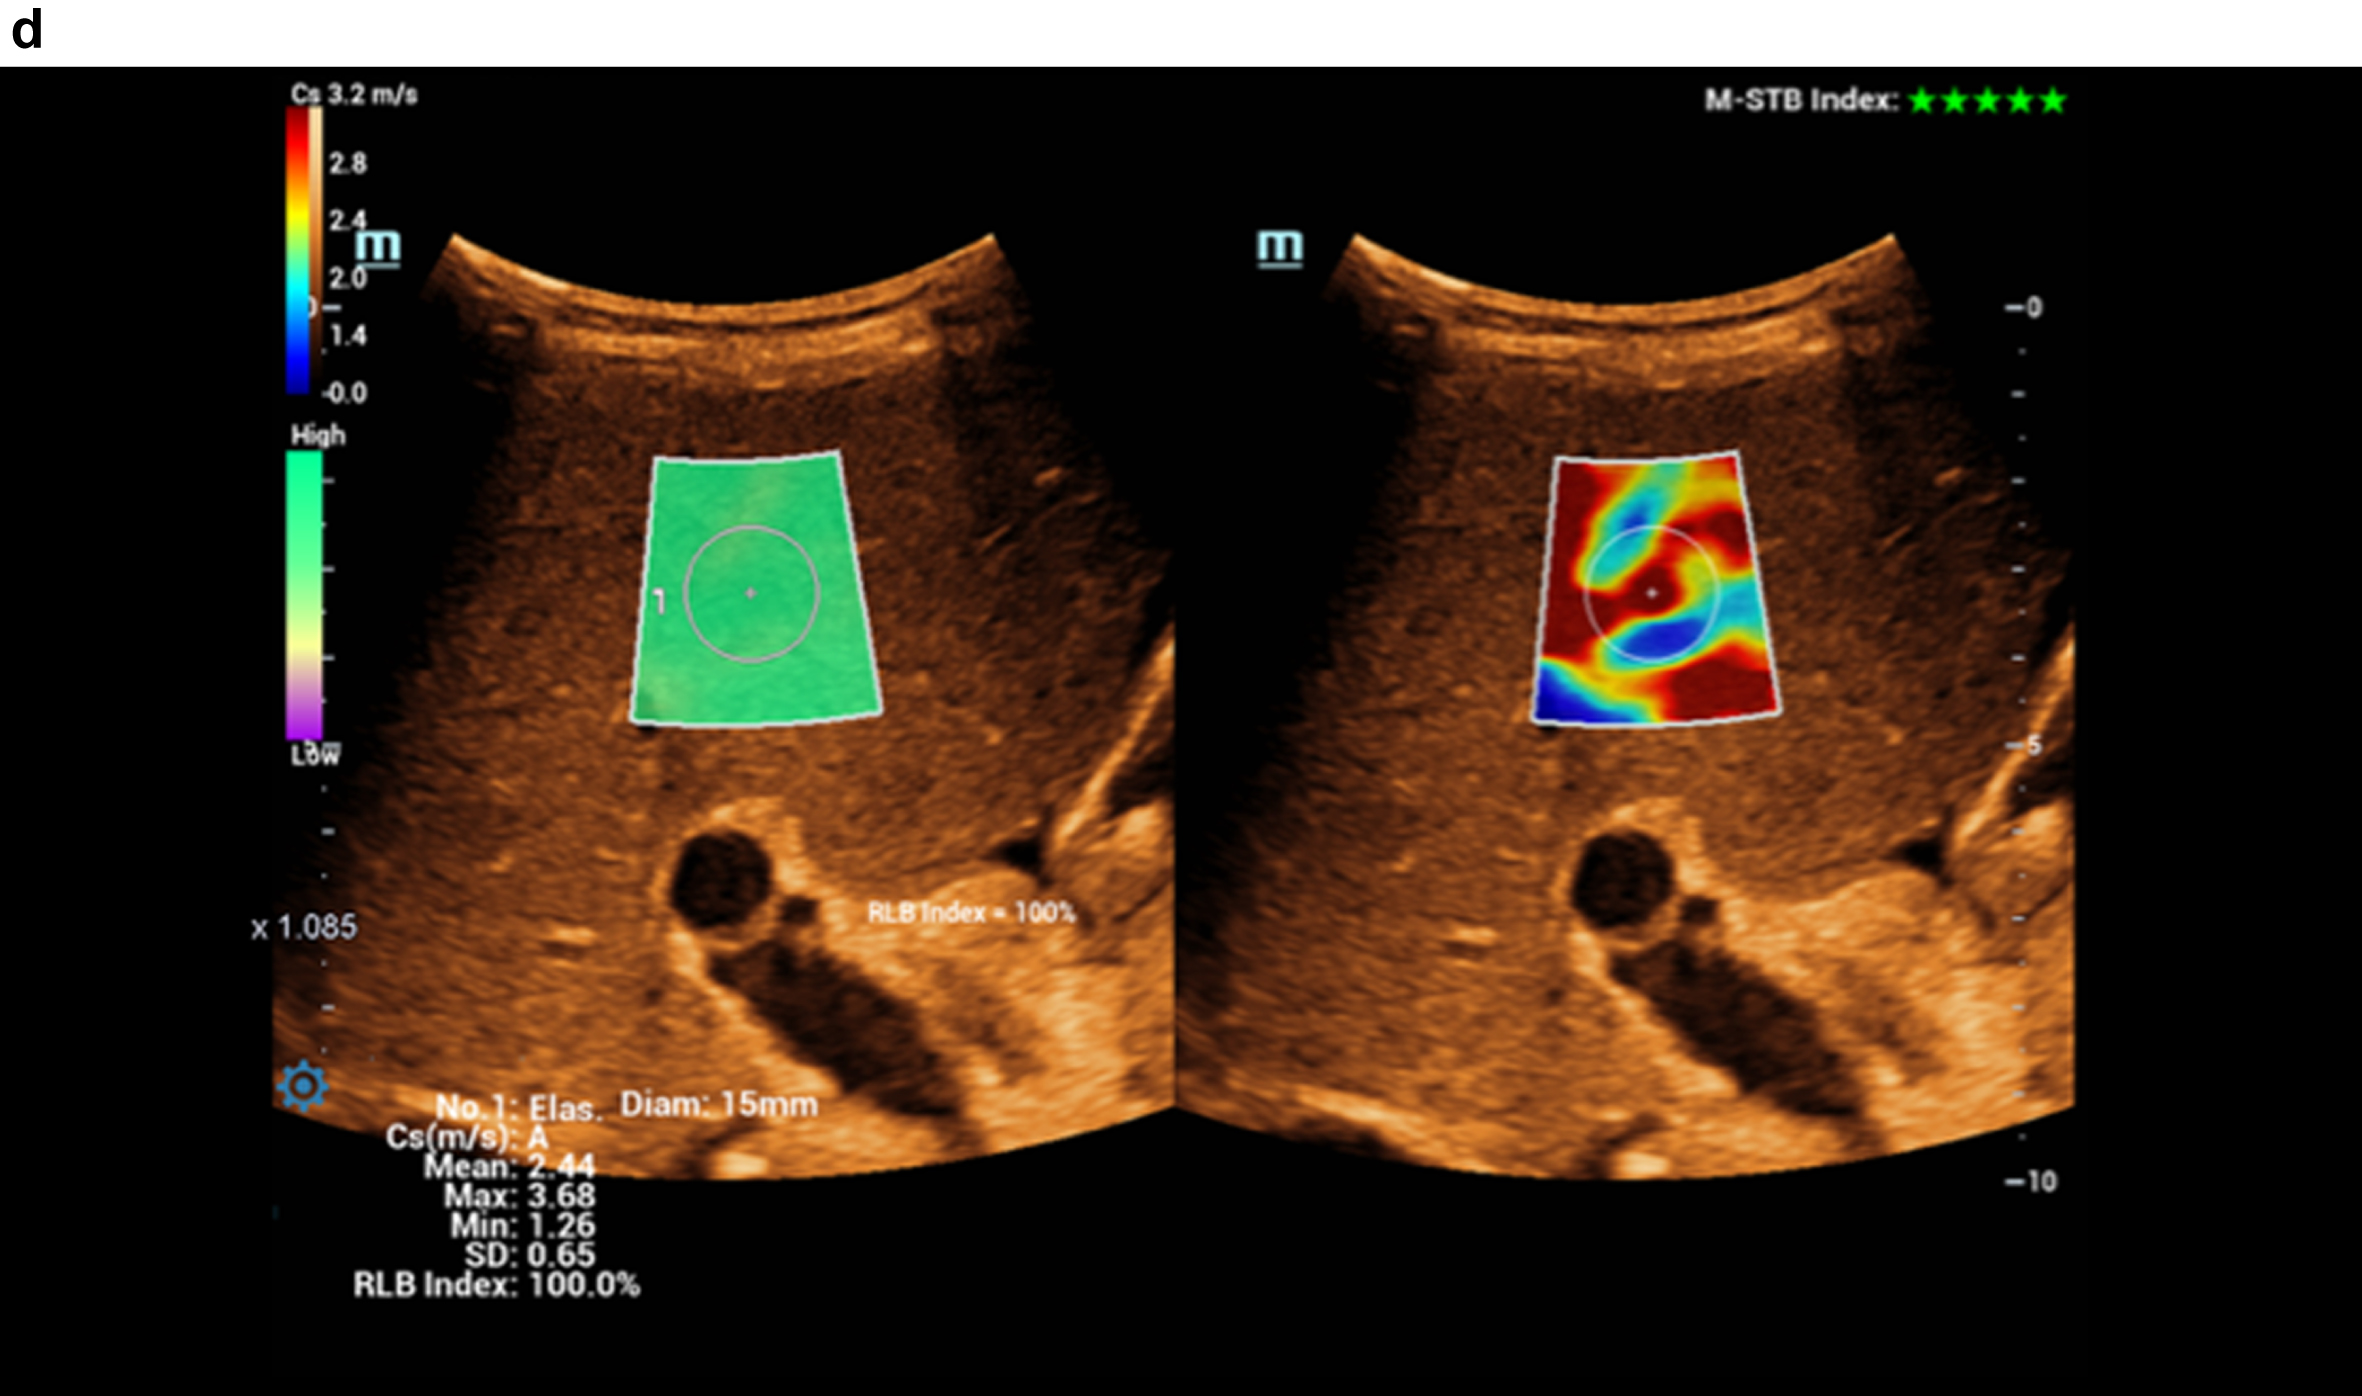
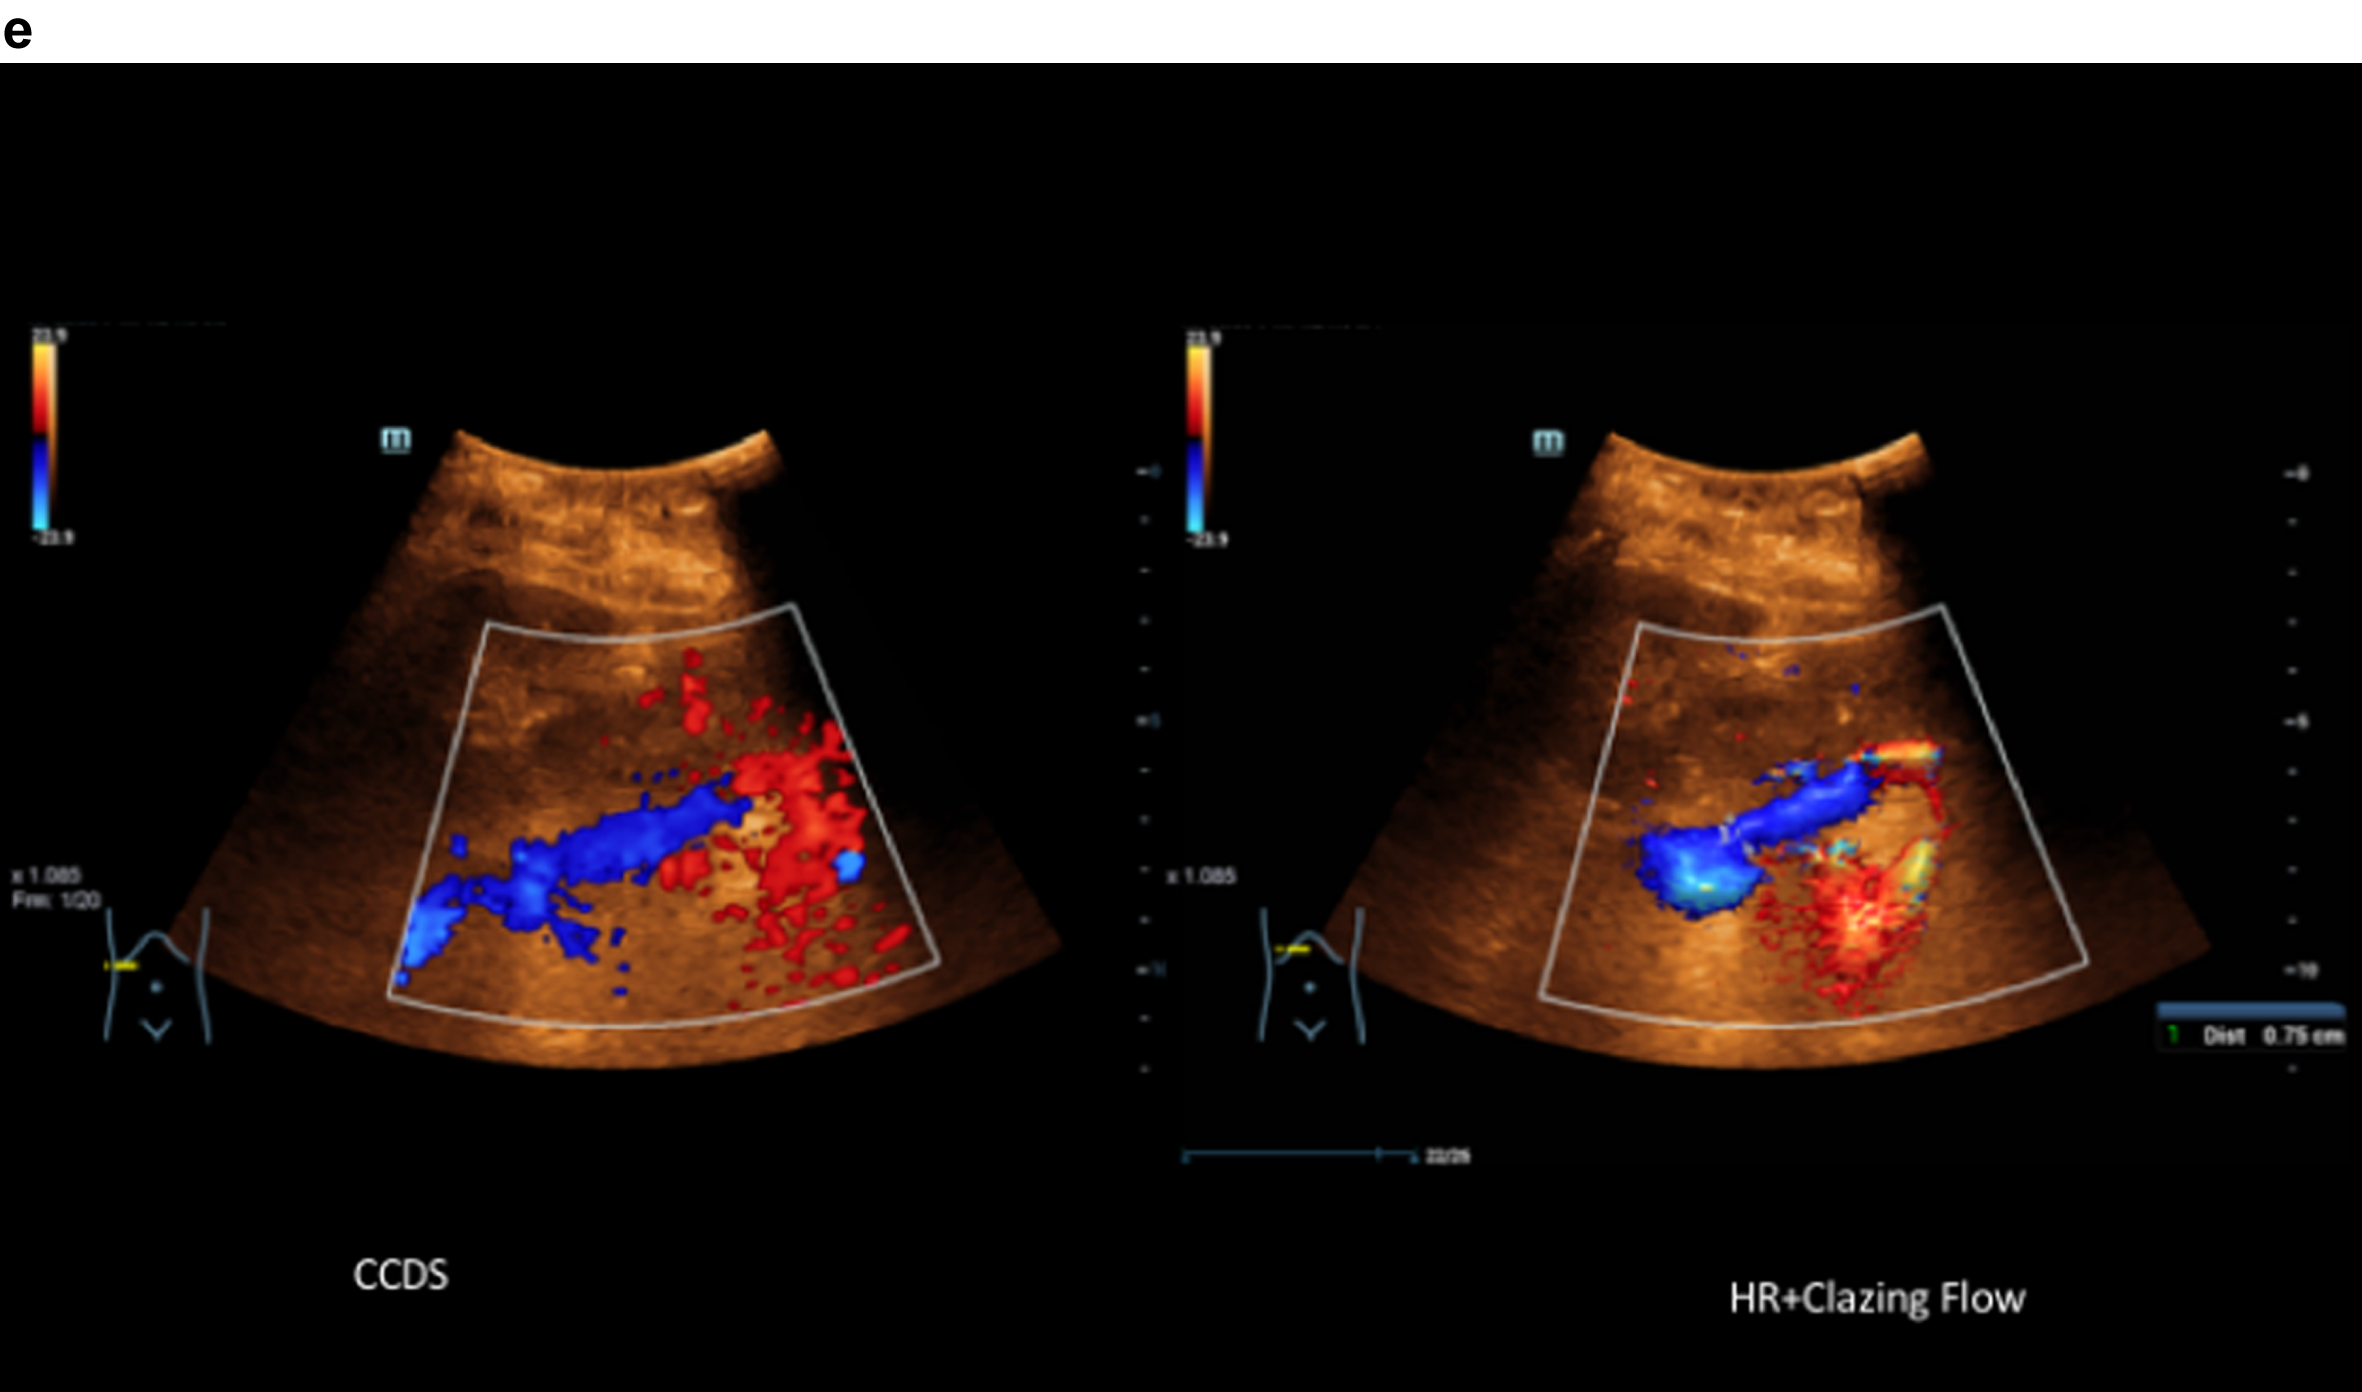
Fig. 2e
Comparison of flow imaging with CCDS and HR and Glazing Flow with significantly lower artefacts and higher image quality for the detection of the elongated arteria hepatica (arrow), the vena portae and the hepatic veins with HR and Glazing Flow.
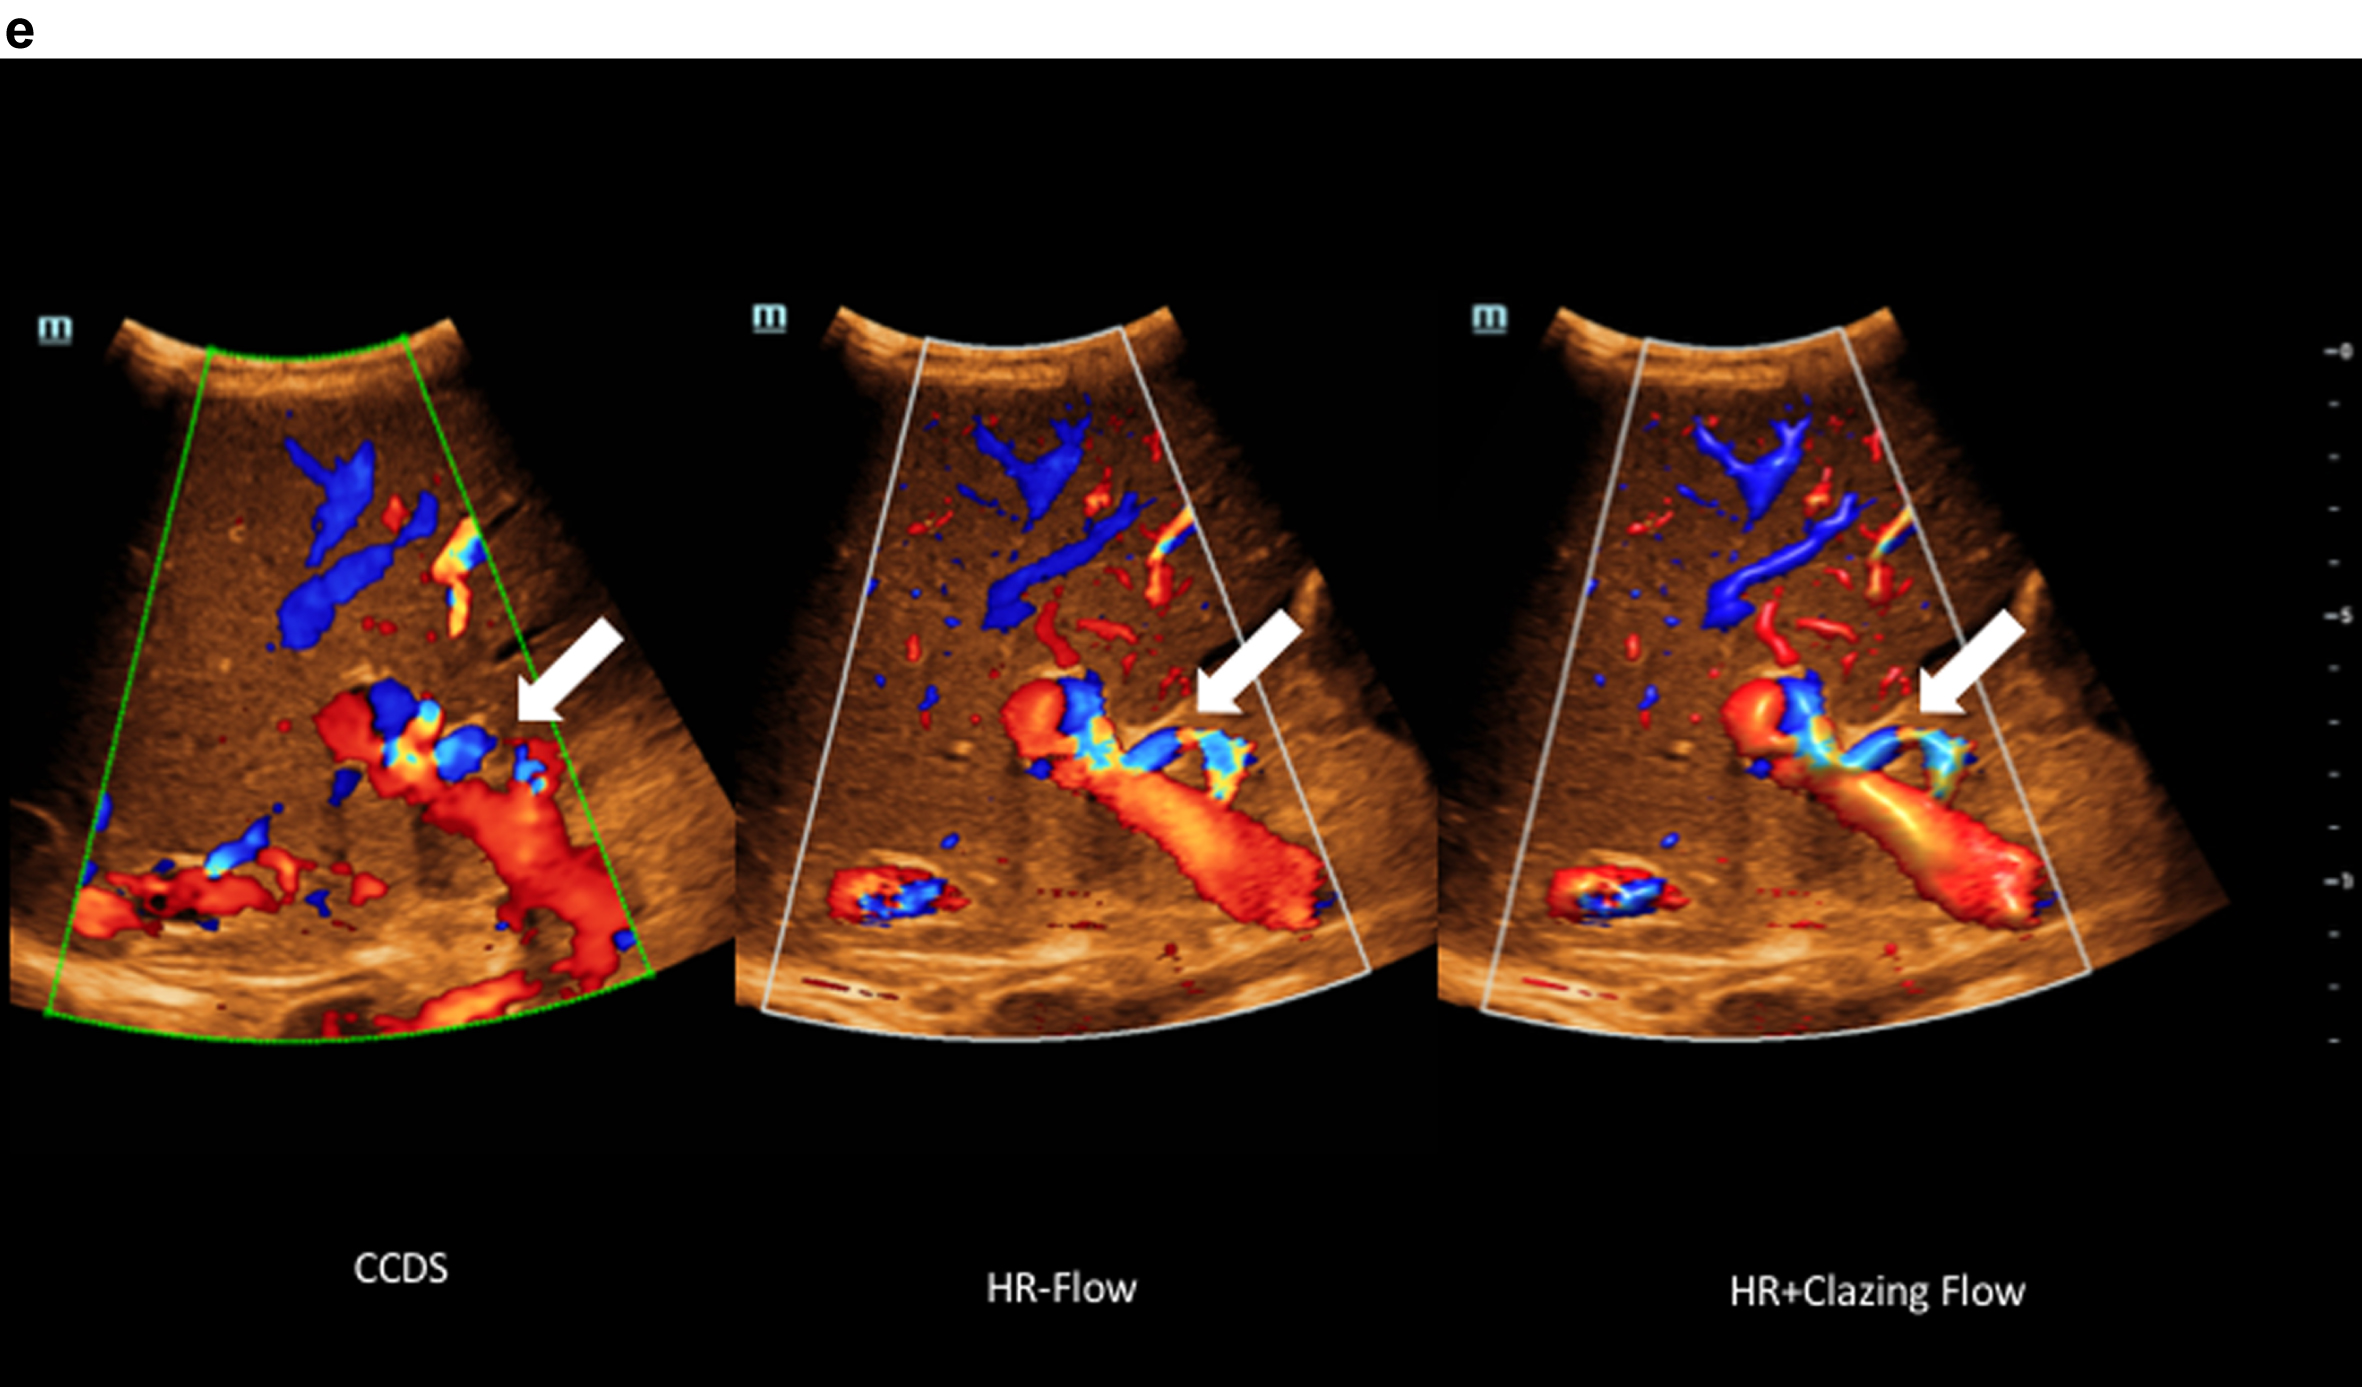
Fig. 2f
Haemodynamic assessment of the hepatic artery with CCDS, HR and Glazing Flow.
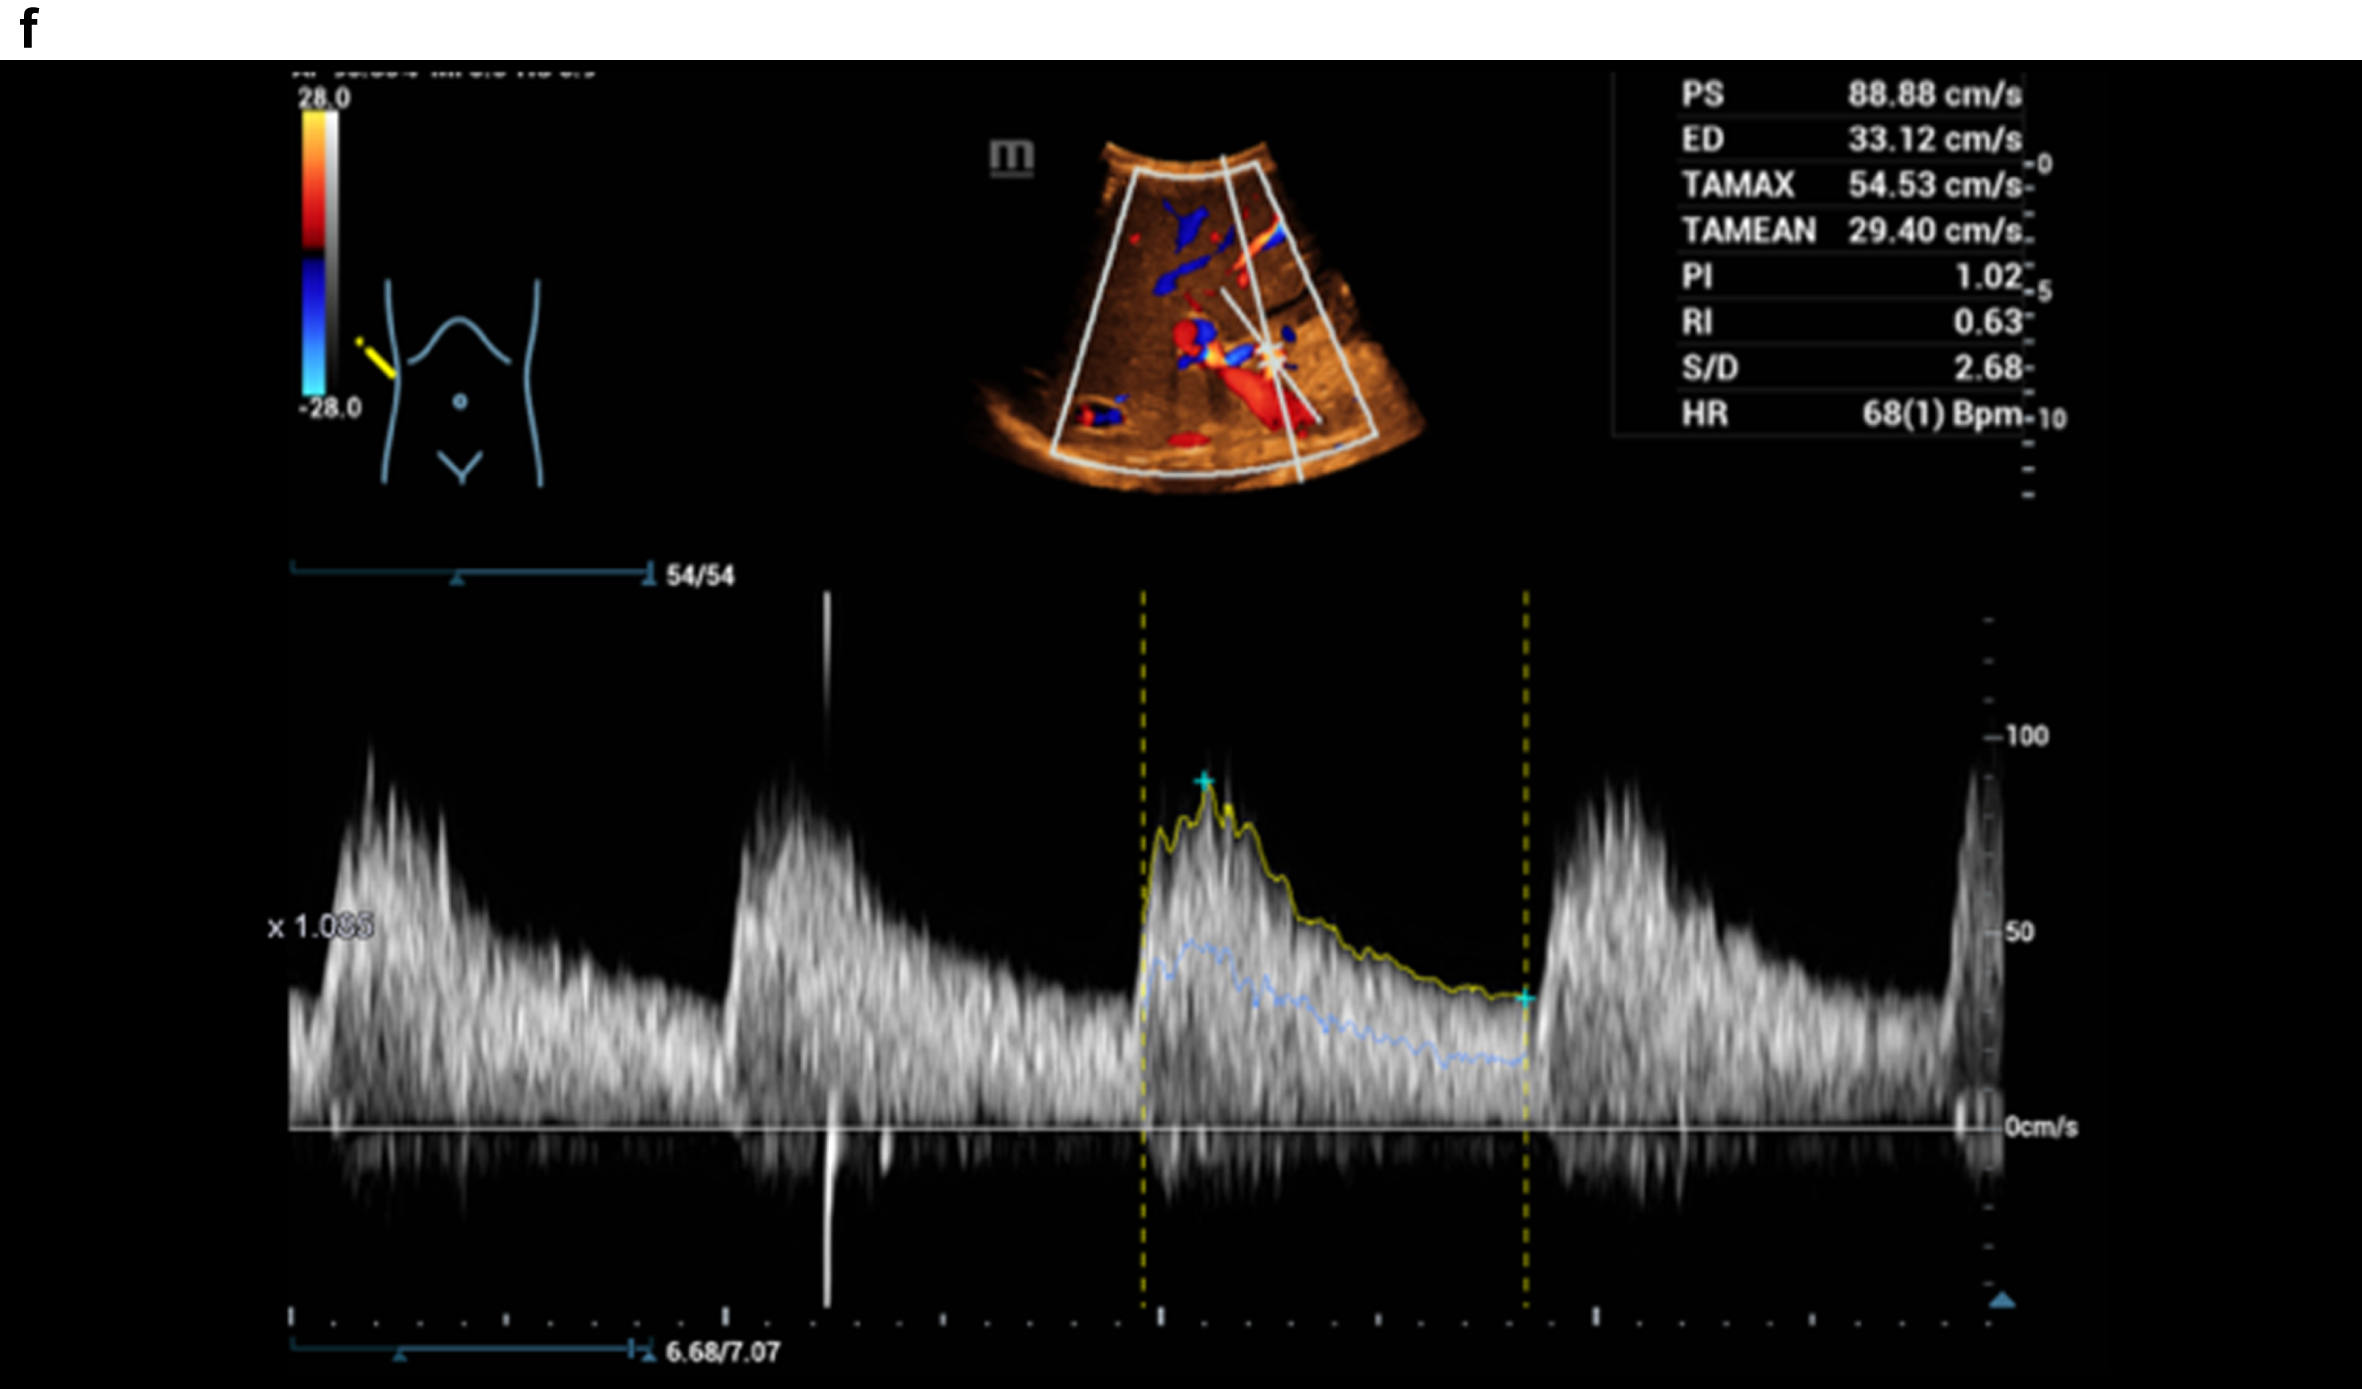
Figure 3 shows a constriction of the confluence, superior mesenteric vein and portal vein due to a space occupation at the hepatic hilus.
Fig. 3a
Highest degree of lumen reduction of the portal vein, confluens and superior mesenteric vein (VMS) due to space occupation at the mesenteric root, at the hepatic hilus and intrahepatic in contrast-enhanced CT. Vascular narrowing of the port vein (arrow).
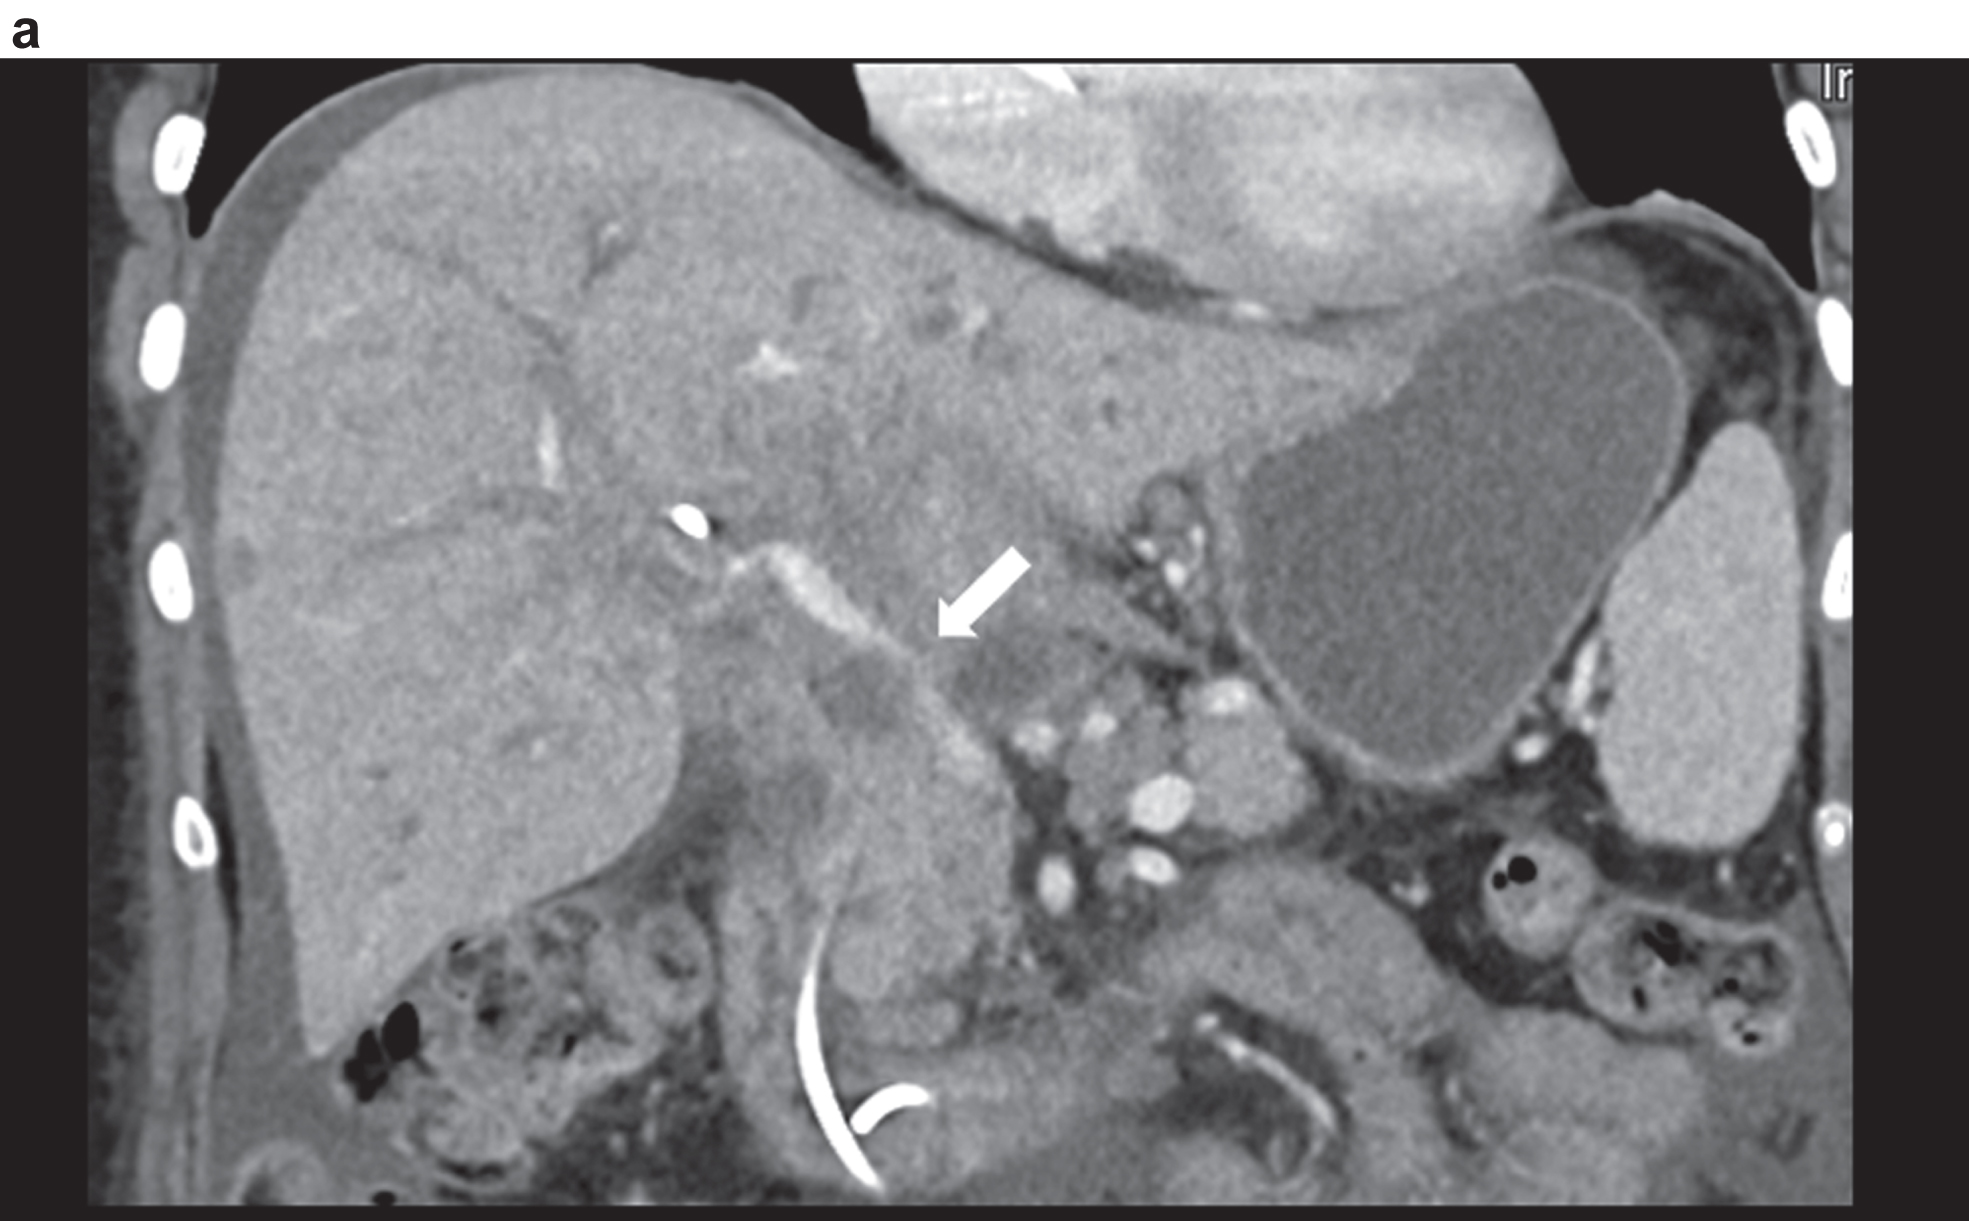
Fig. 3b
Flow assessment with CCDS, the constriction at the port vein with flow artefacts in color and in Doppler spectrum, alaising, blooming and proportionally also with vibrations.
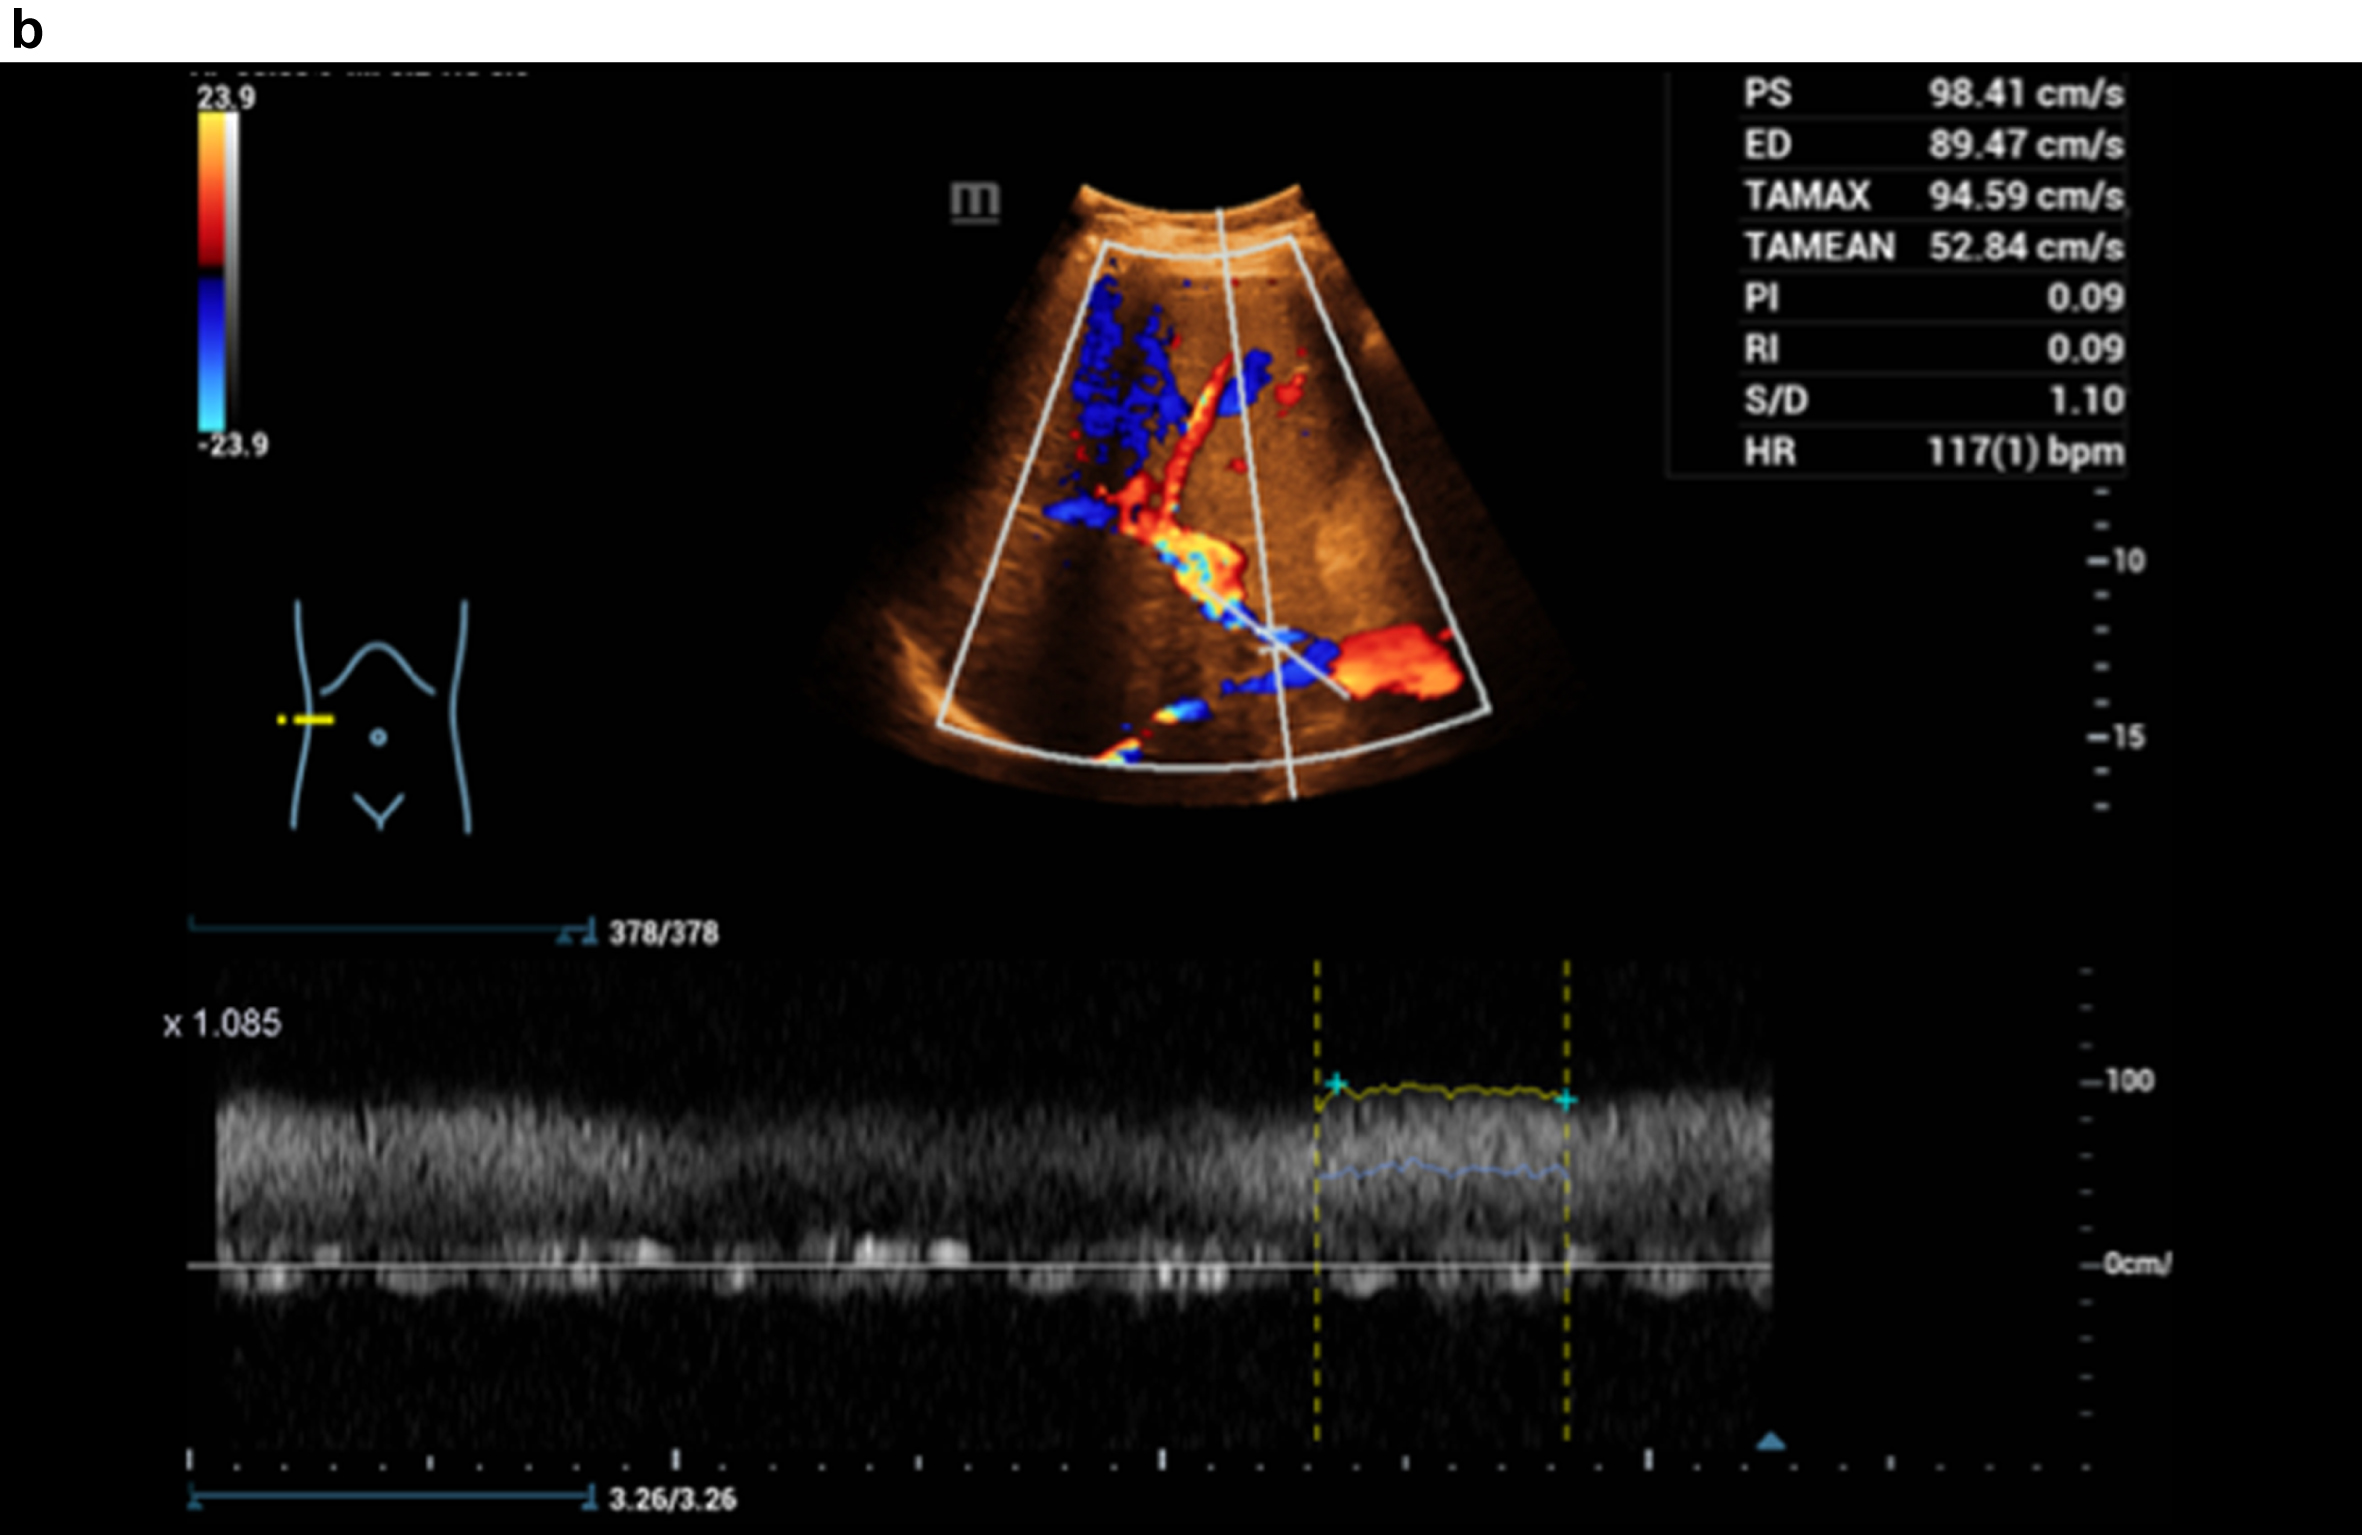
Fig. 3c
HR and Glazing Flow with significantly lower flow artefacts with constriction of the portal vein, Doppler spectrum better to derive.
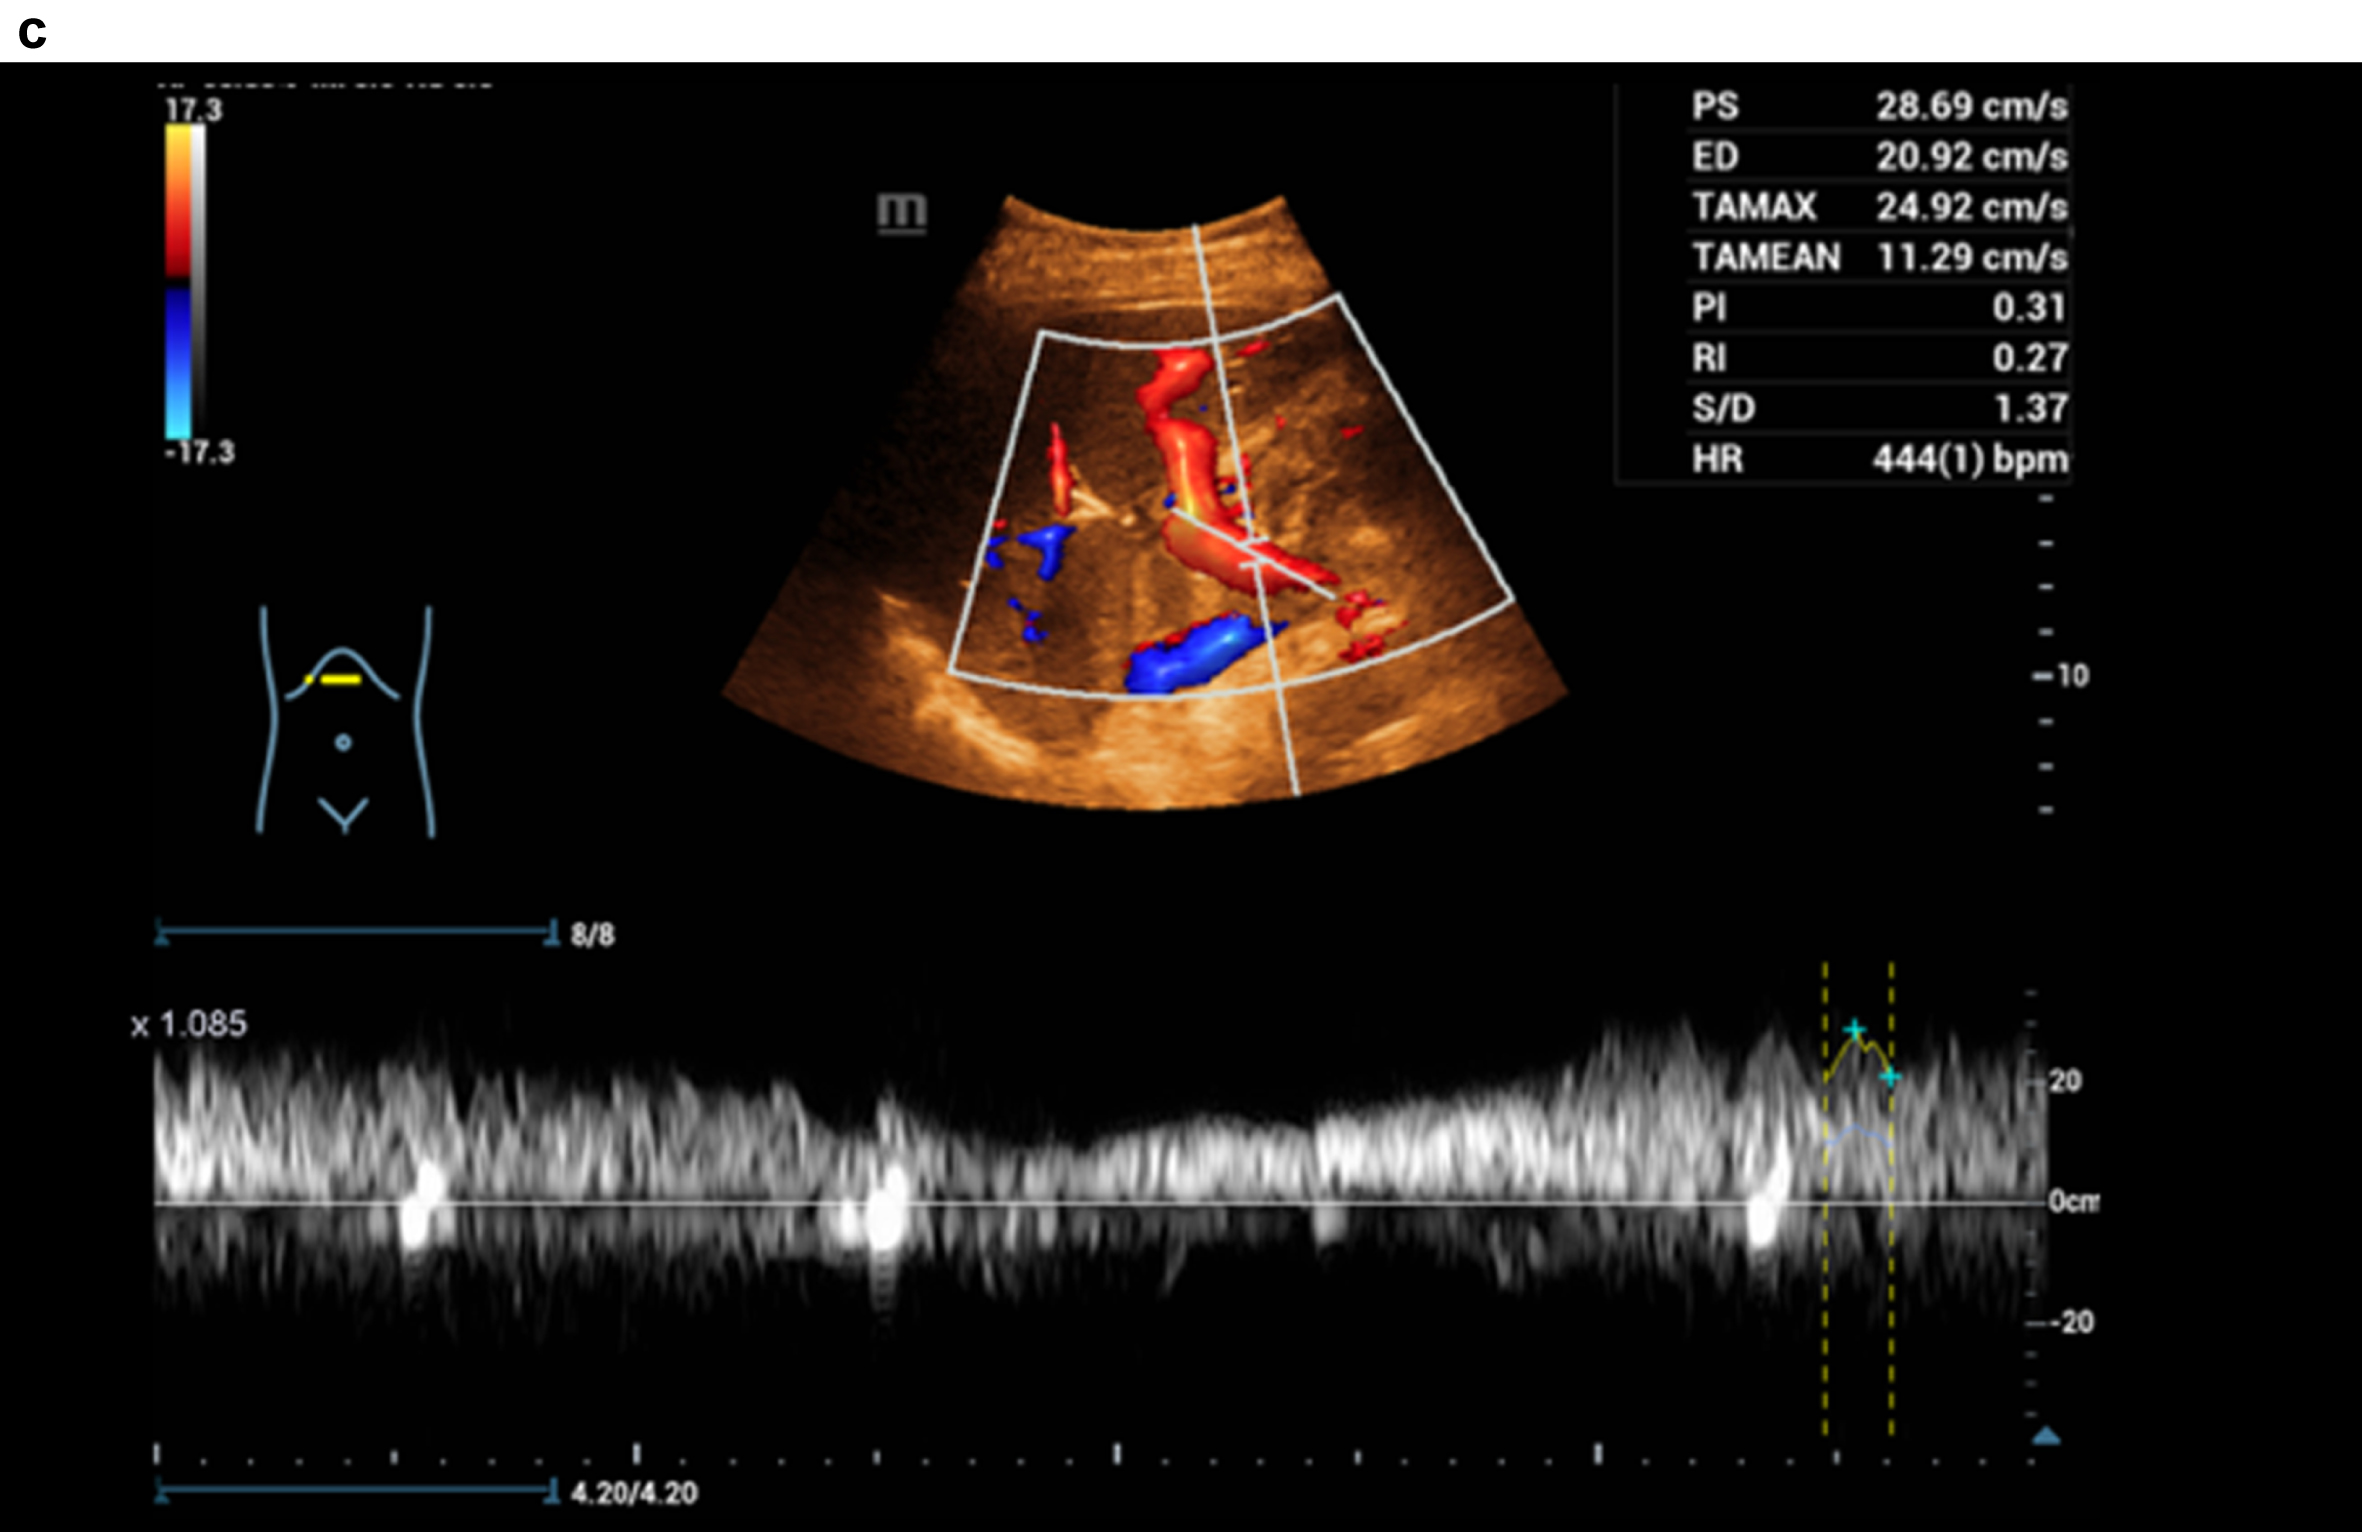
Fig. 3d
CT image of the pronounced constriction of the portal vein and VMS in the region of the hepatic hilus and the mesenteric root.
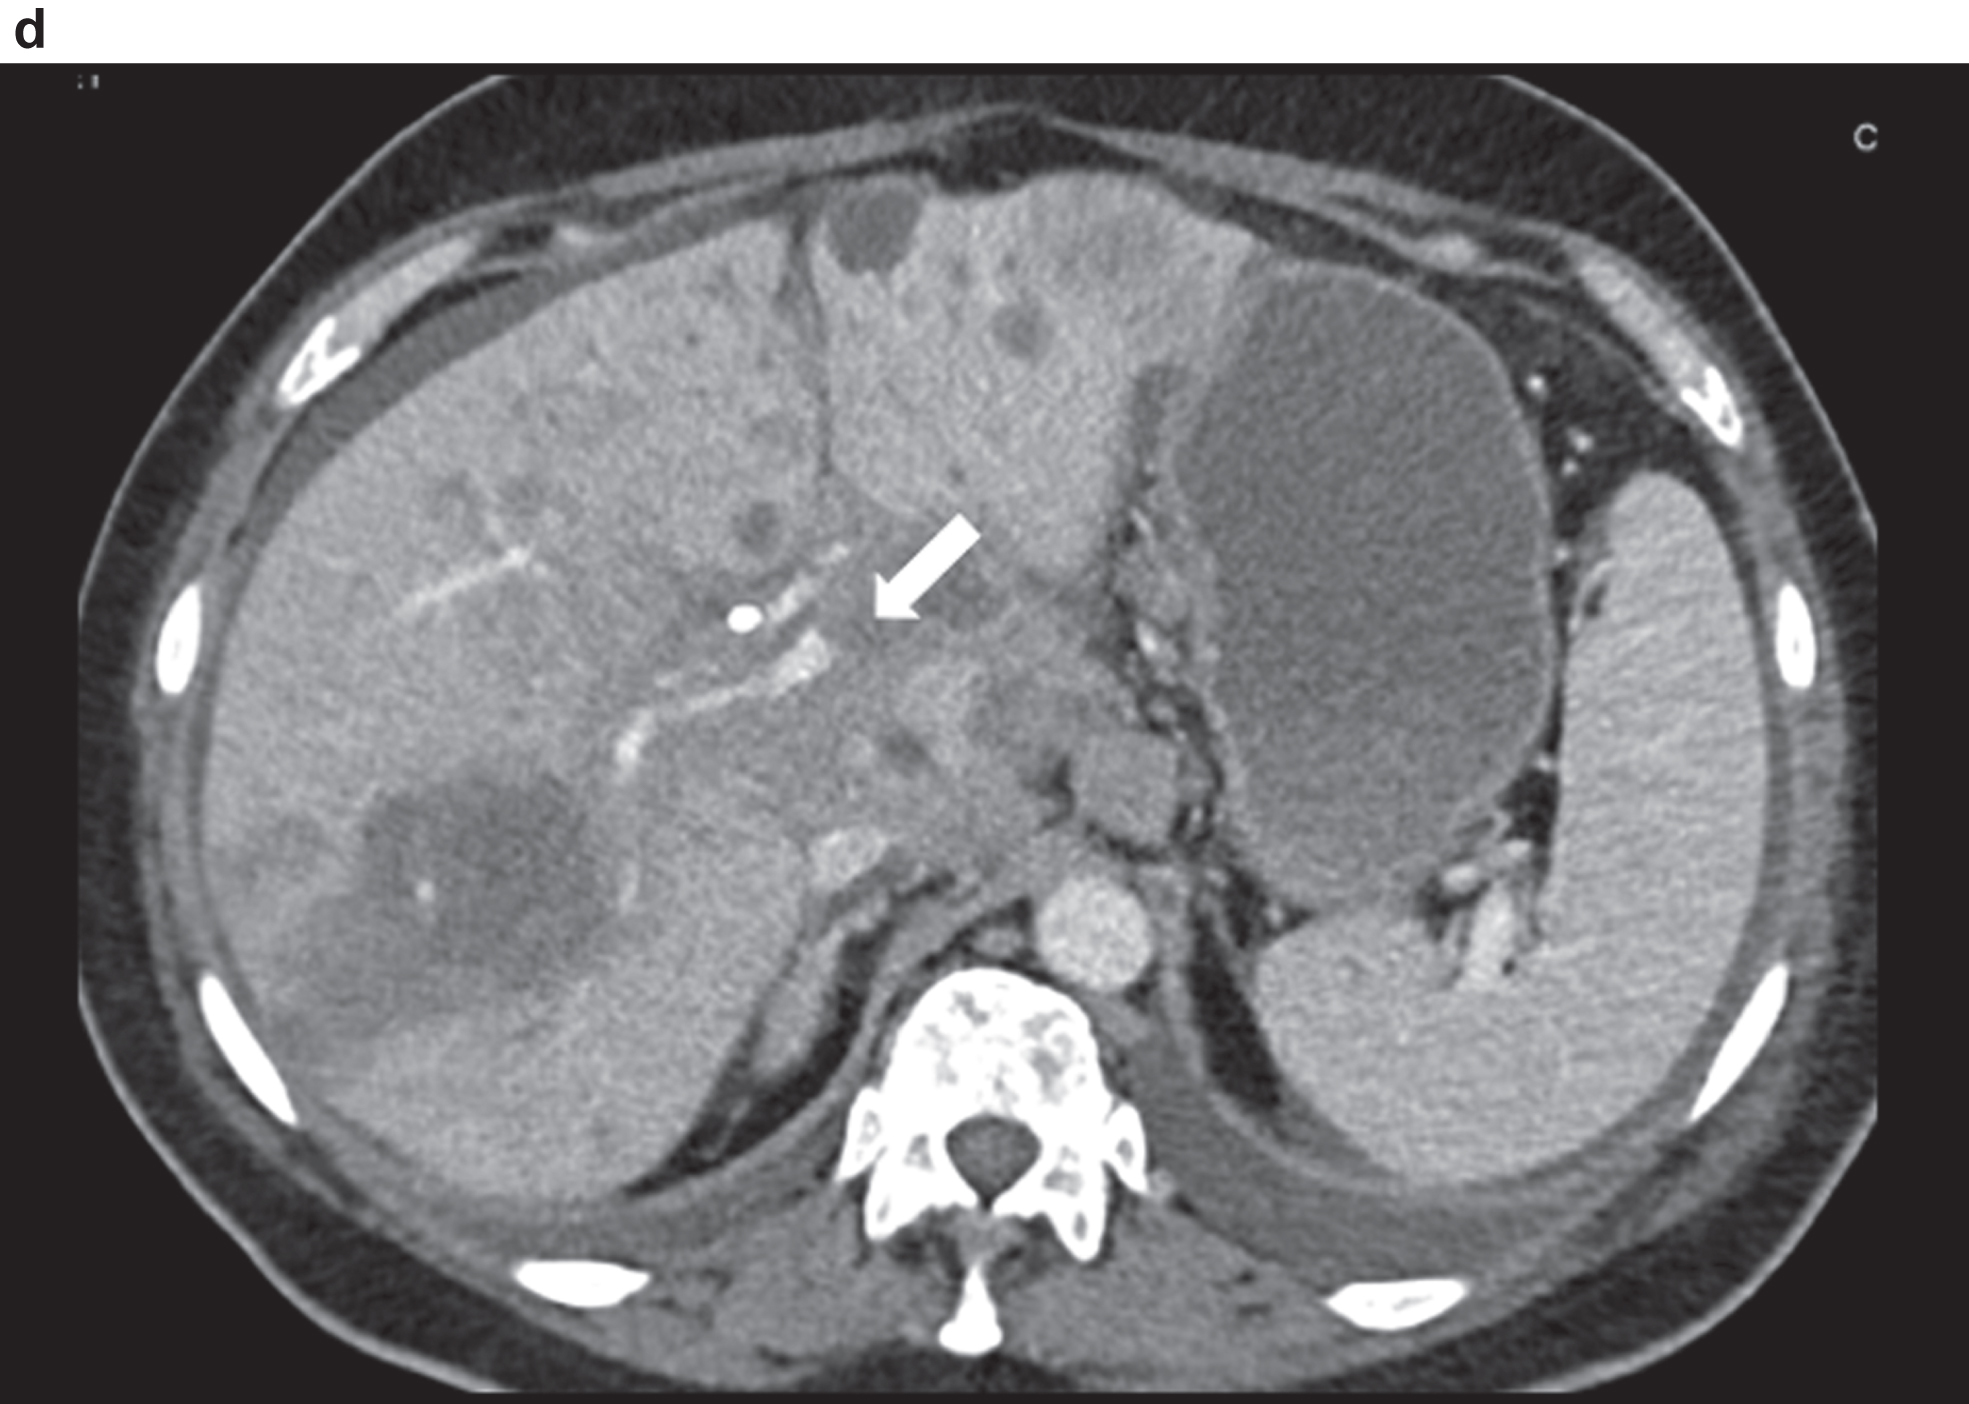
Fig. 3e
Comparison of CCDS and HR and Glazing Flow with lower flow artefacts by using HR and Glazing Flow in the pronounced venous constriction of the confluence, VMS and portal vein.
5Discussion
Color-coded Doppler sonography (CCDS) allows in the hands of experienced examiners a detailed recording of liver macrovascularization [1–4]. With the development of high-resolution probes and high-end ultrasound equipment, digital flow recording of liver perfusion, hepatic vein flow, portal vein and hepatic artery flow is becoming increasingly successful. The challenge is to correctly record very low venous flows, often < 10 cm/s, and also turbulent high arterial flows (up to 140 cm/s), to assess hemodynamics, and to avoid artifacts if possible. This pilot study shows that for this purpose, even under difficult examination conditions, the use of HR Flow in combination with Glazing Flow can facilitate the assessment of liver perfusion.
The clinical need to detect slow flow velocities has existed for some time, especially in areas where vascularity assessment is critical for diagnosis and treatment. Fundamental Doppler modalities for blood flow detection are limited for detection of very slow flow [1–4]. Low flow velocities often occur in small vessels. HR Flow is a novel method that can be used to detect the smallest flows. Glazing Flow is a novel method to visualize 2D color information in 3D. With the help of this advancement, a clearer delineation from surrounding tissue is achieved as well as a better differentiation of vessels that are close to each other or crossing each other. Glazing Flow can be set in 3 levels (Min, Mid, High), in which the plastic representation becomes increasingly clearer from minimum to high level [5].
In fundamental flow velocity detection methods (such as: color Doppler or power Doppler), slow tissue movements lead to spurious signals. These movements can occur due to respiration or muscular relaxation or tension as well as due to the movement of the vessel wall. Conventional wall filters (WF) can reduce or even completely suppress this effect. However, as a side effect, slow flows that are in the frequency range of the same bandwidth are also suppressed. The traditional methods acquire a limited number of sequences for a point in the Doppler window. The number of these sequences is either fixed in an ultrasound system or can be user-defined based on the measurement parameter of the packet size. This value is designed so that the ultrasound system displays an appropriate frame rate. The relatively low sampling rate limits both, the resolution of the color flow and the adjustment possibilities of the wall filter. The consequence of this is that the wall filter not only filters out tissue movement, but also low flow velocities.
For the hemodynamic assessment of liver perfusion, a combination of the quantification of liver parenchymal thickening with shear wave elastography is very useful. A large number of clinical studies have demonstrated that shear wave elastography provides good estimates for the extent of hepatic parenchymal thickening in the sense of increasing fibrosis up to cirrhosis [7, 9–13]. However, with increasing compaction of liver tissue, there is also rarefication of intrahepatic vessels, narrowing of hepatic veins, lumen reduction of portal vein branches, and collateral flow across the hepatic artery, which complicates flow assessment with CCDS. After portal vein thrombosis, the lumen of the portal vein is markedly narrowed, irregular with markedly reduced flow, often < 15 cm/s, and retrograde flow components, negatively coded often < 5 cm/s. There is a formation of collaterals to cavernous transformation with turbulence and fistula-like shunts with numerous flow artifacts, low and high flows must be detected simultaneously.
The combination of HR Flow and Glazing Flow allows to detect the residual flow of the portal vein in the presence of signs of portal hypertension, thus enabling hemodynamic assessment with Doppler analysis. This is also more easily accomplished with HR Flow and Glazing Flow in particularly pulsatile flow with right heart strain under difficult examination conditions. However, the combination of HR Flow and Glazing Flow particularly facilitates the acquisition of hepatic artery flow under difficult examination conditions, such as obesity per magna, lumen narrowing < 3 mm with low post-stenotic flow at RI < 0.5, and marked elongation.
The reading could show the possibility of an improvement of image quality for the combination of HR Flow and Glazing Flow and for the combination of HR Flow and Glazing Flow in this pre-selected patient population (p < 0.01). Nevertheless, partial angle dependence and proportional vessel wall over-sharpening and also aliasing still remain, so that the highest image quality of 5 points was not awarded once. However, especially under severe examination conditions of CCDS with values of maximum 2 points, at least satisfying 3 points could be achieved (on the scale up to 5). Improved color image quality can then help to facilitate hemodynamic assessment with Doppler, save examination time and help in follow-up examinations.
Image quality for CCDS over all cases was evaluated according to a scale between 1 and 5. The experienced reviewer scored the image quality with a mean level of 2.67. Therefore, the general examination conditions and the patient’s compliance were relevant. Inhomogeneous liver tissue in cases of severe steatosis, fibrosis or cirrhosis are the reason for reduced venous and portal venous flow, difficult scan conditions and reduced image quality. But also, the general conditions like colon interposition and fluid or meteorism near the liver and also an enlarged patient’s body mass index are the reason for reduction of the image quality [14]. Even in cases of reduced scanning conditions using HR Flow with Glazing Flow very good levels for the flow documentation could not be achieved, but in all cases flow evaluation of the portal vein and hepatic artery was easier to perform with less artefacts and higher quality of the Doppler spectral analysis. The score for the image quality for HR Flow in combination Glazing Flow ranged between 2 up to 4 with a mean of 3.67 (experienced reviewer) over all cases.
Technical limitations for CCDS are mainly angle dependence, blooming artifacts and aliasing. Especially in the case of very elongated course of the hepatic artery and narrow lumen, also in the hepatic veins and in the portal vein, flow detection can be facilitated by using HR Flow with Glazing Flow. This was then mapped by the better assessment of image quality in the independent reading. The main limitations of the present pilot study are the small number of cases, the examinations by only one experienced examiner, and the additional time needed up to 10 minutes for the complex comparative examinations to CCDS. Capillary dynamic evaluation is only possible using CEUS including perfusion imaging [15–24]. Currently, however, new high-resolution vascular ultrasound techniques corresponding to HR Flow and Glazing Flow are being installed in all high-end ultrasound units. Thus, this study provides a first approach for further multicenter targeted evaluation.
REFERENCES
[1] | Park HS , Desser TS , Jeffrey RB , Kamaya A . Doppler Ultrasound in Liver Cirrhosis: Correlation of Hepatic Artery and Portal Vein Measurements With Model for End-Stage Liver Disease Score. Journal of ultrasound in medicine official journal of the American Institute of Ultrasound in Medicine. (2017) ;36: (4):725–30. |
[2] | Gottardi A de , Berzigotti A , Buscarini E , García Criado A . Ultrasonografie vaskulärer Lebererkrankungen. Ultraschall in der Medizin (Stuttgart, Germany 1980). (2018) ;39: (4):382–405. |
[3] | Madhusudhan KS , Vyas S , Sharma S , Srivastava DN , Gupta AK . Portal vein abnormalities: an imaging review. Clinical Imaging. (2018) ;52: :70–8. |
[4] | Iwao T , Toyonaga A , Oho K , Tayama C , Masumoto H , Sakai T , et al. Value of Doppler ultrasound parameters of portal vein and hepatic artery in the diagnosis of cirrhosis and portal hypertension. The American Journal of Gastroenterology. (1997) ;92: (6):1012–7. |
[5] | Jiang Z-Z , Huang Y-H , Shen H-L , Liu X-T . Clinical Applications of Superb Microvascular Imaging in the Liver, Breast, Thyroid, Skeletal Muscle, and Carotid Plaques. Journal of Ultrasound in Medicine Official Journal of the American Institute of Ultrasound in Medicine. (2019) ;38: (11):2811–20. |
[6] | Kammerer S , Stroszczynski C , Jung EM . Functional ultrasound imaging of the venous valve of the great saphenous vein in the area around the crosse using the novel vector flow technique. Clinical Hemorheology and Microcirculation. (2020) ;76: (2):211–9. |
[7] | Bamber J , Cosgrove D , Dietrich CF , Fromageau J , Bojunga J , Calliada F , et al. EFSUMB guidelines and recommendations on the clinical use of ultrasound elastography. Part 1: Basic principles and technology. Ultraschall in der Medizin (Stuttgart, Germany 1980). (2013) ;34: (2):169–84. |
[8] | Cosgrove D , Piscaglia F , Bamber J , Bojunga J , Correas J-M , Gilja OH , et al. EFSUMB guidelines and recommendations on the clinical use of ultrasound elastography. Part 2: Clinical applications. Ultraschall in der Medizin (Stuttgart, Germany 1980). (2013) ;34: (3):238–53. |
[9] | Dietrich CF , Bamber J , Berzigotti A , Bota S , Cantisani V , Castera L , et al. EFSUMB-Leitlinien und Empfehlungen zur klinischen Anwendung der Leberelastographie, Update 2017 (Langversion). Ultraschall in der Medizin (Stuttgart, Germany 1980). (2017) ;38: (4):e16–e47. |
[10] | Barr RG , Wilson SR , Rubens D , Garcia-Tsao G , Ferraioli G . Update to the Society of Radiologists in Ultrasound Liver Elastography Consensus Statement. Radiology. (2020) ;296: (2):263–74. |
[11] | Xiao G , Zhu S , Xiao X , Yan L , Yang J , Wu G . Comparison of laboratory tests, ultrasound, or magnetic resonance elastography to detect fibrosis in patients with nonalcoholic fatty liver disease: A meta-analysis. Hepatology (Baltimore, Md.). (2017) ;66: (5):1486–501. |
[12] | Ferraioli G , Wong VW-S , Castera L , Berzigotti A , Sporea I , Dietrich CF , et al. Liver Ultrasound Elastography: An Update to the World Federation for Ultrasound in Medicine and Biology Guidelines and Recommendations. Ultrasound in Medicine & Biology. (2018) ;44: (12):2419–40. |
[13] | Mulazzani L , Cantisani V , Piscaglia F . Different techniques for ultrasound liver elastography. Journal of Hepatology. (2019) ;70: (3):545–7. |
[14] | Putz FJ , Verloh N , Erlmeier A , Schelker RC , Schreyer AG , Hautmann MG , et al. Influence of limited examination conditions on contrast-enhanced sonography for characterising liver lesions. Clinical Hemorheology and Microcirculation. (2019) ;71: (2):267–76. |
[15] | Dong Y , Qiu Y , Yang D , Yu L , Zuo D , Zhang Q , et al. Potential application of dynamic contrast enhanced ultrasound in predicting microvascular invasion of hepatocellular carcinoma. Clinical Hemorheology and Microcirculation. (2021) ;77: (4):461–9. |
[16] | Dietrich CF , Nolsøe CP , Barr RG , Berzigotti A , Burns PN , Cantisani V , et al. Guidelines and Good Clinical Practice Recommendations for Contrast-Enhanced Ultrasound (CEUS) in the Liver-Update 2020 WFUMB in Cooperation with EFSUMB, AFSUMB, AIUM, and FLAUS. Ultrasound in Medicine & Biology. (2020) ;46: (10):2579–604. |
[17] | Sidhu PS , Cantisani V , Dietrich CF , Gilja OH , Saftoiu A , Bartels E , et al. Die EFSUMB-Leitlinien und Empfehlungen für den klinischen Einsatz des kontrastverstärkten Ultraschalls (CEUS) bei nicht-hepatischen Anwendungen: Update 2017 (Langversion). Ultraschall in der Medizin (Stuttgart, Germany 1980). (2018) ;39: (2):e2–e44. |
[18] | Wiesinger I , Wiggermann P , Zausig N , Beyer LP , Salzberger B , Stroszczynski C , et al. Perkutane Therapie maligner Leberläsionen: Evaluation des Therapieerfolgs mittels CEUS und Perfusionssoftware. Ultraschall in der Medizin (Stuttgart, Germany 1980). (2018) ;39: (4):440–7. |
[19] | Schellhaas B , Bernatik T , Bohle W , Borowitzka F , Chang J , Dietrich CF , et al. CEUS-Algorithmen für den kontrastverstärkten Ultraschall (CEUS-LIRADS/ESCULAP) in der nichtinvasiven Diagnostik des hepatozellulären Karzinoms - eine prospektive, multizentrische DEGUM-Studie. Ultraschall in der Medizin (Stuttgart, Germany 1980). (2021) ;42: (2):178–86. |
[20] | Jung EM , Stroszczynski C , Jung F . Contrast enhanced ultrasonography (CEUS) to detect abdominal microcirculatory disorders in severe cases of COVID-19 infection: First experience. Clinical Hemorheology and Microcirculation. (2020) ;74: (4):353–61. |
[21] | Lerchbaumer MH , Putz FJ , Rübenthaler J , Rogasch J , Jung E-M , Clevert D-A , et al. Contrast-enhanced ultrasound (CEUS) of cystic renal lesions in comparison to CT and MRI in a multicenter setting. Clinical Hemorheology and Microcirculation. (2020) ;75: (4):419–29. |
[22] | Rübenthaler J , Paprottka KJ , Hameister E , Hoffmann K , Joiko N , Reiser M , et al. Contrast-enhanced ultrasound (CEUS) prediction of focal liver lesions in patients after liver transplantation in comparison to histopathology results. Clinical Hemorheology and Microcirculation. (2017) ;66: (4):303–10. |
[23] | Putz FJ , Jung EM , Putz C , Banas MC , Bergler T , Vienken J , et al. Contrast-Enhanced Ultrasonography as a Novel Method for the Dynamic Visualization of Blood Flow and Fiber Blockage in Dialyzers: A Feasibility Study. Ultrasound in Medicine & Biology. (2020) ;46: (9):2265–75. |
[24] | Zuo D , Yang K , Wu S . Diagnostic performance of intravascular perfusion based contrast-enhanced ultrasound LI-RADS in the evaluation of hepatocellular carcinoma. Clinical Hemorheology and Microcirculation, (2021) . |

