


1. Introduction
Evidence is being sought in ice cores from polar regions remote from industrial activity for changes in global-scale airborne pollution by heavy metals (Reference Murozumi, Chow and PattersonMurozumi and others 1969, Reference Herron, Larigway, Weiss and CraginHerron and others 1977, Reference Boutron and LoriusBoutron and Lorius 1979, Reference BoutronBoutron 1980). However, there is growing evidence that natural sources of these elements may make an important contribution and, also, that the concentration profiles observed in snow layers may, at least in the short term, be strongly modulated by atmospheric transport processes (Reference Landy and PeelLandy and Peel 1981). Moreover, the extent to which concentration changes measured in snow truly reflect changes in the atmospheric aerosol has not been directly tested (Reference ShawShaw 1979). These areas of uncertainty complicate any interpretation of longer-term changes as reflecting varying emission rates to the atmosphere from either natural or anthropogenic sources.
As short-term effects appear to dominate profiles from Antarctica (Reference BoutronBoutron 1980), we are attempting to look in much closer detail at changes in recent snowfall in the Antarctic Peninsula. We present data from a 15 m pit and core from an ice-rise site in the Antarctic Peninsula where part of the sequence was preconcentrated in the field, a procedure which may, in the future, reduce the need to transport vulnerable samples of firn to the laboratory for analysis.
Ultimately, the interest in concentrations of heavy metals in snow and ice lies in how far these values can be interpreted in terms of changes in the polar aerosol composition. However, the trace element content of snow is the result of several complex processes; concentrations in air and snow cannot be equated automatically (Reference JungeJunge 1977, Reference ShawShaw 1979). So far as we are aware, no simultaneous measurements have been made on air and snow in Antarctica.
Here we describe a pilot programme in which falling snow and aerosols have been sampled simultaneously at remote field camps in the Antarctic Peninsula.
2. Variations in Heavy Metal Concentrations in Snow at Spaatz Island
2.1. Sample collections
Spaatz Island (72°53'S, 74°41'W, altitude 408 m, 10 m temperature: -12.5°C) which is an ice rise, was selected as a sampling site (Fig.l) remote from exposed rock (75 km from the nearest outcrop) and from manned stations. Open sea approaches within 15 km of the site for a large proportion of the year. The annual snow accumulation rate has been estimated at 1.7 m a−1 from melt-water conductivity and δ180 profiles. This is sufficiently large to allow detailed sampling through any seasonal pattern of trace element variation. There is insignificant melt-water percolation at the site.

Fig.1. Sampling stations in the Antarctic Peninsula.
During January 1980, samples were taken from the wall of a 5 m pit and from a 10 m core (90 mm diameter) drilled through its floor using an aluminium auger. With the exception of the auger, all sampling tools and containers had been cleaned by prolonged soaking in acid and finally in ultra-pure water. They were transported to the field in sealed polyethylene bags. The auger was cleaned by repeated drilling of pilot holes before the main samples were drilled. Samples were obtained from the pit wall by driving a 70 mm diameter acrylic tube into the wall which had been previously trimmed by at least 0.3 m with a polytetrafluoroethylene (PTFE)-coated saw and finally with a PTFE scraper. These samples were returned frozen to the laboratory, in polyethylene bottles.
2.2. Analysis
Sub-samples from the core, obtained by using a 50 mm diameter PTFE corer, were preconcentrated in the field by a procedure (Reference Wolff, Landy and PeelWolff and others 1981) which involves melting the samples in PTFE beakers and preconcentrating the heavy metals by adsorption onto tungsten wires suspended in the acidified melt (pH 3) for a standardised time (10 min). Our analysis probably includes all heavy metals significant in terms of long-range transport processes, with the exception of a small component in rock-weathering products which may be firmly complexed (Reference Landy and PeelLandy and Peel 1981). The tungsten wires, which we have shown remain stable for periods in excess of one year, were returned to the laboratory for analysis. The pit snow samples returned to a clean air laboratory were treated similarly after melting sub-samples in a microwave oven. The equilibrated wires for the complete 15 m sequence were then analysed directly in the graphite rod of an AA spectrometer.
We have analysed the 0 to 5 m pit sequence for Cd, Cu, Pb, and Zn (mean concentrations and standard deviations 5.5±1.9, 78±24, 43±20, and 107±30 pg g−1 respectively) and the 5 to 15 m core sequence for Cd and Pb (mean concentrations 4.8±1.9 and 302±135 pg g −1). Evidently contamination by Pb had occurred in those samples preconcentrated in the field, a factor that is difficult to control where local analysis Is impossible.
Full procedural blanks for samples returned to the UK were estimated from polyethylene bottles exposed in the pit and used to collect a sample which was later discarded. On return to the laboratory highly purified water was equilibrated with the bottles for periods of between 4 h and 5 d. The maximum observed contribution of the container to the blank was Cd (<0.3 pg g −1), Cu (2 pg g −1), Pb (2 pg g −1), and Zn (5 pg g −1). For added security, sub-samples were used after removing the outer 10 mm in contact with the container walls.
We have presented a profile for Cd alone (Fig.2) along the complete 15 m section for which element there is a close correspondence between the mean concentrations of the 0 to 5 and 5 to 15 m sequences as well as in the amplitude of short-period fluctuations. Thus it appears that field preconcentratlon procedures are feasible and may, In the future, reduce the need to return bulky and sensitive samples to the laboratory.

Fig.2. Concentration of Cd through the upper 15 m of the snow cover at Spaatz Island.
The mean concentration for Cd along the complete section, and for Cu, Zn, and Pb along the 0 to 5 m section, are comparable with values reported for a more remote station in East Antarctica (Reference Boutron and LoriusBoutron and Lorius 1979, Reference BoutronBoutron 1980).
2.3. Discussion
The profile for Cd (Fig.2) represents about nine years accumulation and our sampling Interval Integrated accumulation over a period of about two months. Most of the high frequency noise 1s therefore probably linked to seasonal scale changes in the heavy metal input to snow, which would be smoothed out in any study of longer-term changes along deeper ice cores.
More significant in terms of the Intepretatlon of longer cores is the persistence of low values (3.6 pg g−1) between 4.8 and 8.3 m depth through approximately two years accumulation compared with higher values (5.8 pg g−1) for snow from periods exceeding one year on either side. We have observed similar contrasts in a core from the Antarctic Peninsula plateau (Reference Landy and PeelLandy and Peel 1981). Such changes cannot be ascribed to changes in emission rates to the atmosphere from either natural or pollutant sources over such short-time periods, and are most likely linked with changing patterns of air-mass movements transporting material to the sampling site from neighbouring continents.
Data for a remote East Antarctic site (Reference Boutron and LoriusBoutron and Lorius 1979, Reference BoutronBoutron 1980) along a profile extending through the last 100 a show that, with the exception of a few sporadic spikes, the underlying changes during this period which Include the Influence of industrial pollution are probably not much larger than the changes which we attribute to meteorological processes on a shorter time scale. It seems that a more complete account of such factors may have to be made when attempting to Identify the Input of global pollution to Antarctic snows.
3. Combined Sampling of Air and Snow
3.1. Sampling system
During the period January to March 1980, field trials were conducted on an aerosol sampling system designed to collect onto membrane filters all microparticles significant in terms of snow chemistry. The system was designed specifically for use at remote field stations so that, in future, 1t may be possible to undertake aerosol sampling routinely whilst other drilling activities are under way.
Air was drawn simultaneously through three sampling probes, and exhausted through a dry gas meter and flow-rate meter. No special precautions were made to maintain a constant flow rate throughout a run; however, this never varied by more than 5% even during the longest runs. The rotary vane air pump, with a displacement of 150 ℓ min−1, was powered by a 1 kW generator which had been modified for use with propane to avoid using leaded fuel. The sampling probes were suspended from a polypropylene line supported by nylon rods about 1 m above the snow surface and some 5 m upwind of the pump and metering system. These were enclosed in a snow shelter to protect them from snow-fall and drift, and to reduce direct contact between them and the air in the sampling area. Sampling was carried out about 100 m upwind of the generator and the camp site. A wind-vane activated switch could be linked into the system as required to turn off the generator if the wind moved into an undesirable sector.
The data presented are all derived from samples collected on 37 mm diameter, Millipore, 0.45 μm pore size, mixed cellulose acetate and nitrate filters. They were used as supplied in disposable styrene filter holders, which greatly simplified filter change-over, minimizing the risk of contamination both in the field and during shipment back to the laboratory. Alternative re-loadable holders were tested but found to be impractical for field use. The flow rate through each filter was approximately 1 m3 h−1, giving a face velocity of about 0.31 m s−1. At these flow rates, the collection efficiency for this filter type 1s essentially quantitative for particles with diameters greater than 0.02 ym (Reference Megaw and WiffenMegaw and Wiffen 1963). The filter holders were mounted face downwards inside heavy-duty polypropylene jars (100 mm diameter) to prevent blockages by falling snow and drift.
Where snow-fall occurred during an air sampling run, a sample was scooped directly into pre-cleaned, wide-necked polyethylene bottles. These samples were returned frozen to the laboratory. Replicas of falling snow crystals were prepared using 1.5% Formvar in dichloroethane in order to characterize major differences in their temperature and height of formation In the atmosphere. Clean-room garments were worn whenever It was necessary to approach either the snow or air sampling areas.
3.2. Analysis
The exposed filter holders were returned to the laboratory under deep freeze and opened under class 100 conditions in a laminar-flow work station sited inside a clean-air laboratory. Using PTFE tweezers, the complete filters were transferred directly to solid PTFE beakers where the acid-soluble fraction of trapped trace elements was released at room temperature into 5 ml ultra-pure HNO3 solution at pH 3. These conditions were adopted in order to parallel closely the analysis of snow samples. At the sametime, they served to minimize dissolution of the filter pad, which made the major contribution to blank levels (Reference Weiss, Herron and LangwayWatling and Watling 1975). Aliquots of the equilibrated solution were analysed immediately by flameless AAS for Cd, Pb, Zn, K, Mg, and Na.
TABLE I. SUMMARY OF AEROSOL SAMPLE COLLECTIONS

Snow samples were transferred to PTFE beakers either directly by agitating the storage container or by using a polypropylene sub-coring tube. After rapid melting in a microwave oven, the samples were acidified to pH 3 and analysed by either differential pulse anodic stripping voltammetry for Pb, Cd, and Zn, using procedures given by Reference LandyLandy (1980), or by flameless AAS for K, Mg, and Na. Calibrations were made using mixed standards, by the method of standard additions for DPASV and by nesting snow analyses within calibration sequences for AAS.
3.3. Results
Air sampling was carried out at three locations (Fig.l) and was normally restricted to periods during which snow-fall was expected to occur. Table I summarizes information on the collection periods. Each sampling run occupied a period of between one and two days, giving a sampled volume of between 20 and 60 m3 for each filter.
The conditions experienced during the trials were such that sampling was generally undertaken very close to the cloud base. Examination of the snowcrystal forms confirmed, with a single short-lived exception, that they had been formed in a temperature regime close to that measured at the surface. Needles and thin hexagonal plates were encountered in the surface temperature range 0°C to -4°C, and mainly stellar crystals with plates were found below -4 C (Reference MasonMason 1971). Because snow-fall generally occurred during a small proportion of each run, and because there were substantial variations in the concentration of both the heavy metals and marine cations in both air and snow from one run to the next, we present mean values only for each sampling site (Table II). This reduces the variability arising from the partial mis-match of the snow and air sampling periods periods. The overall standard deviation for all samples analysed is, however, indicated in the bottom row of Table II for each element.
All reported concentrations have been corrected for a blank. In the case of the air filters, this was obtained from filters that were left exposed in the sample probes for periods comparable with the sample runs but without passing air through them. The following blanks were applied:
Cd: 0.1 ng/fliter (25 to 50% of total Cd collected), Pb: 3.8 ng/fiIter (30 to 50% of total Pb collected), Zn: 5.0 ng/fiIter (25 to 30% of total Zn collected), Na: 9.5 ng/filter (0.4% of total Na collected), Mg: 0.08 ng/filter (0.5% of total Mg collected), K: 15 ng/filter (1.5% of total K collected).
TABLE II. AVERAGE CONCENTRATIONS IN AIR AND SNOW (air concentrations in pg m−3 STP, snow concentrations in pg g−1)
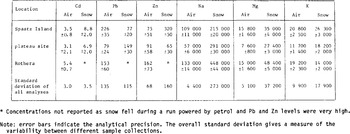
These values were always substantially larger than procedural blanks covering all analytical stages but excluding the filter. This was particularly marked for Pb and Zn where the procedural blanks accounted for only 7% and 0.3% of the total amount of each element collected.
Snow-sample concentrations have been corrected for analytical procedural blanks as follows: Cd: 1.2 pg g−1 Na: 0.23 ng g−1, Pb: 21 pg g−1 Mg: 0.34 ng g−l, Zn: 30 pg g−1 K: 1.4 ng g−1.
The analytical precisions [σ] of the residual concentrations are estimated in Table II. For the filters, this was obtained from a comparison of replicate samples. The mean values for each site are plotted in Figure 3 where the regression line was calculated using the individual sample analyses. The log/log regression has a gradient of 0.98 with an intercept of +0.28 on the snow concentration axis.

Fig.3. Comparison of the concentrations of heavy metals and marine salt cations in snow-fall with simultaneous values in the atmospheric aerosol.
3.4. Discussion
Reference JungeJunge (1977) has outlined four major processes which are of importance in removing aerosol particles from the atmosphere: nucleation, in-cloud  open symbols: Spaatz Island, filled symbols: plateau site, half - filled symbols: Rothera station scavenging of aerosol particles by cloud droplets, below-cloud scavenging (washout), and dry deposition. For precipitation under clean-air conditions, he argued that the uptake of condensation nuclei dominated the removal of particles and controlled the concentration observed in precipitation. Because a large proportion (0.8<ε<l) of particles larger than 0.1 μm (which account for most of the aerosol mass) are used up as condensation nuclei in cloud, the concentration of aerosol mass in air (cair) is closely related to the concentration in precipitation (cprec):

where L is the liquid-water content of the cloud(g m−3). For small cair concentrations, and for averaged samples and conditions, the observed range of ϕvalues agreed fairly well with the expected range of L/ε for a variety of impurities. Most of the data and, indeed, the theoretical treatment referred to rain-fall, although a few data for snowfall showed no major deviation. The main difficulty in applying Junge's treatment to snow-fall lies in the extent to which below-cloud scavenging processes may become important as a direct result of higher scavenging efficiency for snow-flakes. So far as precipitation over the Antarctic ice sheet is concerned, from a consideration of the size distribution and vertical variation of the total aerosol at Ross Island and at South Pole station, Reference ShawShaw (1980) has calculated that nucleation may still be responsible for removing 90% of the aerosol mass.
However, Reference ShawShaw (1979) has indicated that the efficiency of nucleation (effectively,ε) is greater for larger particles so that, i f trace elements are differentiated by size distribution, different values of ϕ may apply. A further possibility for fractionation arises where ice-crystal nucleation occurs because this is more dependent on the structure of the ice nucleus.
During our sampling programme, a i r and snow-fall were consistently sampled very close to the cloud base so that below-cloud processes of impaction and dry deposition can be safely ignored. The data therefore provide a test of the main element of Junge's approach for a polar region. The elements analysed represent two major components of the aerosol penet rating the polar atmosphere: the sea-spray aerosol and the tropospheric background aerosol. It is likely that they exhibit a contrasting spectrum of particle size, especially at Spaatz Island and Rothera, where there was open sea-water within a few kilometres of the sampling sites. We find no evidence for preferential nucleation between these two aerosol types. Figure 3 leads to a f value of 0.6±0.3. Given the likely maximum limits for ε(0.5<ε<l), Equation 1 requires a value for L in the range of 0.1 to 0.9 g m−3. Such Such a water content is within the range expected for stratiform clouds in the temperature range encountered (Reference MasonMason 1971).
Although the meteorological conditions experienced may appear atypical, we have independent evidence, from oxygen isotope analyses of a widespread network of shallow cores from the Antarctic Peninsula (Reference Peel and ClausenPeel and Clausen in press), that much of the precipitation in the region may occur when the cloud base is low, or by riming. More detailed and geographically spread sampling over a representative spectrum of weather conditions is now required to discover the limits within which it is reasonable to define ϕ. Data from the South Pole (Reference Boutron and LoriusBoutron and Lorius 1979), albeit for different sampling periods for snow (average of snow-fall during 1973 and 1974) and air (intermittent sampling during the period December to February 1974–75 by Reference Maenhaut, Zoller, Duce and HoffmanMaenhaut and others (1979)), show a remarkably similar relationship with ϕ values in the range from 0.4 to 1. Bearing in mind the very different meteorological conditions in the centre of the continent, this agreement may be fortuitous, but the strong linearity of the relationships in both areas must add weight to the view that trace element variations in snow layers primarily reflect changes in the aerosol content of the lower atmosphere.
Some indication of the possible importance of fractionation processes has been presented for an Arctic location (Reference Rahn and McCaffreyRahn and McCaffrey 1979), where data from two periods of air sampling at Barrow between December 1976 and April 1977, and between December 1977 and April 1978 were compared with data (Reference Weiss, Herron and LangwayWeiss and others.1978) for surface snow samples collected during February 1974 at points ranging from 28 to 224 km south of Barrow. Although there are major problems in comparing data so widely separated in space and time, which are compounded by the proximity of pollution sources, there was some evidence that Al may be enriched in snow, leading to relatively low (by a factor of ten) crustal enrichment factors for the heavy metals in snow. Preferential nucleation of ice on clay nuclei was considered to be the most likely cause. However, the corresponding enrichment factors for Na, Mg, and Ca in snow were not depressed similarly, particularly if the closer proximity of the aerosol sampling site to the sea is taken into account. It may be significant that the concentrations of the two elements that are least likely to be affected by short-term fluctuations in local aerosol sources, that is to say, Al and Ca, agree with the aerosol/snow relationships observed in Antarctica, where Al does not appear to behave unusually. Much more controlled sampling is required to resolve this potential problem.
4. Conclusions
Whilst more detailed data are now required to consolidate a link between concentrations of trace elements in snow and in the parent aerosol, the results of simultaneous collections of snow and aerosol at three sites in the Antarctic Peninsula show that, on average, they are closely related for the heavy metals and the cations of marine salt origin. If more widely substantiated, this will simplify the interpretation of data from ice cores. However, a profile for Cd through a 15 m firn section at Spaatz Island demonstrates that account may have to be taken of control by weather systems on the transport of trace elements to the sampling site. This is because these processes may produce changes of similar magnitude to the trends in global emission rates which ice-core analysis aims to characterize.
Acknowledgements
We are grateful for the enthusiastic support and assistance in the field received from all personnel at Rothera station during 1979–80.


