


1. Introduction
The programme Avalanche-Warning CH-2000 was launched in Switzerland in 1996 in order to improve the spatial and temporal resolution of the official avalanche forecasts (Reference Russi, Ammann, Brabec, Lehning and MeisterRussi and others, 1998). Additional information is needed in order to further reduce the number of victims and the extent of damage resulting from catastrophic events such as that in February 1999 (SLF, 2000). New fully automatic and autonomous weather stations and a model simulating the snow cover have been developed (Reference Lehning, Bartelt, Brown, Russi, Stockli and ZimmerliLehning and others, 1999). NXD-2000 is a local avalanche-forecasting model based on the nearest-neighbor approach proposed by Reference Obled and GoodObled and Good (1980) and Reference BuserBuser (1989). These models are becoming an essential part of the avalanche Warner’s tools. He/she still has to combine all the information collected by manned and automatic weather stations, questionnaires from people doing ski mountaineering (Reference Brabec, Stucki and HestnesBrabec and Stucki, 1998) and the various computer models in order to construct an avalanche forecast.
Local avalanche forecasting is assumed to be the task of predicting the probability of avalanche releases for a small area or just a few dangerous avalanche slopes. A typical example of local avalanche forecasting is the control of a skiing area like Parsenn/Davos (see Reference Obled and GoodObled and Good (1980) for a detailed description). In an area of about 100 km2 all the avalanche slopes endangering ski tracks are controlled and managed. Systems for local avalanche forecasting aid in solving a locally defined problem like closing roads or ski tracks.
We define the task of regional avalanche forecasting based on the the five-level European avalanche-hazard scale (see Reference MeisterMeister (1994b) for details). For a homogeneous area considering the stability of the snowpack and avalanche activity, one of the five levels with corresponding slope aspect and altitude range has to be assigned for one day. In Switzerland, regional avalanche forecasts have been published since 1997 for areas of about 5000 km2. Sub-areas of 45–1000 km2 are in use as the smallest areas for assigning hazard estimations (Reference Russi, Ammann, Brabec, Lehning and MeisterRussi and others, 1998).
In Switzerland the first attempts to develop models to forecast avalanche releases were undertaken by Reference Bois, Obled and GoodBois and others (1975). Reference BuserBuser (1983, Reference Buser1989) further developed the nearest-neighbor approach for local avalanche forecasting. Reference McClung and TweedyMcClung and Tweedy (1994), Reference Kristensen and LarssonKristensen and Larsson (1995), Reference BolognesiBolognesi (1998) and Reference Kleemayr and MoserKleemayr and Moser (1998) adapted the nearest-neighbor approach for different applications and introduced several new features. Reference Schweizer and FohnSchweizer and Fohn (1996) developed a series of expert-system-based models that simulate the reasoning of a pragmatic avalanche forecaster. In France the model chain SAFRAN/Crocus/MEPRA (Reference Durand, Giraud, Brun, Mérindol and MartinDurand and others, 1999) calculates the stability of a mean snowpack for each of 35 massifs of the French Alps for different elevations, aspects and slope angles.
In this paper we describe how the well-known statistical approach of nearest neighbors (NXD) has been extended for regional avalanche forecasting. The model closes the gap between available measured data and the avalanche forecast by constructing a forecast from similar situations in the past where the conventionally estimated forecast is known. We show the mathematical foundation of the new model, as well as its evaluation by cross-validation for 10 winters.
2. NXD-REG Model Calculations
The database for the development of our statistical model consists of measurements and observations for 10 winters (1987/88 to 1996/97) for 59 stations of the Swiss observation network. The stations were selected in cooperation with the SLFavalanche warning service. Only stations with a complete 10 year dataset and no important change in measurement location were selected, to ensure the homogeneity of the dataset. In contrast to many other avalanche-forecasting models, we use the official, conventionally estimated hazard levels as dependent variable. The hazard estimations have not been changed a posteriori.
Since the European avalanche-hazard scale has been in use since winter 1993/94, we transformed older hazard estimations according to Table 1. This transformation was suggested by Reference Schweizer and FohnSchweizer and Fohn (1996).
Table 1. Transformation of hazard levels from the seven-level Swiss scale to the European avalanche-hazard scale
Table 2 shows the distribution of hazard levels for the complete dataset. We refer to the descriptions of Reference LaChapelleLa Chapelle (1980) and Reference MeisterMeister (1994a) for the conventional estimation of hazard levels. Based on verification studies conducted by Reference Schweizer and FohnSchweizer and Fohn (1996), Reference Brabec, Stucki and HestnesBrabec and Stucki (1998) and Harvey (unpublished) we assume the hazard estimations to be correct for about 70% of the days.
Table 2. A priori class probabilities of conventionally estimated hazard levels for 10 winters for data from Davos
General architecture
The calculation of an avalanche-hazard map is handled in two steps. First, for each station a focal nearest-neighbor model is applied. The result of this step is a set of days that are similar in terms of the metric distance defined below. From the conventionally estimated hazard levels on these days, a continuous hazard value and a hazard level are produced. Second, between the focal estimations a regional interpolation is done. A final hazard level is then estimated for each of the 100 sub-areas described in section 1.
Local nearest-neighbor model: NXD-VG
Because of the success of nearest-neighbor models in local avalanche forecasting, we have decided to adopt the nearest-neighbor approach for our dataset. Reference MeisterMeister (1994a) adapted the NXD model as suggested by Reference BuserBuser (1983) for regional avalanche forecasting and called it NEX-MOD. Swiss observational data (e.g. Gliott and Fohn, unpublished; Table 3) are used operationally including all ten measured parameters (Vl…v10) as input, adding two elaborated parameters (HN.SUM3D, TAJDIF1D). No further transformations are used. Model output is the estimated hazard level according to the European avalanche-hazard scale.
Table 3. Input data of NXD-VG

The hazard level is calculated by averaging results from the 10 nearest neighbors and applying the decision boundaries shown in Figure 1. The distance between day t (current day) and day u (historic day in the database) is calculated as
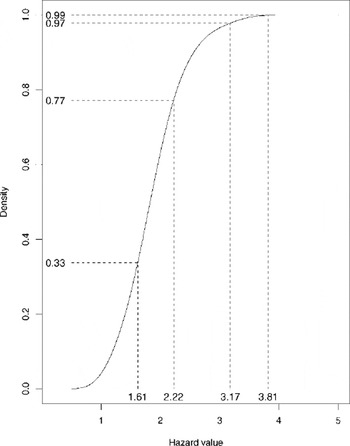
Fig. 1. Cumulative distribution of cross-validated averaged local hazard values for Weissfluhjock. The dashed lines show decision boundaries that preserve the a priori estimated distribution of hazard levels.
The distance is thus weighted in Euclidean space.
The weights Wj shown in Table 3 have been set by R. Meister based on his 7 year experience, and account for the importance of the variables and the relative size of the measurements. For NEX-MOD the prediction error was estimated by applying cross-validation (Reference Efron and TibshiraniEfron and Tibshirani, 1993) to two selected stations. The evaluation showed that NEX-MOD tends to underestimate the avalanche hazard compared to the conventionally estimated hazard levels. Furthermore the distribution of the forecast hazard levels was different from the conventionally estimated ones. We thus propose to set the decision boundaries in such a way that the distribution of hazard levels is preserved.
Figure 1 shows the distribution of hazard values for Davos Weissfluhjoch as a result of averaging the hazard levels of the 10 nearest neighbors. The a priori distribution of conventionally estimated hazard levels as shown in Table 2 is used to calculate the decision boundaries. The y axis shows the cumulative density and the summed probabilities of Table 2. Connecting these values to the cumulative density allows us to receive the corresponding decision boundaries at the x axis.
The result of NXD-VG is given in table form for each station: weather-forecast and snow parameters, date of the 10 nearest neighbors, result of the distance calculation and the original avalanche bulletins are presented to the avalanche forecaster.
Regional interpolation
Between the stations inverse distance-weighted interpolation (Environmental Systems Research Institute, 1996, p. 92) is used to calculate hazard levels on a 1 km grid. The result of the spatial interpolation is shown together with the local, averaged hazard values and the decision boundaries on a map.
For constructing daily maps of the avalanche hazard, the avalanche warners set an individual avalanche-hazard estimation for each of 100 sub-areas of Switzerland. NXD-REG estimates the hazard level for each sub-area by averaging all pixels within the area and applying the same decision boundaries (see Fig. 1) as locally.
Figure 2 shows a typical result of NXD-REG as it can be used for constructing a new avalanche bulletin. On a map of Switzerland the avalanche hazard calculated for each station as well as each sub-area is shown.

Fig. 2. Result of NXD-REG for 19 February 2000.
3. Evaluation
An important aspect for improving statistical models is the identification of situations when the model fails, and especially the search for additional parameters that correlate with the errors. It is also essential to know which situations are not represented well in the database used. Therefore the model is evaluated using three complementary approaches.
For two selected stations, a complete cross-validation for the 10 winters is calculated. Each winter is excluded from the historic database and then forecast using the rest of the data. This allows us to identify longer periods of model failure.
Figure 3 shows a typical result of a cross-validation run and a period that has been identified where the model underestimates the avalanche risk. The snow-cover stability (not used as input parameter) played a predominant role for the conventional method of hazard estimation and was below average. In 1989/90, from mid-December to the end of February, conditions were dominated by a weak, shallow snow cover. Intense snow-temperature-gradient metamorphism and small- snowfall periods (each <20cm) caused critical sub-layers. Many skier-triggered avalanches (e.g. 23/24 December, 30 January, 11–15 February) were observed, and snow-cover tests showed that the snowpack was unstable. After a heavy snowstorm at the end of February, with >2 m of new snow, conditions returned to normal and the model achieved better results.

Fig. 3. Example of cross-validation experiment: station Weissfluhjoch, 10 nearest neighbors, optimal decision boundaries, December 1989–February 1990.
In order to choose a reasonable value for the number of nearest neighbors we varied this parameter of the model between 1 and 30 for station Davos Weissfluhjoch, and between 10 and 30 for station Davos Fliielastrasse. Figure 4 shows the percentage of agreement between model and conventional forecasts for these experiments, and the improvement that could be achieved compared to the original model NEX-MOD for Weissfluhjoch. NEX-MOD uses 10 nearest neighbors. The improvement going from 10 to 30 nearest neighbors was rather low, and the variation between winters increased. We therefore decided to use 10 nearest neighbors for NXD-VG.

Fig. 4. Variation of the number of nearest neighbors for two selected stations.
Table 4 shows the complete contingency table of the cross-validation experiment for Davos Weissfluhjoch. The model performs best for low and moderate hazard levels. On 52% of the days the cross-validated hazard levels were in agreement with the conventionally estimated hazard levels. On 96% of the days the difference was within one hazard level. For the observer station in Davos the corresponding numbers are 51 % and 94%. The error distribution is fairly symmetric. For different winters the performance of NXD-VG for Weissfluhjoch varies between 49% and 61%.
Table 4. Contingency table for cross-validation experiment for Weissfluhjoch and 10 nearest neighbors
Twenty selected situations were recalculated in order to identify regions and stations that are not representative. Situations have been selected that either represent a larger set of typical examples or show a special feature like the extreme situations of winter 1998/99. The analysis shows that the model is not able to predict the “very high” hazard level. The analysis of winter 1998/99 (SLF, 2000) clearly shows that the highest level was adequate for a large region of Switzerland, but the database of the model does not contain any similar situations. On the other hand, several other situations are in good agreement with the model.
The model has been used operationally since 18 February 2000 by the SLF avalanche-warning service. The current hazard level is calculated each day and compared to the forecast of the official avalanche bulletin. The model will be coupled to the weather forecast in the near future by applying downscaling procedures (Reference RaderschallRaderschall, 1999). This will enable the model to calculate a true forecast for the next day.
4. Conclusions and Outlook
The development of statistical and rule-based systems is crucial for improving avalanche warning on a local and regional scale. Here we discuss NXD-REG, a nearest-neighbor model for regional avalanche forecasting that is used operationally by the Swiss avalanche-warning service. The mathematical details of the model calculations have been described. Evaluation of the model by cross-validation has shown that it can reproduce the official SLF avalanche forecast on about 52% of the days. For periods when snow-cover stability is important the model fails. In the near future the model will be coupled to the weather forecast.
Acknowledgements
We would like to acknowledge the support of the Swiss National Science Foundation, the Swiss government and the Board of the Swiss Federal Institute of Technology (ETH). Furthermore, a number of people at SLF and ETH are involved in supporting the development of the model and delivering input data. In particular, we would like to thank W. Ammann, O. Buser, M. Gassner, E. Kapetanios, M. Lehning, M. Machler, M. Norrie, T Russi, M. Schneebeli andW. Stahel for their contributions and discussions. U. Stockli was responsible for the database design, and A. Stoffel developed the ArcView code for calculating all maps. We are grateful for the critical comments of our scientific editor E. Martin who helped to improve the paper substantially.


