
Convolutional Neural Network Based Classification of Patients with Pneumonia using X-ray Lung Images
Volume 5, Issue 5, Page No 167-175, 2020
Author’s Name: Hicham Moujahid1, Bouchaib Cherradi1,2,a), Oussama El Gannour1, Lhoussain Bahatti1, Oumaima Terrada1, Soufiane Hamida1
View Affiliations
1SSDIA Laboratory, ENSET Mohammedia, Hassan II University of Casablanca, 28820, Mohammedia, Morocco
2STIE Team, CRMEF Casablanca-Settat, provincial section of El Jadida, 24000, El Jadida, Morocco
a)Author to whom correspondence should be addressed. E-mail: bouchaib.cherradi@gmail.com
Adv. Sci. Technol. Eng. Syst. J. 5(5), 167-175 (2020); ![]() DOI: 10.25046/aj050522
DOI: 10.25046/aj050522
Keywords: Convolutional neural network, Machine learning, Deep learning, Pneumonia detection, Chest x-ray images, COVID-19

Export Citations
Analysis and classification of lung diseases using X-ray images is a primary step in the procedure of pneumonia diagnosis, especially in a critical period as pandemic of COVID-19 that is type of pneumonia. Therefore, an automatic method with high accuracy of classification is needed to perform classification of lung diseases due to the increasing number of cases. Convolutional Neural Networks (CNN) based classification has gained a big popularity over the last few years because of its speed and level of accuracy on the image’s classification tasks. Through this article, we propose an implementation a CNN-based classification models using transfer learning technique to perform pneumonia detection and compare the results in order to detect the best model for the task according to certain parameters. As this has become a fast expanding field, there are several models but we will focus on the best outperforming algorithms according to their architecture, length and type of layers and evaluation parameters for the classification tasks. Firstly, we review the existing conventional methods and deep learning architectures used for segmentation in general. Next, we perform a deep performance and analysis based on accuracy and loss function of implemented models. A critical analysis of the results is made to highlight all important issues to improve.
Received: 29 July 2020, Accepted: 18 August 2020, Published Online: 10 September 2020
1. Introduction
Pneumonia is an infection inflaming air sacs in the lungs, it can be bacterial or viral including covid-19 virus, but symptoms are often similar independently of the factors causing the disease [1]. Doctors need additional analysis or X-ray imaging to identify the cause of the pneumonia. The X-ray imaging of the lungs allows them to identify only if a lung has pneumonia or not [2].
Many germs can cause pneumonia including viruses, bacteria, and fungi commonly collected from the air and can overpower the immune system which leads to critical health situations. Therefore, early diagnosis [3] based on X-ray image classification is very important at first in order to prevent complications and make treatment efficient. Then advanced diagnosis is needed to determine the type and the cause of the pneumonia using medical tests and X-Ray scans.
Manual classification of pneumonia disease still the most efficient way, usually used by radiologists. The principle inconvenient of this method is about the time-consuming, which is a very important factor in the case of a pandemic.
Nowadays, many researchers become very interested in applications of artificial neural networks (ANN), especially convolutional neural networks (CNN). This method is efficient for medical image classification tasks. It makes computers capable of solving many pattern recognition and object extraction problems using datasets of 2D or 3D images. In case of 3D MRI images classification task it requires a huge processing capacity which can be bypassed by adopting a parallel algorithms [4], [5]. In [6], an example of the above parallel approach where the authors propose a parallel c-mean algorithm applied to MRI images classification showing good time complexity on its results.
To overcome the constrain of execution time, using Graphical Processing Units (GPU) become crucial today in medical image processing applications, especially in a context of machine and deep learning algorithms. They can significantly accelerate parallel processing, therefore almost all works related to medical image processing in medical field uses GPUs as accelerators to achieve better and fast results [7], [8].
However, machine learning algorithms and convolutional neural networks (CNNs) models have gained a lot of attention for almost all diseases classification and prediction problematic including breast cancer detection [9], cardio vascular prediction and diagnosis [10], [11], diabetes mellitus prediction [12], [13], etc.
In this work, we make an implementation of some CNN models using transfer learning technique. We used these models to perform pneumonia detection. Results evaluation and comparison is made in order to adapt and select the best model for the task according to certain parameters.
The rest of this paper is organized as follows: In section 2, we present a brief overview of some different classification techniques on relevant related work used for the prediction of various human diseases, and we focused on studies conducted on the prediction of pneumonia disease from lung X-ray images. Section 3 present the used dataset and CNN models. In section 4, we present the models experimental results and discuss the performance evaluation measures. Section 5 concludes this article and presents some perspectives at this work.
2. Related work
In this section, we review some related and similar works that matches classification task for pneumonia diseases using different machine and deep learning models. These models are evaluated within different metrics and reached less or more important performances, depending on their architecture and conception.
Recently many researches published about the pneumonia disease detection, especially ANN based models achieving great results which are very suitable for this type of disease. Note that COVID-19 virus causes severe pneumonia disease.
In 2019, the authors in [14] published a work concerning pneumonia detection applying a combination of mRMR feature selection and machine learning models on the Chest X-ray images. Features extraction is performed using existing CNN models: AlexNet, VGG16 and VGG19 and then combining the results as an input features set to feed and train five different machine learning models: decision tree, k-nearest neighbors, linear discriminant analysis, linear regression, and support vector. The experiment shows the best results for linear discriminant analysis obtaining 99.41% accuracy.
In January of 2020, the authors published in [15] a model based on transfer learning technique for Chest X-ray images of pneumonia disease. This model consists of combining AlexNet, DenseNet121, InceptionV3, resNet18 and GoogleNet generating a new architecture and reaching 96.39% accuracy on test images. The dataset used in this work is from Guangzhou-women-and-Children’s Medical Center dataset [16].
Lately, the authors in [17] published a work about another method of automatic pneumonia detection based also on chest X-ray images focusing this time on specific region of interest (ROI) to classify and segment images. The method was compared in this study with five different classifiers: Multilayer perceptron, sequential minimal optimization (SMO), random forest, Classification via regression and classification via logistic regression. The proposed study shows a higher accuracy on logistic regression classifier with accuracy of 95.63% on test dataset.
In [18], another work published about a machine learning algorithm for pneumonia classification. In this work, the authors built a CNN model from scratch in order to classify images of pneumonia disease based on X-ray chest images obtaining a validation accuracy of 93.7%; where an augmentation method was adopted to increase the dataset size. In table 1, we summarize main information’s about these works.
Based on these works and others, we develop and compare in this paper some convolutional neural networks in the goal to enhance the test accuracy on pneumonia disease detection from Lung X-ray images. In fact, we will introduce only automatic methods related to deep learning techniques which are the most adapted for the task of classifying 2D images based of lung X-ray datasets.
3. Materials and methods
3.1. Dataset description
The original dataset used in this work is called “Labeled Optical Coherence Tomography (OCT) and Chest X-Ray images for Classification” version 3 [19]. Only Chest X-Ray part is used in experiments. All models developed in this paper are trained and tested on this part of dataset. The concerned lung X-ray database
Table 1: Summary of related works methods and results.
| Reference | Year | Method | Number of tested models | Best model or classifier | Dataset | Number of classes | Best accuracy |
| [14] | 2019 | Complex of mRMR feature selection and machine learning models | 5 | Linear Discriminant Analysis | Guangzhou-women-and-Children’s Medical Center dataset | 2 | 99.41% |
| [15] | 2020 | Transfer learning-based approach | 5 | Ensemble transfer learning based | Guangzhou-women-and-Children’s Medical Center dataset | 2 | 96.39% |
| [17] | 2020 | Automatic pneumonia detection based on ROI for classification | 5 | Logistic Regression | NIH ChestX-ray14 dataset | 2 | 95.63% |
| [18] | 2019 | CNN based model for pneumonia disease classification | 1 | – | Guangzhou-women-and-Children’s Medical Center dataset | 2 | 93.7% |
Table 2: Dataset distribution over training, validation and testing sub sets.
| Dataset | NORMAL | PNEUMONIA |
| Training subset | 1108 | 2991 |
| Validation subset | 238 | 641 |
| Testing subset | 237 | 641 |
| Total dataset | 1583 | 4273 |
is composed of 2 types of images: Images for normal patients (NORMAL) and images for patients with pneumonia disease (PNEUMONIA). In table 2, we summarize the structure of the dataset (Training, validation and Testing).
Figure 1 present some samples of normal and pneumonia lung x-ray images.
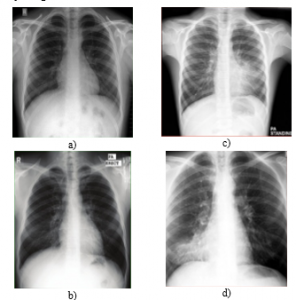
Figure 1: Example of Normal (a & b) and pneumonia (c & d) X-ray samples from the dataset.
3.2. Artificial Neural Network (ANN)
Artificial neural network (ANN) concept is inspired from the human brain being the smarter system that can process real data. The treatment ability came from connections between neurons of the brain. This structure forms a huge natural neural network able to resolve complicated operations in the real world. ANN is about superposing a lot of artificial neurons just like the natural neural network [20]. The elementary ANN (perceptron) is the simplest architecture of an artificial neural network, illustrated in figure 2.
The perceptron composed from input layer having a vector {xi} as inputs, sharable weights in the form of a vector {wi} too and a bias. {yi} presents the output of the perceptron in the form of a vector of probabilities of predictions.
3.3. Convolutional Neural Network (CNN)
Convolutional Neural Network (CNN) is an ANN network but the inverse is not true. CNN are most commonly applied to automatically process visual images. A CNN contains one or more convolution layer.
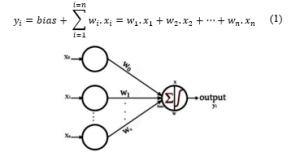
Figure 2: Architecture for a single layer perceptron.
The notion of CNN is old. This abstraction had been verified to work more accurately for recognition of hand written characters [21]. However, this type of networks loses the challenge to process large and heavy images. Therefore, this method was impractical because of the constraints of processing power, lack of memory and datasets availability. Nowadays, these limitations are relatively passed out, because of the technological evolution of storage, memory and methods optimization.
3.4. CNN Architecture
CNNs architecture consists of concatenating multiple types of layers successively which are input layers, convolutional layers and dense layers. In general, convolutional neural networks are based on its process on two principle factors: sharing weights and connectivity between neurons of each convolutional layer.
- Sharing weights: At each convolutional layer, every neuron has its weights that need to be shared to all neurons of the next layer. Those weights need also to be shared to all neurons in the previous layer in order to achieve back propagation process.
- Connectivity: All neurons of each layer are locally connected only to all neurons in the next layer. This connectivity conception reduces the complexity of the network.
Generally, to build a CNN network, an input layer is required with specific configuration including image shapes and patch. Then a convolutional layer’s type must follow, also configured with specific number of neurons and specific function of optimization and activation. Each convolutional layer needs a pooling layer to follow with a specific filter of pooling. After that a number of Dense layers must be created before the output layer that requires a loss function to be configured [22].
3.5. Proposed methodology for lung pneumonia classification using CNN
The main steps for any image classification system are: image preprocessing, feature processing included in the convolution process, training the network and validating the resulted model. At the end testing the final CNN model.
Figure 3 shows the general architecture of a CNN model used to detect lung pneumonia containing input layer, convolution layers with ReLU activation function, pooling layers and fully connected layers.
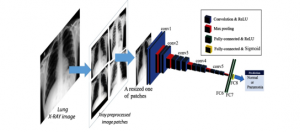
Figure 3: Illustration of CNN architecture used for pneumonia detection on lung X-ray images.
- Dataset preprocessing: it consists of preparing data to feed the network, this preparation is about reshaping and resizing images, dropping out unusable images and adapting contrast. Also converting raw data to victors and normalizing it [21]. The output of this process feeds a CNN network for training in order to become a pre-trained model, ready for the testing phase [23].
- Features selection and extraction: This step is included in the convolution layers, and consists of extracting useful features only, then converted to the adequate format.
The selection part consists of selecting the most useful features to achieve the classification case of study [24].
- Training: At this phase the network is trained by updating weights of neurons across layers, it’s called the learning process. This is done by minimizing the loss function and maximizing the accuracy rate of the validation part. If there is only two classes to predict, a sigmoid function is used for the loss optimization [24].
The learning goal of the model is achieved using an optimizer from a huge scale of optimizers existing in the literature but the back-propagation algorithms are the most used in classification case [21].
- Classification evaluation metrics
Almost all metrics to process the performance of a model are based on some primordial parameters to be calculated:
True positive abbreviated by TP: Number of images accurately classified as pneumonia matching the ground truth.
True negative abbreviated by TN: Number of images accurately classified as normal matching the true labels.
False positive abbreviated by FP: CNN classifies images as containing pneumonia but that it’s actually normal according to the ground truth.
False negative abbreviated by FN: Number of images which the CNN classifies as not containing pneumonia but are actually containing pneumonia according to the ground truth labels [25].
Based on those calculated parameters, we can compute the precision abbreviated as P, recall abbreviated as R, the F1 score and the accuracy as:
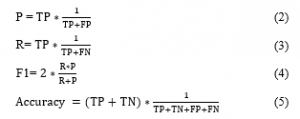
F1 result is obtained by processing parameters in (Eq.2) and (Eq.3). The formula of this parameter is in (Eq.4).
- Testing: On this step we use test set as a different dataset and new one for the model. In order to well testing the model, the ground truth of the test set must be similar to the training set but not correlated. This makes the test more valid and accurate [26].
- Classification: This is the last step on the CNN model, it consists of affecting a label to each image from the input features with a specific confidence of decision:
Initialization: Before to start the learning stage where the weights are updated over epochs. Those weights must have initiated by the initial values, in some cases those values are random. Otherwise those values are generated by a predefined function. The Xavier initialization is the usually used method of initialization [21].
Activation function: This is the function representing the processing part of a neuron. It depends on the type a layer of the neural network. Most used activation function for layers in CNN network is ReLU function [27].
Pooling: This phase consists of reducing the size of features by applying a filter and keeping only the most important elements. The most popular pooling method in CNN models is max pooling and average pooling. The max pooling consists of selecting only the maximum element in the filter and the average pooling consists of averaging all elements inside the filter [21].
Regularization: This technic is about reducing over fitting problems and improving performance of the model. There are many methods to ensure regularization, and the most popular method is dropout. The dropout method is based on eliminating the less important features on each iteration [27].
Loss Function: This hyper parameter defines the function that evaluates how much the trained model can fail predicting the affected task. Its value is reverse to the accuracy value. More the loss is minimal the more the accuracy must be maximal. The quadratic error is the most used for loss function in CNNs [28].
4. Results and discussion
CNNs models have proven interesting results in many applications lately. These models existed in literature differ in the network size, defined optimizers and the type of layers used.
Training task require a big processing capacity which leads us to choose a parallel architecture of processing, by adopting graphical processing unit (GPU), in the virtual environment to accelerate the training step offered by KAAGLE platform. In our experiment we used dual cores of CPU with 13 GB of RAM memory equipped with a GPU of 16 GB of RAM memory.
4.1. Building proposed CNN models using transfer learning approach
In our experiment, we build and compile five different models based on existing models in the literature using transfer learning technique.
Depending on the case, each model can succeed or fail the classification task. For our case of pneumonia detection problematic and after running many algorithms many times by trying at each different configuration, we select those architectures in figure 4. With given configurations relatively presenting better results in term of accuracy and loss taking in consideration the over-fitting and the under-fitting problems.
4.2. Compiling and training CNN models
In all models experimented in this work, we add two dropout layers and one dense layer with SOFTMAX activation at the output layer as a classifier. We used a logistic regression algorithm called “RMSProp” optimizer and categorical cross entropy accuracy as a metric during the model compilation.
Weights are initialized using image-net. We decide to not freeze any layer of the original model, because of the nature of pneumonia detection problematic compared to the originally trained dataset.
In order to reduce over fitting on training layers, we used a callback parameter specifying to stop training when no accuracy improvement happened within three successive iterations. That obliges the training process to stop at the epoch where no accuracy improvement happened.
4.3. Validation and testing the given CNN models
While training our proposed models, the validation process goal consists of checking the accuracy of the model in each epoch. Then update weights on the back-propagation process to use in the next epoch for learning. For this task, we used validation dataset as described in figure 1.
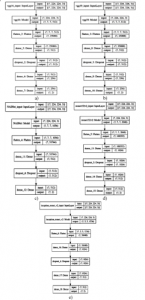
Figure 4: Architecture of proposed transfer learning-based models: (a) VGG16, (b) VGG19, (c) NasNetMobile, (d), ResNet152V2 (e) Inception-Resnet-v2.
In this step, we can get the performance and evaluation metrics for our models before trust them for real case classification.
In general VGG16 gets good results in many cases for fine-tuning task [29], this is the mean reason of choosing this model at first for transfer learning to process pneumonia classification.
As shown in figure 5, for the VGG16 based transfer learning model we get the best accuracy and very interesting accuracy evolution over iterations compared to other tested models. The accuracy continues improving until the 30th epoch and the convergence between the validation and the training accuracy is very good, which makes this model the most adapted for our task. The first 10 epochs show a fast improvements and convergence of the accuracy then the next epochs converge very well but improves slowly without losing convergence aspect.
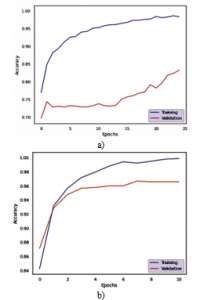
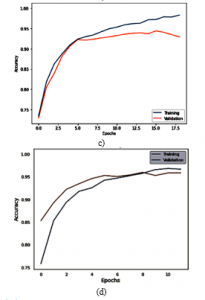
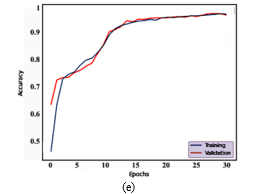
Figure 5: Evolution of training and validation accuracy over epochs for different models: a) NasNetMobile based model, b) ResNet152V2, c) Inception-Resnet-v2 based model, d) VGG19 based model, e) VGG16 based model.
From figure 6, it’s clear that all well predicted features show probability over 80% (green aspect), and the only miss predicted feature (red aspect) here shows a 68% probability of confidence which is also a clear indication for experts to give more interest of verification and correction for non-confident classifications. Therefore, the model can be a good tool to help for pneumonia disease diagnosis. Time and effort for medical experts in diagnosing pneumonia cases specially in the case of COVID-19 can be saved. In fact, human visual system has many limitations about detecting the gray-scale resolutions even with high brightness and contrast, X-Ray images can present a large scale of gray-scale shades than the human eye could detect. This is another reason why the automatic diagnosis is primordial for improving the disease detection.
VGG19 based transfer learning model shows also good accuracy convergence, where the maximum value is achieved on the 10th epoch and relatively starts to stabilize for the next epochs, therefore the algorithm ends to avoid over-fitting.
Models: Inception-Resnet-v2 based model and ResNet152V2 based shows similar accuracy evolution results. Speed of convergence for the first one is performed after 18 epochs but for the second in just 10 epochs. That gives an advantage for the second one. The NasNetMobile based model shows a very bad accuracy results in term of convergence or accuracy values, which makes this model badly ranked for this task.
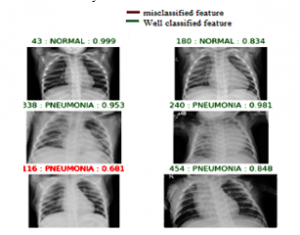
Figure 6: Example of predicted features using a VGG 16 based transfer learning model showing in the left the id number of the feature in the testing dataset and the probability of prediction in the right.
Loss curve is also an important tool to evaluate models just like the accuracy curve. In our experiment, results of loss functions are illustrated in figure 7.
Similarly, to accuracy curve analysis, this tool confirms that VGG16 based model is the best model achieving pneumonia detection task. NasNetMobile based model shows again the worst results for this task. Regarding confusion matrix tool, our models shows the following results:
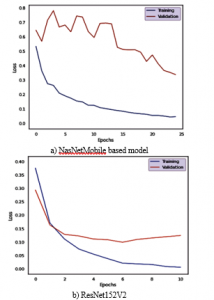
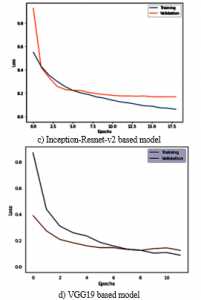
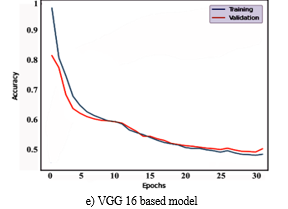
Figure 7: Evolution of training and validation loss over epochs for different models: a) NasNetMobile based model, b) ResNet152V2, c) Inception-Resnet-v2 based model, d) VGG19 based model, e) VGG16 based model.
VGG19 based model failed on predicting the 26 case of pneumonia but succeed on predicting 615 of 641 features. The model also failed to predict normal for only 4 cases. In general, this is a good result regarding the total number of cases.
VGG16 based model fails detecting 21 pneumonia cases which make it better than VGG19 based model. But not efficient on detecting pneumonia cases compared to Resnet152V2 based.
However, ResNet152V2 based total fails of 32 predictions including normal and pneumonia cases. Which is more than VGG16 based model. Therefore VGG 16 based model presents the best confusion matrix results in this experiment. The other models in this experiment show fewer interesting results on their confusion matrix. Classification based on CNN methods for Medical images gets the better performance (accuracy) on fine-tuning the model VGG16 modeled by Google Company, showing the results of almost: 97% for pneumonia detection, 11.51% loss. It is clear that
- Table 3: Comparison of different implemented CNN models.
| Method | Epochs | Learning rate | Optimizer | Activation | Loss function | Accuracy | Loss | Precision | Recall | F1-score | |
| VGG16 based | 33 | 10-5 | RMSProp | Softmax | Categorical cross entropy | 96.81% | 11.51% | 91% | 97% | 94% | |
| VGG19 based | 12 | 10-5 | RMSProp | Softmax | Categorical cross entropy | 96.58% | 14.43% | 96% | 99% | 98% | |
| NasNetMobile based | 25 | 10-5 | RMSProp | Softmax | Categorical cross entropy | 83.37% | 36.13% | 43% | 91% | 58% | |
| ResNet152V2 based | 11 | 10-5 | RMSProp | Softmax | Categorical cross entropy | 96.35% | 16.27% | 93% | 94% | 93% | |
| InceptionResNetV2 based | 18 | 10-5 | RMSProp | Softmax | Categorical cross entropy | 94.87% | 17.18% | 89% | 90% | 89% | |
| a) NasNetMobile based model | b) ResNet152V2 | c) Inception-Resnet-v2 based model | |
| d) VGG19 based model | e) VGG 16 based model | ||
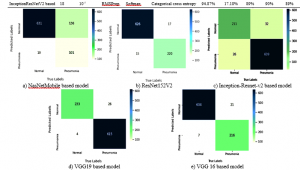
Figure 1: Confusion matrix of all trained and tested models.
loss function of the model VGG16 based model is minimal; also, its accuracy presents the maximum of all trained models. VGG16 based model get into its maximum value of accuracy on epoch 33 with loss value of 11.51% and precision of 91%. VGG19 based model is very close to the VGG16 based one in term of accuracy, but the rest of the models as showed in table 3 presents relatively bad accuracy results to trust for our task.
ROC curve is a fundamental tool for model performance evaluation based on sensitivity/specificity reports or true positive rate and false positive rate, in this ROC graph each curve the sensitivity (true positive rate) is plotted as a function of a specificity value (false positive rate). Area under the curve (AUC) represents how well the model can distinguish between a normal and pneumonia image called.
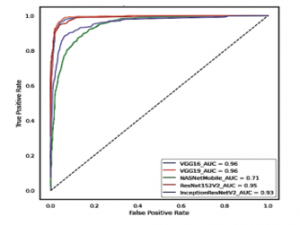
Figure 2: ROC curve comparison for all implemented models.
In general, more the area is big, more the curve is near to the left corner of the graph and more the represented model is better in terms of performance.
5. Conclusion and perspectives
Pneumonia disease classification is a primordial step for diagnosing lung infections which can be caused by several factors including covid-19.
Machine learning methodology especially convolutional neural networks are a very interesting techniques to automatically, efficiently and rapidly output results.
This method faces sense the beginning many problems like the leak of datasets in the world and algorithms complexities in time and processing.
To improve prediction accuracy more and more some extensions must be done, like increasing the dataset by combining multiple independent datasets to set a bigger database of samples that conduct us to use higher processing performances in order to train all the given dataset in a reasonable time and epochs, we need also to preprocess differently the input images by cropping and correcting contrast on X-Ray images based on processing concentration while training, and also proposing the best adapted optimizer on training.
Also, we plan in the future to make our conception of optimized novel model adapted specially for chest X-Ray images. Training stage takes relatively a lot of time depending on the complexity of the algorithm that must be optimized as much as possible and the capacity of available resources. Therefore, there is a lot of required work to achieve by researchers’ efforts to take benefits of this magic field in our world.
Conflict of Interest
The authors declare no conflict of interest.
Acknowledgment
This work is a part of a project supported by co-financing from the CNRST (Centre National pour la Recherche Scientifique et Technique) and the Hassan II University of Casablanca, Morocco. The project is selected in the context of a call for projects entitled “Scientific and Technological Research Support Program in Link with COVID-19” launched in April 2020 (Reference: Letter to the Director of “Ecole Normale Supérieure de l’Enseignement Technique de Mohammedia” dated the 10th June 2020).
- S. Kang, W. Peng, Y. Zhu, S. Lu, M. Zhou, W. Lin, W. Wu, S. Huang, L. Jiang, X. Luo, M. Deng, “Recent progress in understanding 2019 novel coronavirus (SARS-CoV-2) associated with human respiratory disease: detection, mechanisms and treatment,” International Journal of Antimicrobial Agents, 105950, 2020, doi:10.1016/j.ijantimicag.2020.105950.
- A. Jacobi, M. Chung, A. Bernheim, C. Eber, “Portable chest X-ray in coronavirus disease-19 (COVID-19): A pictorial review,” Clinical Imaging, 64, 35–42, 2020, doi:10.1016/j.clinimag.2020.04.001.
- J. Gong, J. Ou, X. Qiu, Y. Jie, Y. Chen, L. Yuan, J. Cao, M. Tan, W. Xu, F. Zheng, Y. Shi, B. Hu, “A Tool to Early Predict Severe Corona Virus Disease 2019 (COVID-19): A Multicenter Study using the Risk Nomogram in Wuhan and Guangdong, China,” Clinical Infectious Diseases, ciaa443, 2020, doi:10.1093/cid/ciaa443.
- H. Moujahid, B. Cherradi, L. Bahatti, Convolutional Neural Networks for Multimodal Brain MRI Images Segmentation: A Comparative Study, Springer International Publishing, Cham: 329–338, 2020, doi:10.1007/978-3-030-45183-7_25.
- N.A. Ali, B. Cherradi, A. El Abbassi, O. Bouattane, M. Youssfi, “Parallel Implementation and Performance Evaluation of some Supervised Clustering Algorithms for MRI Images Segmentation,” in Proceedings of the 4th International Conference on Big Data and Internet of Things, ACM, Rabat Morocco: 1–7, 2019, doi:10.1145/3372938.3373007.
- O. Bouattane, B. Cherradi, M. Youssfi, M.O. Bensalah, “Parallel c-means algorithm for image segmentation on a reconfigurable mesh computer,” Parallel Computing, 37(4), 230–243, 2011, doi:10.1016/j.parco.2011.03.001.
- N. Ait Ali, B. Cherradi, A. El Abbassi, O. Bouattane, M. Youssfi, “GPU fuzzy c-means algorithm implementations: performance analysis on medical image segmentation,” Multimedia Tools and Applications, 77(16), 21221–21243, 2018, doi:10.1007/s11042-017-5589-6.
- N.A. Ali, B. Cherradi, A.E. Abbassi, O. Bouattane, M. Youssfi, “Modelling the behavior of the CPU and the GPU versus the clusters number variation for sequential and parallel implementations of BCFCM algorithm,” ARPN Journal of Engineering and Applied Sciences, 12(21), 6030–6038, 2017.
- S. Laghmati, A. Tmiri, B. Cherradi, “Machine Learning based System for Prediction of Breast Cancer Severity,” in 2019 International Conference on Wireless Networks and Mobile Communications (WINCOM), IEEE, Fez, Morocco: 1–5, 2019, doi:10.1109/WINCOM47513.2019.8942575.
- O. Terrada, A. Raihani, O. Bouattane, B. Cherradi, “Fuzzy cardiovascular diagnosis system using clinical data,” in 2018 4th International Conference on Optimization and Applications (ICOA), IEEE: 1–4, 2018.
- O. Terrada, B. Cherradi, A. Raihani, O. Bouattane, “Atherosclerosis disease prediction using Supervised Machine Learning Techniques,” in 2020 1st International Conference on Innovative Research in Applied Science, Engineering and Technology (IRASET), IEEE, Meknes, Morocco: 1–5, 2020, doi:10.1109/IRASET48871.2020.9092082.
- O. Daanouni, B. Cherradi, A. Tmiri, “Predicting diabetes diseases using mixed data and supervised machine learning algorithms,” in Proceedings of the 4th International Conference on Smart City Applications – SCA ’19, ACM Press, Casablanca, Morocco: 1–6, 2019, doi:10.1145/3368756.3369072.
- O. Daanouni, B. Cherradi, A. Tmiri, “Diabetes Diseases Prediction Using Supervised Machine Learning and Neighbourhood Components Analysis,” in Proceedings of the 3rd International Conference on Networking, Information Systems & Security, ACM, Marrakech Morocco: 1–5, 2020, doi:10.1145/3386723.3387887.
- M. Toğaçar, B. Ergen, Z. Cömert, F. Özyurt, “A Deep Feature Learning Model for Pneumonia Detection Applying a Combination of mRMR Feature Selection and Machine Learning Models,” IRBM, S1959031819301174, 2019, doi:10.1016/j.irbm.2019.10.006.
- V. Chouhan, S. Singh, A. Khamparia, D. Gupta, P. Tiwari, C. Moreira, R. Damasevicius, V. Albuquerque, “A Novel Transfer Learning Based Approach for Pneumonia Detection in Chest X-ray Images,” Applied Sciences, 10, 559, 2020, doi:10.3390/app10020559.
- D.S. Kermany, M. Goldbaum, W. Cai, C.C.S. Valentim, H. Liang, S.L. Baxter, A. McKeown, G. Yang, X. Wu, F. Yan, J. Dong, M.K. Prasadha, J. Pei, M.Y.L. Ting, J. Zhu, C. Li, S. Hewett, J. Dong, I. Ziyar, A. Shi, R. Zhang, L. Zheng, R. Hou, W. Shi, X. Fu, Y. Duan, V.A.N. Huu, C. Wen, E.D. Zhang, et al., “Identifying Medical Diagnoses and Treatable Diseases by Image-Based Deep Learning,” Cell, 172(5), 1122-1131.e9, 2018, doi:10.1016/j.cell.2018.02.010.
- B.B. Chaudhuri, M. Nakagawa, P. Khanna, S. Kumar, Proceedings of 3rd International Conference on Computer Vision and Image Processing: CVIP 2018, Volume 1, Springer Nature, 2019.
- O. Stephen, M. Sain, U.J. Maduh, D.-U. Jeong, “An Efficient Deep Learning Approach to Pneumonia Classification in Healthcare,” Journal of Healthcare Engineering, 2019, 1–7, 2019, doi:10.1155/2019/4180949.
- D. Kermany, K. Zhang, M. Goldbaum, “Large Dataset of Labeled Optical Coherence Tomography (OCT) and Chest X-Ray Images,” 3, 2018, doi:10.17632/rscbjbr9sj.3.
- C. Senaras, M.N. Gurcan, “Deep learning for medical image analysis,” Journal of Pathology Informatics, 9(1), 25, 2018, doi:10.4103/jpi.jpi_27_18.
- Y. Lecun, L. Bottou, Y. Bengio, P. Haffner, “Gradient-based learning applied to document recognition,” Proceedings of the IEEE, 86(11), 2278–2324, 1998, doi:10.1109/5.726791.
- S. Srinivas, R.K. Sarvadevabhatla, K.R. Mopuri, N. Prabhu, S.S.S. Kruthiventi, R.V. Babu, An Introduction to Deep Convolutional Neural Nets for Computer Vision, Elsevier: 25–52, 2017, doi:10.1016/B978-0-12-810408-8.00003-1.
- N. Tajbakhsh, J.Y. Shin, R.T. Hurst, C.B. Kendall, J. Liang, Automatic Interpretation of Carotid Intima–Media Thickness Videos Using Convolutional Neural Networks, Elsevier: 105–131, 2017, doi:10.1016/B978-0-12-810408-8.00007-9.
- S. Miao, J.Z. Wang, R. Liao, Convolutional Neural Networks for Robust and Real-Time 2-D/3-D Registration, Elsevier: 271–296, 2017, doi:10.1016/B978-0-12-810408-8.00016-X.
- H. Chen, Q. Dou, L. Yu, J. Qin, L. Zhao, V.C.T. Mok, D. Wang, L. Shi, P.-A. Heng, Deep Cascaded Networks for Sparsely Distributed Object Detection from Medical Images, Elsevier: 133–154, 2017, doi:10.1016/B978-0-12-810408-8.00008-0.
- N. Srivastava, G. Hinton, A. Krizhevsky, I. Sutskever, R. Salakhutdinov, “Dropout: A Simple Way to Prevent Neural Networks from Overfitting,” Journal of Machine Learning Research, 15(56), 1929–1958, 2014.
- H.-I. Suk, An Introduction to Neural Networks and Deep Learning, Elsevier: 3–24, 2017, doi:10.1016/B978-0-12-810408-8.00002-X.
- F.C. Ghesu, B. Georgescu, J. Hornegger, Efficient Medical Image Parsing, Elsevier: 55–81, 2017, doi:10.1016/B978-0-12-810408-8.00005-5.
- S.S. Yadav, S.M. Jadhav, “Deep convolutional neural network based medical image classification for disease diagnosis,” Journal of Big Data, 6(1), 113, 2019, doi:10.1186/s40537-019-0276-2.