Introduction
Assessing exercise capacity during training constitutes an important element of preparing athletes for sports competitions and enables monitoring of overtraining. Work capacity allows athletes to perform maximum exercise loads without undue fatigue. In strength and endurance sports, the most frequently used testing methods are physiological, biochemical and biomechanical ones. In 1922, Hill and Lupton pointed to the importance of measuring maximal aerobic capacity for the assessment of athletes’ endurance (Hill and Lupton, 1922). Maximal aerobic capacity (VO2max) to a large extent depends on the athletes’ cardiopulmonary efficiency and muscle metabolic capacity (Howley et al., 1995). Studies have shown high susceptibility of this indicator under the influence of endurance training in individuals with an average level of physical fitness. However, in athletes with a high level of aerobic fitness, improvements in VO2max are marginal (Smith and Hopkins, 2012).
Due to small changes in maximal oxygen uptake in elite athletes, it is advisable to include additional analysis of biochemical and biomechanical indices in sports diagnostics.
Biochemical assessment involves mainly markers of muscle metabolism indicating the level of fiber damage and the accompanying responses of inflammatory factors as well as disturbance of acid-base homeostasis (Banfi et al., 2012). Personalised sports training leads to adaptive changes in the muscle cell, which improve metabolic processes, as well as changes in the structure of the skeletal muscles themselves. As a result, the force generated by the muscles increases, and so does the efficiency of the antioxidant defence systems (Egan and Zierath, 2013; Steinbacher and Eckl, 2015). Neuro-hormonal factors, which are modified by sports training, participate in the regulation of the body's metabolic response to exercise. Intense physical activity, both dynamic and static, causes an increase in testosterone concentration (Hackney et al., 1995). Over the course of training, it was observed that muscles adapted to a particular level of the exercise load with a simultaneous decrease in the concentration of testosterone during exercise. Excessive training loads cause a decrease in blood testosterone concentration with a simultaneous increase in cortisol concentration. Anabolic/catabolic factors, i.e. total testosterone to cortisol (TT/C) and/or free testosterone to cortisol (FT/C), are among the indicators of overtraining (Vervoorn et al., 1991).
Stationary ergometers, which stimulate the mechanical loads involved in rowing or canoeing, are used for biomechanical tests. However, differences in the accuracy of measurements between on-water and off-water rowing ergometers were found. These differences result from the lack of the asymmetry of movements characteristic of these disciplines (Shaharudin and Agrawal, 2016). Therefore, in order to ensure accuracy of tests, specialised sweep-oar and canoe ergometers should be used.
A biomechanical assessment of the effectiveness of strength and endurance training of rowers usually involves measurement of force and power. Although maximum force and power are measured separately, their effect on movement is complex, and muscle strength usually constitutes the basis for the generated power (Richter et al., 2016)
Force and power are important elements of athletes' physical preparation, and the importance of their role increases with exercises of sub- and maximum intensity. There is a significant relationship between maximum power and results in sports. The average power (with an endurance component) (Stevens et al., 2015) is of decisive importance in terms of the duration of exercise. However, it can be assumed that there is an approximate linear relationship between mean power and impulse of force, which in turn is a component of the work performed during the exercise. The impulse of force clearly shows that it is not only the value of force (F) that affects the speed of the boat, but also the time (t). By extending the time over which force is exerted, the athlete will achieve the same effect of the impulse of force with lower muscular strength (Kleshnev, 2016).
The aim of this research was to evaluate the impulse of force as an assessment of exercise capacity in competitive rowers and canoeists via a specific exercise test.
Methods
Participants
A total of 20 athletes practising asymmetric water sports, including 12 rowers and 8 canoeists, underwent performance tests. The tests were carried out twice: at the beginning (the first testing session) and at the end (the second testing session) of the preparatory period of the annual training cycle. Athletes underwent progressive intensity exercise tests carried out to volitional exhaustion, during which maximal aerobic capacity, strength, metabolic indices, and markers of skeletal muscle damage were assessed. The study was conducted according to the Declaration of Helsinki and the National Statement and Human Research Ethics Guidelines and approved by the IRB (Institute for Research in Biomedicine) at the Poznan University of Medical Sciences (2017-02-02; Ethics Approval Number: 208/17). Each of the athletes, having familiarised themselves with the study protocol, agreed in writing to participate in the study.
Initially, the study included 22 male athletes. A total of 20 subjects qualified for the study after two athletes did not fulfil the conditions of the study protocol owing to injury and taking anti-inflammatory medications. All participants were asked to refrain from alcohol and strenuous activity for 24 hours prior to blood sampling. The studied athletes were members of the Polish national rowing team who participated in major international competitions (e.g., World Championships, European Championships, Olympic Games).
Anthropometrics measurements
Body mass and body height were measured with the use of the WPT 60/150 OW medical scales (Radwag®, Poland).
Biomechanical measurement
Two measuring stands were used to test biomechanical variables:
– sweep rowing ergometer (Figure 1), which was constructed as part of the research project, and devices for synchronous recording of two variables: force at the blade of which direction was perpendicular to the long axis and angular position of the oar relative to the ergometer's longitudinal axis (parallel to the seat guide),
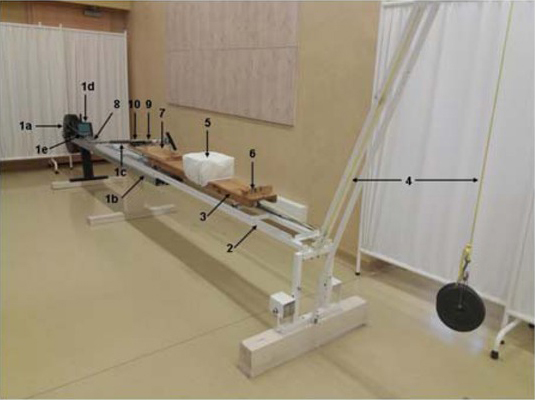
– canoe ergometer (Figure 2) with devices synchronously recording two variables, i.e.: force at the blade of which direction was perpendicular to the long axis and acceleration of the seat.
Figure 1
Sweep rowing ergometer Components of the ergometer: 1- guide rail and seat, 2 - oar braking system; 3 - LCD monitor displaying oar load variables; 4 - outrigger attached to the guide rail with oarlock; 5 - cords providing resistance to the oar; 6 - tensometric transducer used to measure the force at the blade; 7 - potentiometric transducer at the oarlock measuring the angular position of the oar; 8 - accelerometer attached to the seat; 9 - recording device for all transducers.
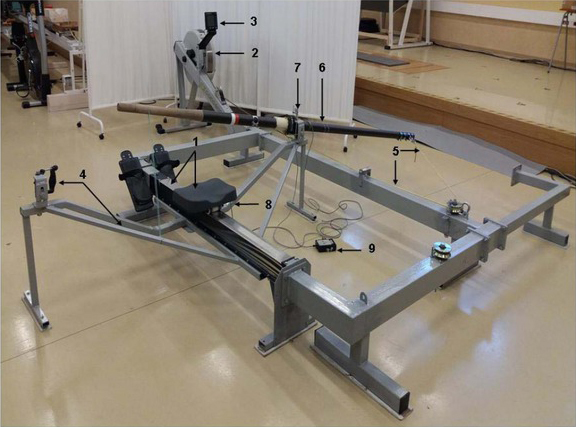
Figure 2
Canoe ergometer Components of the ergometer: 1 - canoeing ergometer, 1a - oar resistance system, 1b - guide rail, 1c - oar, 1d - LCD monitor displaying work variables, 1e - cord providing resistance to the oar; 2 - seat guide; 3 - mobile seat with 4 wheels; 4 - cord weighing down the seat; 5 - foam kneeler; 6 and 7 - feet stabilisers; 8 - transducer used to measure the force at the blade;9 - accelerometer attached to the seat; 10 - recording device for the transducer (item 8 and 9)
It should be emphasised that, given the different rowing techniques, the above ergometers were equipped with two independent sets of software, which enabled on-line analysis of selected variables during rowing. Average characteristics of the rowing cycle were determined for the selected part of the movement.
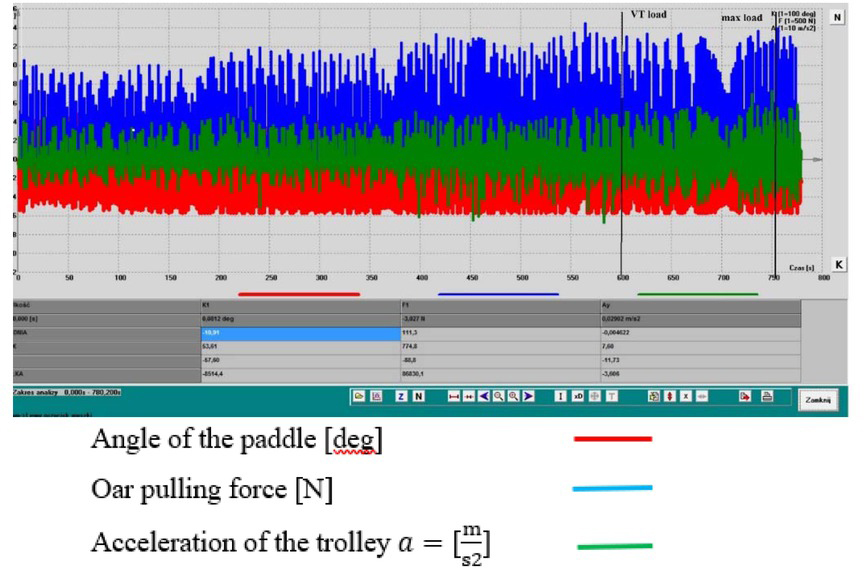
By equipping the ergometers with appropriate accessories, it was possible to perform on-line measurements of force at the blade, angular position of the oar relative to the ergometer's longitudinal axis (parallel to the seat guide), and acceleration of the seat. A recorder transmitted the data wirelessly to a computer. During the test, changes in the above-mentioned variables were visualised directly on graphs during a number of rowing cycles until the individual threshold of anaerobic metabolism or the maximum load was reached (Figure 3). The so-called impulse of force may be determined on the basis of the above-mentioned F(t) change diagrams. The result is a biomechanical variable which is easy to measure, inextricably connected to the force (F) in specific time (t), and it always results in a change in the speed of the body/boat. The sum of impulses of force for a number of rowing cycles was selected for analysis. The duration of the test ranged from 12 to 16 minutes or until exhaustion. During this time, athletes performed an average of 330 ± 44 (rowers) and 349 ± 83 (canoeists) rowing cycles. The above-mentioned variables were determined and analysed with the use of two programs, TRow2v0 and TCan2v0, respectively, using the following calculations:
Figure 3
Example of F(t), α(t), a(t) diagrams obtained simultaneously on-line during the exercise test completed by rowers/canoeists on an ergometer
The data were stored in the memory of recorders or directly in the computer memory.
Graded exercise test protocol
All athletes underwent a graded exercise test (GXT) in two testing sessions on a rowing ergometer (Figures 1 and 2). The GXT began at a workload of 0.3 W/ kg. The work rate was increased by 0.3 W/kg every 3 minutes until the athlete could no longer maintain the applied workload. Each test lasted 12-18 minutes, depending on age and aerobic fitness. The exercise tests were conducted between 8:00 a.m. and noon in an air-conditioned laboratory, 2 hours after consuming a light meal.
Physiological measurements
Expired gases, minute ventilation (VE), and heart rate (HR) during the GXT were monitored continuously with the Oxycon Mobile automated system (Viasys Healthcare, Germany). Oxygen intake (VO2) and carbon dioxide output (VCO2) were measured breath-by-breath and were averaged at 15-s time periods. Before each trial, the system was calibrated according to the manufacturer’s instructions. Ambient conditions, i.e. temperature, humidity, and barometric pressure, were recorded by the sensors. In a two-point volume calibration (0.2 and 2 L/s), the flow values were measured automatically at the set measuring points. Gas analyser calibration was carried out with a standard gas mixture, 5% CO2 and 16% O2. Peak VO2 was defined as the highest 15-s averaged VO2 obtained during the last exercise in the test. HRmax (beats/min) was measured as the highest 15-s averaged value in the test. Time to exhaustion (TTE) and the maximal work rate (WRmax) were also measured. To determine the ventilatory threshold (VT), the V-slope method was administered using computerised regression analysis of the slopes of the CO2 output versus O2 uptake plot, which detects the beginning of the excess CO2 output generated from the buffering of [H+] (Beaver et al., 1986). The method involves the analysis of the behavior of VCO2 as a function of VO2 during GXT, with a consequent increase in VCO2. This resulted in a transition in the relation between VCO2 and VO2. Software supplied by Viasys Healthcare was supported by visual inspection by an experienced researcher. The ventilatory equivalent method was used as a secondary method, and the point when the equivalent for oxygen (VE/VO2) raised without concomitant rise in the equivalent for carbon dioxide (VE/VCO2) was detected (Day et al., 2003; Davis et al., 1980; Gitt et al., 1994; Powers et al., 1984; Reinhard et al., 1979; Shimizu et al., 1991). The VT was expressed as the work rate (W), heart rate (HR) (beats/min) and time (t) when the VT was reached.
Blood collection, biochemical measurements
Blood samples were collected before and after the exercise tests (two days after the last intensive training unit) to exclude the influence of training loads on biochemical variables tested. Blood samples were taken from the ulnar vein using a S-Monovette syringe tube (SARSTEDT, Germany) then placed in tubes containing a clot activator and centrifuged (1500 g, 4°C, 4 minutes) in order to separate the serum. The samples were frozen and stored at -75°C until the time the analyses were performed. Creatine kinase (CK) activity was determined with the use of the Accent 220S (Cormay, Poland) biochemical analyser and sets of enzymatic reagents (Cormay, Poland). The sensitivity of the sets was 7.4 U/L (intra-assay coefficient of variation [CV], < 10 %).
Concentrations of total testosterone (TT), free testosterone (FT), cortisol (C), interleukin 1 (IL-1), and interleukin 6 (IL-6) were measured using the ELISA immunoenzymatic method (AssayPro LLC, St. Charles, MO). The sensitivity of the ELISA kits was as follows: 0.083 ng/mL ([CV], 3.61%), 0.018 pg/mL ([CV], 5.96%), 2.5 ng/mL ([CV], 5.63%), 1.334 ng/mL ([CV], <8%), 0.81 ng/mL ([CV], 4.4%).
Colometric methods were used to determine the concentrations of the total antioxidant capacity of plasma (Ferric Reducing Ability of Plasma [FRAP], reference values: 6001600 μmol/L) (Benzie et al., 1966), the plasma concentration of thiobarbituric acid reactive substances (TBARS, reference values: 1-6 μmol/L) (Ohkawa et al., 1979), and total phenolics (reference values: 2.8-4.0 g GAE/L) (Singleton et al., 1965). The concentration of lactate in capillary blood was determined with the use of test strips and the LactatEDGE monitor (ApexBio, Poland). All pre-exercise and post-exercise specimens from each individual were analysed in the same batch by an experienced technician who was blinded to the origin of samples.
Training program
Rowers' training program
All athletes were subjected to a 24-week training program. The loads were highly varied in terms of their character and training modalities applied. The standard number of training sessions ranged from 9 to 10 during the preparatory period and from 12 to 14 during training camps. At the beginning of the preparatory period, general training sessions prevailed with training modalities such as running, proprioceptive exercises, swimming, cycling, cross-country skiing, team sports, and strength training. Targeted training, i.e. rowing on an indoor rower, was included beginning with microcycle 5. Specific on-water exercises were included from microcycle 17, and the amount of such training increased dynamically in subsequent microcycles.
At the beginning of the preparatory period (microcycles 1 to 4), there were mainly low and moderate intensity aerobic exercises along with hypertrophy training. In the next mesocycle (microcycles 5 to 8), the intensity of exercises increased, the aim being to develop aerobic endurance, aerobic-anaerobic endurance, and maximum strength. This trend continued in the next mesocycle (microcycles 9 to 12), however, with a significant increase in aerobic-anaerobic loads. Power sessions were also introduced. In microcycles 13 to 24, the development of aerobic and aerobic-anaerobic endurance continued, and sessions increasing anaerobic endurance were introduced. During resistance training, power development continued, and strength conditioning components were included.
Canoeists' training program
All athletes were subjected to a 31-week training program. The loads varied highly in terms of their direction and training modalities applied. The standard number of training sessions ranged from 10 to 12 during the preparatory period and from 18 to 20 during training camps. At the beginning of the preparatory period, general training sessions prevailed with training modalities such as running, proprioceptive exercises, cycling, cross-country skiing, rowing ergometer exercises, and stretching. Targeted training involving a canoe ergometer and circuit training, was included from microcycle 6. Specific on-water exercises were included from microcycle 13, and the amount of such training increased dynamically in subsequent microcycles.
At the beginning of the preparatory period (microcycles 1 to 8), there were mainly low and moderate intensity aerobic exercises, core muscle training, and stretching. In the last 3 microcycles of this mesocycle, strength endurance training in the form of circuit training and rowing technique training were included.
In the next mesocycle (microcycles 9-16), the intensity of exercises increased, the aim being to develop aerobic endurance. Strength training involved higher loads, and the number of technical exercises on a canoe also significantly increased. The number of general exercises and prioprioceptive exercises was significantly reduced.
In microcycles 17-24, the development of aerobic strength continued. The intensification of training was also aimed at the development of aerobic and anaerobic endurance. The volume of training units aimed at maintaining aerobic capacity was reduced. In the middle of this period, in addition to strength training, 3 training units aimed at developing maximum strength were introduced. The number of rowing technique sessions was also reduced due to unfavourable weather conditions.
In microcycles 25-31, sessions developing aerobic and aerobic-anaerobic endurance continued. Aerobic maintenance sessions were used only as active rest. In resistance training, strength endurance exercises were replaced with exercises with maximum loads. Technical on-water training was intensified from microcycle 28.
Statistical analyses
All data are presented as mean, standard deviation (SD), median, and interquartile range. The normality of distribution was tested with the Shapiro-Wilk test. The differences between paired and normally distributed variables were analysed using the t-test, and the Wilcoxon test was used for non-normally distributed variables. Spearman’s rank analysis was used to calculate correlation coefficients. The level of statistical significance was set at p ≤ 0.05. The obtained results were analysed statistically using the Dell Inc. (2016) Dell Statistica 13 software (Tulsa, Oklahoma, USA).
Results
There were 20 athletes included in the analysis. Table 1 presents the values of selected anthropometric and ergospirometric indices, as well as biomechanical variables of the examined athletes on the two test dates.
Table 1
Physiological and biomechanical indices, baseline and post-intervention, in both groups of athletes (mean ± SD)
Statistical analysis of anthropometric variables showed a significant difference in body mass between the groups of athletes on each test date (p ≤ 0.05). The study also showed significant differences on each test date between rowers and canoeists with respect to the maximum load of exercises obtained in the test protocol (p ≤ 0.001), maximum oxygen uptake (p ≤ 0.001), and the load obtained at the borderline of the individual threshold of anaerobic metabolism (p ≤ 0.001). The analysis of biomechanical test results showed significant differences on each test date in terms of the impulse of force at the threshold and maximum load levels, as well as a difference in impulse values between these two loads (p ≤ 0.001) in both tested groups.
Comparative analysis of the level of biochemical indices (Tables 2 and 3), determined at rest between baseline and post-intervention, showed a significant increase in IL-1 concentration, a decrease in C (p ≤ 0.001), and a decrease in the TT/C index (p ≤ 0.05) in the group of rowers after training. On the other hand, in the group of canoeists, there was a significant increase in resting CK activity after training intervention in relation to baseline values (p ≤ 0.05).
Table 2
Concentration of selected biochemical indices in blood, baseline and post-intervention, in rowers (mean ± SD)
[i] Data are expressed as mean (SD) * p ≤ 0.05 – vs. canoeists; # p ≤ 0.05 – vs. post-intervention; abbreviations: IL-1 = human interleukin-1, IL-6 = human interleukin-6, CK = creatine kinase, C= cortisol, TT = total testosterone, FT = free testosterone, FRAP = Ferric Reducing Ability of Plasma, TBARS = thiobarbituric acid reactive substances, La = lactate.
Table 3
Concentration of selected biochemical indices in blood baseline and post intervention in canoeists (mean ± SD)
[i] Data are expressed as mean (SD) * p ≤ 0.05 – vs. canoeists; # p ≤ 0.05 – vs. post-intervention; abbreviations: IL-1 = human interleukin-1, IL-6 = human interleukin-6, CK = creatine kinase, C= cortisol, TT = total testosterone, FT = free testosterone, FRAP = Ferric Reducing Ability of Plasma, TBARS = thiobarbituric acid reactive substances, La = lactate.
Analysis of resting values of the examined biochemical indices between the studied groups of athletes showed a significant difference in the concentration of total phenolics (p ≤ 0.05) and CK activity (p ≤ 0.01) in blood serum, but only on the second test date. In the group of rowers, on each test date, the maximum physical effort caused a significant increase in concentrations of IL-6, TT (p ≤ 0.05), C, FT, TT/C, FT, total phenolics, La and CK activity (p ≤ 0.01), while after training there was only an increase in the concentration of FRAP (p ≤ 0.05). In the group of canoeists, a significant post-exercise change (p ≤ 0.05) in IL-6, total phenolics, La and CK activity was observed on the first and second test dates, whereas after the intervention, a change in FRAP concentration (p ≤ 0.05) was observed.
Analysis of exercise increments (Δ) of the studied biochemical indices in rowers showed a significantly higher difference in the concentrations of C (p ≤ 0.01), TT/C, and FT/C (p ≤ 0.05) in the first testing session and exercise increments for TT (p ≤ 0.001), FT (p ≤ 0.05), TT/C, FT/C (p ≤ 0.01), and total phenolics (p ≤ 0.05) in the second testing session, compared to canoeists.
Analysis of correlations among physiological, biomechanical, and biochemical test results obtained for both groups of athletes showed a significant relationship between load values at the level of the anaerobic threshold (AT) and the change in FT concentration (the ratio of anabolic-catabolic TT/C and FT/C indices) in the first and second testing sessions (p ≤ 0.05). There was a negative correlation between the change in C concentration during exercise and the load at the anaerobic threshold in the first session (r = -0.62, p ≤ 0.01) and a positive correlation with post-exercise increases in TT concentration in the second session (r = 0.78, p ≤ 0.0001). The maximum load positively correlated with the change in blood FC concentration during exercise and the change in TT/C and FT/C indices during exercise in each session (p ≤ 0.05). On both test dates, maximal oxygen uptake correlated positively with the change in FT concentration during exercise (r = - 0.68, p ≤ 0.001) and the FT/C and TT/C indices (p ≤ 0.05), and there was a negative correlation between the maximum load and change in blood C concentration during exercise that was observed only at baseline. Maximum oxygen uptake in each session showed a positive correlation with the change in FT concentration during exercise and with the FT/C and TT/C indices, and it showed a negative correlation with the change in C (p ≤ 0.05) and exercise in TT concentration only after the intervention (r = 0.77, p ≤ 0.0001). At baseline, the biomechanical perithreshold impulse index positively correlated with the change in FT and with TT/C during exercise (p ≤ 0.05), and it negatively correlated with cortisol concentration (r = -0.53, p ≤ 0.05), whereas after the intervention, there was a positive correlation between the perimaximal impulse and changes in TT, FT, TT/C, and FT/C concentrations during exercise (p ≤ 0.05).
Discussion
The most significant result of the study is the relationship between the evaluated biomechanical indices and the response of the biochemical indices to exercise. Also the relationship between physiological and biochemical variables found in the exercise test is important. These relationships concern mainly free and total testosterone concentrations, cortisol, and anabolic-catabolic indices. There was no relationship between physical fitness or the biomechanical analysis of movement with biochemical muscle-cell-damage indices following exercise (CK, IL-1) and markers of free-radical changes (FRAP, TBARS, total phenolics).
The maximum physical effort in the test resulted in a statistically significant increase in most of the examined biochemical indices in the first and second testing sessions in rowers. Such highly statistically significant changes were not observed in response to the test effort in canoeists. This is probably due to the value of the applied maximum load, the level of acidification of muscles, and their total weight, as well as the rowing motion. Therefore, no significant change in blood concentration of free and total testosterone, cortisol, or anabolic-catabolic indices in canoeists was observed in none of the sessions. The exercise test in both groups of athletes, on both testing dates, contributed to significant changes in biochemical indices (CK), indicating the occurrence of micro-damages to muscle fibres. Jürimäe et al. (2017), in a study involving highly trained rowers, recorded an inverse relationship between the level of VO2max and the resting concentration of some inflammatory indices, including IL-8, indicating an increased defence potential of the organism. In our study, no significant correlation between the level of VO2max and the concentration of IL-6 or IL-1 was found. Cipryan (2018) observed that the higher the level of training experience in athletes, the higher the increase in IL-6 concentration after physical exercise, despite lower muscle fibre damage and lower CK activity. This cytokine, although it belongs to the group of pro-inflammatory factors and was secreted as a result of muscle fibre contraction, inhibits the effect of other pro-inflammatory factors, including TNFα and IL-1 production, which is indicative of its defensive functions (Mathur et al., 2008). Moreover, it participates in the regulation of glucose transport to the skeletal muscle (Cartee, 2015). In our study, despite the increase in IL-6 concentration, no significant increase in IL-1 concentration was observed immediately after physical effort, however, in the group of rowers the level of this cytokine at rest in the second testing session was higher than in the first testing session, which may indicate a greater disturbance of homeostasis during the period of increased training loads. The relationships between biochemical and physiological indices in the exercise test have been addressed in many publications. Measurement of resting testosterone and cortisol concentrations in the blood of athletes (various sports) was used in the assessment of adaptation to training loads and diagnosis of overtraining (Rietjens et al., 2015). Our study showed a statistically significant decrease in cortisol concentration (p ≤ 0.01) and TT/C index (p ≤ 0.05) in blood in rowers after the intervention. This change seems to be beneficial from the point of view of the athlete's level of endurance capacity, metabolic adaptation, and resistance to damage. Many authors described smaller release of CK from muscle cells during exercise as a result of decreased permeability and damage to cell membranes by free radicals formed during physical effort (Banfi et al., 2012; Mason et al., 2016). An elevated level of creatine kinase activity was observed for a few days after physical activity of high intensity and long duration. According to previous suggestions, the level of CK activity should preferably be measured 24 to 48 hours following physical activity (Banfi et al., 2012). In this study, blood was collected two days after the end of the last training session. There was a statistically significant increase in the activity of the studied enzyme between the sessions only in canoeists, and there was no change in other indices related to overtraining and increasing cell oxidative stress. The above is probably due to the high level of physical fitness of athletes. In ergospirometry, cardiopulmonary indices at the level of the threshold and the maximum load differed significantly between the groups (p ≤ 0.001) and did not change under the influence of applied training loads in any of the studied groups. Many publications demonstrated the predictive importance of measuring maximum oxygen uptake as an indicator of high capacity of rowers (Cosgrove et al., 1999). However, there are still few new studies concerning the application of more accurate methods for determining physical fitness in elite rowers and canoeists beyond maximal aerobic capacity. Although Bourdin et al. (2017) described the use of peak power output (Ppeak) measurement as a simple and effective method for assessing the overall fitness of rowers and the effectiveness of the training program as a replacement for the traditionally used laboratory measurement of VO2max.
Force and power are important elements of athletes' physical conditioning, and the importance of their role increases when exercises are performed with submaximal and maximal intensity. There is a significant relationship between maximum power (or force) and sports performance. Considering the duration of the exercise, mean power (with an endurance component) is of decisive importance (Stevens et al., 2015). It was noted that there was an approximate linear relationship between mean power and the impulse of force, which is a component of the work performed during the effort. The easy-to-measure impulse of force was obtained on-line on the basis of the exercise test on ergometers. It is a physical quantity, inextricably connected with force (F) in a specific time (t), which always results in a change of momentum of the body or boat on which this force acts. Thus, the impulse of force (J = F · t) not only determines the value of force (F), but also duration of its action, which has a serious impact on the speed of the boat. By extending the time over which the force acts, the athlete will achieve the same impulse of force as when using a higher load over a shorter period of time. Thus, by generating less force, the athlete reduces the strain on the motor system while maintaining the speed of the boat.
The impulse of force at the threshold and the maximum load was positively correlated with FT and TT/C during exercise (p ≤ 0.05), negatively correlated with cortisol concentration (p ≤ 0.05) in the first testing session, and positively correlated with TT, FT, TT/C, and FT/C concentrations during exercise (p ≤ 0.05) in the second testing session. Due to the fact that these biochemical indices were correlated with maximum oxygen uptake in each session, it can be concluded that there is an indirect relationship between maximal aerobic capacity and the impulse of force.
Limitations of the study
In our study, we determined the concentration of total phenolics which show antioxidant effects and are an indicator of intake of foods rich in these compounds. However, we did not include an analysis of the athletes' diets which could document the influence of the consumed foods on the level of antioxidant potential and its importance in the training process.
Conclusions
The measurement of the impulse of force can become a simple and effective method for evaluating the overall exercise capacity of rowers because of its relationships with indices of the load and changes in hormonal indices of anabolic and catabolic processes during exercise tests. Therefore, it may constitute a replacement for the traditional laboratory measurement of VO2max in highly qualified rowers and canoeists.