


Activation of the p53 pathway in adipose tissue contributes to insulin resistance associated with obesity. However, the mechanisms of p53 activation and the effect on adipocyte functions are still elusive. Here we found a higher level of DNA oxidation and a reduction in telomere length in adipose tissue of mice fed a high-fat diet and an increase in DNA damage and activation of the p53 pathway in adipocytes. Interestingly, hallmarks of chronic DNA damage are visible at the onset of obesity. Furthermore, injection of lean mice with doxorubicin, a DNA damage-inducing drug, increased the expression of chemokines in adipose tissue and promoted its infiltration by proinflammatory macrophages and neutrophils together with adipocyte insulin resistance. In vitro, DNA damage in adipocytes increased the expression of chemokines and triggered the production of chemotactic factors for macrophages and neutrophils. Insulin signaling and effect on glucose uptake and Glut4 translocation were decreased, and lipolysis was increased. These events were prevented by p53 inhibition, whereas its activation by nutlin-3 reproduced the DNA damage-induced adverse effects. This study reveals that DNA damage in obese adipocytes could trigger p53-dependent signals involved in alteration of adipocyte metabolism and secretory function leading to adipose tissue inflammation, adipocyte dysfunction, and insulin resistance.
Introduction
Insulin resistance is associated with obesity and is a major risk factor for type 2 diabetes. Adipose tissue (AT) plays an important role in glucose and lipid homeostasis (1,2), and AT dysfunction associated with obesity has emerged as a critical event for the development of insulin resistance. Low-grade inflammation and oxidative and hypoxic stresses both develop in obese AT and are involved in the alteration of adipocyte functions (3–6). Therefore, activation of stress-signaling pathways in adipocytes is critically involved in AT dysfunction and insulin resistance (7–10).
The tumor suppressor p53 has recently emerged as a novel regulator of metabolic homeostasis and adaptation to nutritional changes in different organs, including AT (11–13). A role for the alterations of p53 activation has thus been proposed in metabolic diseases such as diabetes and obesity. Indeed, activation of p53 was reported in AT of genetically and high-fat/high-sugar obese mice (14,15), and invalidation of p53 in adipocytes was shown to protect obese mice from insulin resistance and reduce AT inflammation (15). Conversely, p53 overexpression in adipocytes triggers insulin resistance and the expression of proinflammatory cytokines in AT (15). Despite the significance of p53 activation in obese AT, its role in the alterations of adipocyte functions and the causes of its activation in obese AT are poorly understood.
The p53 pathway is a key effector of the DNA damage response (DDR) and is activated by several stressors that induce DNA lesions, the most deleterious one being DNA double-strand breaks (DSBs) (16). The oxidative stress occurring in AT of obese subjects is among the several possible stressors (4,15). We thus hypothesized that nuclear DNA damage in adipocytes triggers the activation of the p53 pathway leading to metabolic and endocrine dysfunctions in adipocytes and to systemic propagation of deleterious signals for insulin sensitivity.
Research Design and Methods
Cell Culture
Human visceral preadipocytes from lean subjects without diabetes (Biopredic, Rennes, France) and 3T3-L1 cells were differentiated into adipocytes as previously described (17,18). Small interfering (si)RNA (Dharmacon) transfection was performed with INTERFERin (Ozyme, St Quentin-en-Yvelines, France) as previously described (19). RAW 264.7 and RAW-Blue (InvivoGen) macrophages were maintained in DMEM–5% heat-inactivated FCS. RAW-Blue expressed secreted embryonic alkaline phosphatase under the control of nuclear factor-κB (NF-κB) and activator protein-1. Human mononucleated cells were isolated from blood using Ficoll Hypaque, and monocytes were enriched and differentiated into M0 macrophages, as previously described (20). Volunteers signed an informed consent according to the Declaration of Helsinki and recommendations of an independent scientific review board.
Animal Studies
Male mice were purchased from Charles Rivers Laboratory (St-Aubin-lès-Elbeuf, France). Mice (ob/ob and ob/+) were used at 14 weeks of age. C57BL6/J mice were used for high-fat diets (HFD) experiments (45 or 60 kcal% fat; ssniff Spezialdiäten GmbH, Soest, Germany) started at 7 weeks of age and continued for 2, 4, or 18 weeks (Supplementary Table 1). At age 15 weeks, C57BL/6J mice were injected for 42 h with doxorubicin (2 mg/kg; Sigma-Aldrich) or 0.9% NaCl for epididymal (epi)AT analysis. An intraperitoneal glucose tolerance test (IPGTT) was performed after starvation for 6 h, as previously described (21). The Nice/Sophia-Antipolis University Animal Care Committee approved all studies.
Measurement of Insulin Signaling and Metabolism in Adipocytes
Insulin signaling, 2-[3H]deoxyglucose uptake, Glut4 translocation, and lipogenesis on isolated adipocytes were determined as previously described (22). Glycerol content in the medium was determined as a readout of adipocyte lipolysis using the GPO-Trinder colorimetric assay (Sigma-Aldrich).
Flow Cytometry Analysis of AT Immune Cells
The stromal vascular fraction (SVF) cells obtained after epiAT treatment with collagenase (21) were incubated 15 min with Fc block, resuspended in dedicated buffer, and stained for 30 min at 4°C with fluorochrome-conjugated specific antibodies or control isotypes to quantify macrophages (F4/80 and CD11c), neutrophils (Lys6G and CD11b), and T (CD3) or B (B220) lymphocytes. The labeling was analyzed by flow cytometry using a MACSQuant cytometer (Miltenyi) and FlowJo software (TreeStar).
Immune Cells Chemotaxis and Activation Assays
Chemotaxis of RAW 264.7 and human M0 macrophages induced by adipocyte-conditioned media (AdCM) was assessed by Boyden chambers assay (8-μm pores, BD Bioscience). Cells that were migrated at the filter’s lower face were labeled with crystal violet and counted in five randomly selected areas. For macrophage activation, secreted embryonic alkaline phosphatase activity was quantified in the media of RAW-Blue cells. RNAs were prepared for the analysis of polarization marker expression. Human M0 polarization was determined by the quantification of the surface expression of M0, M1, and M2 markers, as previously described (20).
To quantify neutrophil migration against AdCM, 2 × 10⁵ white blood cells were plated in the upper chamber of Boyden chambers (3-μm pores). Cells in the lower chamber were labeled 2 h later with fluorescein isothiocyanate (FITC)–coupled Lys6G and phycoerythrin-coupled CD11b antibodies before flow cytometry analysis.
Immunofluorescence Studies
Snap-frozen epiAT was embedded in optimal cutting temperature medium, and 15-µm sections were fixed in 4% paraformaldehyde, incubated in 10 mmol/L glycine, washed, and incubated in PBS, 2% BSA, and 0.1% Tween-20. Adipocytes from epiAT were isolated by collagenase digestion, as previously described (21), and were fixed as above. The AT sections or isolated adipocytes were then incubated with the indicated antibodies and DAPI, washed, and mounted. Images were quantified using motion-tracking software (23).
The three-dimensional imaging of solvent-cleared organs (3DISCO) tissue-clearing method (24) was adapted to AT. EpiAT was fixed in 3% paraformaldehyde and successively washed in PBS containing 0.2% Triton X-100, or 0.2% Triton X-100 and 20% DMSO, or 0.1% Tween-20, 0.1% Triton X-100, 0.1% deoxycholate, 0.1% NP40, and 20% DMSO for 24 h each. EpiAT was then incubated overnight in PBS, 0.2% Triton X-100, 10% DMSO, and 0.3 mol/L glycine and blocked by adding 6% BSA for 2 days. After two washes in PTwH (PBS, 0.2% Tween-20, and 0.001% heparin), samples were incubated 2 days with FITC-labeled anti–γ-H2AX antibody, Alexa Fluor 647 phalloidin, and DAPI in PTwH, 5% DMSO, and 3% BSA, and washed in PTwH for 2 extra days. The clearing was performed by successively using 50%, 75%, and 100% tetrahydrofuran, 3 h each time, and finally, with dibenzyl ether for 2 h before confocal acquisition and image analysis with Fiji software.
Microarray Analysis
RNA was isolated from 3T3-L1 adipocytes using RNeasy Lipid Tissue Kit (Qiagen), quantified by a NanoDrop ND-1000, and the quality verified with an Agilent 2100. Complementary RNA was prepared using TargetAmp Nano-g Biotin-aRNA labeling for the Illumina System (Epicentre) and hybridized to Illumina Mouse WG-6 v2.0 BeadArrays. Microarray data were normalized and analyzed using the R software limma package (25). We performed a background correction using negative controls on the raw data, applied a quantile normalization using positive controls, followed by a log2 transformation, and applied a 1% threshold on the detection P values, which led us to consider 13,314 genes as expressed. We performed ANOVA using the limma “eBayes” procedure. P values were corrected for multiple testing using the Benjamini-Hochberg method to control the false discovery rate with a 5% threshold.
Reactive Oxygen Species, DNA Oxidation, and Telomere Length Determination
Reactive oxygen species (ROS) was quantified in 30-µm epiAT sections using dihydroethidium, as previously described (15), or in isolated adipocytes using the ROS probe 2′,7′-dichlorodihydrofluorescein diacetate (H2DCFDA; 10 µmol/L). Adipocytes were recovered by centrifugation on dinonyl phthalate and resuspended in H2O2 before fluorescence measurement. DNA was prepared from snap-frozen epiAT (DNeasy Blood & Tissue Kit; Qiagen). Amounts of 8-hydroxy-2-deoxyguanosine (8-OHdG) were determined using an EIA kit (StressMarq Biosciences Inc.) following the manufacturer’s recommendations. Real-time quantitative PCR (qPCR) was used that compares the telomere repeat sequence copy number to a single copy albumin gene.
Western Blotting and Real-Time qPCR
Cells were lysed, and immunoblotting was performed, as previously described (26), using indicated antibodies. RNA preparation and real-time qPCR were performed as previously described (26). Primers were from SABiosciences (Qiagen). The PCR data were analyzed with the comparative cycle threshold (ΔΔCt) quantitation method.
Statistical Analysis
Data are expressed as the mean ± SEM. Differences among groups were compared using ANOVA with post hoc analysis for multiple comparisons and the Mann-Whitney test or Student t test when only two groups were compared. Correlation analysis was done by the Spearman test. Statistical analyses were performed using GraphPad Prism 5 software. Differences were considered significant at P < 0.05.
Results
The p53 Pathway Is Activated in Adipocytes From Obese Mice
The p21 mRNA level, a p53-target gene, was higher in epiAT and in the adipocyte fraction of the obese ob/ob mice and mice fed the HFD compared with their lean counterparts (Fig. 1A and B). The p21 mRNA level in the adipocyte fraction from ob/ob and HFD-fed mice was positively correlated to whole-body and fat pad weights and fasting glycemia (Supplementary Table 2). Expression of p53 and p21 proteins was higher in adipocytes from HFD-fed mice compared with their counterparts fed the normal chow diet (NCD) (Fig. 1C). Moreover, the number of adipocytes with a p21+ nucleus was higher in HFD-fed mice than in NCD-fed mice (61.7% ± 5.50% vs. 19.9% ± 4.04%, respectively; P < 0.01) (Fig. 1D). This supports an activation of the p53 pathway in mature obese adipocytes.

Adipocytes of obese mice exhibit activation of the p53 pathway with an increase in DNA damage and a reduction in telomere length. Level of p21 mRNA in epiAT (AT) and isolated adipocytes (Ad) of ob/ob (A) and HFD-fed mice (18 weeks of 60% kcal from fat) and their lean control littermates (NCD-fed) (n = 8 per group) (B). p21 mRNA expression was normalized using mouse Rplp0 mRNA level and expressed in arbitrary units with the control value (ob/+ or NCD-fed mice) taken as 1. C: Western blot analysis of the expression of p53 (anti-p53 #2524, Cell Signaling) and p21 (anti-p21, clone CP74, P1484, Sigma-Aldrich) in isolated adipocytes from HFD- and NCD-fed mice with tubulin (anti-tubulin T6199, Sigma-Aldrich) as the loading control. Each lane corresponds to independent preparations of adipocytes. D: Immunofluorescence analysis of p21 in the nuclei of isolated adipocytes from HFD- and NCD-fed mice. DAPI was used to visualize the nuclei. Representative images and quantification of nuclei with detectable p21 labeling in 15–20 cells per adipocyte preparation (n = 8) are shown. E: Amounts of 8-OHdG quantified in total DNA from AT of mice fed the NCD or an HFD (45% or 60% of kcal from fat; n = 8 per group). Results are expressed in picograms of oxidized 8-OHdG per microgram of AT DNA. F: Correlation between amounts of AT oxidized DNA and AT p21 mRNA expression (red dots, NCD-fed mice; blue dots, 45% HFD-fed mice; black dots, 60% HFD-fed mice). G: Relative telomere length was estimated from total DNA prepared from AT of NCD- and HFD-fed mice (n = 8 per group). Results are expressed in arbitrary units with the NCD-fed mice taken as 1. H and I: Isolated adipocytes from NCD- and HFD-fed mice (60% kcal from fat) were treated for immunofluorescence as in D. Immunodetection was performed with anti–γ-H2AX (Ser139) antibodies (Millipore 05-636), followed by anti-mouse antibodies coupled to Alexa Fluor 488. Nuclei were labeled by DAPI. The quantifications of the foci number were performed on 10–15 cells per preparation of adipocytes (n = 8 per group), and the graph represents the number of cells as a function of the foci number. Data are means ± SEM. *P < 0.05; **P < 0.01; and ***P < 0.001.
Adipocytes of obese mice exhibit activation of the p53 pathway with an increase in DNA damage and a reduction in telomere length. Level of p21 mRNA in epiAT (AT) and isolated adipocytes (Ad) of ob/ob (A) and HFD-fed mice (18 weeks of 60% kcal from fat) and their lean control littermates (NCD-fed) (n = 8 per group) (B). p21 mRNA expression was normalized using mouse Rplp0 mRNA level and expressed in arbitrary units with the control value (ob/+ or NCD-fed mice) taken as 1. C: Western blot analysis of the expression of p53 (anti-p53 #2524, Cell Signaling) and p21 (anti-p21, clone CP74, P1484, Sigma-Aldrich) in isolated adipocytes from HFD- and NCD-fed mice with tubulin (anti-tubulin T6199, Sigma-Aldrich) as the loading control. Each lane corresponds to independent preparations of adipocytes. D: Immunofluorescence analysis of p21 in the nuclei of isolated adipocytes from HFD- and NCD-fed mice. DAPI was used to visualize the nuclei. Representative images and quantification of nuclei with detectable p21 labeling in 15–20 cells per adipocyte preparation (n = 8) are shown. E: Amounts of 8-OHdG quantified in total DNA from AT of mice fed the NCD or an HFD (45% or 60% of kcal from fat; n = 8 per group). Results are expressed in picograms of oxidized 8-OHdG per microgram of AT DNA. F: Correlation between amounts of AT oxidized DNA and AT p21 mRNA expression (red dots, NCD-fed mice; blue dots, 45% HFD-fed mice; black dots, 60% HFD-fed mice). G: Relative telomere length was estimated from total DNA prepared from AT of NCD- and HFD-fed mice (n = 8 per group). Results are expressed in arbitrary units with the NCD-fed mice taken as 1. H and I: Isolated adipocytes from NCD- and HFD-fed mice (60% kcal from fat) were treated for immunofluorescence as in D. Immunodetection was performed with anti–γ-H2AX (Ser139) antibodies (Millipore 05-636), followed by anti-mouse antibodies coupled to Alexa Fluor 488. Nuclei were labeled by DAPI. The quantifications of the foci number were performed on 10–15 cells per preparation of adipocytes (n = 8 per group), and the graph represents the number of cells as a function of the foci number. Data are means ± SEM. *P < 0.05; **P < 0.01; and ***P < 0.001.
An HFD Causes DNA Damage in Adipocytes That Occurs Early Upon Obesity Onset
A main cause for p53 activation is DNA damage, such as telomere shortening and/or DNA DSBs themselves, caused by ROS-induced DNA oxidation. We found a 1.5-fold increase in 8-OHdG, a marker of oxidative DNA damage (27), in the epiAT from mice fed the HFD for 18 weeks (Fig. 1E), which positively correlated with p21 expression (Fig. 1F), suggesting a link between DNA oxidation and p53 activation. We quantified the number of adipocytes with nuclear foci containing phosphorylated histone H2AX (γ-H2AX), which positively correlates with DNA damage. The proportion of adipocytes with no γ-H2AX foci, meaning without DNA damage, was lower in HFD-fed than in NCD-fed mice (6% vs. 12%, respectively) (Fig. 1I, point 0). Furthermore, the proportion of adipocytes with high numbers of γ-H2AX foci per nucleus was increased in adipocytes from HFD-fed mice (representative image in Fig. 1H and quantification of 80–120 adipocytes per group in Fig. 1I). Moreover, we found shortened telomeres in epiAT from HFD-fed mice (Fig. 1G), and telomere length was inversely correlated with p21 expression, whole-body and fat pad weights, and fasting glycemia (Supplementary Table 2).
We next asked whether adipocyte DNA damage was an early event upon the onset of obesity by studying mice after 2 and 4 weeks of HFD feeding, which increased body weight gain, epiAT weight, and adipocyte size (Supplementary Fig. 1F–H). Using the 3DISCO method, we imaged the whole epiAT and characterized cell types with DNA damage using γ-H2AX labeling. The HFD for 2 or 4 weeks increased by two- to threefold, respectively, the number of adipocytes with γ-H2AX+ nuclei (cyan color in Fig. 2A and B). ROS amounts were concomitantly increased in epiAT and in adipocytes (Fig. 2C). DNA damage was also detected in nonadipocyte cells (white color in Fig. 2A). The expression of p53 protein and of p21 mRNA was increased, together with the expression of p16INK4A and p19ARF mRNA encoded by the CDKN2A locus, which are hallmarks of chronic DNA damage (Fig. 2D) (28). Importantly, after 2 weeks of the HFD, we did not observe features of insulin resistance of adipocytes because insulin-induced lipogenesis in isolated adipocytes (Fig. 2E) and epiAT expression of insulin receptor substrate 1 (IRS1) and adiponectin mRNA was not different compared with NCD-fed mice, whereas the Glut4 mRNA level was increased (Fig. 2F). The leptin mRNA level was increased in agreement with the increase in epiAT weight and adipocyte diameter (Fig. 2F and Supplementary Fig. 1A and B). Glucose homeostasis was not markedly altered after 2 weeks of the HFD because the IPGTT indicated similar glucose tolerance (Fig. 2G), with no difference in insulin secretion during the IPGTT in HFD-fed mice compared with NCD-fed mice (0.89 ± 0.13 ng/mL vs. 0.84 ± 0.15 ng/mL, respectively). Moreover, 2 weeks of the HFD did not modify the HOMA of insulin resistance index (Fig. 2H) or fasting and fed glycemia or insulinemia (Supplementary Fig. 1C and D). By contrast, mice developed glucose intolerance after 4 weeks of HFD feeding, with a further increase in whole-body and epiAT weights and adipocyte size as well as a trend toward a decrease in IRS1 mRNA (Supplementary Fig. 1A, B, and E–I).
![Figure 2. DNA damage in the adipocyte is an early event during obesity development. A: Representative images of cleared AT from mice fed the NCD or HFD for 2 or 4 weeks labeled with γ-H2AX antibodies (green), DAPI (blue), and phalloidin (red), together with enlarged views of the delineated regions. Images were acquired with a NikonA1 confocal microscope with a ×20 long-working-distance objective, allowing for acquisitions up to 3 mm into the tissue. A mosaic of nine images over 1 mm was randomly acquired and blindly quantified. Z-projections along the z-axis were generated, and the DAPI (blue) and phalloidin (red) images were merged to discriminate nuclei from small cells that were entirely surrounded by F-actin (purple nuclei) from nuclei of mature adipocytes (Ad) that were not surrounded by F-actin (blue nuclei). Adipocyte nuclei without DNA damage are blue (only DAPI labeling, arrows). They are cyan when DNA damage was present (merge of DAPI [blue] and γ-H2AX [green], arrowheads). Nuclei from other smaller cells without DNA damage are purple (merge of DAPI [blue] and phalloidin [red]) and are white with DNA damage (merge of DAPI [blue], γ-H2AX antibodies [green], and phalloidin [red]). B: Quantification of the number of adipocytes presenting DNA damage in their nucleus using the colocalization plug-in of Fiji. Data are expressed as the percentage of cells with DNA damage and are means ± SEM. **P < 0.01 and ***P < 0.001 HFD vs. NCD-fed mice; ###P < 0.001 HFD 4 weeks vs. HFD 2 weeks. C: Quantification of ROS using dihydroethidium (DHE) labeling on AT sections from mice fed the NCD or HFD for 2 weeks and 4 weeks (left panel), and quantification of ROS production by isolated adipocytes from mice fed the NCD or HFD for 2 weeks using the ROS probe H2DCFDA (right panel). Data are means ± SEM. *P < 0.05, **P < 0.01, and ***P < 0.001 vs. NCD-fed mice. D: Western blot analysis of the expression of p53 (n = 3 representative mice per group) (left panel), quantification of p53 protein expression in AT after NCD or HFD feeding for 2 weeks (n = 13 per group) or 4 weeks (n = 5 for NCD and n = 6 for HFD) (middle panel), and quantification of the indicated mRNA in AT after NCD or HFD feeding for 2 weeks (n = 7 mice per group) (right panel). Results are expressed relative to the NCD-fed mice. Data are means ± SEM. *P < 0.05 and **P < 0.01. E: Insulin effect on lipogenesis in isolated adipocytes from mice fed the NCD or HFD for 2 weeks (n = 6 adipocyte preparations from 6 different mice in each of the groups). Data are expressed as the fold increase over unstimulated cells. F: Quantification of the mRNA levels of the indicated genes in AT from mice fed the NCD or HFD for 2 weeks (n = 7 mice per group). Data are means ± SEM. **P < 0.01. AdipoQ, adiponectin. G: IPGTT in mice fed the NCD or HFD for 2 weeks. Area under the curve (AUC) was calculated from 0 to 120 min. H: HOMA of insulin resistance (IR) index (fasting glucose mmol/L × fasting insulin [µU/mL]/22.5) of the same mice as in G. I: Left panel, quantification by flow cytometry analysis of the numbers of F4/80+ (CD11c+ or CD11c−) and F4/80−CD11c+ cells in the SVF from mice fed the NCD or HFD for 2 weeks (n = 6 mice per group). Values represent the number ± SEM of each of the cell subtypes per gram of epididymal fat tissues. Fluorescent-coupled anti-F4/80 and CD11c were from eBioscience. Middle panel, quantification of the mRNA expression of markers of inflammation in AT of the same mice. Right panel, concentration of IL-6 and TNF-α in sera of mice fed the NCD or HFD for 2 or 18 weeks (as a positive control). iNOS, inducible nitric oxide synthase. Data are means ± SEM. *P < 0.05, **P < 0.01, and ***P < 0.01 HFD vs. NCD 2 weeks, and #P < 0.05 and ##P < 0.01 HFD 18 weeks vs. NCD 18 weeks.](https://ada.silverchair-cdn.com/ada/content_public/journal/diabetes/65/10/10.2337_db16-0014/6/m_db160014f2.jpeg?Expires=1716312027&Signature=ddQ1wh1YXeTXK6Wt8eoCSSdQh6aVLv2cKZM9ImtP9RldEzDenARTPdqIOz5Z2DEHXy8WZLoUuwQFBQcpzIAMewSXG4t0WJkSNoX7eXzOyL6XM6VdLHUmmkdJcedK7C-cE8LKOvTJa9ynBGjUrMDQRd4-Tw18hFARmH8qLk0hjIRAj6DuW8q3ZA2w4pQXsOJKj9ZKv-QXUFhmoJNWYIAP7bpp98h15z5KY1yU2u6Ee~48e2ZkBb1GVkz4hPzETnmGKTpYWQ~SR51cBmHJGApcJimYS1Y~uIHhSxc4NtTWuVcHJFOCla1AYMwuSqyqNFhLiwBu9OktrQlAk4aj6a-lyg__&Key-Pair-Id=APKAIE5G5CRDK6RD3PGA)
DNA damage in the adipocyte is an early event during obesity development. A: Representative images of cleared AT from mice fed the NCD or HFD for 2 or 4 weeks labeled with γ-H2AX antibodies (green), DAPI (blue), and phalloidin (red), together with enlarged views of the delineated regions. Images were acquired with a NikonA1 confocal microscope with a ×20 long-working-distance objective, allowing for acquisitions up to 3 mm into the tissue. A mosaic of nine images over 1 mm was randomly acquired and blindly quantified. Z-projections along the z-axis were generated, and the DAPI (blue) and phalloidin (red) images were merged to discriminate nuclei from small cells that were entirely surrounded by F-actin (purple nuclei) from nuclei of mature adipocytes (Ad) that were not surrounded by F-actin (blue nuclei). Adipocyte nuclei without DNA damage are blue (only DAPI labeling, arrows). They are cyan when DNA damage was present (merge of DAPI [blue] and γ-H2AX [green], arrowheads). Nuclei from other smaller cells without DNA damage are purple (merge of DAPI [blue] and phalloidin [red]) and are white with DNA damage (merge of DAPI [blue], γ-H2AX antibodies [green], and phalloidin [red]). B: Quantification of the number of adipocytes presenting DNA damage in their nucleus using the colocalization plug-in of Fiji. Data are expressed as the percentage of cells with DNA damage and are means ± SEM. **P < 0.01 and ***P < 0.001 HFD vs. NCD-fed mice; ###P < 0.001 HFD 4 weeks vs. HFD 2 weeks. C: Quantification of ROS using dihydroethidium (DHE) labeling on AT sections from mice fed the NCD or HFD for 2 weeks and 4 weeks (left panel), and quantification of ROS production by isolated adipocytes from mice fed the NCD or HFD for 2 weeks using the ROS probe H2DCFDA (right panel). Data are means ± SEM. *P < 0.05, **P < 0.01, and ***P < 0.001 vs. NCD-fed mice. D: Western blot analysis of the expression of p53 (n = 3 representative mice per group) (left panel), quantification of p53 protein expression in AT after NCD or HFD feeding for 2 weeks (n = 13 per group) or 4 weeks (n = 5 for NCD and n = 6 for HFD) (middle panel), and quantification of the indicated mRNA in AT after NCD or HFD feeding for 2 weeks (n = 7 mice per group) (right panel). Results are expressed relative to the NCD-fed mice. Data are means ± SEM. *P < 0.05 and **P < 0.01. E: Insulin effect on lipogenesis in isolated adipocytes from mice fed the NCD or HFD for 2 weeks (n = 6 adipocyte preparations from 6 different mice in each of the groups). Data are expressed as the fold increase over unstimulated cells. F: Quantification of the mRNA levels of the indicated genes in AT from mice fed the NCD or HFD for 2 weeks (n = 7 mice per group). Data are means ± SEM. **P < 0.01. AdipoQ, adiponectin. G: IPGTT in mice fed the NCD or HFD for 2 weeks. Area under the curve (AUC) was calculated from 0 to 120 min. H: HOMA of insulin resistance (IR) index (fasting glucose mmol/L × fasting insulin [µU/mL]/22.5) of the same mice as in G. I: Left panel, quantification by flow cytometry analysis of the numbers of F4/80+ (CD11c+ or CD11c−) and F4/80−CD11c+ cells in the SVF from mice fed the NCD or HFD for 2 weeks (n = 6 mice per group). Values represent the number ± SEM of each of the cell subtypes per gram of epididymal fat tissues. Fluorescent-coupled anti-F4/80 and CD11c were from eBioscience. Middle panel, quantification of the mRNA expression of markers of inflammation in AT of the same mice. Right panel, concentration of IL-6 and TNF-α in sera of mice fed the NCD or HFD for 2 or 18 weeks (as a positive control). iNOS, inducible nitric oxide synthase. Data are means ± SEM. *P < 0.05, **P < 0.01, and ***P < 0.01 HFD vs. NCD 2 weeks, and #P < 0.05 and ##P < 0.01 HFD 18 weeks vs. NCD 18 weeks.
DNA damage in the adipocyte is an early event during obesity development. A: Representative images of cleared AT from mice fed the NCD or HFD for 2 or 4 weeks labeled with γ-H2AX antibodies (green), DAPI (blue), and phalloidin (red), together with enlarged views of the delineated regions. Images were acquired with a NikonA1 confocal microscope with a ×20 long-working-distance objective, allowing for acquisitions up to 3 mm into the tissue. A mosaic of nine images over 1 mm was randomly acquired and blindly quantified. Z-projections along the z-axis were generated, and the DAPI (blue) and phalloidin (red) images were merged to discriminate nuclei from small cells that were entirely surrounded by F-actin (purple nuclei) from nuclei of mature adipocytes (Ad) that were not surrounded by F-actin (blue nuclei). Adipocyte nuclei without DNA damage are blue (only DAPI labeling, arrows). They are cyan when DNA damage was present (merge of DAPI [blue] and γ-H2AX [green], arrowheads). Nuclei from other smaller cells without DNA damage are purple (merge of DAPI [blue] and phalloidin [red]) and are white with DNA damage (merge of DAPI [blue], γ-H2AX antibodies [green], and phalloidin [red]). B: Quantification of the number of adipocytes presenting DNA damage in their nucleus using the colocalization plug-in of Fiji. Data are expressed as the percentage of cells with DNA damage and are means ± SEM. **P < 0.01 and ***P < 0.001 HFD vs. NCD-fed mice; ###P < 0.001 HFD 4 weeks vs. HFD 2 weeks. C: Quantification of ROS using dihydroethidium (DHE) labeling on AT sections from mice fed the NCD or HFD for 2 weeks and 4 weeks (left panel), and quantification of ROS production by isolated adipocytes from mice fed the NCD or HFD for 2 weeks using the ROS probe H2DCFDA (right panel). Data are means ± SEM. *P < 0.05, **P < 0.01, and ***P < 0.001 vs. NCD-fed mice. D: Western blot analysis of the expression of p53 (n = 3 representative mice per group) (left panel), quantification of p53 protein expression in AT after NCD or HFD feeding for 2 weeks (n = 13 per group) or 4 weeks (n = 5 for NCD and n = 6 for HFD) (middle panel), and quantification of the indicated mRNA in AT after NCD or HFD feeding for 2 weeks (n = 7 mice per group) (right panel). Results are expressed relative to the NCD-fed mice. Data are means ± SEM. *P < 0.05 and **P < 0.01. E: Insulin effect on lipogenesis in isolated adipocytes from mice fed the NCD or HFD for 2 weeks (n = 6 adipocyte preparations from 6 different mice in each of the groups). Data are expressed as the fold increase over unstimulated cells. F: Quantification of the mRNA levels of the indicated genes in AT from mice fed the NCD or HFD for 2 weeks (n = 7 mice per group). Data are means ± SEM. **P < 0.01. AdipoQ, adiponectin. G: IPGTT in mice fed the NCD or HFD for 2 weeks. Area under the curve (AUC) was calculated from 0 to 120 min. H: HOMA of insulin resistance (IR) index (fasting glucose mmol/L × fasting insulin [µU/mL]/22.5) of the same mice as in G. I: Left panel, quantification by flow cytometry analysis of the numbers of F4/80+ (CD11c+ or CD11c−) and F4/80−CD11c+ cells in the SVF from mice fed the NCD or HFD for 2 weeks (n = 6 mice per group). Values represent the number ± SEM of each of the cell subtypes per gram of epididymal fat tissues. Fluorescent-coupled anti-F4/80 and CD11c were from eBioscience. Middle panel, quantification of the mRNA expression of markers of inflammation in AT of the same mice. Right panel, concentration of IL-6 and TNF-α in sera of mice fed the NCD or HFD for 2 or 18 weeks (as a positive control). iNOS, inducible nitric oxide synthase. Data are means ± SEM. *P < 0.05, **P < 0.01, and ***P < 0.01 HFD vs. NCD 2 weeks, and #P < 0.05 and ##P < 0.01 HFD 18 weeks vs. NCD 18 weeks.
After 2 weeks of the HFD, we found in epiAT a lower inducible nitric oxide synthase–to–arginase ratio and an upregulation of the M2 marker CD206 mRNA and the chemokine (C-C motif) ligand 2 (CCL2), but we did not detect any significant differences in the number of F4/80+CD11c− macrophages or proinflammatory F4/80−CD11c+ or F4/80+CD11c+ cells (Fig. 2I), neutrophils, or T and B lymphocytes (Supplementary Fig. 1K and L). Furthermore, inflammatory gene expression in epiAT and circulating levels of interleukin 6 (IL-6) and tumor necrosis factor-α (TNF-α) in HFD-fed mice did not significantly differ compared with NCD-fed mice (Fig. 2I). By contrast, infiltration of neutrophils in epiAT was observed after 4 weeks of the HFD and was detectable until 18 weeks (Supplementary Fig. 1K and L), with a further increase in CCL2 and IL-6 mRNA and a trend toward an increase in CD11c mRNA (Supplementary Fig. 1J).
These observations support that DNA damage and p53 activation occur very early during obesity development concomitantly to an increase in adipocyte ROS but before the insulin resistance of adipocytes, the inflammation of AT, and the glucose intolerance.
DNA Damage Causes AT Inflammation and Adipocyte Insulin Resistance In Vivo
We next assessed the effect of DNA damage on AT inflammation and adipocyte function by short-term administration of the DNA-damaging drug doxorubicin in lean mice. The weight of epiAT did not differ between control and doxorubicin-administered mice (377.0 ± 31.2 mg vs. 348.3 ± 19.6 mg, respectively), but doxorubicin increased the amount of F4/80+CD11c− and F4/80+CD11c+ macrophages as well as F4/80−CD11c+ dendritic-like cells in the epiAT (Fig. 3A). Histological examination revealed an infiltration of polynuclear cells in epiAT of doxorubicin-administered mice consisting of 50% of Lys6G+ neutrophils without a difference in adipocyte size (Fig. 3B). These changes in immune cells were associated with an increase in inflammatory markers, such as p65–NF-κB phosphorylation in the SVF (Fig. 3C), TNF-α, IL-1β, and IL-6 mRNA in epiAT, adipocytes, or SVF (Fig. 3D), and with a decrease in the anti-inflammatory marker CD206 mRNA with a trend toward a decrease of IL-10 mRNA (Fig. 3D). As expected, p53 was activated in the epiAT and adipocytes of mice administered doxorubicin, as indicated by the increase in p21 (Fig. 3E). Doxorubicin decreased Glut4 mRNA and protein, IRS1 and adiponectin mRNA (Fig. 3E and F), and protein kinase B (PKB)/Akt phosphorylation in adipocytes featuring insulin resistance of adipocytes (Fig. 3F). Accordingly, insulin-induced lipogenesis was decreased in isolated adipocytes from the mice injected with doxorubicin and the circulating nonesterified fatty acid level was increased (Fig. 3F and G). These changes in adipocyte functions and AT inflammation did not markedly affect whole-body glucose metabolism because the IPGGT and insulin secretion during this test were unchanged (Fig. 3H and I).

In vivo administration of doxorubicin induces AT inflammation and adipocyte insulin resistance. Mice were injected with doxorubicin (doxo) or vehicle (ctrl; n = 6 per group) for 42 h before analysis of the AT, the adipocytes (Ad), and the SVF. A: Quantification by flow cytometry analysis of the number of F4/80+ (CD11c+ or CD11c−) and F4/80−CD11c+ cells in the SVF from control or doxorubicin-injected mice. Values represent the number ± SEM of each of the cell subtypes per gram of epididymal fat tissues. B: Frozen sections of AT were subjected to hematoxylin and eosin (H/E) coloration (top) and to immunodetection (bottom) with an FITC-coupled anti-Lys6G antibody (BioLegend), and nuclei were labeled using DAPI. A representative image from a control and a doxorubicin-injected mouse is shown. For quantification, five images per mouse were automatically captured, and the percentage of cells positive for Lys6G was determined. C: Western blot analysis of the level of phosphorylated (p)-p65–NF-κB (anti–p-p65 NF-κB #3033, Cell Signaling) in the SVF from control or doxorubicin-injected mice with Rho-GDI as the loading control (anti–Rho-GDI A20 sc-360, Santa Cruz Biotechnology). Each lane corresponds to independent mice. D and E: Relative expression of the indicated mRNAs in AT, adipocytes, and the SVF from control and doxorubicin-injected mice. The mRNA expression was normalized using mouse Rplp0 mRNA level and expressed in arbitrary units with the control mice taken as 1. AdipoQ, adiponectin. F: Left panel, insulin effect on lipogenesis in isolated adipocytes from control or doxorubicin-injected mice (n = 4 adipocyte preparations from 4 different mice in each of the groups). Data are expressed as fold over unstimulated cells. Right panel, Western blot analysis of the expression of phosphorylated PKB (anti–p-PKB Ser473 #4058, Cell Signaling), PKB (anti-PKB #9272, Cell Signaling), and Glut4 (anti-Glut4 1F8 sc-53566, Santa Cruz Biotechnology) in isolated adipocytes from control and doxorubicin-injected mice with Rho-GDI as the loading control. G: Quantification of free fatty acids (NEFA) in sera from control and doxorubicin-injected mice (NEFA FS kit, DiaSys). H: IPGTT in control and doxorubicin-injected mice. The area under the curve (AUC) was calculated from 0 to 120 min. I: Quantification of insulinemia in sera of mice before the injection of glucose and 20 min after glucose injection during the IPGTT shown in H. Data are means ± SEM. *P < 0.05, **P < 0.01, and ***P < 0.001 vs. control mice.
In vivo administration of doxorubicin induces AT inflammation and adipocyte insulin resistance. Mice were injected with doxorubicin (doxo) or vehicle (ctrl; n = 6 per group) for 42 h before analysis of the AT, the adipocytes (Ad), and the SVF. A: Quantification by flow cytometry analysis of the number of F4/80+ (CD11c+ or CD11c−) and F4/80−CD11c+ cells in the SVF from control or doxorubicin-injected mice. Values represent the number ± SEM of each of the cell subtypes per gram of epididymal fat tissues. B: Frozen sections of AT were subjected to hematoxylin and eosin (H/E) coloration (top) and to immunodetection (bottom) with an FITC-coupled anti-Lys6G antibody (BioLegend), and nuclei were labeled using DAPI. A representative image from a control and a doxorubicin-injected mouse is shown. For quantification, five images per mouse were automatically captured, and the percentage of cells positive for Lys6G was determined. C: Western blot analysis of the level of phosphorylated (p)-p65–NF-κB (anti–p-p65 NF-κB #3033, Cell Signaling) in the SVF from control or doxorubicin-injected mice with Rho-GDI as the loading control (anti–Rho-GDI A20 sc-360, Santa Cruz Biotechnology). Each lane corresponds to independent mice. D and E: Relative expression of the indicated mRNAs in AT, adipocytes, and the SVF from control and doxorubicin-injected mice. The mRNA expression was normalized using mouse Rplp0 mRNA level and expressed in arbitrary units with the control mice taken as 1. AdipoQ, adiponectin. F: Left panel, insulin effect on lipogenesis in isolated adipocytes from control or doxorubicin-injected mice (n = 4 adipocyte preparations from 4 different mice in each of the groups). Data are expressed as fold over unstimulated cells. Right panel, Western blot analysis of the expression of phosphorylated PKB (anti–p-PKB Ser473 #4058, Cell Signaling), PKB (anti-PKB #9272, Cell Signaling), and Glut4 (anti-Glut4 1F8 sc-53566, Santa Cruz Biotechnology) in isolated adipocytes from control and doxorubicin-injected mice with Rho-GDI as the loading control. G: Quantification of free fatty acids (NEFA) in sera from control and doxorubicin-injected mice (NEFA FS kit, DiaSys). H: IPGTT in control and doxorubicin-injected mice. The area under the curve (AUC) was calculated from 0 to 120 min. I: Quantification of insulinemia in sera of mice before the injection of glucose and 20 min after glucose injection during the IPGTT shown in H. Data are means ± SEM. *P < 0.05, **P < 0.01, and ***P < 0.001 vs. control mice.
Adipocyte-Mediated Macrophage Chemotaxis Is Increased by Doxorubicin-Induced DNA Damage and p53 Activation
From the above findings, we hypothesized that DNA damage and activation of p53 in adipocytes promote the secretion of chemotactic factors triggering infiltration of immune cells in AT. We thus investigated in vitro the chemotaxis activity of AdCM from adipocytes exposed to doxorubicin to induce DNA damage or to nutlin-3 to activate the p53 pathway. Features of DNA damage, such as an increased number of γ-H2AX foci and of p21 expression, stabilization, and phosphorylation of p53, were observed in 3T3-L1 adipocytes exposed to doxorubicin (Supplementary Fig. 2A–C). Nutlin-3, an inhibitor of the ubiquitin-ligase mdm2 involved in p53 degradation (29), also induced the stabilization and phosphorylation of p53 and the induction of p21 without inducing DNA damage (Supplementary Fig. 2A–C). AdCM from 3T3-L1 adipocytes exposed to doxorubicin or nutlin-3 did not increase the proinflammatory polarization of mouse RAW macrophages or human monocyte-derived macrophages (Fig. 4A and Supplementary Fig. 3A and B). Importantly, AdCM from adipocytes exposed to doxorubicin or nutlin-3 exhibited a higher chemotactic activity toward mouse macrophages or human monocyte-derived macrophages compared with AdCM from control adipocytes (Fig. 4B and C). Compared with control medium or AdCM from control adipocytes, AdCM from adipocytes exposed to doxorubicin or nutlin-3 also exhibited a higher chemotactic activity toward neutrophils, an effect that is similar or even greater (for doxorubicin exposure) than the neutrophil chemotactic factor N-formylmethionyl-leucyl-phenylalanine (Fig. 4D).

Effect of adipocytes p53 activation on macrophage activation and macrophage and neutrophil migration. A, B, and D: 3T3-L1 adipocytes were exposed for 48 h to 10 μmol/L nutlin-3 (nutlin) (Enzo Life Sciences) or for 24 h with 0.5 µg/mL doxorubicin (doxo). Then cells were thoroughly rinsed, fresh medium was added, and the AdCM were collected for the following 24 h. A: RAW-Blue macrophages were incubated with AdCM or control culture medium (M) for 24 h, and the activity of the alkaline phosphatase released in the media was quantified as the readout of RAW-Blue activation. Lipopolysaccharide (LPS) (0.5 ng/mL) was added in control medium or AdCM as a positive control for macrophage activation. Quantification of three independent experiments normalized to cells treated with control medium is shown and expressed as means ± SEM. B: Chemotaxis assay was performed with RAW 264.7 macrophages using the indicated AdCM or control M. The number of macrophages stained by crystal violet having performed chemotaxis was counted by analyzing 10 fields for each experimental condition. A typical field corresponding to each of the experimental condition is shown. Results were normalized relative to the number of macrophages attracted by the control M. Data are means ± SEM of three independent experiments. **P < 0.01 control M vs. control AdCM (AdCM from untreated adipocytes). #P < 0.05 and ###P < 0.001 AdCM from adipocytes exposed to drugs vs. control AdCM. C: Human cultured adipocytes were exposed for 48 h to 10 μmol/L nutlin-3 or for 24 h to 0.75 µg/mL doxorubicin. AdCM were collected as described above. Chemotaxis assay was performed with blood monocyte-derived macrophages using the indicated AdCM. Results were normalized relative to the number of macrophages attracted by control AdCM. Data are means ± SEM of three experiments with three AdCM collected from three independent cultures of human adipocytes with the same human monocyte-derived macrophage preparation. *P < 0.05 vs. control AdCM. D: The number of neutrophils having performed chemotaxis toward media using N-formylmethionyl-leucyl-phenylalanine (fMLP; 0.2 μmol/L), a chemotactic factor for neutrophils. AdCM of control, nutlin-3–treated, or doxorubicin-treated adipocytes was determined by quantifying the number of CD11b+Lys6G+ cells in the lower Boyden chamber by flow cytometry analysis. Top, representative flow cytometry plots for CD11b+Lys6G+ cells that migrated toward AdCM from control, nutlin-3–treated, or doxorubicin-treated cells. Bottom, quantification of the number of migrating neutrophils in chemotaxis assays performed with four independent AdCM and one white blood cell preparation. The experiment was reproduced twice. *P < 0.05, **P < 0.01, and ***P < 0.001 vs. control AdCM.
Effect of adipocytes p53 activation on macrophage activation and macrophage and neutrophil migration. A, B, and D: 3T3-L1 adipocytes were exposed for 48 h to 10 μmol/L nutlin-3 (nutlin) (Enzo Life Sciences) or for 24 h with 0.5 µg/mL doxorubicin (doxo). Then cells were thoroughly rinsed, fresh medium was added, and the AdCM were collected for the following 24 h. A: RAW-Blue macrophages were incubated with AdCM or control culture medium (M) for 24 h, and the activity of the alkaline phosphatase released in the media was quantified as the readout of RAW-Blue activation. Lipopolysaccharide (LPS) (0.5 ng/mL) was added in control medium or AdCM as a positive control for macrophage activation. Quantification of three independent experiments normalized to cells treated with control medium is shown and expressed as means ± SEM. B: Chemotaxis assay was performed with RAW 264.7 macrophages using the indicated AdCM or control M. The number of macrophages stained by crystal violet having performed chemotaxis was counted by analyzing 10 fields for each experimental condition. A typical field corresponding to each of the experimental condition is shown. Results were normalized relative to the number of macrophages attracted by the control M. Data are means ± SEM of three independent experiments. **P < 0.01 control M vs. control AdCM (AdCM from untreated adipocytes). #P < 0.05 and ###P < 0.001 AdCM from adipocytes exposed to drugs vs. control AdCM. C: Human cultured adipocytes were exposed for 48 h to 10 μmol/L nutlin-3 or for 24 h to 0.75 µg/mL doxorubicin. AdCM were collected as described above. Chemotaxis assay was performed with blood monocyte-derived macrophages using the indicated AdCM. Results were normalized relative to the number of macrophages attracted by control AdCM. Data are means ± SEM of three experiments with three AdCM collected from three independent cultures of human adipocytes with the same human monocyte-derived macrophage preparation. *P < 0.05 vs. control AdCM. D: The number of neutrophils having performed chemotaxis toward media using N-formylmethionyl-leucyl-phenylalanine (fMLP; 0.2 μmol/L), a chemotactic factor for neutrophils. AdCM of control, nutlin-3–treated, or doxorubicin-treated adipocytes was determined by quantifying the number of CD11b+Lys6G+ cells in the lower Boyden chamber by flow cytometry analysis. Top, representative flow cytometry plots for CD11b+Lys6G+ cells that migrated toward AdCM from control, nutlin-3–treated, or doxorubicin-treated cells. Bottom, quantification of the number of migrating neutrophils in chemotaxis assays performed with four independent AdCM and one white blood cell preparation. The experiment was reproduced twice. *P < 0.05, **P < 0.01, and ***P < 0.001 vs. control AdCM.
Microarray analysis of 3T3-L1 adipocytes exposed to doxorubicin or nutlin-3 revealed that among the expressed chemokines, 11 were deregulated in one or both experimental conditions (Fig. 5A). Analysis by qRT-PCR confirmed that doxorubicin and nutlin-3 increased the mRNA expression of CCL9 (a fibroblast and dendritic cells chemotactic protein), chemokine (C-X-C motif) ligand (CXCL) 1 (a neutrophil chemotactic protein), and CCL2, whereas the expression of CCL7 mRNA, another monocytic chemotactic protein, was increased by nutlin-3 only (Fig. 5B and C). Doxorubicin and nutlin-3 also induced the expression of IL-6. The silencing of p53 blocked the induction by nutlin-3 of all of these mRNAs (Fig. 5B) and partly prevented their upregulation in response to doxorubicin, except for CXCL1 (Fig. 5C). Because p53 silencing only partially reduced p53 expression and activation by doxorubicin (Supplementary Fig. 2C), we treated cells with both p53 siRNA and pifithrin-α, an inhibitor of p53 transcriptional activity. In this condition, CCL2/9, CXCL1, and IL-6 mRNA induction was prevented (Fig. 5C). Importantly, we found that the expression of mRNAs coding for CCL2/7/9 and CXCL1 was increased in epiAT from mice exposed to doxorubicin, both in the adipocyte and SVF fractions for CCL2/7 and only in the adipocyte fraction for CCL9 and CXCL1 (Fig. 5D). We also examined the expression of these chemokines at the onset of obesity when DNA damage was observed in adipocytes. The CCL2 mRNA level was increased after 2 weeks of HFD feeding (Fig. 2I), and a trend toward an increase for CCL9 mRNA was observed (Fig. 5E). The mRNA levels of all of these chemokines were significantly increased after 4 weeks of HFD feeding (Fig. 5F and Supplementary Fig. 1J).

Effect of DNA damage and p53 activation on mRNA expression of cytokines/chemokines and the implication of p53. A: 3T3-L1 adipocytes were treated with 0.5 µg/mL doxorubicin (doxo) for 24 h or 10 μmol/L nutlin-3 (nutl) for 48 h. Total RNAs were then prepared and used in gene expression profiling by microarray. The figure represents the changes in the level of expression of cytokines and chemokines between doxorubicin-treated vs. control (ctrl) adipocytes as a function of the changes in the level of expression between nutlin-treated vs. control adipocytes. Changes are expressed in log2. Only the cytokines/chemokines with an expression that changed in one or in the two experimental conditions are shown. Relative mRNA amount of the indicated chemokines/cytokines in 3T3-L1 adipocytes transfected with control siRNA (si ctrl) or p53 siRNA (si p53) and incubated without (ctrl) or with nutlin-3 (B) or doxorubicin (C). When indicated, adipocytes transfected with p53 siRNA were also treated with pifithrin-α (pif). Data (n = 3–4 independent experiments) were normalized using mouse Rplp0 mRNA level and are expressed as arbitrary units with the value of si ctrl untreated cells taken as 1 (dashed line in C). D: Relative mRNA expression of the indicated chemokines in AT, adipocyte (Ad), and SVF of control mice or doxorubicin-injected mice. The measurements were performed with the same mRNA samples as those used in Fig. 3D and E. Relative mRNA expression of the indicated chemokines in AT of mice fed the NCD or HFD for 2 weeks (E) or 4 weeks (F). The measurements were performed with the same mRNA samples as in Fig. 2F–I and Supplementary Fig. 1I–J. Data are means ± SEM. *P < 0.05, **P < 0.01, and ***P < 0.001 vs. effect in untreated si ctrl cells or in mice injected with vehicle or in NCD-fed mice. #P < 0.05 and ##P < 0.01 for drug-treated si ctrl cells vs. drug-treated si p53 cells.
Effect of DNA damage and p53 activation on mRNA expression of cytokines/chemokines and the implication of p53. A: 3T3-L1 adipocytes were treated with 0.5 µg/mL doxorubicin (doxo) for 24 h or 10 μmol/L nutlin-3 (nutl) for 48 h. Total RNAs were then prepared and used in gene expression profiling by microarray. The figure represents the changes in the level of expression of cytokines and chemokines between doxorubicin-treated vs. control (ctrl) adipocytes as a function of the changes in the level of expression between nutlin-treated vs. control adipocytes. Changes are expressed in log2. Only the cytokines/chemokines with an expression that changed in one or in the two experimental conditions are shown. Relative mRNA amount of the indicated chemokines/cytokines in 3T3-L1 adipocytes transfected with control siRNA (si ctrl) or p53 siRNA (si p53) and incubated without (ctrl) or with nutlin-3 (B) or doxorubicin (C). When indicated, adipocytes transfected with p53 siRNA were also treated with pifithrin-α (pif). Data (n = 3–4 independent experiments) were normalized using mouse Rplp0 mRNA level and are expressed as arbitrary units with the value of si ctrl untreated cells taken as 1 (dashed line in C). D: Relative mRNA expression of the indicated chemokines in AT, adipocyte (Ad), and SVF of control mice or doxorubicin-injected mice. The measurements were performed with the same mRNA samples as those used in Fig. 3D and E. Relative mRNA expression of the indicated chemokines in AT of mice fed the NCD or HFD for 2 weeks (E) or 4 weeks (F). The measurements were performed with the same mRNA samples as in Fig. 2F–I and Supplementary Fig. 1I–J. Data are means ± SEM. *P < 0.05, **P < 0.01, and ***P < 0.001 vs. effect in untreated si ctrl cells or in mice injected with vehicle or in NCD-fed mice. #P < 0.05 and ##P < 0.01 for drug-treated si ctrl cells vs. drug-treated si p53 cells.
DNA Damage and p53 Activation Inhibit Insulin Signaling and Insulin-Induced Glucose Transport and Increase Lipolysis in Adipocytes
We next assessed whether the insulin resistance of adipocytes from mice injected with doxorubicin (Fig. 3) was only the consequence of AT inflammation or might also be caused by an adipocyte cell–autonomous effect of DNA damage and p53 activation. Treatment of 3T3-L1 adipocytes with doxorubicin or nutlin-3 reduced insulin-induced glucose uptake (Fig. 6A and B) and Glut4 translocation (Fig. 6E and F) without changing Glut1 and Glut4 expression (Fig. 6C and D). Similar results were obtained in human adipocytes (Supplementary Fig. 4A and B). This effect was associated with a decrease in insulin signaling in 3T3-L1 and human adipocytes (Fig. 7A and B and Supplementary Fig. 4C and D). The insulin-induced PKB/Akt phosphorylation in 3T3-L1 adipocytes treated with doxorubicin or nutlin-3 was improved by p53 silencing, which partially reduced p53 expression (Supplementary Fig. 5A), or by treatment with pifithrin-α (not shown) and was fully restored when p53 expression and activity was reduced by using both p53 siRNA and pifithrin-α (Fig. 7D and E and Supplementary Fig. 5B). That the deleterious effects of doxorubicin and nutlin-3 involved secretory factors was unlikely because treatment of adipocytes with AdCM from 3T3-L1 adipocytes treated with doxorubicin or nutlin-3 did not alter insulin-induced PKB/Akt phosphorylation (Fig. 7C).

Inhibition of insulin-induced glucose transport and Glut4 translocation in adipocytes exposed to doxorubicin or nutlin-3. 3T3-L1 adipocytes were treated with 0.5 µg/mL doxorubicin (doxo) for 24 h or 10 μmol/L nutlin-3 (nutlin) for 48 h and stimulated with the indicated concentrations of insulin (ins) for 10 min. A and B: Measurement of deoxyglucose (DOG) uptake (n = 3 independent experiments). C and D: Representative Western blot analysis and quantification (n = 4 independent experiments) of the protein expression of the glucose transporters Glut4 (anti-Glut4 1F8, Santa Cruz Biotechnology) and Glut1 (anti-Glut1 ab652, Abcam) with tubulin (tub) as the loading control. E and F: Glut4 translocation was determined by the quantification of Glut4 amount in plasma membrane (PM) lawns. Quantification of 26 fields obtained in 2 independent experiments (top panels) and representative fields (bottom panels) are shown. Data are means ± SEM. *P < 0.05, **P < 0.01, and ***P < 0.001 untreated cells stimulated with insulin vs. drug-treated cells stimulated with insulin.
Inhibition of insulin-induced glucose transport and Glut4 translocation in adipocytes exposed to doxorubicin or nutlin-3. 3T3-L1 adipocytes were treated with 0.5 µg/mL doxorubicin (doxo) for 24 h or 10 μmol/L nutlin-3 (nutlin) for 48 h and stimulated with the indicated concentrations of insulin (ins) for 10 min. A and B: Measurement of deoxyglucose (DOG) uptake (n = 3 independent experiments). C and D: Representative Western blot analysis and quantification (n = 4 independent experiments) of the protein expression of the glucose transporters Glut4 (anti-Glut4 1F8, Santa Cruz Biotechnology) and Glut1 (anti-Glut1 ab652, Abcam) with tubulin (tub) as the loading control. E and F: Glut4 translocation was determined by the quantification of Glut4 amount in plasma membrane (PM) lawns. Quantification of 26 fields obtained in 2 independent experiments (top panels) and representative fields (bottom panels) are shown. Data are means ± SEM. *P < 0.05, **P < 0.01, and ***P < 0.001 untreated cells stimulated with insulin vs. drug-treated cells stimulated with insulin.
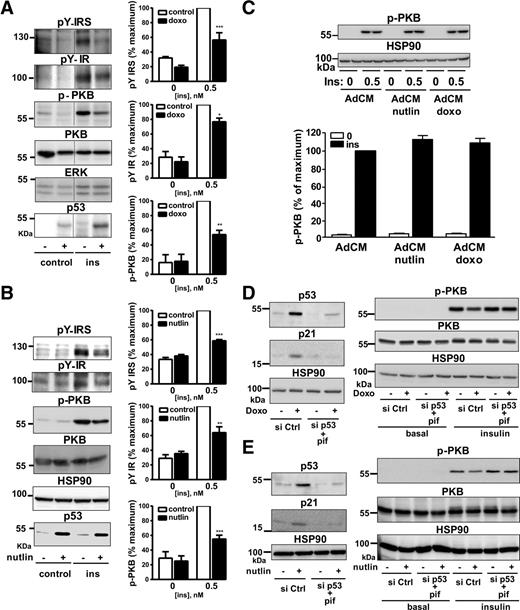
Inhibition of insulin signaling in 3T3-L1 adipocytes treated with doxorubicin or nutlin-3. 3T3-L1 adipocytes were treated with 0.5 µg/mL doxorubicin for 24 h (doxo) or 10 μmol/L nutlin-3 (nutlin) for 48 h and incubated without or with 0.5 nmol/L insulin (ins) for 10 min. A and B: Representative Western blot analysis and quantification (n = 3–4 independent experiments) of the expression of the tyrosine phosphorylated (p) (anti-PhosphoTyrosine #9411, Cell Signaling) insulin receptor (pY-IR) and IRS (pY-IRS), the pThr308-PKB (p-PKB) (anti-pThr308-PKB #4056, Cell Signaling), total PKB, and p53. Data are expressed as the percentage of insulin effect in untreated cells stimulated with insulin. Normalization was performed by quantifying extracellular signal–related kinase (ERK) (anti-ERK1/2 #4695, Cell Signaling) or HSP90 (anti-HSP90 sc-13119, Santa Cruz Biotechnology) in each of the experiments. C: 3T3-L1 adipocytes were treated for 24 h with 0.5 µg/mL doxorubicin or for 48 h with 10 μmol/L nutlin-3, and the AdCM were collected as described in Fig. 4. 3T3-L1 adipocytes were incubated with AdCM for 24 h, washed, and incubated without or with 0.5 nmol/L insulin for 10 min, before lysis for Western blot analysis of PKB phosphorylation. Representative immunoblots and quantification of three independent experiments are shown. The ratios of pThr308-PKB relative to HSP90 are expressed as the percentage of insulin effect in cells treated with control AdCM. D and E: 3T3-L1 adipocytes were transfected with control siRNA (si Ctrl) or p53 siRNA (si p53). The cells treated with p53 siRNA were also incubated with 50 μmol/L pifithrin-α (pif). Cells were incubated with 0.5 µg/mL doxorubicin for 24 h (D) or with 10 μmol/L nutlin-3 for 48 h (E). Adipocytes were then stimulated with 0.5 nmol/L insulin for 10 min. Western blot analysis of p53 and p21 expression (left panels) and pThr308-PKB and total PKB expression (right panels) with HSP90 as loading control. Representative immunoblots are shown, and quantifications are presented in Supplementary Fig. 5. Data are means ± SEM. *P < 0.05, **P < 0.01, and ***P < 0.001 untreated cells stimulated with insulin vs. drug-treated cells stimulated with insulin.
Inhibition of insulin signaling in 3T3-L1 adipocytes treated with doxorubicin or nutlin-3. 3T3-L1 adipocytes were treated with 0.5 µg/mL doxorubicin for 24 h (doxo) or 10 μmol/L nutlin-3 (nutlin) for 48 h and incubated without or with 0.5 nmol/L insulin (ins) for 10 min. A and B: Representative Western blot analysis and quantification (n = 3–4 independent experiments) of the expression of the tyrosine phosphorylated (p) (anti-PhosphoTyrosine #9411, Cell Signaling) insulin receptor (pY-IR) and IRS (pY-IRS), the pThr308-PKB (p-PKB) (anti-pThr308-PKB #4056, Cell Signaling), total PKB, and p53. Data are expressed as the percentage of insulin effect in untreated cells stimulated with insulin. Normalization was performed by quantifying extracellular signal–related kinase (ERK) (anti-ERK1/2 #4695, Cell Signaling) or HSP90 (anti-HSP90 sc-13119, Santa Cruz Biotechnology) in each of the experiments. C: 3T3-L1 adipocytes were treated for 24 h with 0.5 µg/mL doxorubicin or for 48 h with 10 μmol/L nutlin-3, and the AdCM were collected as described in Fig. 4. 3T3-L1 adipocytes were incubated with AdCM for 24 h, washed, and incubated without or with 0.5 nmol/L insulin for 10 min, before lysis for Western blot analysis of PKB phosphorylation. Representative immunoblots and quantification of three independent experiments are shown. The ratios of pThr308-PKB relative to HSP90 are expressed as the percentage of insulin effect in cells treated with control AdCM. D and E: 3T3-L1 adipocytes were transfected with control siRNA (si Ctrl) or p53 siRNA (si p53). The cells treated with p53 siRNA were also incubated with 50 μmol/L pifithrin-α (pif). Cells were incubated with 0.5 µg/mL doxorubicin for 24 h (D) or with 10 μmol/L nutlin-3 for 48 h (E). Adipocytes were then stimulated with 0.5 nmol/L insulin for 10 min. Western blot analysis of p53 and p21 expression (left panels) and pThr308-PKB and total PKB expression (right panels) with HSP90 as loading control. Representative immunoblots are shown, and quantifications are presented in Supplementary Fig. 5. Data are means ± SEM. *P < 0.05, **P < 0.01, and ***P < 0.001 untreated cells stimulated with insulin vs. drug-treated cells stimulated with insulin.
An increase in lipolysis contributes to AT inflammation and to the alteration in insulin sensitivity (30). We found that doxorubicin or nutlin-3 increased lipolysis in 3T3-L1 and human adipocytes, as evidenced by an increase in glycerol release (Fig. 8A and B and Supplementary Fig. 4E and F). The p53 silencing in 3T3-L1 adipocytes decreased by 50% the lipolysis induced by nutlin-3 (Fig. 8A). The lipolytic effect of doxorubicin was modestly but significantly reduced by p53 silencing and markedly inhibited by using both p53 siRNA and pifithrin-α (Fig. 8B). Pifithrin-α alone inhibits by 63.7% ± 6.8% and 34.8% ± 3.3% nutlin-3– and doxorubicin-induced lipolysis, respectively.

Doxorubicin and nutlin-3 stimulate lipolysis in adipocytes. Glycerol release was measured as an index of lipolysis in the medium of 3T3-L1 adipocytes transfected with control siRNA (si ctrl) or p53 siRNA (si p53) and treated with nutlin-3 (nutlin) (A) or doxorubicin (doxo) with or without pifithrin-α (pif) (B). Data are expressed as the fold increase over control cells (untreated cells transfected with si ctrl) and are presented as means ± SEM (n = 3–4 independent experiments). ***P < 0.001 untreated si ctrl cells vs. drug-treated si ctrl cells. #P < 0.05 and ##P < 0.01 drug-treated si ctrl cells vs. drug-treated si p53 cells. C: 3T3-L1 adipocytes were treated with 0.5 µg/mL doxorubicin for 24 h or with 10 μmol/L nutlin-3 for 48 h. Total RNA were then prepared and used in gene expression profiling. The figure represents the changes in the level of expression of genes involved in lipolysis between doxorubicin-treated vs. control adipocytes as a function of the changes in the level of expression between nutlin-3–treated vs. control adipocytes. Changes are expressed in log2. The name of genes downregulated in both doxorubicin- and nutlin-3–treated adipocytes are indicated. D: Representative Western blot and quantification (n = 3 independent experiments) of the expression of perilipin 1 (PLN1) gene using an anti–perilipin 1 antibody (D418, Cell Signaling) with HSP90 as the loading control. Data are means ± SEM. *P < 0.05 nutlin-3– or doxorubicin-treated cells vs. control.
Doxorubicin and nutlin-3 stimulate lipolysis in adipocytes. Glycerol release was measured as an index of lipolysis in the medium of 3T3-L1 adipocytes transfected with control siRNA (si ctrl) or p53 siRNA (si p53) and treated with nutlin-3 (nutlin) (A) or doxorubicin (doxo) with or without pifithrin-α (pif) (B). Data are expressed as the fold increase over control cells (untreated cells transfected with si ctrl) and are presented as means ± SEM (n = 3–4 independent experiments). ***P < 0.001 untreated si ctrl cells vs. drug-treated si ctrl cells. #P < 0.05 and ##P < 0.01 drug-treated si ctrl cells vs. drug-treated si p53 cells. C: 3T3-L1 adipocytes were treated with 0.5 µg/mL doxorubicin for 24 h or with 10 μmol/L nutlin-3 for 48 h. Total RNA were then prepared and used in gene expression profiling. The figure represents the changes in the level of expression of genes involved in lipolysis between doxorubicin-treated vs. control adipocytes as a function of the changes in the level of expression between nutlin-3–treated vs. control adipocytes. Changes are expressed in log2. The name of genes downregulated in both doxorubicin- and nutlin-3–treated adipocytes are indicated. D: Representative Western blot and quantification (n = 3 independent experiments) of the expression of perilipin 1 (PLN1) gene using an anti–perilipin 1 antibody (D418, Cell Signaling) with HSP90 as the loading control. Data are means ± SEM. *P < 0.05 nutlin-3– or doxorubicin-treated cells vs. control.
To further explore the mechanisms of the lipolytic effect of DNA damage and p53 activation, we examined the expression of lipolytic enzymes and/or of lipid droplet components. Microarray analysis revealed that the genes involved in the maintenance of lipid droplet integrity and repression of basal lipolysis, such as PLIN1 (coding for perilipin 1) and CIDEC (31,32), were downregulated in both doxorubicin- or nutlin-3–treated 3T3-L1 adipocytes (Fig. 8C). The protein level of perilipin 1 was decreased in adipocytes treated with doxorubicin or nutlin-3 (Fig. 8D).
Discussion
Previous studies have reported an upregulation of the p53 pathway in AT of obese rodents and patients (14,15,33), but the causes of p53 activation in obese adipocytes and its consequences on adipocyte metabolism remain ill defined. Here, we show with several image-based approaches an increase in DNA damage in adipocytes not only when obesity was established but also early after the onset of obesity, before alterations in adipocyte insulin sensitivity and whole-body glucose homeostasis. In addition to adipocytes, DNA damage also occurred in other cell types that remain to be characterized. Some of them aligned in branched actin-rich structures could be endothelial cells in which p53 was activated in obesity (34). Taking into account the high number of γ-H2AX foci per nuclei compared with the telomere number in the adipocytes from mice with installed obesity, it is likely that both DSBs and telomere shortening occurred. DNA damage may thus contribute to the p53 stabilization and p21 upregulation we observed in adipocytes from HFD-fed mice. Of note, those adipocytes were not apoptotic, possibly because the induction of p21 protected them from apoptosis (35).
What could be the cause of adipocyte DNA damage? DNA is sensitive to damage induced by oxidative stress, and we indeed detected an increase in the 8-OHdG level, the most common oxidative DNA lesions (36), in AT from obese mice. These oxidative DNA lesions may contribute to p53 activation in obese adipocytes because we found a positive correlation between 8-OHdG amounts and the expression of the p53-target p21. In installed obesity, adipocytes and proinflammatory macrophages may both contribute to the increase in ROS production (37,38) that could induce DNA damage in adipocytes and other AT cells. However, we also observed DNA damage and ROS in adipocytes at the onset of obesity, before any increase in proinflammatory macrophages or proinflammatory cytokines and before alterations in whole-body glucose homeostasis and adipocyte insulin sensitivity. This increase in ROS may induce DNA damage and, consequently, activation of the DDR known to induce the innate inflammatory response (39) and, thus, could be causal factors in obese AT inflammation and adipocyte dysfunctions.
Such a link between adipocyte DNA damage, AT inflammation, and insulin resistance of adipocytes is supported by the increased amount of proinflammatory immune cells in the AT and the adipocyte insulin resistance of lean mice injected with the DNA damage–inducing drug doxorubicin. Our data argue that these changes in AT immune cells are the consequence of p53-dependent secretion of chemokines induced by DNA damage in the adipocytes. Importantly, the changes in populations of immune cells and in chemokine expression in AT of doxorubicin-injected mice is at least qualitatively consistent with those described in obesity (40,41). Therefore, DNA damage in adipocytes may trigger recruitment of macrophages and neutrophils within AT through the p53-dependent production of several chemokines. Because the secretome from adipocytes exposed in vitro to doxorubicin did not promote macrophage polarization, the increase in proinflammatory macrophages in AT from mice administered doxorubicin would be caused by DNA damage in other cell types or by the vicious cycle that takes place between adipocytes and macrophages leading to macrophage activation (42). Also, other adipocyte p53-dependent mechanisms could contribute to AT inflammation during obesity (43).
Hence, DNA damage by increasing AT inflammation may promote adipocyte insulin resistance and dysfunction. However, DNA damage may also trigger adipocyte insulin resistance independently of AT inflammation because inducing DNA damage in cultured adipocytes decreased insulin signaling and uptake of glucose and increased lipolysis. This is not caused by a paracrine action of adipocyte-secreted factors. It is thus plausible that the DDR, mainly through p53 activation, promotes the transcription of proteins downregulating insulin signaling that remains to be identified; however, mitogen-activated protein kinases were not likely involved because they were not activated in our settings (data not shown). From our findings it is tempting to speculate that DNA damage, by altering adipocyte functions, contributes to systemic insulin resistance. Indeed, by decreasing glucose flux, DNA damage may reduce de novo lipogenesis, and such a decrease is associated with reduced insulin sensitivity (44–46), whereas DNA damage increases lipolysis, which is positively correlated with insulin resistance (30).
In summary, our study shows that DNA damage occurs early in the adipocytes at the onset of obesity and before the development of AT inflammation and adipocyte insulin resistance. DNA damage in adipocytes may be thus causal in the dysfunction and inflammation of AT (Supplementary Fig. 6). Pharmacological or nutritional strategies preventing DNA damage in adipocytes may thus be beneficial for the metabolic complications of obesity.
J.-F.T. and M.C. are co–senior authors.
Article Information
Acknowledgments. The authors thank the animal facility staff for animal care and breeding, Damien Alcor, head of the Cell Imaging core facility (INSERM UMR 1065, C3M, Nice, France), and also Prof. Marino Zerial and Dr. Yannis Lalaiszidis (Max Planck Institute of Molecular Cell Biology and Genetics, Dresden, Germany) for the free access to the motion-tracking software developed in Prof. Zerial’s laboratory.
Funding. This work was supported by INSERM, the Université Côte d'Azur, and by grants from the European Foundation for the Study of Diabetes (EFSD/Lilly), SFD-Abbott, Aviesan/AstraZeneca (Diabetes and the Vessel Wall Injury Program), and the French National Research Agency (ANR) through “Investments for the Future” Labex SIGNALIFE (grant ANR-11-LABX-0028-01). Light microscopy was performed at the C3M Imaging core facility (part of the Microscopy and Imaging platform Côte d’Azur IBISA). The Nikon A1R-FLIM microscope used for this study was funded thanks to Conseil Général Alpes-Maritimes (“Appel à Projets Santé”) and by Région Provence-Alpes-Côte d'Azur (PACA) (“Appel à Projets Plateforme”). The UMR 8199 Genotyping and Expression platform (Lille, France) belongs to the “Federation de Recherche” 3508 funded by Labex EGID (European Genomics Institute for Diabetes, ANR-10-LABX-46) and by the ANR Equipex 2010 session (ANR-10-EQPX-07-01, “LIGAN-PM”). The LIGAN-PM Genomics platform (Lille, France) is also supported by the Fonds Européen de Développement Régional (FEDR) and the Region Nord-Pas-de-Calais-Picardie. B.V. and P.-J.C. were supported by the French Ministry of Education and Research. J.G. was supported by a fellowship (postdoctoral grant) from the “Fondation pour la Recherche Médicale.” F.C. was supported by a fellowship from INSERM/Région PACA/FEDER (PhD grant) and by a grant from the Société Francophone du Diabète (SFD/Abbott). G.B. was supported by the Labex SIGNALIFE grant (ANR-11-LABX-0028-01). J.-F.T. is an investigator of the CNRS.
Duality of Interest. No potential conflicts of interest relevant to this article were reported.
Author Contributions. B.V. and P.-J.C. designed and performed most of the experiments, analyzed the data, and reviewed the manuscript. J.G. was involved in the researching of the data, contributed to discussion, and reviewed and edited the manuscript. M.D., C.G., and T.G. performed experiments. F.C. performed RAW-Blue macrophage experiments. A.J. and P.A. were involved in the design and the realization of the experiments with human-derived macrophages. G.B. performed the chemotaxis assay with neutrophils. J.M., V.D., M.V., and P.F. generated and analyzed microarray data. J.-F.T. contributed to data analysis and to the discussion and wrote the manuscript. M.C. designed the study, was involved in data analysis, and wrote the manuscript. M.C. is the guarantor of this work and, as such, had full access to all the data in the study and takes full responsibility for the integrity of the data, the accuracy of the data analysis, and for the decision to submit for publication.