


We investigated the association of the levels of ketone bodies (KBs) with hyperglycemia and with 62 genetic risk variants regulating glucose levels or type 2 diabetes in the population-based Metabolic Syndrome in Men (METSIM) study, including 9,398 Finnish men without diabetes or newly diagnosed type 2 diabetes. Increasing fasting and 2-h plasma glucose levels were associated with elevated levels of acetoacetate (AcAc) and β-hydroxybutyrate (BHB). AcAc and BHB predicted an increase in the glucose area under the curve in an oral glucose tolerance test, and AcAc predicted the conversion to type 2 diabetes in a 5-year follow-up of the METSIM cohort. Impaired insulin secretion, but not insulin resistance, explained these findings. Of the 62 single nucleotide polymorphisms associated with the risk of type 2 diabetes or hyperglycemia, the glucose-increasing C allele of GCKR significantly associated with elevated levels of fasting BHB levels. Adipose tissue mRNA expression levels of genes involved in ketolysis were significantly associated with insulin sensitivity (Matsuda index). In conclusion, high levels of KBs predicted subsequent worsening of hyperglycemia, and a common variant of GCKR was significantly associated with BHB levels.
Ketone bodies (KBs) serve as an important alternative source of energy in the fasting state. The circulating levels of KBs in the blood are determined by the balance of their rates of production (ketogenesis) and utilization (ketolysis). Ketogenesis includes the conversion of free fatty acids (FFAs) into two major KBs, β-hydroxybutyrate (BHB) and acetoacetate (AcAc). KBs undergo ketolysis in the extrahepatic tissues producing energy (1).
Ketogenesis takes place in the liver and is accelerated by elevated concentrations of FFAs released from the adipose tissue, which is the major source of KBs (2). Insulin plays a central role in the regulation of KB levels. Low levels of insulin increase the rate of ketogenesis, and high levels of insulin suppress the rate of ketogenesis. Elevated insulin levels induce KB clearance via increased KB metabolism in extrahepatic tissues (3). Insulin-resistant obese individuals have a similar sensitivity for insulin-mediated suppression of ketogenesis as do lean individuals (4). Insulin also inhibits ketogenesis by preventing the breakdown of triglycerides into FFAs and glycerol (1,5).
The circulating levels of KBs vary between individuals with normal and abnormal glucose tolerance. In diabetic ketoacidosis attributable to low insulin secretion, KB levels are very high, whereas in people with normal glucose tolerance (NGT), the levels of KBs are usually low (5–7). Several small studies have found that levels of KBs are relatively high in patients with type 2 diabetes (6,8), but it is not known how KBs vary across the entire range of glucose tolerance. Infusion of KBs into fasting dogs induced hypoglycemia, but when hyperglycemia (9–10 mmol/L) was established by the constant infusion of glucose, AcAc and BHB promoted hyperglycemia (9). Thus, the effects of KBs on glucose metabolism seem to depend on the fasting state and on glucose levels. The underlying mechanisms by which KBs regulate glycemia remain unclear. Conflicting evidence has been published on the association of KBs with insulin sensitivity as elevated KB levels have been associated with insulin resistance in some studies (10–12) and insulin sensitivity in others (13). Similarly, KBs have stimulated acute insulin secretion in some studies (14–17), whereas other studies report increased KB levels associated with decreased insulin secretion (18–20). Furthermore, very little is known with regards to the genetic variants regulating KB metabolism.
The purpose of our study was to investigate 1) the association of KB levels with fasting and 2-h glucose levels across the entire range of glucose tolerance, 2) the association of KB levels with insulin secretion and insulin sensitivity, 3) the role of KB levels as predictors of the worsening of hyperglycemia or type 2 diabetes, 4) the association of single nucleotide polymorphisms (SNPs) regulating glucose levels or type 2 diabetes with KB levels, and 5) the association of adipose tissue mRNA expression of genes involved in KB metabolism with insulin sensitivity.
RESEARCH DESIGN AND METHODS
Subjects.
The study included 9,398 nondiabetic or newly diagnosed type 2 diabetic men from the population-based Metabolic Syndrome in Men (METSIM) study. The study protocol has been previously explained (21). Glucose tolerance was classified according to the American Diabetes Association criteria (22). Among participants, 3,034 (32.3%) had NGT, 4,344 (46.2%) had isolated impaired fasting glucose (IFG), 312 (3.3%) had isolated impaired glucose tolerance (IGT), 1,059 (11.3%) had both IFG and IGT, and 649 (6.9%) had a new type 2 diabetes. Individuals with previously diagnosed type 1 or type 2 diabetes were excluded, and none of the participants were on antidiabetic medication.
Nondiabetic subjects (n = 4,335) from the original METSIM cohort of 10,197 men have been reexamined (mean follow-up time of 5 years); 4,059 were nondiabetic and 276 had new type 2 diabetes at follow-up. Characteristics of the subjects included in the baseline and follow-up studies are given in Supplementary Table 1. The study was approved by the ethics committee of the University of Eastern Finland and Kuopio University Hospital and was conducted in accordance with the Helsinki Declaration. All study participants gave written informed consent.
Anthropometric measurements.
Height, weight, hip, and waist circumference were measured as previously described (21). BMI was calculated as weight (kg) divided by height (m) squared.
Oral glucose tolerance test.
A 2-h oral glucose tolerance test (75 g of glucose) was performed, and samples for plasma glucose and insulin were drawn at 0, 30, and 120 min.
Laboratory measurements.
Plasma glucose was measured by enzymatic hexokinase photometric assay (Konelab Systems Reagents; Thermo Fischer Scientific, Vantaa, Finland). Insulin was determined by immunoassay (ADVIA Centaur Insulin IRI no. 02230141; Siemens Medical Solutions Diagnostics, Tarrytown, NY). Proton nuclear magnetic resonance (NMR) spectroscopy was used to measure fasting AcAc and BHB levels (mmol/L) in serum samples (the mean storage time of 2.5 years). NMR methods have been previously described in detail (23). The fasting serum samples collected at the baseline study were stored at −80°C and thawed overnight in a refrigerator prior to sample preparation. Aliquots of each sample (300 μL) were mixed with 300 μL sodium phosphate buffer.
Calculations.
The trapezoidal method was used to calculate the glucose and insulin areas under the curve (AUCs) in an oral glucose tolerance test based on samples collected at 0, 30, and 120 min. Evaluation of insulin sensitivity (Matsuda ISI) and insulin secretion (InsAUC0–30/GlucAUC0–30) has been previously described (21,24).
Genotyping.
Genotyping of 62 SNPs associated with the risk of type 2 diabetes or hyperglycemia (25–28) was primarily based on Illumina HumanExome-12v1_A Beadchip, which includes 247,870 markers focusing on protein-altering variants selected from >12,000 exome and genome sequences representing multiple ethnicities and complex traits, as previously described in detail (29). SNPs that were not available from the exome array were genotyped using either the Applied Biosystems TaqMan Allelic Discrimination Assay (rs10423928, rs231362) or Sequenom iPlex Gold SBE assay (rs12779790, rs10811661, rs1111875, rs2612067, rs2283228, rs10923931, and rs10010131). TaqMan genotyping call rate was 100% and discordance rate was 0% among 4.5% DNA samples genotyped in duplicate. Sequenom iPlex call rate was >96.9% and discordance rate was 0% among 4.2% DNA samples genotyped in duplicate in METSIM study participants. The concordance rates between genotyping methods were as follows: Sequenom vs. Taqman 99.3% (based on >10,000 genotype comparisons), Sequenom vs. ExomeChip 99.5% (based on >30,000 genotype comparisons), and Taqman vs. ExomeChip 99.3% (based on >100,000 genotype comparisons). All SNPs were in Hardy-Weinberg equilibrium at the significance level corrected for multiple testing by the Bonferroni method (P < 0.0012).
Gene expression analysis.
Subcutaneous fat biopsy samples (n = 200) were obtained from a random sample of the participants of the METSIM baseline study (age 55.6 ± 4.9 years; BMI 26.6 ± 3.3 kg/m2). Total RNA was isolated from these samples using Qiagen miRNeasy Kit according to the manufacturer’s instructions. RNA integrity number values were assessed with the Agilent Bioanalyzer 2100. High-quality samples (RNA integrity number >7.0) were used for transcriptional profiling with the Illumina Human HT-12 v3 Expression BeadChip. Genome Studio software (2010.v3) was used to obtain fluorescent intensities. The HT-12 BeadChip contains 48,804 expression and 786 control probes. Expression data from 19,306 probes were removed because of 1) failure of the probe to align to a genomic or transcriptomic location, 2) alignment of the probe to multiple genomic or transcriptomic locations, or 3) presence of SNPs in the probe sequence that may affect hybridization efficiency as determined by the methodology developed by Barbosa-Morais et al. (30). The remaining 29,497 probes were processed using nonparametric background correction, followed by quantile normalization with control and expression probes using the neqc function in the limma package (R v2.13.0) (31). The 16,223 probes with detection P values <0.01 in any of the 200 samples were used for further analysis. Gene expression data have been deposited to Gene Expression Omnibus (GEO) with the accession number GSE32512.
Statistical analysis.
Statistical analyses were conducted using SPSS version 19 (SPSS, Chicago, IL). All traits except age were log-transformed to correct for their skewed distributions. We used the linear regression model to evaluate fasting KBs as predictors for glucose AUC at 5-year follow-up. Logistic regression analysis was used to assess the association between KBs and incident type 2 diabetes. Quintiles of insulin sensitivity and insulin secretion across the categories of glucose tolerance were compared with the ANOVA (P < 0.0125 was considered as statistically significant given four tests for two KBs and two glucose tolerance categories). Unstandardized effect sizes (B [SE]) per copy of the risk alleles of the SNPs investigated were estimated by linear regression analysis using untransformed dependent variables, and percentage of B from the mean values of KBs was calculated. After the Bonferroni correction for multiple testing (for 124 tests given the 62 SNPs and two traits), P < 4.0 ×10⁻⁴ was considered as statistically significant. For both AcAc and BHB, we had ≥80% power to detect changes (P < 0.05) in the mean trait values from 0.76 to 4.47% per one copy of the risk allele (risk allele frequencies ranging from 0.05 to 0.5). We correlated adipose tissue mRNA expression of major enzymes involved in the synthesis and degradation of KBs (KEGG pathway hsa00072) with insulin sensitivity and insulin secretion (Supplementary Fig. 1). In total, there were nine enzymes in the pathway, namely, ACAT1, ACAT2, OXCT1, OXCT2, BDH1, BDH2, HMGCS1, HMGCS2, and HMGCL. Additionally, the genes encoding the enzymes CPT1A and CPT2 involved in the fatty acid metabolism (KEGG pathway hsa00071) and ACSS2 gene encoding the enzyme involved in the activation of acetate to acetyl-coA were included. Among these genes, expression data were either not available or filtered for ACAT2, OXCT2, BDH2, and HMGCL.
RESULTS
Levels of KBs across the categories of glucose tolerance.
We evaluated the association of AcAc and BHB in nondiabetic individuals and individuals with newly diagnosed type 2 diabetes in the fasting plasma glucose (FPG) and 2-h plasma glucose (2hPG) categories (Fig. 1). FPG ≤5.4 mmol/L and 2hPG ≤5.9 mmol/L were set as the reference categories. In the FPG category, AcAc levels decreased significantly (P < 0.01) in individuals with IFG by −2% (95% CI −4 to −0) and increased significantly (P < 0.01) in individuals with newly detected diabetes by +64% (+16 to +109), as compared with the reference category. BHB level decreased significantly (P < 0.01) in subjects with IFG by −5% (−7 to −3) and increased significantly (P < 0.01) in the diabetic range by +99% (+6 to +186). In the 2hPG category, AcAc level increased significantly (P < 0.01) in subjects with IGT by +21% (+13 to +28) as well as in newly diagnosed diabetes by +29% (+16 to +42), as compared with the reference category. BHB level increased nominally in IGT (P < 0.05) by +12% (+4 to +20) and in newly diagnosed type 2 diabetes (P < 0.01) by +52% (+23 to +79), as compared with the reference category. Fasting AcAc and BHB levels correlated significantly with FPG (r = −0.051, P = 1.9 × 10⁻⁶, and r = −0.065, P = 1.4 × 10⁻⁹, respectively) and 2hPG levels (r = 0.079, P = 1.4 × 10⁻¹³, and r = 0.042, P = 9.2 × 10⁻⁵, respectively).
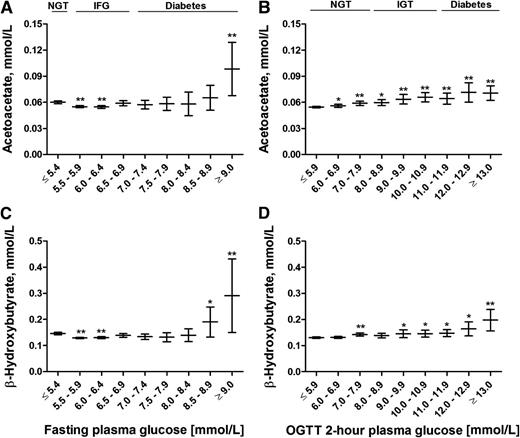
Mean values and their 95% CIs of fasting levels of AcAc (A and B) and BHB (C and D) across the fasting and 2-h glucose categories. P values (from ANOVA post hoc tests) indicate statistical significance with respect to the reference category (FPG ≤5.4 mmol/L and 2hPG ≤5.9 mmol/L). *P < 0.05; **P < 0.01. OGTT, oral glucose tolerance test.
Mean values and their 95% CIs of fasting levels of AcAc (A and B) and BHB (C and D) across the fasting and 2-h glucose categories. P values (from ANOVA post hoc tests) indicate statistical significance with respect to the reference category (FPG ≤5.4 mmol/L and 2hPG ≤5.9 mmol/L). *P < 0.05; **P < 0.01. OGTT, oral glucose tolerance test.
KBs and the risk of hyperglycemia and incident diabetes.
Follow-up data of 4,335 participants were available from the ongoing prospective METSIM 5-year follow-up study. A total of 276 participants developed incident diabetes between the baseline and follow-up studies (follow-up of 5 years). Most of the participants who developed new diabetes on the basis of FPG level (62 of 70 participants) had their FPG in the range of 7.0–7.5 mmol/L, and most of the participants who developed new diabetes on the basis of 2hPG had their 2hPG level (52 of 80 participants) in the range of 11.1–12.0 mmol/L. AcAc and BHB levels adjusted for confounding factors known to increase the risk of diabetes (age, BMI, smoking, and physical activity) predicted an increase in glucose AUC evaluated as a continuous variable at follow-up (P = 2.3 × 10⁻⁴ and P = 5.7 × 10⁻⁶, respectively), and quite similar results were obtained for the comparison of the highest quartile of glucose AUC versus the three lowest quartiles of glucose AUC (P = 7.9 × 10⁻⁸ and P = 3.4 × 10⁻⁶, respectively) (Table 1). After further adjustment for baseline glucose AUC, the associations lost their statistical significance. The highest quartile of AcAc adjusted for age, BMI, smoking, and physical activity predicted conversion to type 2 diabetes (odds ratio [OR] 1.32 [95% CI 1.00–1.74], P = 0.047) (Table 2), and also after further adjustment for FPG (OR 1.41 [1.06–1.89], P = 0.019). Adjustment for 2hPG, instead of FPG, abolished statistical significance (P = 0.423). When analyzed in glucose tolerance categories, AcAc predicted incident diabetes in individuals with IFG (OR 1.49 [1.12–1.99], P = 0.007) after the adjustment for confounding factors.
Association of baseline levels of fasting AcAc and BHB as predictors of glucose AUC at 5-year follow-up

Association of baseline levels of fasting AcAc and BHB (highest quartile vs. the three lowest quartiles) with incident type 2 diabetes during 5-year follow-up

Additional adjustment for insulin sensitivity strengthened the association of KBs with development of hyperglycemia and conversion to type 2 diabetes, whereas insulin secretion weakened/abolished these associations (Supplementary Table 2).
Levels of KBs across the quintiles of insulin sensitivity and insulin secretion.
To study the mechanisms by which KBs could be linked to hyperglycemia, we investigated their association with insulin sensitivity and insulin secretion in nondiabetic individuals. The levels of AcAc and BHB increased significantly (P < 0.01) in the highest quintile of Matsuda ISI up to 29 and 41%, respectively (Fig. 2). AcAc and BHB levels decreased significantly (P < 0.01) by −23 and −29%, respectively, in the highest quintile of insulin secretion (adjusted for insulin sensitivity) compared with the lowest quintile. In a multivariate linear regression model including insulin sensitivity and insulin secretion as independent variables, insulin sensitivity remained inversely associated with AcAc (P < 1.0 × 10⁻¹⁹) and BHB levels (P < 1.0 × 10⁻²²).
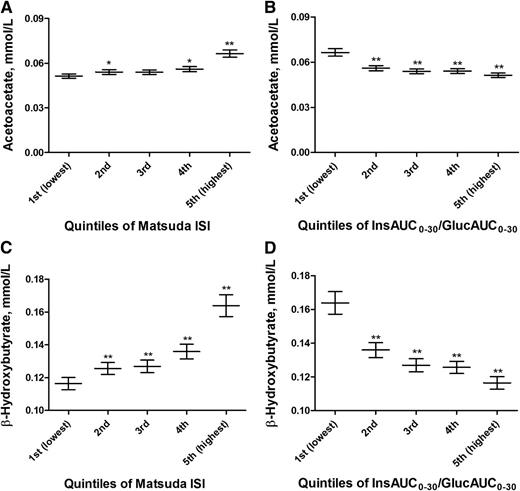
Mean values and their 95% CIs of fasting levels of AcAc and BHB across the quintiles of Matsuda ISI (A and C) and Matsuda ISI–adjusted InsAUC0–30/GlucAUC0–30 (B and D) in nondiabetic subjects. P values (from ANOVA post hoc tests) indicate statistical significance with respect to the reference category (first lowest quintiles). *P < 0.05; **P < 0.01. Quintiles of Matsuda ISI (A and C): first (lowest) (≤3.130), second (3.131–4.857), third (4.858–6.808), fourth (6.809–9.621), and fifth (highest) (≥9.622). Quintiles of Matsuda ISI–adjusted InsAUC0–30/GlucAUC0–30 (B and D): first (lowest) (≤22.439), second (22.440–30.243), third (30.244–35.655), fourth (35.656–40.445), and fifth (highest) (≥40.446).
Mean values and their 95% CIs of fasting levels of AcAc and BHB across the quintiles of Matsuda ISI (A and C) and Matsuda ISI–adjusted InsAUC0–30/GlucAUC0–30 (B and D) in nondiabetic subjects. P values (from ANOVA post hoc tests) indicate statistical significance with respect to the reference category (first lowest quintiles). *P < 0.05; **P < 0.01. Quintiles of Matsuda ISI (A and C): first (lowest) (≤3.130), second (3.131–4.857), third (4.858–6.808), fourth (6.809–9.621), and fifth (highest) (≥9.622). Quintiles of Matsuda ISI–adjusted InsAUC0–30/GlucAUC0–30 (B and D): first (lowest) (≤22.439), second (22.440–30.243), third (30.244–35.655), fourth (35.656–40.445), and fifth (highest) (≥40.446).
Association of risk SNPs for type 2 diabetes or hyperglycemia with the levels of KBs.
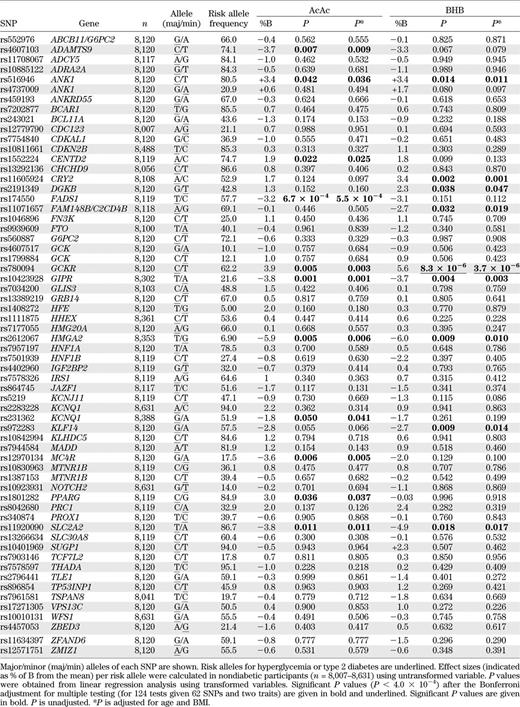
Associations of 62 risk SNPs for type 2 diabetes or hyperglycemia with KB levels are shown in Table 3. After correction for multiple testing (threshold of statistical significance, P < 4.0 × 10⁻⁴), the glucose-increasing C allele of rs780094 of GCKR showed a significant association with elevated levels of BHB (effect size +5.6% per the C allele, P = 3.7 × 10⁻⁶ after adjusting for age and BMI) and a nominally significant association with AcAc (+3.9%, P = 0.003). Additionally, there were nominally significant associations for SNPs of FADS1, ANK1, GIPR, HMGA2, and SLC2A2 with the levels of AcAc or BHB or both (Table 3).
Gene expression of genes involved in KB metabolism.
Correlations of adipose tissue mRNA expression with the most important genes regulating FFA oxidation, ketogenesis, and ketolysis are shown in Table 4. Pearson correlation of fasting FFAs with AcAc was 0.483 (P < 0.001) and with BHB was 0.443 (P < 0.001) in nondiabetic METSIM participants, and therefore genes regulating FFA metabolism were included in statistical analyses. Adipose tissue mRNA expression of the gene encoding CPT1A (carnitine palmitoyltransferase 1A) was positively correlated with glucose AUC and inversely with Matsuda ISI. This enzyme regulates the binding of carnitine to long-chain fatty acids, allowing them to be transported to the mitochondria for FFA oxidation. Expression of genes regulating ketogenesis, HMGCS1 (3-hydroxy-3-methylglutaryl-CoA synthase 1, soluble) and HMGCS2 (3-hydroxy-3-methylglutaryl-CoA synthase 2, mitochondrial), did not correlate significantly with glucose AUC, insulin sensitivity, or insulin secretion. In contrast, significant correlations were found with adipose tissue mRNA expression levels of several genes associated with ketolysis with glucose metabolism parameters. Of these genes, ACAT1 expression had the most significant correlations with glucose AUC (r = −0.314, P = 6.1 × 10⁻⁶), Matsuda ISI (r = 0.479, P = 7.1 × 10⁻¹³), and insulin secretion (r = −0.444, P = 7.0 × 10⁻¹¹). ACAT1 encodes acetyl-CoA acetyltransferase 1, an enzyme responsible for the last step in KB breakdown where two molecules of acetyl-CoA are generated from acetoacetyl-CoA (Supplementary Fig. 1). Similarly, expression of other genes regulating ketolysis, BDH1 (BHB dehydrogenase, type 1), OXCT1 (3-oxoacid CoA transferase 1), and ACSS2 (acyl-CoA synthetase short-chain family member 2), was inversely correlated with glucose AUC and insulin secretion and positively correlated with Matsuda ISI. Adipose tissue mRNA expression of ketolysis genes did not correlate with the levels of KBs (all correlations <0.10, P = NS).

DISCUSSION
In this population-based cross-sectional study of 9,398 men with prospective 5-year follow-up data on 4,335 men, we evaluated the relationship between the levels of KBs and hyperglycemia, the levels of KBs as risk markers for incident type 2 diabetes, and the mechanisms explaining these associations. Our study reports several novel findings: 1) KB levels increased in participants with IGT and type 2 diabetes at baseline, 2) KBs predicted the worsening of hyperglycemia and incident type 2 diabetes in a 5-year follow-up, 3) the association of KBs with the worsening of hyperglycemia was attributable to impaired insulin secretion, and not to insulin resistance, 4) of the 62 risk variants for type 2 diabetes or hyperglycemia, the glucose-increasing major C allele of rs780094 of GCKR was associated significantly with elevated BHB levels, and 5) adipocyte RNA expression of several key enzymes involved in ketolysis correlated inversely with glycemia and insulin secretion and positively with insulin sensitivity.
KBs and hyperglycemia.
High levels of KBs have been observed in individuals with diabetes (6,8,32), but there is no previous information about KB levels in the nondiabetic glucose range. In our study, the levels of AcAc and BHB were slightly decreased in subjects with IFG, but increased in the diabetic range (FPG ≥9.0 mmol/L) up to 64 and 99%, respectively. In contrast, in the 2-h glucose categories, the levels of AcAc and BHB were already somewhat increased in subjects with NGT and IGT, and significantly increased up to 29 and 52%, respectively, in individuals with newly diagnosed diabetes (2hPG ≥13 mmol/L). Thus, our study provides clear evidence that high levels of KBs are not only indicators of diabetic hyperglycemia but also markers of disturbed glucose metabolism in the prediabetic state.
We also observed that the levels of AcAc and BHB predicted an increase in glucose AUC in nondiabetic individuals, but the associations were abolished after the adjustment for glucose AUC at baseline. This could indicate an important link between the levels of KBs and glucose metabolism, but on the other hand, the clinical importance of KBs as markers for the worsening of hyperglycemia might be limited. AcAc, but not BHB, predicted the development of new type 2 diabetes during a prospective 5-year follow-up of the METSIM cohort, independent of known risk factors for type 2 diabetes and fasting glucose level at baseline. The reasons why KBs predicted very significantly the worsening of glycemia, but not so clearly incident diabetes, are FPG and 2hPG levels at the diagnosis of type 2 diabetes, which were often only marginally elevated (FPG in the range of 7.0–7.5 mmol/L and 2hPG in the range of 11.1–12.0 mmol/L), whereas the levels of KBs were significantly increased at higher glucose levels (FPG levels exceeding 8.0 mmol/L and 2hPG levels exceeding 12.0 mmol/L) (Fig. 1). Our results suggest that fasting AcAc could be a new marker for the development of incident diabetes. It is of interest to note that a recent study identified α-hydroxybutyrate, an organic acid derived from α-ketobutyrate, as a biomarker of insulin sensitivity in subjects with NGT (33).
To study the mechanisms by which KBs can increase the risk of hyperglycemia, we investigated the association of KB levels with insulin sensitivity and insulin secretion. Surprisingly, we found that high levels of KBs were associated with high insulin sensitivity in the nondiabetic glucose range at baseline, similar to recent findings in young Finnish adults (13). Furthermore, insulin sensitivity was significantly correlated with the key enzymes of ketolysis (Table 4), which suggests that in insulin-sensitive individuals, KBs are rapidly converted to acetyl-CoA, which stimulates oxidative phosphorylation and mitochondrial generation of ATP. Based on these findings, it is not likely that insulin resistance is an important mechanism in the prediction of hyperglycemia by elevated KB levels. This was clearly demonstrated by our 5-year follow-up data that showed that adjustment for Matsuda ISI did not weaken the association of KBs with the development of hyperglycemia. In contrast, impaired insulin secretion substantially weakened or abolished the association of KBs with the development of hyperglycemia and the conversion to type 2 diabetes. These findings emphasize the crucial role of impaired insulin secretion as a regulator of hyperglycemic effects of KBs. Adequate insulin secretion relative to insulin sensitivity maintains low levels of KBs by suppressing the expression of hormone-sensitive lipase and thus prevents the release of FFAs from adipose tissue, which is the major source of hepatic ketogenesis and high circulating levels of KBs (5,19,34).
Risk SNPs for hyperglycemia or type 2 diabetes and their association with the levels of KBs.
The association of KB levels with hyperglycemia prompted us to investigate the role of risk SNPs for type 2 diabetes and hyperglycemia in KB metabolism. Of the 62 SNPs analyzed, only the glucose-increasing major C allele of rs780094 of GCKR (encoding glucokinase regulatory protein) was significantly associated with increased BHB levels and nominally associated with AcAc levels. Glucokinase is the principal component in sensing the glucose level and plays a vital role in whole-body glucose homeostasis, and its activity is regulated by GCKR in the liver (35). The C allele of rs780094 of GCKR has been previously reported to be associated with fasting glycemia, type 2 diabetes, insulin resistance, decreased levels of total and VLDL triglycerides, decreased levels of alanine and isoleucine, and elevated levels of glutamine (36–40). The association of rs780094 with KB levels adds further to the pleiotropy of the multiple effects of GCKR.
There were several nominally significant associations of different SNPs of ANK1, GIPR, HMGA2, SLC2A2, and FADS1 with KB levels. However, these associations did not have a consistent pattern (increase/decrease or associations with AcAc or BHB or both), and therefore these results need to be replicated in other population-based studies before making conclusions on the implications of these findings.
Limitations.
Our study included only middle-aged Finnish men, and the applicability of these results to women or to other ethnic and racial groups remains unknown. Although our cohort included >9,000 men, the power of our study to demonstrate significant associations of KBs with SNPs regulating glucose levels or the risk of type 2 diabetes is limited.
In conclusion, our large population-based study of 9,398 men shows that elevated levels of KBs associate with fasting and 2-h glucose and predict the worsening of glycemia and incident type 2 diabetes. Impaired insulin secretion, but not insulin resistance, explained these findings. The major C allele of rs780094 of GCKR, which is known to increase glycemia, significantly associated with KB levels.
ACKNOWLEDGMENTS
This work was supported by the Academy of Finland (A.S. and M.L.; Responding to Public Health Challenges Research Programme to M.A.-K.), the Finnish Diabetes Research Foundation (M.L.), the Finnish Cardiovascular Research Foundation (M.A.-K. and M.L.), the Jenny and Antti Wihuri Foundation (A.J.K.), Strategic Research Funding from the University of Oulu (M.A.-K.), Strategic Research Funding from the University of Eastern Finland (M.L.), EVO Grant 5263 from the Kuopio University Hospital (M.L.), DK-062370 (M.B.), 1Z01-HG-000024 (F.S.C.), National Institutes of Health (NIH) Grant HL-095056 (P.P.), NIH Grant HL-28481 (P.P. and A.J.L.), and NIH grants DK-093757 and DK-072193 (K.L.M.).
No potential conflicts of interest relevant to this article were reported.
Y.M. wrote the manuscript and researched data. J.V., H.C., A.S., and J.Pi. researched data and reviewed and edited the manuscript. P.S. conceived, designed, and performed the NMR experiments, analyzed the data, and reviewed and edited the manuscript. A.J.K. analyzed the NMR data, contributed analysis tools, and reviewed and edited the manuscript. J.Pa., M.C., N.K.S., P.P., and A.J.L. performed the mRNA experiments, analyzed the data, and reviewed and edited the manuscript. L.L.B., M.A.M., F.S.C., and K.L.M. designed and performed genotyping and reviewed and edited the manuscript. M.B. designed and performed genotyping, contributed to analysis tools, and reviewed and edited the manuscript. M.A.-K. conceived and designed the NMR experiments, analyzed the data, and reviewed and edited the manuscript. J.K. designed the study and reviewed the manuscript. M.L. designed the study, contributed to discussion, and reviewed and edited the manuscript. M.L. is the guarantor of this work and, as such, had full access to all the data in the study and takes responsibility for the integrity of the data and the accuracy of the data analysis.
