
Abstract
Keywords
Health risk assessment Heavy metal Wheat products Inductively coupled plasma-atomic emission spectrometry Atomic absorption spectrometry
Introduction
Heavy metals, such as Lead (Pb), cadmium (cd), iron (Fe), copper (Cu), manganese (Mg), zinc (Zn), and etcrepresent are one of the main sources of pollutant and toxicology in the world (1-3). Some of these heavy metals are essential for human life but excessive amounts of them in the body cause the serious health risks such as cancer and damage to the nervous system (4-7). Excessive presence of Pb in body can affect brain activity in children and surplus of Cd can cause kidney stones (8, 9). Food and Agriculture Organization (FAO) and World Health Organization (WHO) have considered the maximum level for heavy metals in different samples (10).
Cereal and its products such as wheat, wheat-flour, bread, pasta, and sweets are among the biggest groups in food chain. These foods are being used daily and have direct effects on human health (11). In their natural form, cereals are a rich source of vitamins, minerals, carbohydrates, fats, oils, and protein. In many countries, cereal constitutes a majority of daily sustenance. In developed countries, cereal consumption is moderate and varied but still substantial.
There are different ways for heavy metals to enter human body including direct ingestion, dermal contact, diet through the soil-food chain, inhalation, and oral intake (12-16). Food is one of the primary sources for entrance of heavy metals to the body and the knowledge of background values of heavy metals in food such as cereal sample as main nutrition is necessary (17, 18). A cereal sample can get polluted directly from agricultural soil because soil is an important way for heavy metals to be transferred to agricultural products (19). Contamination of heavy metals in soil can be caused in many ways, such as irrigation water, industrial emissions, and the use of manure. Considering the above mentioned facts, health risk assessment of heavy metals and determining an accurate and reliable concentration of them in cereal samples is necessary. The factors affect the presence of heavy metals in cereal samples such as type of cereal samples, type of related soil, area, and etc., should be considered in assessing the procedure.
Inductively coupled plasma-atomic emission spectrometry (ICP-AES) and flame or graphite furnace atomic absorption spectrometry (F-GFAAS) are fast and highly sensitive instrumentation methods for determining real amounts of heavy metals in various samples (20-23). The other advantages of these methods are good linearity of calibration curves, low detection limits, high recovery, ease of use, and low matrix interferences.
Prior to instrumentation section, in order to eliminate and decrease the interferences, sample preparation is necessary as the critical step in the analytical process. This stage plays an important role in digestion of complex matrices, cleanup of analyte from co-existing species, analyte extraction and in increasing its sensitivity and recovery. The dry ashing, wet digestion procedures are general methods for this aim. These methods were used to determine many elements in different complex samples (24-26). For determining As and Hg hydride generation is employed as a suitable method for sample preparation step (27, 28).
In this research, we assessed the risk of heavy metals for some elements such as As, Cd, Co, Cr, Cu, Hg, Ni, Pb, and Zn in different urban and rural cereal samples. Golestan, Zarshouran (Kordestan) and Takab (Azarbayjan Gharbi) were selected to obtain cereal samples. Inductively coupled plasma-atomic emission spectrometry (ICP-AES) and atomic absorption spectrometry (AAS) were used as efficient methods for determining heavy metals. The concentration of heavy metals and total heavy metals was reported. Health risk assessment of heavy metals according to type and region (urban and rural) of the cereal was different.
Experimental
Samples Collection
A total of 28 cereal samples (including 12 wheat, 3 wheat-flour, 2 bread, 6 pasta, and 5 sweets) were collected from Golestan, Zarshouran (Kordestan) and Takab (Azarbayjan Gharbi) in June, 2016. All the samples were grinned, kept in appropriate vessel and transported to the laboratory. A representative sample of each cereal was properly stored in closed bottles in ambient temperature to determine heavy metal contents.
Reagents
As, Cd, Co, Cr, Cu, Hg, Ni, Pb, and Zn were purchased from Sigma-Aldrich (Steinheim, Germany) at a purity higher than 99%. The mixed standard solution was made at concentration of 100 μg kg−1. Working solutions were prepared by diluting stock solution with double deionized water (Milli-Q Millipore 18.2 MΩ/cm resistivity) for linear range assay. HNO3, H2SO4, H2O2, HF, HClO4, and HCl were obtained from Merck Co. (Darmstadt, Germany). All the plastic and glassware were cleaned by soaking in dilute HNO3 and were rinsed with distilled water prior to use.
Digestion Procedure
The samples were prepared according to AOAC 986.15 and AOAC 999-11. They were digested as follows:
Analysis of As and Hg (Hydride generation procedure): A 0.3 g sample was added to a 50 mL round-bottom flask. Then, 5 mL concentrated nitric acid was mixed to the sample and heated for 60 min in 150 °C. Then, 1 mL magnesium nitrate at a concentration 75 mg L-1 was added and heated in 450 °C for dehydration. After this step, 2 mL HCl (8 moL L-1) was added and thoroughly shacked. Finally, 200 µL potassium iodide (1% w/v) was added and this sample solution was diluted up to a 25 mL in the volumetric flask with distilled water. The obtained sample solution was immediately introduced to the instrument.
Analysis of the other elements: 5 g sample was weighted and 20 mL HNO3 10% was added and shook. Then, this sample was heated in 100 °C for 2 h for thorough dehydration. This sample was overheated in 350 °C by heater and then introduced to furnace for 5-6 h in 200 °C. After cooling, 2 mL concentrated HNO3 was added and heated to the complete dehydration. This sample was placed in furnace again for 2 h in 450 C to get white ash. Then, 5 mL HCl 6 moL L-1 was added and heated for dehydration. Finally, 10 mL concentrated HNO3 was added and introduced to the instrument.
Instrumentation
Thermo Scientific iCAP Series 6500, equipped with a charge injection device (CID) detector CETAC and Asx-520 Autosampler (England) has been used for determination of the elements. Control of the spectrometer is provided by PC based iTEVA software. The metals were determined with inductively coupled plasma-atomic emission spectrometry (ICP-AES). A model 220Z graphite furnace atomic absorption spectrometer equipped with Zeeman background (Varian, Australia) and pyrolytic partitioned graphite tubes (Varian, Australia) were used. Argon was used as inert gas at the flow rate of 3.0 L min-1 in all stages except for the step of atomizing of which flow was stopped. In this study, for the cases in which simultaneous ICP-OES, and in those samples in which ICP-AES was insufficiently sensitive, concentrations of the metals were determined by a GF-AAS. The determinations of Hg and As were performed using a Varian SpectrAA 220 atomic absorption spectrometer (Varian, Australia) equipped with a Varian GTA-110 graphite furnace and hydride generation-atomic fluorescence. Pyrolytic-coated graphite tubes with a platform were used and the signals were measured as peak areas.
Statistical Analysis
The data were analyzed by independent student’s t-test with SPSS version 15.0 for windows and the differences were considered statistically significant at P < 0.05.
Health Risk Analysis
The human risk (non-cancer) effects for all the metals were assessed. Equation 1 shows the Chronic Daily Intake (CDI) (mg kg−1 day−1). In this equation CF is the median concentration of HM in the sample (mg kg−1), IR is the ingestion rate of the sample (kg person−1 day−1), EF is exposure frequency (365 days year−1), and ED is the exposure duration. CDI is related to CF, IR, EF, and BW, but usually body weight (BW: 61.6 kg for adults) and exposure duration (ED: 365 days years-1) is constant in each region and CF and IR have the most role.
Risk to human health by the intake of metal-contaminated food was characterized using a hazard quotient (HQ) (US EPA, 1989). HQ is the ratio between exposure and the reference oral dose (RfD). If CDI increases the HQ increases (equation 2) and if HQ goes above one, there is cause for concern. If the ratio is lower than one (1), then there is no apparent risk. An estimate of the potential hazard to human health (HQ) through consumption of wheat grain grown in metal-contaminated is described in Equation 2.
To evaluate the potential risk to human health through more than one HM, the hazard index (HI) has been developed (US, 1986). The hazard index, that is the sum of the hazard quotients assumes that the magnitude of the adverse effect will be proportional to the sum of multiple metal exposures. It also assumes similar working mechanisms that linearly affect the target organ. When the hazard index exceeds 1.0, there should be concern for potential health effects.
Results
In this work, health risk of heavy metals in Iranian urban and rural area (Golestan, Zarshouran (Kordestan, and Takab (Azarbayjan Gharbi)) were assessed in the samples including wheat, wheat flour, bread, pasta, and sweets in order to evaluate health risks hazards of non-cancerous diseases through exposure to the selected samples by the local inhabitants, CDI, HQ and HI, were determined according to EPA’s Guidelines for Health Risk Assessment of Chemical Mixtures (US 1986).
Table 1 shows the results. Except for CDI for Co in rural sample, CDI was lower than RfDO for whole target elements in urban and rural samples.
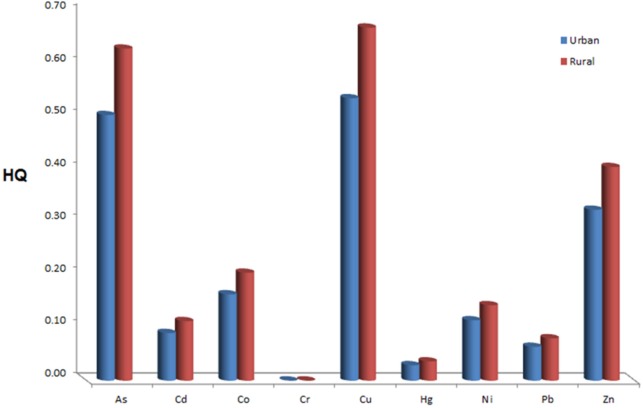
Figure 1. shows the comparison between heavy metals HQ for rural and urban sample in this order: Cu>As>Zn>Co>Ni>Cd>Pb>Hg>Cr. HQ for rural population is higher than urban population. HI 1.83 was for urban and HI 2.28 was for rural samples. According to the results, the rural samples had higher HI than the urban samples and HI was significant for two areas.
Levels of heavy metals in cereal samples
Table 2 shows the concentration of heavy metals in wheat samples. Zn and Cu have the maximum concentrations, respectively, and the concentration of Zn is quite significant. The average of heavy metals concentrations in wheat increased in the order Cd>Co=Hg >Pb>Cr>As>Ni>Cu>Zn>. The concentration of heavy metals in wheat was between >0.001 to 36.3 mg kg-1.
Table 3 describes the concentration of heavy metals in wheat-flour, pasta, bread, and sweets. According to these results, the amounts of heavy metal especially Zn, were significant in these samples. The average concentration of heavy metals for wheat-flour was > 0.01-19.9, pasta: 0.019-29.6, bread: >0.01-25.8, and sweets: 0.018-13.9. In all of samples the concentration of Zn and Cu was significant.
Discussion
According to Table 1, CDI was lower than RfDO for whole target elements (except Co) in urban and rural samples. CID for rural sample is higher than urban sample but this difference is not significant. The highest and lowest HQ for rural region was directly related to Cr and for urban area was related to Cu. There is significant difference between type of heavy metals for HQ with maximum 0.67 and minimum 0.0001 for Cu in the rural sample and Cr in the urban sample. But there is no significant difference for single element in the urban and rural areas. In any case, the value of hazard quotient (HQ) of any element is less than one, which means that there are no carcinogenic threats for any individual element. The potential risk of heavy metals could be increased when they were considered together at the same time but this risk was not significant when each metal was individually analyzed. HI values were 2.28 and 1.83 for rural and urban groups, respectively. The health risk of heavy metals for rural was higher than urban. It can be related to the more sources of entire heavy metals in the rural areas than in the urban areas. Therefore, the health of rural and urban residents through wheat consumption should be considered as a potential threat from heavy metals in Iran.
Table 2 and Table 3 show the mean concentrations of heavy metal in wheat, wheat-flour, bread, pasta, and sweets samples. The results show that the concentration of Zn and Cu in five groups of the samples was significant. For wheat samples, heavy metal with the lowest concentration was Cd and Co. The highest level of Zn and lowest level of Cd may be associated with physicochemical characterization of soil from which wheat was harvested. Ni and Hg have the lowest concentration in wheat-flour/bread and pasta/sweets, respectively. The results demonstrate that the amount of each heavy metal in five groups of the samples was variable in a wide range and this was affected from different factors such as type of heavy metals, physicochemical properties of related soil, region, type of products, etc,.
Chronic daily intake (CDI), oral reference dose (RfDO), hazard quotient (HQ) and total exposure hazard index (HI) for urban and rural samples
| Element | Area | CDI | RfDO | HQ | HI |
|---|---|---|---|---|---|
| Urban | 0.0002 | 0.0003 | 0.50 | 1.83 | |
| As | |||||
| Rural | 0.0002 | 0.63 | 2.28 | ||
| Urban | 0.0001 | 0.001 | 0.09 | 1.83 | |
| Cd | |||||
| Rural | 0.0001 | 0.11 | 2.28 | ||
| Urban | 0.0000 | 0.0003 | 0.16 | 1.83 | |
| Co | |||||
| Rural | 0.0001 | 0.20 | 2.28 | ||
| Urban | 0.0005 | 1.5 | 0.0001 | 1.83 | |
| Cr | |||||
| Rural | 0.0006 | 0.00 | 2.28 | ||
| Urban | 0.0214 | 0.04 | 0.54 | 1.83 | |
| Cu | |||||
| Rural | 0.0268 | 0.67 | 2.28 | ||
| Urban | 0.0001 | 0.0003 | 0.03 | 1.83 | |
| Hg | |||||
| Rural | 0.0001 | 0.04 | 2.28 | ||
| Urban | 0.0023 | 0.02 | 0.11 | 1.83 | |
| Ni | |||||
| Rural | 0.0029 | 0.14 | 2.28 | ||
| Urban | 0.0079 | 0.4 | 0.06 | 1.83 | |
| Pb | |||||
| Rural | 0.0098 | 0.08 | 2.28 | ||
| Urban | 0.0973 | 0.3 | 0.32 | 1.83 | |
| Zn | |||||
| Rural | 0.1216 | 0.41 | 2.28 |
Summary of heavy metal concentrations (mg kg−1) in the wheat samples
| Sample | Code | As | Cr | Co | Ni | Cu | Zn | Cd | Hg | Pb |
|---|---|---|---|---|---|---|---|---|---|---|
| Wheat | 1 | > 0.05 | 0.175 | 0.015 | 0.234 | 3.380 | 21.142 | 0.012 | 0.018 | >0.01 |
| Wheat | 2 | 0.295 | 0.130 | 0.0225 | 0.288 | 3.263 | 36.363 | 0.036 | 0.020 | 0.053 |
| Wheat | 3 | 0.131 | 0.177 | 0.016 | 0.298 | 2.853 | 22.750 | 0.014 | 0.026 | 0.289 |
| Wheat | 4 | 0.142 | 0.075 | 0.022 | 0.324 | 3.107 | 27.941 | 0.024 | 0.022 | 0.073 |
| Wheat | 5 | 0.111 | 0.069 | 0.017 | 0.290 | 2.557 | 16.964 | 0.014 | 0.026 | >0.01 |
| Wheat | 6 | > 0.05 | 0.065 | 0.013 | 0.327 | 2.553 | 16.888 | 0.015 | 0.020 | 0.007 |
| Wheat | 7 | 0.227 | 0.081 | 0.022 | 0.256 | 3.858 | 29.973 | 0.028 | 0.024 | 0.061 |
| Wheat | 8 | > 0.05 | 0.072 | >0.01 | >0.01 | 0.016 | 11.787 | 0.002 | 0 | >0.01 |
| Wheat | 9 | 0.114 | 0.042 | 0.015 | 0.309 | 2.320 | 18.120 | 0.010 | 0.010 | >0.01 |
| Wheat | 10 | 0.092 | 0.053 | 0.014 | 0.358 | 2.926 | 23.19 | 0.017 | 0.013 | >0.01 |
| Wheat | 11 | 0.071 | 0.100 | 0.031 | 0.337 | 2.208 | 11.695 | 0.009 | 0.011 | >0.01 |
| Average | 0.111 | 0.094 | 0.017 | 0.275 | 2.640 | 21.528 | 0.016 | 0.017 | 0.044 | |
| Recovery(%) | 85 | 94 | 89 | 87 | 92 | 99 | 96 | 88 | 89 | |
| RSD(%) | 4.3 | 5.7 | 6.8 | 5.2 | 4.4 | 7.0 | 8.6 | 5.5 | 6.1 |
Summary of heavy metal concentrations (mg kg−1) in the wheat-flour, pasta and sweets samples
| Pb | Hg | Cd | As | Zn | Cu | Ni | Co | Cr | Sample code |
|---|---|---|---|---|---|---|---|---|---|
| 0.063 | 0.009 | 0.477 | 6.170 | 23.133 | 0.036 | >0.01 | 0.063 | 0.152 | Wheat-flour 1 |
| 0.083 | 0.029 | 0.821 | 12.280 | 19.902 | 0.026 | >0.01 | 0.079 | 0.27 | Wheat flour 2 |
| 0.049 | 0.025 | 0.558 | 7.202 | 16.678 | 0.027 | >0.01 | 0.060 | 0.164 | Wheat-flour 3 |
| 0.065 | 0.021 | 0.619 | 8.551 | 19.904 | 0.030 | >0.01 | 0.068 | 0.198 | Average |
| 90 | 89 | 91 | 82 | 89 | 94 | 90 | 85 | 88 | Recovery (%) |
| 4.7 | 5.7 | 7.1 | 4.9 | 5.0 | 6.8 | 8.6 | 5.3 | 6.0 | RSD (%) |
| 0.250 | 0.015 | 0.373 | 3.404 | 12.974 | 0.091 | 0.021 | 0.051 | 1.130 | Pasta 1 |
| 0.289 | 0.018 | 0.401 | 4.935 | 13.960 | 0.058 | 0.024 | 0.034 | 0.694 | Pasta 2 |
| 0.175 | 0.019 | 0.328 | 6.453 | 42.597 | 0.670 | 0.033 | 0.030 | 0.252 | Pasta 3 |
| 0.188 | 0.019 | 0.338 | 5.935 | 27.328 | 0.075 | 0.014 | 0.023 | 0.228 | Pasta 4 |
| 0.164 | 0.022 | 0.352 | 6.070 | 46.764 | 0.809 | 0.038 | 0.029 | 0.260 | Pasta 5 |
| 0.136 | 0.018 | 0.300 | 5.780 | 34.037 | 0.242 | 0.017 | 0.022 | 0.071 | Pasta 6 |
| 0.200 | 0.019 | 0.349 | 5.429 | 29.610 | 0.324 | 0.025 | 0.032 | 0.439 | Average |
| 99 | 81 | 88 | 96 | 97 | 82 | 89 | 94 | 90 | Recovery (%) |
| 5.9 | 6.9 | 6.8 | 7.6 | 8.2 | 5.3 | 6.6 | 6.5 | 7.1 | RSD (%) |
| 0.109 | 0.026 | 0.601 | 6.548 | 17.505 | 0.028 | >0.01 | 0.062 | 0.405 | Bread 1 |
| 0.059 | 0.023 | 0.530 | 10.323 | 34.237 | 0.039 | >0.01 | 0.075 | 0.303 | Bread 2 |
| 0.084 | 0.024 | 0.565 | 8.436 | 25.871 | 0.033 | >0.01 | 0.068 | 0.354 | Average |
| 93 | 88 | 91 | 89 | 95 | 90 | 84 | 86 | 91 | Recovery (%) |
| 6.2 | 4.4 | 5.6 | 4.7 | 6.1 | 5.9 | 4.9 | 5.0 | 5.1 | RSD (%) |
| 0.063 | 0.009 | 0.477 | 6.170 | 23.133 | 0.036 | >0.01 | 0.063 | 0.152 | Sweets 1 |
| 0.083 | 0.029 | 0.821 | 12.280 | 19.902 | 0.026 | >0.01 | 0.079 | 0.27 | Sweets 2 |
| 0.049 | 0.025 | 0.558 | 7.202 | 16.678 | 0.027 | >0.01 | 0.060 | 0.164 | Sweets 3 |
| 0.065 | 0.021 | 0.619 | 8.551 | 19.904 | 0.030 | >0.01 | 0.068 | 0.198 | Sweets 4 |
| 0.250 | 0.015 | 0.373 | 3.404 | 12.974 | 0.091 | 0.021 | 0.051 | 1.130 | Sweets 5 |
| 0.289 | 0.018 | 0.401 | 4.935 | 13.960 | 0.058 | 0.024 | 0.034 | 0.694 | Average |
| 84 | 99 | 86 | 93 | 82 | 88 | 96 | 95 | 87 | Recovery (%) |
| 6.3 | 4.8 | 6.0 | 5.8 | 5.5 | 5.7 | 6.3 | 4.9 | 5.0 | RSD (%) |
Conclusion
In this study, we successfully determined the amount of heavy metals in different wheat samples using high sensitive inductively coupled plasma-atomic emission spectrometry (ICP-AES) and atomic absorption spectrometry (AAS). Digestion method as effective sample preparation was employed for decreasing the interference of the sample matrix and decreasing the sensitivity. Also, this research provides a comprehensive assessment of heavy metal pollution from urban and rural sample in Iran. The results demonstrated that the risk index for target element in urban and rural areas was significant and different.
Acknowledgements
References
-
1.
Huang M, Zhou S, Sun B, Zhao Q. Heavy metals in wheat grain: assessment of potential health risk for inhabitants in Kunshan, China. Sci. Total Environ. 2008;405:54-61. [PubMed ID: 18701141].
-
2.
Wang Q-R, Cui Y-S, Liu X-M, Dong Y-T, Christie P. Soil contamination and plant uptake of heavy metals at polluted sites in China. J. Environ. Sci. Health Part A. 2003;38:823-38.
-
3.
Ratcliffe HE, Swanson GM, Fischer LJ. Human exposure to mercury: a critical assessment of the evidence of adverse health effects. J. Toxicol. Environ. Health. 1996;49:221-70. [PubMed ID: 8876653].
-
4.
Järup L. Hazards of heavy metal contamination. British Med. Bulletin. 2003;68:167-82.
-
5.
Gerhard I, Monga B, Waldbrenner A, Runnebaum B. Heavy metals and fertility. J. Toxicol. Environ. Health Part A. 1998;54:593-611. [PubMed ID: 9726782].
-
6.
Fierens S, Mairesse H, Heilier J-F, Focant J-F, Eppe G, Pauw ED, Bernard A. Impact of iron and steel industry and waste incinerators on human exposure to dioxins, PCBs, and heavy metals: results of a cross-sectional study in Belgium J. Toxicol. Environ. HealthPart A. 2007;70:222-6.
-
7.
Cooper K, Noller B, Connell D, Yu J, Sadler R, Olszowy H, Golding G, Tinggi U, Moore MR, Myers S. Public health risks from heavy metals and metalloids present in traditional Chinese medicines. J. Toxicol. Environ. Health Part A. 2007;70:1694-9. [PubMed ID: 17763088].
-
8.
Storelli M. Potential human health risks from metals (Hg, Cd, and Pb) and polychlorinated biphenyls (PCBs) via seafood consumption: estimation of target hazard quotients (THQs) and toxic equivalents (TEQs). Food Chem. Toxicol. 2008;46:2782-8. [PubMed ID: 18584931].
-
9.
Fortier M, Omara F, Bernier J, Brousseau P, Fournier M. Effects of physiological concentrations of heavy metals both individually and in mixtures on the viability and function of peripheral blood human leukocytes in-vitro. J. Toxicol. Environ. Health Part A. 2008;71:1327-37. [PubMed ID: 18686204].
-
10.
Organization WH. Environmental health criteria 224: arsenic and arsenic compounds. World Health Organization Geneva. 2001:1-108.
-
11.
Slavin J. Whole grains and human health. Nutr. Res. Rev. 2004;17:99-110. [PubMed ID: 19079919].
-
12.
Muhammad S, Shah MT, Khan S. Health risk assessment of heavy metals and their source apportionment in drinking water of Kohistan region, northern Pakistan. Microchem. J. 2011;98:334-43.
-
13.
Ibrahim N. Health Risk Assessment of Heavy Metals and their Source Apportionment in Drinking Water of Zulfi District, North-West of Riyadh Region. Pinnacle Environ. Earth Sci. 2015;2:879-884.
-
14.
Luo C, Liu C, Wang Y, Liu X, Li F, Zhang G, Li X. Heavy metal contamination in soils and vegetables near an e-waste processing site, south China. J. Hazard. Mater. 2011;186:481-90. [PubMed ID: 21144651].
-
15.
Zheng N, Wang Q, Zhang X, Zheng D, Zhang Z, Zhang S. Population health risk due to dietary intake of heavy metals in the industrial area of Huludao city, China. Sci. Total Environ. 2007;387:96-104. [PubMed ID: 17765948].
-
16.
Chamon A, Gerzabek M, Mondol M, Ullah S, Rahman M, Blum W. Influence of cereal varieties and site conditions on heavy metal accumulations in cereal crops on polluted soils of Bangladesh. Commun. Soil Sci. Plant Anal. 2005;36:889-906.
-
17.
Mahaffey K, Corneliussen P, Jelinek C, Fiorino J. Heavy metal exposure from foods. Environ. Health Perspect. 1975;12:63.
-
18.
Tripathi R, Raghunath R, Sastry V, Krishnamoorthy T. Daily intake of heavy metals by infants through milk and milk products. Sci. Total Environ. 1999;227:229-35. [PubMed ID: 10231985].
-
19.
Yong Z. Heavy metal pollution of soil and agricultural products in Shenyang suburbs: current situation. Chinese J. Soil Sci. 2002;32:182-6.
-
20.
Tüzen M. Determination of heavy metals in fish samples of the middle Black Sea (Turkey) by graphite furnace atomic absorption spectrometry. Food Chem. 2003;80:119-23.
-
21.
Grünke K, Staerk H-J, Wennrich R, Franck U. Determination of traces of heavy metals (Mn, Cu, Zn, Cd and Pb) in microsamples of teeth material by ETV-ICP-MS. Fresenius› J. Anal. Chem. 1996;354:633-5.
-
22.
Şahan Y, Basoglu F, Gücer S. ICP-MS analysis of a series of metals (Namely: Mg, Cr, Co, Ni, Fe, Cu, Zn, Sn, Cd and Pb) in black and green olive samples from Bursa, Turkey. Food Chem. 2007;105:395-9.
-
23.
Palchetti I, Laschi S, Mascini M. Miniaturised stripping-based carbon modified sensor for in field analysis of heavy metals. Anal. Chim. Acta. 2005;530:61-7.
-
24.
Akinyele I, Shokunbi O. Comparative analysis of dry ashing and wet digestion methods for the determination of trace and heavy metals in food samples. Food Chem. 2015;173:682-4. [PubMed ID: 25466076].
-
25.
Altundag H, Tuzen M. Comparison of dry wet and microwave digestion methods for the multi element determination in some dried fruit samples by ICP-OES. Food Chem. Toxicol. 2011;49:2800-7. [PubMed ID: 21843582].
-
26.
Tüzen M. Determination of heavy metals in soil, mushroom and plant samples by atomic absorption spectrometry. Microchem. J. 2003;74:289-97.
-
27.
Uluozlu OD, Tuzen M, Mendil D, Soylak M. Determination of As (III) and As (V) species in some natural water and food samples by solid-phase extraction on Streptococcus pyogenes immobilized on Sepabeads SP 70 and hydride generation atomic absorption spectrometry. Food Chem. Toxicol. 2010;48:1393-8. [PubMed ID: 20226225].
-
28.
Hashempour-Baltork F, Hosseini H, Houshiarrad A, Esmaeili M. Contamination of foods with arsenic and mercury in Iran: a comprehensive review. Environ. Sci. Pollut. Res. 2019;26:25399-25413.
-
29.
Zheng C, Ma Q, Wu L, Hou X, Sturgeon RE. UV photochemical vapor generation–atomic fluorescence spectrometric determination of conventional hydride generation elements. Microchem. J. 2010;95:32-7.