Abstract
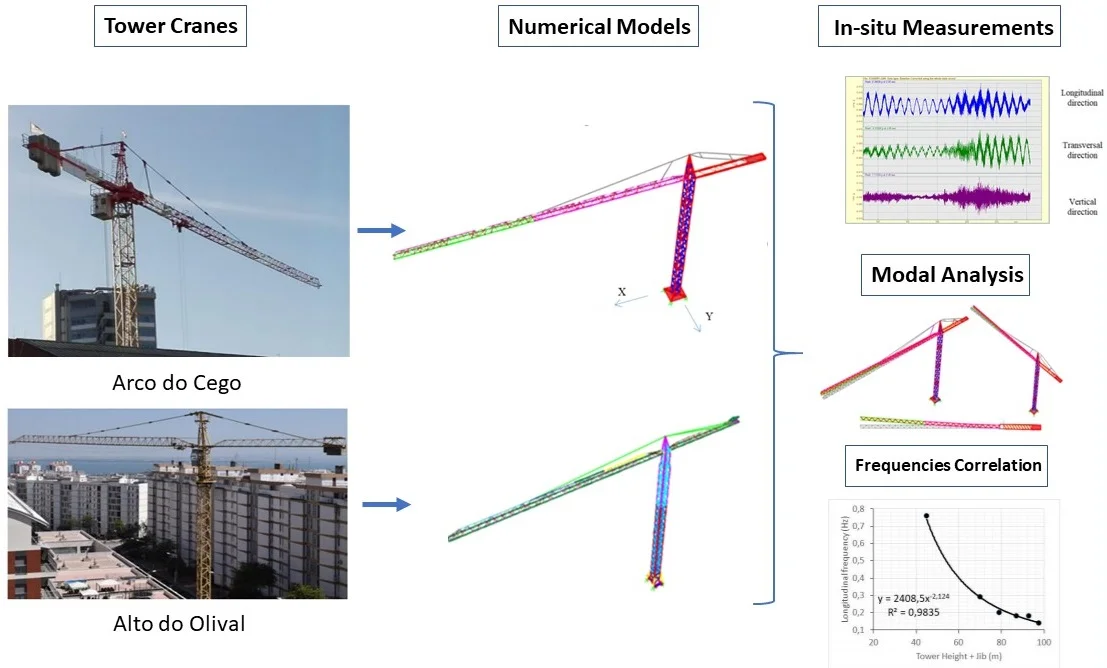
Tower cranes act as essential support equipment for the development of the city’s construction projects, not only for new projects but also in the rehabilitation of old structures. In the present study, we analyze and compare two different tower cranes, where the differences are essentially based on the geometry, weight, and consequently the reach and load capacity of each structure. In general, these types of structures correspond to slender steel structures designed to carry high loads. Despite the great importance given to these structures, many disasters have occurred causing damage to people or to urban equipment in the vicinity due to total or partial collapse. We developed a 3-D mathematical linear model of the structures in SAP2000 and compared the analytical frequencies with in situ measurements. The maximum error for the first two translationally identified modes in the x and y directions was 4.9 %. These structures are very flexible, with frequencies below 0.5 Hz. We then applied and evaluated the impact of two types of exceptional action, seismic (maximum reference acceleration of 1.5 m/s2 and 1.7 m/s2) and wind load characteristics of an urban area (surrounded by buildings), for the two structures not carrying any load. The effects resulted in no serious consequences, with wind being the most severe action in certain cross-sections and seismic action in others. One very important and innovative aspect of this study was the in situ characterization of the frequencies and the verification that the mathematical model reproduced the behavior of the real structure very well. We complemented this study by measuring four more structures and proposing a law to estimate the frequency as a function of the length of the tower plus jib. However, we also found from a literature review of recently published work that, contrary to the six structures that we analyzed, it is difficult to extrapolate this law for other types of tower cranes.
Highlights
- Analysis and comparison of the dynamic behavior of two different tower cranes and their seismic and wind vulnerability.
- In-situ measurements of the vibration frequencies of the tower cranes.
- These structures are very flexible with frequencies of first vibration modes below 0.5 Hz.
- Calibration of analytical models to fit the measured frequencies.
- Analysis and safety check for moderate seismic and wind loads.
1. Introduction and description of Tower cranes
This study focuses mainly on the analysis and comparison of the dynamic behavior of two different tower cranes and their seismic and wind vulnerability.
The importance of this issue is based on the following aspects:
– To check the performance in a region of moderate seismic hazards and moderate wind loads, as represented in the Portuguese situation (RSA, 1983) [1].
– The great amount of damage caused by the Japan Hyogo-ken Nanbu 1995 earthquake to tower cranes working on top of buildings [2].
– An increase in construction using tower cranes has been observed in recent times, which naturally leads to an increase in the use of this type of structure.
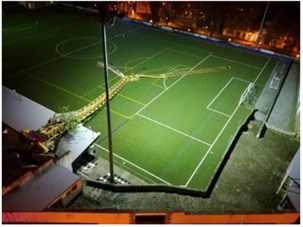
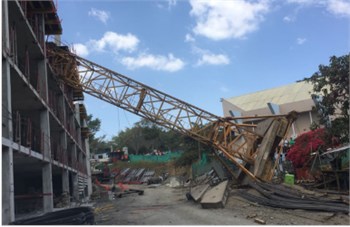
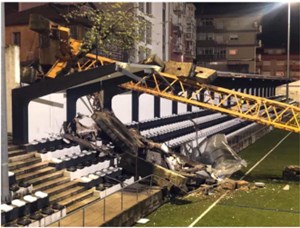
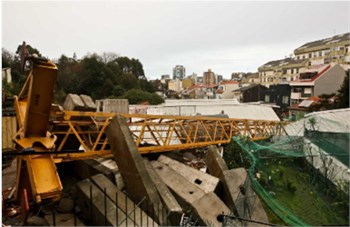
In Portugal, we observed several accidents involving these towers caused by strong and unexpected wind and related to problems at the foundation level. Fig. 1 shows examples of these factors and the impact that crane collapse can have on its surroundings. Internet sites are full of other examples of incidents of collapse all over the world. Since 2000, there have been over 1125 tower crane accidents, which have resulted in over 780 deaths and countless injuries [3].
Fig. 1Photographic register of tower crane collapses located in Portugal (left: Vila Real and right: Porto)
In this way, we seek to contribute to improved knowledge regarding the dynamic behavior of this type of structure and better understanding their vulnerability. Naturally, the consequences associated with the collapse of such structures are not as serious as those associated with a building or bridge; however, this is not a reason to be neglected.
In this work, two tower cranes with different characteristics (geometry, mass, capacity, etc.) located in Lisbon, Portugal, will be described and analyzed (Fig. 2).
Tower cranes are considered lightweight structures, not only due to their geometry but also due to the predominant material used, which allows the application of slender profiles with adequate strength.
Fig. 2Photographic register of both Tower Cranes: a) Arco do Cego (AC) and b) Alto do Olival (AO)
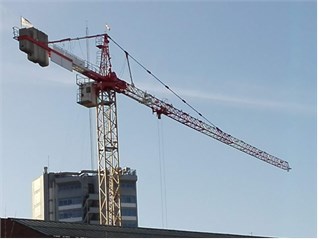
a)
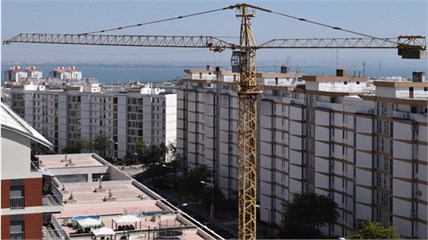
b)
In terms of materials, steel (S355) is used in the cross-sections, in the connection between cross-sections and in the suspension cables that support the jib and counter-jib. Moreover, concrete is used as a weight in the required places, ensuring the balance and stability of the structure, whether or not it is in service.
1.1. Past studies
Few studies have been performed on tower cranes under seismic and wind loads, even though there are several magazines announcing products related to cranes. A few papers performed dynamic analyses considering loads such as live loads, pendulum action, maneuver operations or slewing operations [4-7]. Takanashi et al. [2] performed an earthquake analysis. Alămoreanu et al. [8] used sinusoidal input to check earthquake responses. Gu et al. [9] analyzed the effect of wind loads. Gu et al. [10] and Li-Jeng et al. [11] used the FEM to study this topic.
During the Japan earthquake Hyogo-ken Nanbu in 1995 the need of a standard to ensure seismic-resistant cranes was first highlighted. Many problems were reported with tower cranes, especially those working on top of high-rise buildings [2]. As a consequence, ISO prepared a first draft of a norm on “Cranes: Principles for Seismically Resistant Design” [12]. Since then, several organizations have been working on the problems of earthquake and window effects on cranes, namely, the Eurocodes [13].
More recently, Shen et al., [14] looked into the introduction of TMD to control vibrations under earthquake loads, and Tarak et al., [15] present a text on modelling and control of tower cranes motion using analytical formulation and small-scale lab test.
1.2. Tower foundation
In the course of this section, both structures are described sequentially, from the foundation to the top, highlighting and comparing the differences between them in terms of the geometry, mass, etc.
First, the two tower cranes have different types of supports that are identical in terms of how they are designed by installing large masses of concrete.
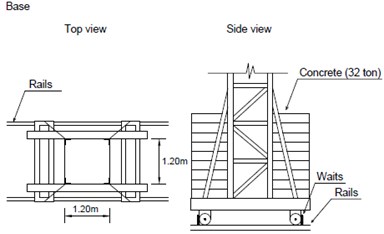
While the tower crane located in Arco do Cego (AC) has a mass of 55 tons made up of concrete beams arranged on the four sides of the base resting on two IPE 400 beams, the tower crane located in Alto do Olival (AO) has a lower mass of 32 tons consisting of concrete slabs arranged on two sides of the base also resting on steel IPE beams (Fig. 3).
However, in terms of translation, while the Arco do Cego Crane (AC) is fixed in a pit foundation, the Alto do Olival Crane (AO) is supported by steel rails that can present translations according to the rail directions, thus enabling a change in position and, consequently, the perimeter of influence of the jib. The different mass assignments on the tower crane’s foundation depend on the size of each structure, its reach and the capacity to transport loads in accordance with its distance from the tower axis.
As will be described below, the AC tower crane has larger dimensions than the AO tower crane. Note also that while in the stack on AC base, concrete slabs cannot move as they are intertwined, on AO base they are just superposed allowing sliding in case of high vertical shaking.
Fig. 3Top and side view of Arco do Cego and Alto do Olival Tower Cranes
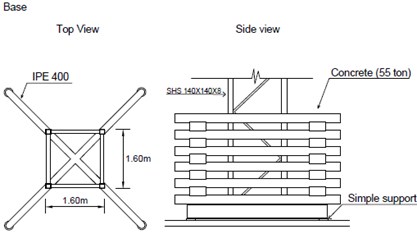
a) Arco do Cego
b) Alto do Olival
1.3. Tower mast
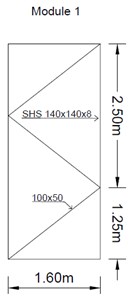
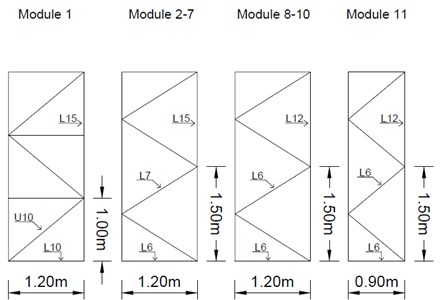
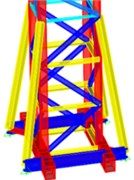
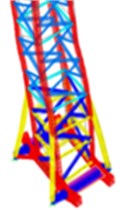
The tower mast has a spiral layout composed of modules in square sections corresponding to a large triangulated lattice structure connected to the base, which gives the crane its strength and height. The AC tower crane has the same module in height, while the AO tower crane has a tower composed of different modules (as shown in Fig. 4).
On the one hand, in the AC tower crane, SHS 140×140×8 mm cross-sections are used in the corners of the square section, and rectangular (100×50) mm cross-sections are used in the diagonal members, where both remain constant in height.
On the other hand, the AO tower crane has L-shaped cross-sections (angles with equal legs) in the corners of the square section, and U and L are used in the diagonal lines, where both gradually decrease in height.
Fig. 4Tower Crane mast modules: a) Arco do Cego and b) Alto do Olival
a)
b)
1.4. Jibs
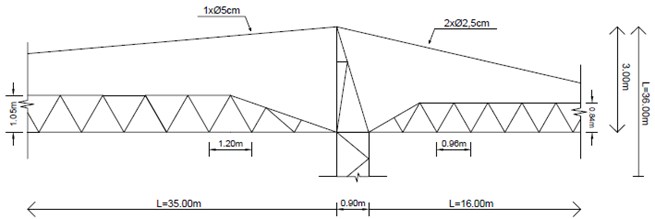
Finally, the connection between the jibs and mast is ensured in the same way through ties (steel suspension cables) as shown in Figs. 5 and 6. It should be noted that the requirements of the first crane’s ties are higher than those of the second crane. Once again, in terms of dimensions, the AC tower crane has a longer reach, having a jib length of 60.00 m, and the AO tower crane has a 35.00 m length. The counter-jibs have dimensions of approximately 16 m and 13 m, respectively, and both are designed in different ways. While the AC counter-jib is made up of RHS 300×150×10 mm beams, the AOs are made up of a triangular truss with tubular cross-sections [16], such as the jibs of both structures. These are designed as truss structures composed of CHS and RHS cross-sections, decreasing the dimensions in the upper chord along the jib.
The two cranes are different in size and element characteristics. While the mast of the first tower crane has a square section of 1.60×1.60 m and a total height of 43.50 m, the second has a square section that decreases in height from 1.20×1.20 m to 0.90×0.90 m and has a total height of 36.00 m.
Fig. 5Arco do Cego tower-jibs connection
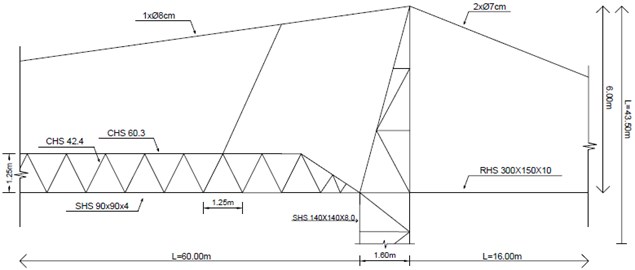
Fig. 6Alto do Olival tower-jibs connection
2. Structure modeling
Both structures under study were analyzed using the finite element program SAP2000 [17].
Table 1 presents the constituent elements of the structure and the way in which they were modeled.
Table 1Modeling of the structure components
Elements | Model |
Steel cross-sections | Frame |
Steel suspension cables (ties) | Cable |
Concrete ballasts | Area with the distributed load |
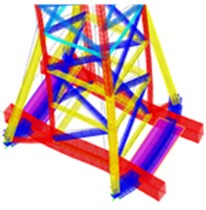
Three types of elements were used to ensure the correct behavior of the different constituent parts of the structure. Fig. 7 shows how both tower crane foundations were modeled using frame and shell elements. As previously mentioned, the concrete masses located at the base were made through loads distributed in the respective areas (shells) occupied by the concrete slabs or beams.
Fig. 7Tower Crane base: a) Arco do Cego and b) Alto do Olival
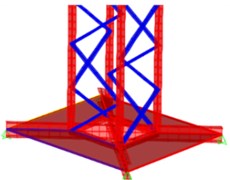
a)
b)
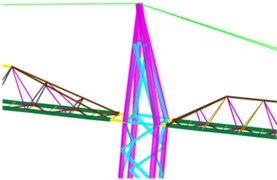
Fig. 8 shows the connection between the towers and the jibs, which in both cases the connection is made using ties, which are modeled as steel suspension cables. The effect of counterweights on structures was also accounted for through loads distributed in areas (shells), equivalent to the area of each one.
Fig. 8Tower-jib connections: a) Arco do Cego and b) Alto do Olival
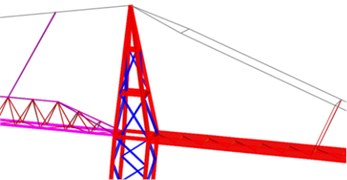
a)
b)
After the detailed description of the structures under analysis, certain predictions can be made in terms of the dynamic behavior based on the characteristics of each tower crane mentioned above:
– We were able to verify that the Arco do Cego tower crane has dimensions that are larger than those of the Alto do Olival crane. As such, it is expected that the 1st crane will exhibit more flexible behavior, which will result in vibration modes with lower frequencies;
– Additionally, the Arco do Cego crane has a higher percentage of mass, not only because it corresponds to a larger structure but also because it has a heavier counterweight, which also gives rise to lower vibration modes;
– As we can see from Fig. 3, the Arco do Cego tower crane has a steadier base than the Alto do Olival crane, as the concrete ballasts are intertwined in both directions. This will lead to different kinds of results in terms of the mass participation factors of the rigid modes associated with the mass excitation located at the tower crane’s base.
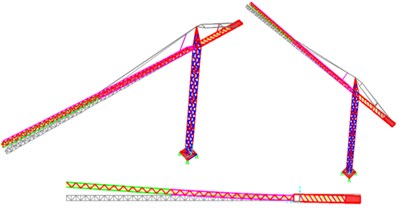
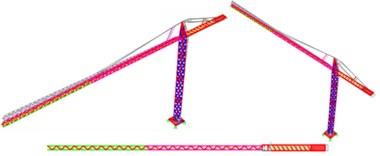
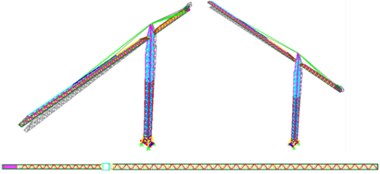
Finally, the two tower crane numerical models under analysis are shown side by side (Fig. 9).
Fig. 9Numerical models under analysis
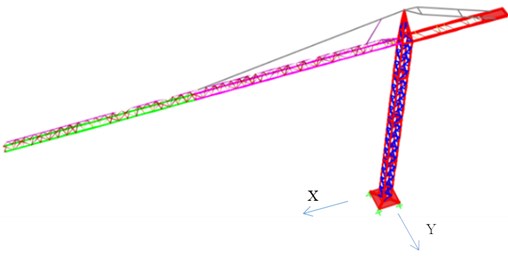
a) Arco do Cego Crane
b) Alto do Olival Crane
3. Modal analysis
We use six cranes being in operation at construction sites to perform measurements with acceleration transducers previously tested to be sure that we were in presence of instrumentation capable of identifying very low frequencies of vibration as these cranes exhibit.
Two of them were selected for a linear analysis and frequencies and mode shapes were compared with the in-situ observations.
Due to the large flexibility of these structures, for one crane we also used an optical measurement capable of easily identify the first frequencies of vibration under wind loads and certain more critical situations in the operation.
We were also ably to identify the frequency of the “hanging chain” used to carry the loads.
We used the developed analytical model to test the real flexibility of the crane loaded with a varied type of loads during the construction operation. We employed “Optical devices” in this calibration phase.
3.1. In situ dynamic characterization by forced-balance accelerometer
To not only ensure a closer proximity between the numerical model and the actual structure, but to also provide greater credibility of the results exposed in this work, a dynamic identification test based on ambient vibrations was performed for both structures under analysis.
Due to the low frequency of fundamental mode shapes of these structures together with the difficulty in placing instrumentation in several locations, prior to initiating the measurement campaign, we tested our instrumentation for the conditions we face at the site and evaluated the operational procedure to ensure that the collected information was correct and accurate. For the first topic, we tested an 18-bit accelerometer with a 0.1 Hz high cut off measuring the motion of a few centimeters for a 7 m long pendulum and obtained good results. For the second problem, we prepared a time trigger giving the time for a crane maneuverer to climb up the ladder and place the instrument at an adequate location. The instrument recorded the free vibration of the top of the tower for several minutes and repeated the test a few times with a 0.005 sec. Fig. 10 shows the time record obtained at the top of the tower, exhibiting the low frequencies and amplitudes of motion of the order of 5 mg in the longitudinal direction and amplitudes of motion, and Fig. 11 shows the corresponding FFT.
Fig. 10Representative time history record made at the top of the Alto do Olival Tower Crane
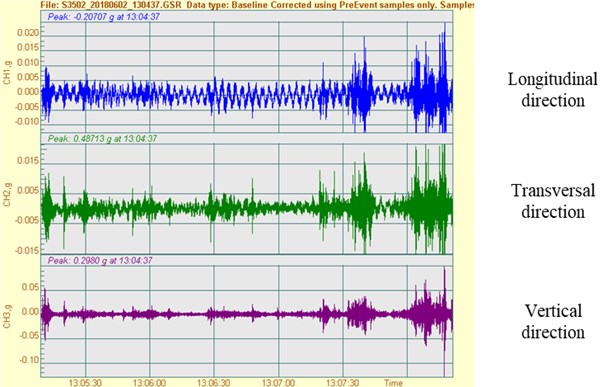
Fig. 11Frequencies in the x direction (longitudinal) obtained through the dynamic identification test
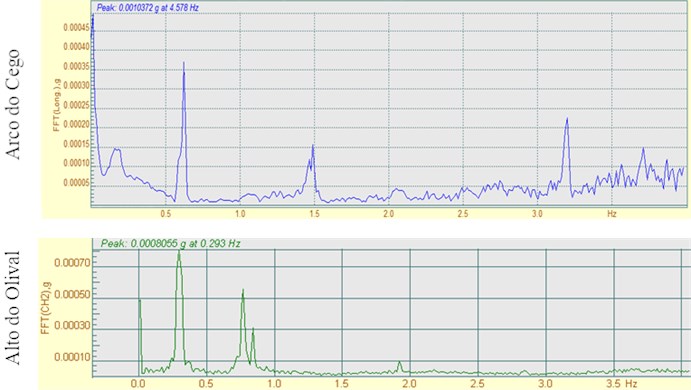
From the analysis of the two graphs, it can be concluded that this type of structure is able to offer a wide range of results with great clarity and quality, thus facilitating the identification of the structure’s natural frequencies and, consequently, the model calibration.
3.2. By optical measurements
Due to a lucky coincidence, we were able to follow in very close connection and with a view at the level of the jib the operation of one of the cranes in a construction shipyard. Beyond the accelerometer testing, we perform in-situ analysis by optical techniques, filming the motion of the tower and jib under several loads conditions, actually with much larger amplitude values than the one obtained at the time of instrument testing. Frequencies were easily obtained by accelerating the film and trigonometric relations permitted the computation of displacements. Comparing these measurements with the ones obtained with the accelerometer station, the results for the first frequencies in the longitudinal and transversal directions were the same to the centesimal point.
3.3. Vibration modes
Tables 2 and 3 show the frequency values obtained according to the different directions for both structures under analysis. As seen for the first vibration modes according to the translation directions, and , the Arco do Cego tower crane has more flexible dynamic behavior, characterized by lower frequency values.
Note that after comparing the values obtained through the in situ tests and the numerical models, frequencies according to z and torsional movements were identified in the Arco do Cego tower crane. This fact is most likely associated with placing the equipment eccentrically in relation to the tower axis. This eccentricity may have been higher in the Arco do Cego tower crane, thus contributing to obtaining a torsional frequency.
Table 2Frequencies obtained in the experimental (in-situ) test for Arco do Cego tower crane
(Hz) | (Hz) | (Hz) | (Hz) |
0,145 | 0,2 | 0,22 | 1,5 |
– | 0,61 | 0,58 | 4,2 |
– | 2,96 | 3,2 | 4,6 |
– | 3,2 | 4,2 | – |
– | 5,5 | 4,6 | – |
Table 3Frequencies obtained in the experimental (in-situ) test for Arco do Olival tower crane
(Hz) | (Hz) |
0,3 | 0,33 |
0,69 | – |
0,82 | 0,895 |
1,9 | 1,8 |
– | 2,35 |
2,7 | 2,8 |
3.4. Vibration modes
In this phase, using numerical modeling, the vibration modes and respective dynamic characteristics of the structure under analysis are described. It should be noted that Tables 4 and 5 are composed of values that were already adjusted and calibrated based on the results obtained in the in-situ dynamic identification test.
As is generally known, the overall response of the structure must be composed of all the vibration modes with a substantial contribution.
For the Arco do Cego tower crane case (Table 4), it was not possible to reach a minimum of 90 % of the total mass of the structure, having been included in the analysis of 50 modes contributing to 69 % of the mass according to and and 99 % according to and torsion around the vertical axis.
But for the sum of the mass participation factors of the Alto do Olival tower crane (Table 5), to reach a minimum value of 90 % of the total mass of the structure, a total of 94 vibration modes were computed.
Table 4Most relevant vibration modes and mass participation factors of the Arco do Cego tower crane (orange – most influential vibration modes and green – 90 % cumulative mass participation factor)
Modes | (s) | (Hz) | Mass Participation factor (%) | |||||||
Σ | Σ | Σ | Σ | |||||||
1 | 6,589 | 0,152 | 0,00 | 0,00 | 0,00 | 0,00 | 0,00 | 0,00 | 0,92 | 0,92 |
2 | 5,136 | 0,195 | 0,37 | 0,37 | 0,00 | 0,00 | 0,01 | 0,01 | 0,00 | 0,92 |
3 | 4,778 | 0,209 | 0,00 | 0,37 | 0,54 | 0,54 | 0,00 | 0,00 | 0,03 | 0,95 |
4 | 1,824 | 0,548 | 0,22 | 0,58 | 0,00 | 0,54 | 0,00 | 0,00 | 0,00 | 0,95 |
5 | 1,737 | 0,576 | 0,00 | 0,58 | 0,03 | 0,57 | 0,00 | 0,00 | 0,04 | 0,99 |
6 | 1,311 | 0,763 | 0,00 | 0,60 | 0,00 | 0,57 | 0,02 | 0,02 | 0,00 | 0,99 |
7 | 1,177 | 0,849 | 0,02 | 0,60 | 0,00 | 0,58 | 0,01 | 0,01 | 0,00 | 0,99 |
12 | 0,662 | 1,511 | 0,00 | 0,60 | 0,00 | 0,59 | 0,30 | 0,30 | 0,00 | 0,99 |
17 | 0,362 | 2,762 | 0,00 | 0,61 | 0,06 | 0,65 | 0,00 | 0,37 | 0,00 | 0,99 |
20 | 0,296 | 3,376 | 0,05 | 0,66 | 0,00 | 0,65 | 0,01 | 0,38 | 0,00 | 0,99 |
34 | 0,101 | 9,857 | 0,00 | 0,68 | 0,00 | 0,68 | 0,23 | 0,87 | 0,00 | 0,99 |
50 | 0,048 | 20,99 | 0,00 | 0,69 | 0,00 | 0,69 | 0,10 | 0,99 | 0,00 | 0,99 |
Table 5Most relevant vibration modes and mass participation factors of the Alto do Olival tower crane (orange – most influential vibration modes and green – 90 % cumulative mass participation factor)
Modes | (s) | (Hz) | Mass Participation factor (%) | |||||||
Σ | Σ | Σ | Σ | |||||||
1 | 7,610 | 0,131 | 0,00 | 0,00 | 0,00 | 0,00 | 0,00 | 0,00 | 0,98 | 0,98 |
2 | 3,374 | 0,296 | 0,11 | 0,11 | 0,00 | 0,00 | 0,00 | 0,00 | 0,00 | 0,98 |
3 | 2,990 | 0,334 | 0,00 | 0,11 | 0,25 | 0,25 | 0,00 | 0,00 | 0,00 | 0,98 |
4 | 1,548 | 0,646 | 0,18 | 0,30 | 0,00 | 0,25 | 0,00 | 0,00 | 0,00 | 0,98 |
5 | 1,063 | 0,940 | 0,00 | 0,30 | 0,04 | 0,29 | 0,00 | 0,00 | 0,00 | 0,98 |
6 | 0,680 | 1,470 | 0,00 | 0,30 | 0,00 | 0,29 | 0,16 | 0,17 | 0,00 | 0,98 |
11 | 0,249 | 4,021 | 0,00 | 0,30 | 0,04 | 0,33 | 0,00 | 0,17 | 0,00 | 0,98 |
12 | 0,229 | 4,373 | 0,04 | 0,34 | 0,00 | 0,33 | 0,00 | 0,17 | 0,00 | 0,98 |
32 | 0,056 | 17,906 | 0,00 | 0,37 | 0,00 | 0,37 | 0,51 | 0,81 | 0,00 | 0,98 |
41 | 0,042 | 23,608 | 0,00 | 0,37 | 0,17 | 0,55 | 0,00 | 0,96 | 0,00 | 0,98 |
42 | 0,042 | 23,893 | 0,00 | 0,37 | 0,32 | 0,87 | 0,00 | 0,96 | 0,00 | 0,98 |
46 | 0,038 | 26,036 | 0,00 | 0,38 | 0,11 | 0,98 | 0,00 | 0,96 | 0,00 | 0,98 |
94 | 0,017 | 57,484 | 0,51 | 0,95 | 0,00 | 0,99 | 0,00 | 0,99 | 0,00 | 0,99 |
From the analysis of the vibration modes and their respective mass participation factors, an interesting fact is highlighted.
For the Alto do Olival tower crane, the first twelve vibration modes do not generate high percentages of excited mass (≈ 34 %) for the and translation modes; thus, the number of vibration modes under analysis has been widened to reach the minimum condition of 90 % of the excited mass of the structure. Consequently, it has been noted that the higher percentages of excited mass are associated with the structure’s base translation in each direction, and , which in turn involves the more rigid vibration modes.
Regarding the Arco do Cego tower crane, we have widened the modes under analysis, but even so, no more relevant vibration modes were identified in the structure dynamic behavior. Unlike the Alto do Olival tower crane, the mass located at the base of the structure was not even excited, which is due to the way the concrete masses are intertwined with each other, providing a steady and fixed base. In Tables 6 and 7 the results of the numerical model and the experimental test are compared.
From the analysis of the results, it is concluded that the values obtained from the in situ test reveal great quality and are close to some vibration modes in both structures, thus proving a good approximation between the numerical models and real structures.
From this comparison, the lowest errors obtained are approximately 2.6 % and 1.2 % for the AO and AC tower cranes, respectively, in the x direction, and the maximum obtained errors are approximately 10.1 % and 6.8 % in the directions (second modes). It should be noted that these maximum errors are associated with a second vibration mode in the x and y directions and as such may possibly correspond to fewer clear modes compared to the first two translation vibration modes, which does not cause a substantial influence on the model calibration. Although, the maximum error is 10,1 %, this is not an important issue as the mass participation factor is not so high and spectral values for these frequencies do not contribute much to the response of the structure as the first modes.
The following is a brief description of the most influential vibration modes in the structure behavior.
Table 6Comparison of the model and in situ frequencies (Arco do Cego)
Modes | Description | (Hz) | Error (%) | |
In situ | Model | |||
1 | Torsional | 0,145 | 0,152 | –4,7 |
2 | 1st Translational | 0,200 | 0,195 | 2,6 |
3 | 1st Translational | 0,220 | 0,209 | 4,9 |
4 | 2nd Translational | 0,610 | 0,548 | 10,1 |
5 | 2nd Translational | 0,580 | 0,576 | 0,7 |
12 | Vertical Translational | 1,500 | 1,510 | –0,8 |
17 | Translational (Tower 2nd mode) | 2,960 | 2,760 | 6,7 |
20 | Translational (Tower 2nd mode) | 3,200 | 3,380 | –5,5 |
Table 7Comparison of the model and in situ frequencies (Arco do Olival)
Modes | Description | (Hz) | Error (%) | |
In situ | Model | |||
2 | 1st Translational | 0,300 | 0,296 | 2,9 |
3 | 1st Translational | 0,330 | 0,334 | 3,0 |
4 | 2nd Translational | 0,690 | 0,646 | –3,8 |
5 | 2nd Translational | 0,895 | 0,940 | 4,8 |
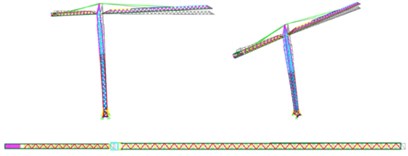
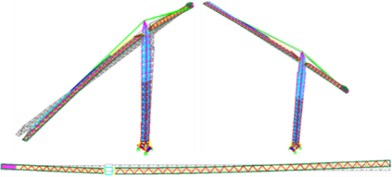
3.4.1. 1st Vibration mode
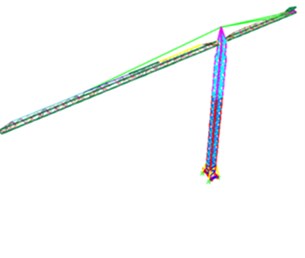
The first vibration modes of the Arco do Cego tower crane (Fig. 12) correspond to a torsional mode with a period of 6.59 sec, a mass participation factor of 92 %, and Alto do Olival a period of 7.61 sec and a mass participation factor of 98 %.
As shown in Fig. 12, the structural movement corresponds to a rotation of both jibs around the tower axis, guaranteeing a high percentage of excited mass.
Fig. 121st Vibration mode: Torsion around the tower axis
a) Arco do Cego
b) Alto do Olival
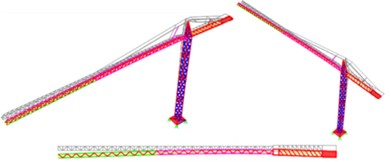
3.4.2. 2nd Vibration mode
The second vibration modes of the two cranes (Fig. 13) represent the vibration of the structure in the direction, that is, in the direction of the jibs, with a period of 5.14 s and a mass participation factor of 37 % and with a period of 3.37 s and a mass participation factor of 11 %, respectively.
Unlike the first vibration mode, this mode has a reduced percentage of excited mass. However, the Arco do Cego tower crane has a higher percentage, which is associated with the existence of a heavier counterweight and the fact that it has larger dimensions.
Fig. 132nd Vibration mode: Translation in the x direction
a) Arco do Cego
b) Alto do Olival
3.4.3. 3rd vibration mode
The cranes’ third vibration mode (Fig. 14) is characterized by a translation in the y direction, the direction transverse to the jibs, with a period of 4.78 s and a mass participation factor of 54 % and with a period of 2.99 s and a mass participation factor of 25 %.
Once again, it is verified that the Arco do Cego tower crane has a higher percentage of excited mass due to the greater presence of mass of this tower crane for both the entire structure and the counterweight.
Fig. 143rd Vibration mode: Translation in the y direction
a) Arco do Cego
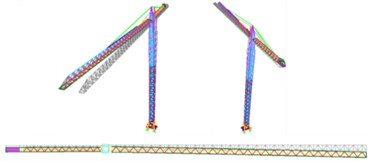
b) Alto do Olival
3.4.4. 4th Vibration mode
The crane’s fourth vibration mode (Fig. 15) is characterized by a translation in the direction, the direction transverse to the jibs, with a period of 1.82 s and a mass participation factor of 22 % and with a period of 1.55 s and a mass participation factor of 18 %.
Fig. 154th Vibration mode: translation in the x direction
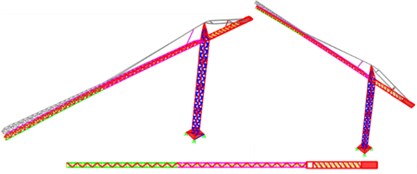
a) Arco do Cego
b) Alto do Olival
3.4.5. 5th vibration mode
The crane’s fifth vibration mode (Fig. 16) is characterized by a translation in the direction, the direction transverse to the jibs, with a period of 1.74 s and a mass participation factor of 3 % and with a period of 1.06 s and a mass participation factor of 4 %.
The following vibration modes have a higher influence on the dynamic behavior of the tower crane since they concentrate mainly on the mass excitation located at the base of the structure. These types of modes occur only in the Alto do Olival, and one must take into consideration the high discrepancy between the mass of the base of the structure and the rest of it.
Thus, the dynamic behavior of a tower crane is largely dependent on the way its base is designed.
Fig. 165th vibration mode: translation in the y direction
a) Arco do Cego
b) Alto do Olival
3.4.6. 42nd and 94th vibration modes (Alto do Olival Tower Crane)
The 42nd vibration mode (Fig. 17(a)) represents a translation of the structure base in the direction with a period of 0.042 s, and a mass participation factor of 32 % and the 94th vibration mode (Fig. 17(b)) is characterized by a translation of the base of the structure in the direction with a period of 0.017 s and a mass participation factor of 51 %.
These modes represent rather rigid modes with a considerable excited mass percentage.
As a result, it is critical to not neglect the influence of these last rigid vibration modes on the dynamic behavior of the structure. This type of mode is important for all cranes which stand on rails and may move under moderate to strong loads.
Fig. 17a) 42nd vibration mode: translation of the concrete ballasts in the x direction and b) 94th vibration mode: translation of the concrete ballasts in the y direction
a)
b)
3.4.7. The frequency of the Hanging Chain to support carrying loads
The optical technique allowed the computation of the lower frequency of the 8.25 m hanging chain and compare the values with the theoretical model as developed by several authors in the 18th century and summarized by Lamb in 1925 [18]. According to this author the differential equation of motion is solved by Bessel Functions and the period for the first mode is , where in (sec); in (m); – gravity acc in (m/s2), in contrast to the simple pendulum which gives . The optical measurement gives exactly the value proposed by the formula: 4.70 sec, attesting the use of optical techniques for these flexible structures.
4. Actions and structural response
4.1. Actions
The structures were analyzed for seismic and wind action plus dead load. In terms of dead loads, the crane is only subjected to its own weight, i.e., when it is not carrying any load.
4.1.1. Wind action
The wind action was defined based on the national standard [1], depending on the characteristics of the location where the crane was installed: in an urban area, zone (A) and with an aerodynamic roughness of terrain (I).
The wind pressures, , on the structural elements are calculated using the characteristic values of the dynamic wind pressure, , to be applied to the structure, depending on the height above the ground and the corresponding force coefficients of tower-shaped structures with a square or triangular base, cross-sections, cables, etc:
As the jib is loose and able to rotate freely around the tower axis, the wind action is only applied in the structure in the direction. We are not analyzing an event of very intense and prolonged gusts of wind when jibs may not have enough time to align in the direction of the wind action. This adverse situation may result in the collapse of the structure or part of it.
4.1.2. Seismic action
The seismic action is defined in terms of a response spectrum, and the response is computed by linear dynamic analysis. The structure is located in Lisbon and fixed on soil type B, which corresponds to a value of 1.35. According to the National Annex [18], type I and type II seismic actions correspond to maximum reference accelerations of 1.5 m/s2 and 1.7 m/s2 and to seismic zones 1.3 and 2.3, respectively (RP = 475 years). The dumping ratio was considered equal to 2 %. The horizontal components of seismic action were defined at the same time as 100 % in one direction and 30 % in the transversal direction, and vice versa.
4.1.3. Combination of actions
According to EN 1993-3-1 [19], there are different classes of reliability, and the structure under analysis falls into class 3, as it is built in urban locations, where its failure is likely to cause injury or loss of life. Therefore, the partial safety factors are and .
The verification of the ultimate limit states of resistance were taken following the combinations of actions [20] of wind and seismic action. The fundamental combination relating to a persistent or transient design situation is given by:
The values of the and factors were obtained from Table A1.2 (B) in EC-0 [20]. The general format of the action effects due to seismic design situations should be:
4.2. Structural analysis
Based on each type of combination of actions, the action effects in each structural member on the base reactions and the resistance of the restraints that prevent the movement of the tower crane base of Alto do Olival tower crane were evaluated. As it is supported on rails, to prevent translation of foundations, we added steel profiles welded to the rails. Tables 8 and 9 present the maximum displacements of the jib and counter-jib tips due to seismic and wind action.
Table 8Maximum displacements at the jib and counter-jib of the Arco do Cego tower crane
Location | Load | Displacement (m) |
Jib | Seismic Type II | 3,19 |
Wind | 3,80 | |
Counter-jib | Seismic Type II | 1,70 |
Wind | 2,09 |
Table 9Maximum displacements at the jib and counter jib of the Alto do Olival tower crane
Location | Load | Displacement (m) |
Jib | Seismic Type II | 0,44 |
Wind | 0,58 | |
Counter-jib | Seismic Type II | 0,32 |
Wind | 0,38 |
As seen, not only does the Arco do Cego tower crane have substantially higher displacements than the Alto do Olival tower crane, which is normal regarding the higher lengths of the former but also, in general, the wind action tends to be the more critical. The high displacement values are three times larger than the values of displacements obtained for a daily operational loading.
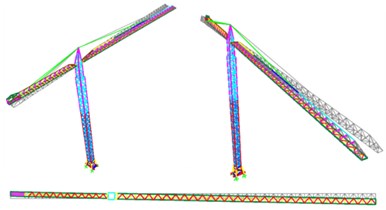
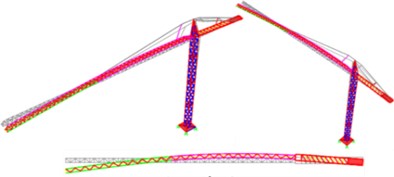
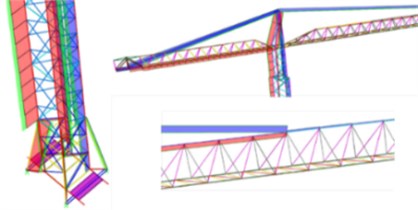
In terms of forces, it is observed that while the axial forces prevail in the members of the structure, shear forces and bending moments are negligible, as expected in a truss structure (Fig. 18).
Fig. 18Axial forces in different structural members (red and green – compression and blue – tension)
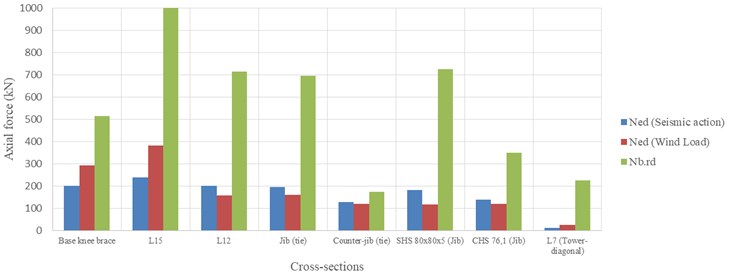
Therefore, we evaluated and compared the design effects and resistance of some cross-sections of both tower cranes (Figs. 19 and 20). In the case of a steel structure, the influence of the bending lengths and the reduction coefficients according to the possible directions are fundamental and must be taken into account [21]. Fortunately, a tower crane consists of modules of small lengths between vertical profiles.
From Figs. 19 and 20 presented above, the following conclusions can be obtained:
– The wind action effects are higher than those of seismic action in the tower cross-sections (SHS 140×140×8, diagonal – 100×50, base knee brace, L15 and L7) of both tower cranes; only in the L12 cross-section does the seismic action cause a higher axial force;
– In the jib cross-sections (SHS 90×90×5, SHS 70×70×4, CHS 60.3, CHS 42.4, RHS 300×150×12.5, SHS 80×80×5 and CHS 76.1) [16] of both tower cranes, the seismic action effects are higher than those of wind action;
– Regarding the suspension of steel cables, in general, the seismic action is also superior to that of wind, except for the Alto do Olival tower’s counter-jib, where the effects between wind and seismic activity are very similar;
– In general, the design values of the actions at the Arco do Cego crane are higher than those at the Alto do Olival crane, which is normal, taking into account the difference in geometry, weight, etc.
Fig. 19Arco do Cego tower crane security analysis for several sections
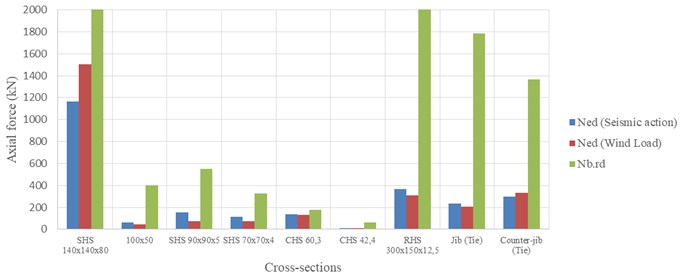
Fig. 20Alto do Olival tower crane security analysis for several sections
As shown in Fig. 21, the cross-sections of both structures in the most critical zones always meet the safety requirements (ratios below 1.0). It means that these structures can stand about 20 % more loads than the ones selected for analysis.
Fig. 21Tower crane security analysis ratios for most critical sections
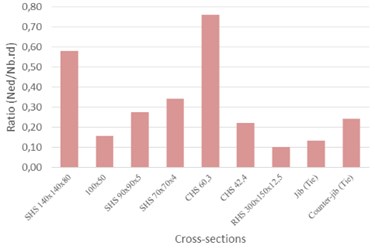
a) Arco do Cego
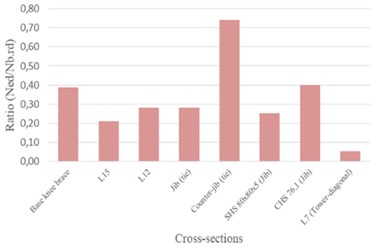
b) Alto do Olival
From the analysis of the base reactions for the Alto do Olival tower crane that is standing on wheels, we can conclude that the wind has a greater affect than the seismic action (Table 10) and that the restraints, made of welded steel profiles, have a higher resistance than the effects due to both actions (Table 11).
Table 10Base reactions due to seismic action and wind action
Combination of actions | Base reactions | |
(kN) | (kN) | |
Seismic | 32 | 33 |
Wind | 25 | 42 |
Table 11Safety check of the welded steel profiles of the rails (restraints)
(kN) | (kN) | Check? | Ratio (%) |
42 | 477 | Yes | 8.8 |
4.3. A few test measurements for checking deformations
From all results obtained in this Section, we confirm the large deformations of these structures under moderate seismic and wind loads attesting their flexibility. These numbers were confronted with values provided by the analytical model for current operational conditions (a point load at the tip of the jib) and by optical inspection during some loading transportation. Not entering in details, the transport of large loads and sometimes the drop or hitting of these loads provoke large displacements compatible with the analytical results. We did not check local instability in the heavier loaded elements, but for larger actions we may have problems.
5. Frequencies and behavior observed in other tower cranes
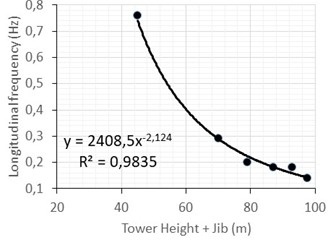
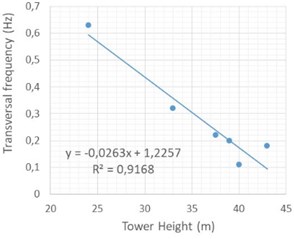
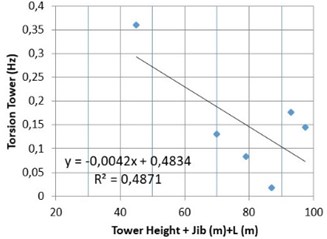
To verify the trend in frequencies as a function of the size of the crane, we tested four more structures in situ with different dimensions. Table 12 presents a summary of the main geometric characteristics of all six tested cranes used in the Lisbon building rehabilitation sites and the first two frequencies in the longitudinal direction and in the transverse and torsional modes. Fig. 22 shows the correlation of the first longitudinal frequency with the addition of the tower height and jib length. A power law effectively fit the first longitudinal frequency for cranes with total lengths between 45 and 100 m. In the transversal direction, a linear correlation with tower height is also quite good and can as well be used by designers as a proxy for estimating the frequencies of these types of cranes. For the tower mode torsion, height is not the only parameter of dependence because maximum load (ballast) also enters in the rotational inertia.
Table 12Main characteristics of several cranes already subjected to in situ measurements
Location | Tower crane | Tower height (*) | Jib length (m) | Maximum load (ton) | Base width (m) | (Hz) | (Hz) | (Hz) | (Hz) |
Alto do Olival | Potain | 33 | 37 | 3 | 1,20 | 0,29 | 0,84 | 0,32 | 0,131 (**) |
CM Pátria 1 | Soima – SGT City | 24 | 21 | 2 | 1,16 | 0,76 | 1,54 | 0,63 | 0,36 |
CM Pátria 2 | GRU – 1250 CTY | 40 | 39 | 6 | 1,20 | 0,20 | 0,71 | 0,11 | 0,083 |
Entre Campos | Potain – MC85A | 43 | 50 | 5 | 1,20/1,60 | 0,18 | 0,61 | 0,18 | 0,176 |
Arco do Cego | Potain – MD175A | 37,5 | 60 | 8 | 1,60 | 0,20 | 0,61 | 0,22 | 0,145 |
Alto do Olival 1 | IberGRU | 36 | 50 | 12 | 1,60 | 0,18 | - | 0,2 | (***) |
(*) – from ground till jib plane; (**) – analytical; (***) – optical device | |||||||||
Fig. 22Correlation between the tower crane frequencies and length: a) longitudinal (tower height + jib); b) transversal (tower height); c) torsional (tower height + jib)
In summary:
1. We used six cranes being in operation at construction sites to perform measurements with acceleration transducers previously tested to be sure that we were in presence of instrumentation capable of identifying very low frequencies of vibration as these cranes exhibit.
2. Two out of the six cranes were selected for a linear analysis and frequencies and mode shapes were compared with the in-situ observations.
3. Due to the large flexibility of these structures, for one crane we also used an optical measurement capable of easily identify the first frequencies of vibration under wind loads and certain more critical situations in the operation.
We also checked the internet to seek information from video cameras after earthquakes or strong winds. After some research on YouTube films, some footage was found [22] regarding the dynamic response of a tower crane located in Puebla, Mexico, similar to Entre Campos, under the Mexico, September 19th, 2017 earthquake (Mag = 7.1) in which we observed the vibration in the jib direction (longitudinal) with a frequency of approximately 0.4 Hz from the street below, and high displacements were clearly visible (larger than 1 m). The ground motion may have a spectral value of 0.5 g at 2.0 secs [23], easily exciting those long period modes (Fig. 23).
Fig. 23Snapshot of the motion of the tower crane during the Mexico M7.1 earthquake on September 19, 2017 [22]
![Snapshot of the motion of the tower crane during the Mexico M7.1 earthquake on September 19, 2017 [22]](https://static-01.extrica.com/articles/21649/21649-img41.jpg)
Even considering that this information is approximate, as was observed from YouTube sequences taken during that event, both the frequency of the first longitudinal mode and total displacement at the top of the jib are in good agreement with the results of the present research.
A further Youtube video camera obtained in the recent M7.8 earthquake of Samos-Izmir of 30 October 2020, showed a port-crane of a few tens of meters height in an industrial complex to move horizontally at a rail foundation more than 0.5 m with a frequency of 0.3-0.4 Hz, when shaken by a PGA 1.2 m/s2, once gain identifying the tendency for these structures to move if not well anchored to the foundation [24].
6. Conclusions
The most relevant issues of this study are as follows:
1) First, a collection of information was indispensable for the modeling of each structure in question. However, there was a lack of detailed information regarding the precise dimensions of the steel cross-sections and their connections; as such, field visits and photographic records were carried out, which allowed us to reduce the uncertainties related to the characteristics of both structures to some extent.
2) Next, it is with the performance of a dynamic identification test based on ambient vibrations that one has had the opportunity to calibrate the numerical model, thus matching it to the real structure. Not only was a set of results obtained with great clarity through the test, but they also came close to a large part of the vibration frequency characteristics of the model. A maximum error of 4.9 % and 3.0 % was thus obtained for the first two modes of translation vibration in the and directions, respectively, for the Arco do Cego and Alto do Olival tower cranes.
3) In the next phase, the most relevant vibration modes of the structure and their dynamic characteristics were described. The most flexible vibration mode of each structure corresponds to a torsional mode around the tower axis with periods of 6.59 sec and 7.61 sec for the Arco do Cego and Alto do Olival tower cranes, respectively.
4) In general, both structures can be considered flexible, taking into account the first vibration modes that have frequencies below 0.5 Hz. However, in the Alto do Olival tower crane case, only in the higher frequency modes were considerable percentages of excited mass found. This is due to the concentration of most of the mass at the base of the structure, which is not truly well connected. As such, the design of the tower crane base can greatly influence its dynamic behavior.
5) In the analysis and safety check, the structures carrying no load were subjected to regulatory moderate seismic action through a response spectrum (maximum reference acceleration -PGA- of 1.5 m/s2 and 1.7 m/s2 with different spectrum) and to wind loads characteristic of an urban area (surrounded by buildings). On the one hand, it was verified that the seismic action ended up being more conditioning than the wind action in some zones and less in others; on the other hand, not only was the resistance of the cross-sections of the structure always greater than the action effects but the Alto do Olival base reactions were also lower than the weld resistance at the ground level.
6) As a recommendation, it is qualitatively pointed out that for the cases in which concrete ballasts located at the base of the structure are not properly confined, this can lead to sliding of these elements during the seismic action and collapse of the structure.
7) For the types and dimensions of the two tower cranes analyzed in detail plus four other measured cranes, it was possible to obtain a good correlation between the total length of the tower plus jib and the frequencies of vibration. However, this change is quite significant for other geometries, and it is difficult to extrapolate this law to other types of tower cranes. Consequently, new measurements of other tower crane typologies are necessary to obtain confidence in the models being used.
Further studies include (i) the analysis of crane performance in areas with higher seismic, especially for ground motion with low frequency content, and wind action; (ii) the analysis of different cranes of similar morphology but with other dimensions to check if the present conclusions can be extended to other cranes; and (iii) the influence of loads and the pendulum interaction in the response.
References
-
Regulamento de Segurança e Acções para Estruturas de Edifícios e de Pontes. DL nº 235/83 de 31 de Maio. Porto Editora, 1983, (in Portuguese).
-
Takanashi S., Adachi H., Nakanishi M. Study on seismic performance of tower cranes for construction. AIJ Journal of Technology and Design, Vol. 13, Issue 26, 2007, p. 415-420, (in Chinese).
-
World-Wide Tower Crane Accident Statistics 2000-2010. Weathervain International Cranes, 2010, http://towercranesupport.com/tower_crane_accidents.php.
-
Ju F., Choo Y. S., Cui F. S. Dynamic response of a tower crane induced by the pendulum motion of the payload. International Journal of Solids and Structures, Vol. 43, 2006, p. 376-389.
-
Abhar H. N. Dynamic Analysis of the Tower Crane. M.Sc. Thesis, Universiti Malaya, 2012.
-
Karpe A., Karpe S., Chawrai A., Vankar S. R. Validation of use of FEM (ANSYS) for structural analysys of tower crane jib and static and dynamic analysis of tower crane jib using ANSYS. International Journal of Innovative Research in Advanced Engineering, Vol. 1, Issue 4, 2014, p. 69-75.
-
Stölzner M., Kleeberger M., Moll M., Fottner J. Investigation of the Dynamic Loads on Tower Cranes during Slewing Operations. Proceedings of the 10th International Conference on Simulation and Modeling Methodologies, Technologies and Applications, Vol. 1, 2020, p. 59-67.
-
Alămoreanu M., Vasilescu A. Dynamic response of anchored tower cranes under sinusoidal damped seismic action. Case study. Romanian Journal of Acoustics and Vibration, Vol. 11, Issue 1, 2014.
-
Gu Y. Q., Wang W. F., Guo S. D. Analysis on tower crane under wind load by ANSYS. Vibration, Structural Engineering and Measurement II (ICVSEM2012), Shangai, China, 2012.
-
Gu Y. Q., Mao C. F. The preliminary analysis on tower crane by earthquake effect. Applied Mechanics and Materials, Vol. 353-356, 2013, p. 1892-1895.
-
Li-Jeng H., Hong-Jie S. Seismic response analysis of tower cranes using SAP2000. Procedia Engineering, Vol. 79, 2014, p. 513-522.
-
ISO 11031:2016. Cranes: Principles for seismically resistant design, 2016, www.iso.org/standard/46588.html.
-
EN 14439 (prEN 14439). European Committee for Standardization: Cranes – Tower cranes, 2018.
-
Shen T., Yan W. M., Zhou D. X., et al. TMD control and analysis of cranes under earthquake. Technology for Earthquake Disaster Prevention, Vol. 12, Issue 2, 2017, p. 276-287.
-
Tarak L., El Badawy A., Schulte H. Modeling and control of tower crane motions”, Report, German University in Cairo (GUC) and University of Applied Sciences Berlin (HTW), 2019.
-
TST55-Celsius_355_NH_TechnicalGuide: “Structural Hollow Sections”. 2020, https://www.bing.com/search?q=TST55-Celsius_355_NH_TechnicalGuide&cvid =666872eb835b489c9eaf6526bf4430fd&FORM=ANAB01&PC=U531.
-
CSI, Computer & Structures, SAP2000: Finite Element Analysis and Design of Structures, 2013.
-
CEN (2010), EN – 1998-1:2010. Eurocode 8 – Design of Structures for Earthquake Resistance. General Rules, Seismic Actions and Rules for Buildings. European Committee for Standardization, 2010.
-
CEN (1993), EN 1993-3-1 Eurocode 3 – Design of steel structures – Part 3-1: Towers, Masts and Chimneys – Towers and Masts. European Committee for Standardization, 1993.
-
CEN (2002), EN 1990:2002 Eurocode – Basis of structural design. European Committee for Standardization, 2002.
-
CEN (1993), EN 1993-1-1 Eurocode 3 – Design of steel structures – Part 1-1: General Rules and Rules for Buildings. European Committee for Standardization, 1993.
-
México de 7.1 Grados || 19 de Septiembre de 2017 - Bing video - min(10:23-10:42), https://www.bing.com/videos/search?q=Sismo+do+Mexico+de+17+Setembro+de+2017&&view=detail&mid=EEE492FE8EB331C21E7FEEE492FE8EB331C21E7F&rvsmid=598D8534C1C070D427A5598D8534C1C070D427A5&FORM=VDQVAP.
-
Jaimes M. A. Personal Communication, 2020.
-
Terremoto Turquía 30/10/2020 (Compilado HD), (Industrial & moving crane 1:16-2:02). https://www.youtube.com/watch?v=Z5hdlZpx5-4&t=261s.
About this article

