

Hepatic steatosis assessment using ultrasound homodyned-K parametric imaging: the effects of estimators
Introduction
Hepatic steatosis is a condition where excess fat accumulate within the hepatocytes. It is a key manifestation of non-alcoholic fatty liver disease (NAFLD). The prevalence of NAFLD is increasing worldwide due to the increase of the epidemics of obesity and type 2 diabetes (1). NAFLD may progress to non-alcoholic steatohepatitis (NASH), causing chronic inflammation of the liver parenchyma, which may develop into a fibrosis, a cirrhosis, or a liver cancer. Therefore, the early detection of hepatic steatosis is of crucial importance.
Liver biopsy is currently the clinical gold standard for hepatic steatosis assessment. However, liver biopsy is invasive and associated with sampling errors. Medical imaging has become a noninvasive alternative to liver biopsy; major modalities are computed tomography (CT), magnetic resonance (MR) spectroscopy, MR imaging, and ultrasound imaging (2). MR spectroscopy has been accepted as the noninvasive reference standard for hepatic steatosis quantification (2,3). However, MR and CT are expensive with limited availability, while CT involves the use of radiation. Compared to CT and MR, ultrasound imaging has such advantages as low cost, wide availability, and real-time capability (4-6). Ultrasound has been recommended as a first-line diagnostic test for the management of NAFLD (7).
Ultrasound imaging involves a transducer transmitting ultrasound waves into a tissue. The incident waves interact with the tissue and the transducer receives backscattered signals. B-mode ultrasound imaging, which is based on the amplitude of the envelope of beamformed radiofrequency (RF) signals, is frequently used in the clinical routine for assessing hepatic steatosis. Additionally, B-mode ultrasound image processing techniques, such as deep learning (8), have been explored for characterizing hepatic steatosis. However, B-mode ultrasound is qualitative and can be affected by factors including image post-processing parameters, such as the dynamic range. Quantitative ultrasound (QUS) (9) aims to extract quantified acoustic parameters from the backscattered RF signals for ultrasound tissue characterization. QUS techniques have been proposed to assess hepatic steatosis, including speed of sound (10,11), ultrasound attenuation (12-14), backscatter coefficient (13,14), and shear-wave dispersion (14,15).
Acoustically, a liver tissue can be modeled as a collection of ultrasound scatterers (16). The backscattered ultrasound signals are the spatial summation of the scattered waves contributed by each scatterer. QUS envelope statistics (17) extracts statistical information of the envelope of backscattered RF signals and is related to liver tissue microstructures. Envelope statistics techniques have shown potential for characterizing hepatic steatosis (18-23).
The homodyned-K (HK) distribution is considered as a statistical model of backscattered ultrasound signals whose parameters have a physical meaning (9,24). The HK model has been applied to characterizing cell pellet biophantoms (25), tissue phantom heated by focused ultrasound (26), reperfused infarcted porcine myocardium in vivo (27), mice breast cancer in vivo (28), human breast lesions in vivo (29,30), response of advanced human breast cancer to neoadjuvant chemotherapy in vivo (31), cancerous human lymph nodes ex vivo (32), porcine red blood cell aggregation ex vivo (33), human carotid artery plaque in vivo (34), human skin ulcer ex vivo (35), lateral epicondylosis of human elbows in vivo (36), NASH of rats in vivo (37), and hepatic steatosis of rabbits ex vivo (38) and rats in vivo (20).
However, the feasibility of the HK model in detecting human hepatic steatosis in vivo remains unknown. There are two recent HK estimators: (I) a level-curve method that uses the signal-to-noise ratio (SNR), skewness, and kurtosis based on the fractional moments of the envelope (this method is termed “RSK” hereinafter) (39); and (II) an estimation method based on the first moment of the intensity and two log-moments, namely X- and U-statistics (this method is termed “XU” hereinafter) (40). A previous study (40) showed that for simulated data samples, the XU estimator yielded the lowest root-mean-square error (RMSE) for estimating the HK parameter μ, while the RSK estimator yielded the lowest RMSE for estimating the HK parameter k. However, the effects of HK parameter estimators on human hepatic steatosis assessment are unclear. In this paper, we proposed using ultrasound HK parametric imaging to characterize human hepatic steatosis in vivo. We also investigated the effects of the two recent HK estimators, RSK and XU. Liver donors and patients were recruited and scanned using ultrasound for parametric imaging and analysis. The stages of hepatic steatosis were identified using hydrogen 1 (1H) proton MR spectroscopy (i.e., 1H-MRS) and histological findings. The clinical results revealed that both the RSK and XU estimators based HK parametric imaging is capable to characterize human hepatic steatosis in vivo. In the next sections, the theory and experimental methods are described in detail. The results are then presented to discuss the physical meanings of HK parametric imaging in fatty liver detection.
Theory
HK distribution
The HK distribution of backscattered ultrasound envelope A is defined by the following probability density function (PDF) (41,42):
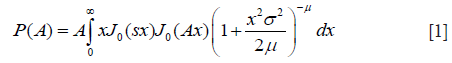
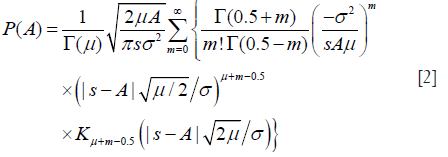
where J0(·) is the zeroth-order Bessel function of the first kind; s2 and 2σ2 are the coherent and diffuse backscattered signal energies, respectively; μ represents the effective number of scatterers per resolution cell; is the gamma function; Ki is the modified ith-order Bessel function of the second kind. The derived parameter k = s/σ describes the periodicity of scatterer distribution. Figure 1 illustrates the PDFs of HK for different values of μ and k, with σ =1.

RSK estimator
The SNR R, skewness S, and kurtosis K of backscattered ultrasound envelope A are defined as (39,43)
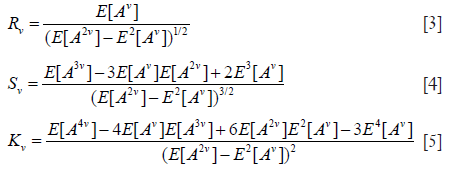
where v is an arbitrary positive number; E[.] denotes the expectation operator. Moments of order v of the HK distribution are given by (39,44)

where J(k,u,v) is defined by
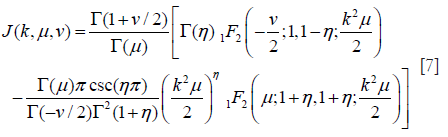
where pFq(a1,..,ap;b1,..,bq;c) denotes the generalized hypergeometric series; η = μ + 0.5v.
Substituting Eq. [6] into Eqs. [3,4,5] yields expressions for Rv, Sv, and Kv that are functions of only the two HK model parameters, namely μ and k (39). Parameter estimation of μ and k is performed by equating estimates of R, S, and K from the backscattered ultrasound envelope with the theoretical values predicted by the HK distribution. Then, parameter estimates are obtained by finding level curves in the two-dimensional parameter space (39,44). The optimal pair of moments is found to be (39).
XU estimator
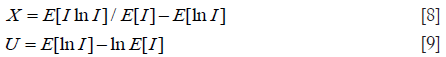
Let I denote the intensity of backscattered signals; I = A2. The mean intensity represents the total signal power: . The XU estimator is based on three statistics: , X-statistics, and U-statistics. X- and U-statistics are defined as (40)
The task of the XU estimator is to solve the following nonlinear system of equations:

Here, UHK and XHK are defined as
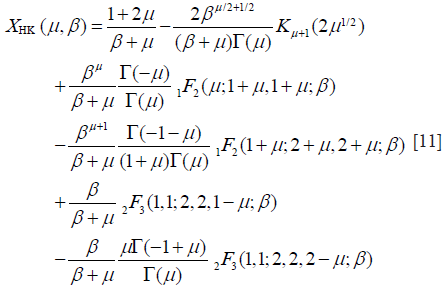
and
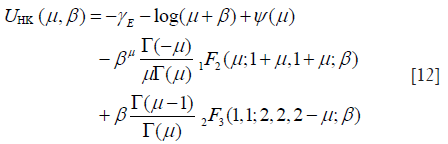
where β = s2/(2σ2); γE is the Euler constant; ψ(.) is the digamma function. Then, the XU estimator becomes , subject to:
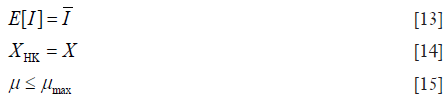
Here, μmax denotes the upper limit for the value of μ.
HK μ parametric imaging
Ultrasound parametric imaging provides visualization of backscattered statistics for tissue characterization. In this study, the sliding window technique was employed for constructing ultrasound μ images. We chose the μ parameter for parametric imaging instead of using k because the μ parameter is more sensitive for detecting hepatic steatosis (20,38). Previous studies demonstrated that μ increases with increasing grade of hepatic steatosis (20,38). The algorithm illustrated in Figure 2 consists of the following steps. (I) RF signals are demodulated to obtain an envelope image. A square window within the uncompressed envelope image is used to acquire local backscattered data to estimate the values of μ, which are assigned as the new pixels located in the center of the window. (II) The window is controlled to move on the entire range of the envelope data in distance increments; each increment is determined by the number of pixels corresponding to a window overlap ratio (WOR), and steps (I) and (II) are repeated to yield the μ parametric maps. (III) The μ parametric maps are processed with digital scan conversion and color mapping to produce the μ parametric images. The size of the square sliding window is determined by the window side length (WSL). In this study, the RSK and XU estimators based μ (denoted by μRSK and μXU) parametric images were constructed.

Methods
Study populations
This study was approved by the Institutional Review Board of Chang Gung Memorial Hospital at Linkou. All participants signed informed consent forms, and experimental methods were performed in accordance with the Helsinki Declaration. The study population was divided into two groups: groups A and B. In group A, a total of 72 liver donors were enrolled (n=72). In group B, 204 patients with confirmed chronic hepatitis B infection scheduled for liver biopsy or partial liver resection were enrolled (n=204).
Hepatic fat fraction (HFF) measurements using 1H-MRS
The liver donors recruited in Group A underwent 1H-MRS examination using a 1.5-T MR scanner (GE Signa HDXT, Waukesha, WI, USA). Sagittal, coronal, and axial slices encompassing the whole liver were obtained to locate the spectroscopy acquisition voxel. A single voxel of 8 cm3 (2×2×2 cm3) was placed within the right liver lobe to avoid major vascular structures and subcutaneous fat tissue (45). The water-suppressed spectrum was acquired using the abdomen surface coil after shimming over the volume of interest by using a point-resolved spectroscopy sequence (TR: 3,000 ms, TE: 40 ms, sample points: 2,048, bandwidth: 2,500 Hz, 4 averages). Non-water-suppressed data with same scanning parameters were acquired for quantification (2 averages). The spectrum was analyzed using the LCModel software package (46). The signal intensities of the fat peaks at 0.9, 1.3, and 1.6 ppm were quantified using the water suppression mode. The HFF was defined as fat/(fat+water) and expressed as a percentage.
Histological analysis
In group B, liver resections (removal of the tumors) or percutaneous liver biopsies were performed. For patients scheduled for liver resection, the specimen taken for histological examination was located far from the primary lesion (>1 cm). For patients that underwent liver biopsy, the specimen was taken from the right liver lobe through an intercostal approach. All specimens were placed in formalin for preparations of histological examinations. Samples were fixed in paraffin, stained with hematoxylin–eosin, and read on-site by expert liver pathologists. Samples that had a minimum of six portal tracts were considered adequate for histological evaluation (47). Hepatic steatosis was graded according to the scheme outlined by Brunt et al. (48): normal (steatosis involving <5% of hepatocytes), mild (5–33%), moderate (33–66%), and severe (>66%).
Ultrasound scanning
Before 1H-MRS or histological examinations, the subjects underwent standard-care ultrasound examinations. A clinical ultrasound scanner (Model 3000, Terason, Burlington, MA, USA) with a 3-MHz central frequency convex-array transducer (Model 5C2A, Terason) was used. The transducer has 128 elements and a pulse length (PL) of approximately 2.3 mm. For each participant, five valid scans of the liver parenchyma (without acoustic shadowing artifacts or major vessels in the region of analysis) were obtained from the right intercostal space by a gastroenterologist, who was blinded to the 1H-MRS and histological findings. The focus and depth of the ultrasound imaging were set at 4 and 8 cm, respectively. Raw image data consisting of 128 scan lines of backscattered signals at a sampling frequency of 30 MHz were obtained using the software kit provided by Terason. Offline data processing was performed using the MATLAB software (version R2014a, MathWorks, Inc., Natick, MA, USA).
B-mode and parametric imaging
The envelope image was formed using the Hilbert transform of backscattered signals. A B-mode image was constructed using the logarithm-compressed envelope image with a dynamic range of 40 dB. The uncompressed envelope data were used for HK μ parametric imaging (WSL =1–9 PLs). All parametric images were based on a WOR of 50% in a compromise between image resolution and computational time. A quantitative measure was obtained by manually outlining a region of interest (ROI) on the B-scan, which was then applied to the corresponding μ images to calculate the average of the image pixel values within the ROI, including μRSK and μXU parameters. To the best of our knowledge, no standard rules on how to determine an ROI for the quantitative analysis of a clinical liver ultrasonography can be found. However, we suggest the following basic criteria: (I) use a relatively small ROI to locate on the same position of liver parenchyma. A small ROI easily excludes vessels to reduce the bias of analyzing liver parenchyma. (II) Locate the ROI at the focal zone, reducing the effects of attenuation and diffraction on the image analysis.
Statistical analysis
The Pearson correlation coefficient r and probability value P were calculated to evaluate the correlation between the μ parameter and the HFF (P<0.05 was considered statistically significant). A receiver operating characteristic (ROC) curve analysis using the 95% confidence interval (CI) was performed to calculate the area under the ROC (AUROC) in diagnosing each stage of fatty liver. All statistical analyses were conducted using the SigmaPlot software (v 12.0, Systat Software, Inc., CA, USA).
Results
Figures 3 and 4 show typical B-mode images as well as μRSK and μXU parametric images of different HFFs measured using MRS. As the HFF increases, the brightness of the B-mode image increases, whereas the shading of the μRSK and μXU images changes significantly. Figures 5 and 6 show the correlations between log10(HFF) and the μ parameter. The correlation coefficient (P value) between log10(HFF) and μRSK was 0.0938 (P<0.0001), 0.498 (P<0.0001), 0.592 (P<0.0001), 0.560 (P<0.0001), 0.579 (P<0.0001), 0.536 (P<0.0001), 0.534 (P<0.0001), 0.523 (P<0.0001) and 0.467 (P<0.0001) for WSL =1, 2, 3, 4, 5, 6, 7, 8 and 9 PLs, respectively. In the same range of WSL, the correlation coefficient (p value) between log10(HFF) and μXU was 0.628 (P<0.0001), 0.622 (P<0.0001), 0.623 (P<0.0001), 0.572 (P<0.0001), 0.563 (P<0.0001), 0.584 (P<0.0001), 0.542 (P<0.0001), 0.530 (P<0.0001) and 0.480 (P<0.0001), respectively.


For group B, the histological examination revealed the cases of different stages of fatty liver: normal =80; mild =70; moderate =36; severe =18. Figures 7 and 8 present results from the ROC analysis employed to diagnose different stages of hepatic steatosis using μRSK and μXU. The AUROCs obtained using μRSK for fatty stages ≥ mild (AUROC1), ≥ moderate (AUROC2), and ≥ severe (AUROC3) were (AUROC1, AUROC2, AUROC3) = (0.56, 0.57, 0.53), (0.68, 0.72, 0.75), (0.73, 0.78, 0.80), (0.74, 0.77, 0.79), (0.74, 0.78, 0.79), (0.75, 0.80, 0.82), (0.74, 0.77, 0.83), (0.74, 0.78, 0.84) and (0.73, 0.76, 0.83) for WSL =1, 2, 3, 4, 5, 6, 7, 8 and 9 PLs, respectively. The AUROCs obtained using μXU for fatty stages ≥ mild, ≥ moderate, and ≥ severe were (AUROC1, AUROC2, AUROC3) = (0.75, 0.83, 0.81), (0.74, 0.80, 0.80), (0.76, 0.82, 0.82), (0.74, 0.80, 0.84), (0.76, 0.80, 0.83), (0.75, 0.80, 0.84), (0.75, 0.79, 0.85), (0.75, 0.80, 0.85) and (0.73, 0.77, 0.83) for WSL =1, 2, 3, 4, 5, 6, 7, 8 and 9 PLs, respectively.


Discussion
Significance of this study
The HK distribution is an important statistical model for ultrasound backscatter envelope statistics. Table 1 summarizes ultrasound tissue characterization with the HK distribution. Although the HK model has shown potential for characterizing hepatic steatosis of rabbits ex vivo (38) and rats in vivo (20), the feasibility for assessing human hepatic steatosis in vivo remains unclear. To the best of our knowledge, this study is the first to investigate human hepatic steatosis assessment in vivo using the HK μ parametric imaging. The results showed that both the μRSK and μXU parametric imaging is feasible for assessing human hepatic steatosis in vivo.

Full table
Effects of estimators and sliding window sizes on hepatic steatosis assessment
Refer to Table 1 again. It can be seen that a comparative study of recent estimators (RSK and XU) on hepatic steatosis assessment has not been conducted. In addition, the effects of sliding window sizes on the μRSK and μXU parametric imaging of hepatic steatosis have not been investigated. Although WSL =3 PLs, a general rule for ultrasound Nakagami parametric imaging, was suggested for HK parametric imaging using the RSK estimator (26,30,31), the HK parameters are relatively complicated in their estimations; thus, using WSL =3 PLs for HK imaging may be problematic. Other studies, which employed the XU estimator for HK parametric imaging, used WSL =2 mm (34) or six times the dimension of the point spread function (35); whereas, the suggested window size has not been validated systematically.
In this study, we evaluated the effects of the two recent estimators (RSK and XU) and different sliding window sizes (WSL =1–9 PLs) on human hepatic steatosis characterization using the μRSK and μXU parametric imaging. For the 72 participants in Group A, the μRSK parametric imaging with WSL =2–9 PLs exhibited similar correlation with log10(HFF), and the μRSK parametric imaging with WSL =3 PLs had the highest correlation with log10(HFF) (r=0.592). Concurrently, the μXU parametric imaging with WSL =1–9 PLs exhibited similar correlation with log10(HFF), and the μXU parametric imaging with WSL = 1 PL had the highest correlation with log10(HFF) (r=0.628). Evidently, the μXU parametric imaging exhibited higher correlation with log10(HFF) than the μRSK parametric imaging did for most of the WSLs. For the 204 patients in Group B, the μRSK parametric imaging with WSL =2–9 PLs yielded similar AUROCs for diagnosing fatty stages equal to or more severe than mild, equal to or more severe than moderate and severe; the μXU parametric imaging with WSL =1–9 PLs yielded similar AUROCs for diagnosing fatty stages equal to or more severe than mild, equal to or more severe than moderate and severe. The μXU parametric imaging produced higher AUROCs than the μRSK parametric imaging did for each WSL.
The results obtained from Groups A and B indicated that: (I) the WSL had little impact on the μRSK and μXU parametric imaging for characterizing human hepatic steatosis in vivo; and (II) the μXU parametric imaging generally yielded an improved performance in characterizing human hepatic steatosis in vivo than the μRSK parametric imaging did for different WSLs.
Comparison with related work
Ghoshal et al. (38) reported that the μ parameter estimated by the RSK estimator increased with the degrees of lipid content and steatosis, using a rabbit model. However, they did not evaluate the diagnostic performance of the μ parameter parameters in predicting the hepatic steatosis. Fang et al. (20) investigated HK μ parametric imaging for characterizing different stages of hepatic steatosis in rats. They employed the estimator that used the SNR and the skewness based on the first three integer moments of the intensity (42). Tang et al. (37) proposed a random forest classifier based on HK parameters estimated by the XU estimator, in order to improve the classification of steatohepatitis with ultrasound elastography in rats. However, the related work (20,37,38) did not characterize human hepatic steatosis, and the effects of recent HK parameter estimators were not investigated. These issues have been addressed in this study. In addition, the related work (20,37,38) used a single-element transducer or a linear-array transducer (Table 1), but we used a convex-array transducer which is commonly used in clinical liver ultrasound scanning.
Effects of hepatic steatosis on HK μ parametric imaging
The basic functional unit in the liver is the liver lobule, which not only contains diffuse scatterers (hepatocytes) but also contributes the source of coherent scattering (i.e., portal triads) (49). For this reason, the liver can be treated as a scattering medium that interacts with ultrasound waves, and it can be expected that the backscattered statistics will be affected by hepatic steatosis, a structural change in the liver parenchyma. During the process of hepatic steatosis, fat-infiltrated hepatocytes play the roles of additional acoustic scatterers appearing in the liver parenchyma. In this circumstance, the waveforms of the backscattered signals are altered, and the corresponding statistical properties of echoes vary from pre-Rayleigh (backscattered statistics for healthy livers in practice) to Rayleigh distribution (hepatic steatosis) (19,50-52). Therefore, changes in the statistical properties of ultrasound backscattered signals are the primary mechanism that dominates the μ parameter to monotonically increase with increasing degree of hepatic steatosis from mild to severe stages.
Limitations and future work
Although both the μRSK and μXU parametric imaging is capable to characterize human hepatic steatosis in vivo, the diagnosing performance is yet to be improved. Out of expectations, the HK statistical distribution is a general model with specific physical meanings of ultrasound backscattering (as mentioned in Introduction), and thus we initially expected that the HK parameter would perform well in the diagnosis of hepatic steatosis. However, the current results showed that the performance of the HK model may not be better than that of other statistical approaches (21,22). Based on this viewpoint, we believe that future clinical applications of the HK model are still full of challenges. Developing new estimators for the HK model may be considered in future work. Incorporating HK μ parametric imaging with other QUS parametric imaging may also be taken into account.
Conclusions
In this paper, ultrasound HK μ parametric imaging was proposed for assessing human hepatic steatosis in vivo. Two recent estimators for the HK model, RSK and XU, were investigated. The μRSK and μXU parametric images were constructed using WSL =1–9 PLs. A total of 72 liver donors were included in group A with 1H-MRS as the reference standard, and 204 patients were included in group B with histological findings as the reference standard. Experimental results showed that both the μRSK and μXU parametric images are feasible for evaluating human hepatic steatosis. The WSL exhibits little effect on the diagnosing performance of the μRSK and μXU parametric imaging. The μXU parametric imaging provides improved performance compared to the μRSK parametric imaging in characterizing human hepatic steatosis in vivo.
Acknowledgments
The authors would like to thank the anonymous reviewer for the insightful comments and suggestions.
Funding: This work was supported in part by the Ministry of Science and Technology in Taiwan (Grant No. MOST 106-2221-E-182-023-MY3 and 108-2218-E-182-001) and the Chang Gung Memorial Hospital at Linkou in Taiwan (Grant No. CMRPD1H0381). This work was also supported in part by the National Natural Science Foundation of China (Grant No. 11804013, 61871005, 71661167001, and 61801312), the Beijing Natural Science Foundation (Grant No. 4184081), the International Research Cooperation Seed Fund of Beijing University of Technology (Grant No. 2018A15), the Basic Research Fund of Beijing University of Technology, and the Intelligent Physiological Measurement and Clinical Translation, Beijing International Base for Scientific and Technological Cooperation.
Footnote
Conflicts of Interest: The authors have no conflicts of interest to declare.
Ethical Statement: This study was approved by the Institutional Review Board of Chang Gung Memorial Hospital at Linkou. All participants signed informed consent forms, and experimental methods were performed in accordance with the Helsinki Declaration.
References
- Younossi ZM. Non-alcoholic fatty liver disease - A global public health perspective. J Hepatol 2019;70:531-44. [Crossref] [PubMed]
- Zhang YN, Fowler KJ, Hamilton G, Cui JY, Sy EZ, Balanay M, et al. Liver fat imaging-a clinical overview of ultrasound, CT, and MR imaging. Br J Radiol 2018;91:20170959. [Crossref] [PubMed]
- Kramer H, Pickhardt PJ, Kliewer MA, Hernando D, Chen GH, Zagzebski JA, et al. Accuracy of liver fat quantification with advanced CT, MRI, and ultrasound techniques: prospective comparison with MR spectroscopy. AJR Am J Roentgenol 2017;208:92-100. [Crossref] [PubMed]
- Huang Q, Wu B, Lan J, Li X. Fully automatic three-dimensional ultrasound imaging based on conventional B-scan. IEEE Trans Biomed Circuits Syst 2018;12:426-36. [Crossref] [PubMed]
- Huang Q, Zeng Z, Li X. 2.5-D extended field-of-view ultrasound. IEEE Trans Med Imaging 2018;37:851-9. [Crossref] [PubMed]
- Huang QH, Lan JL, Li XL. Robotic arm based automatic ultrasound scanning for three-dimensional imaging. IEEE Trans Industr Inform 2019;15:1173-82. [Crossref]
- European Association for the Study of the Liver, European Association for the Study of Diabetes, European Association for the Study of Obesity. EASL-EASD-EASO Clinical Practice Guidelines for the management of non-alcoholic fatty liver disease. J Hepatol 2016;64:1388-402. [Crossref] [PubMed]
- Biswas M, Kuppili V, Edla DR, Suri HS, Saba L, Marinhoe RT, et al. Symtosis: a liver ultrasound tissue characterization and risk stratification in optimized deep learning paradigm. Comput Methods Programs Biomed 2018;155:165-77. [Crossref] [PubMed]
- Mamou J, Oelze ML. Quantitative ultrasound in soft tissues. Heidelberg: Springer, 2013.
- Dioguardi Burgio M, Imbault M, Ronot M, Faccinetto A, Van Beers BE, Rautou PE, Castera L, Gennisson JL, Tanter M, Vilgrain V. Ultrasonic adaptive sound speed estimation for the diagnosis and quantification of hepatic steatosis: a pilot study. Ultraschall Med 2019. Epub ahead of print. [Crossref] [PubMed]
- Zubajlo RE, Benjamin A, Grajo JR, Kaliannan K, Kang JX, Bhan AK, et al. Experimental validation of longitudinal speed of sound estimates in the diagnosis of hepatic steatosis (part II). Ultrasound Med Biol 2018;44:2749-58. [Crossref] [PubMed]
- Fujiwara Y, Kuroda H, Abe T, Ishida K, Oguri T, Noguchi S, Sugai T, Kamiyama N, Takikawa Y. The B-mode image-guided ultrasound attenuation parameter accurately detects hepatic steatosis in chronic liver disease. Ultrasound Med Biol 2018;44:2223-32. [Crossref] [PubMed]
- Han A, Andre MP, Deiranieh L, Housman E, Erdman JW Jr, Loomba R, Sirlin CB, O'Brien WD Jr. Repeatability and reproducibility of the ultrasonic attenuation coefficient and backscatter coefficient measured in the right lobe of the liver in adults with known or suspected nonalcoholic fatty liver disease. J Ultrasound Med 2018;37:1913-27. [Crossref] [PubMed]
- Han A, Labyed Y, Sy EZ, Boehringer AS, Andre MP, Erdman JW Jr, Loomba R, Sirlin CB, O'Brien WD Jr. Inter-sonographer reproducibility of quantitative ultrasound outcomes and shear wave speed measured in the right lobe of the liver in adults with known or suspected non-alcoholic fatty liver disease. Eur Radiol 2018;28:4992-5000. [Crossref] [PubMed]
- Ozturk A, Grajo JR, Gee MS, Benjamin A, Zubajlo RE, Thomenius KE, Anthony BW, Samir AE, Dhyani M. Quantitative hepatic fat quantification in non-alcoholic fatty liver disease using ultrasound-based techniques: a review of literature and their diagnostic performance. Ultrasound Med Biol 2018;44:2461-75. [Crossref] [PubMed]
- Zhou Z, Wu W, Wu S, Jia K, Tsui PH. A review of ultrasound tissue characterization with mean scatterer spacing. Ultrason Imaging 2017;39:263-82. [Crossref] [PubMed]
- Oelze ML, Mamou J. Review of quantitative ultrasound envelope statistics and backscatter coefficient imaging and contributions to diagnostic ultrasound. IEEE Trans Ultrason Ferroelectr Freq Control 2016;63:336-51. [Crossref] [PubMed]
- Lee DH, Lee JY, Lee KB, Han JK. Evaluation of hepatic steatosis by using acoustic structure quantification US in a rat model: comparison with pathologic examination and MR spectroscopy. Radiology 2017;285:445-53. [Crossref] [PubMed]
- Zhou Z, Wu S, Lin MY, Fang J, Liu HL, Tsui PH. Three-dimensional visualization of ultrasound backscatter statistics by window-modulated compounding Nakagami imaging. Ultrason Imaging 2018;40:171-89. [Crossref] [PubMed]
- Fang J, Zhou Z, Chang NF, Wan YL, Tsui PH. Ultrasound parametric imaging of hepatic steatosis using the homodyned-K distribution: an animal study. Ultrasonics 2018;87:91-102. [Crossref] [PubMed]
- Ma HY, Zhou Z, Wu S, Wan YL, Tsui PH. A computer-aided diagnosis scheme for detection of fatty liver in vivo based on ultrasound kurtosis imaging J Med Syst 2016;40:33. [Crossref] [PubMed]
- Zhou Z, Tai DI, Wan YL, Tseng JH, Lin YR, Wu S, Yang KC, Liao YY, Yeh CK, Tsui PH. Hepatic steatosis assessment with ultrasound small-window entropy imaging. Ultrasound Med Biol 2018;44:1327-40. [Crossref] [PubMed]
- Zhou Z, Zhang Q, Wu W, Wu S, Tsui PH. Hepatic steatosis assessment using quantitative ultrasound parametric imaging based on backscatter envelope statistics. Appl Sci 2019;9:661. [Crossref]
- Destrempes F, Cloutier G. A critical review and uniformized representation of statistical distributions modeling the ultrasound echo envelope. Ultrasound Med Biol 2010;36:1037-51. [Crossref] [PubMed]
- Cristea A, Franceschini E, Lin F, Mamou J, Cachard C, Basset O. Quantitative characterization of concentrated cell pellet biophantoms using statistical models for the ultrasound echo envelope. Phys Procedia 2015;70:1091-5. [Crossref]
- Byra M, Kruglenko E, Gambin B, Nowicki A. Temperature monitoring during focused ultrasound treatment by means of the homodyned K distribution. Acta Phys Pol A 2017;131:1525-8. [Crossref]
- Hao X, Bruce CJ, Pislaru C, Greenleaf JF. Characterization of reperfused infarcted myocardium from high-frequency intracardiac ultrasound imaging using homodyned K distribution. IEEE Trans Ultrason Ferroelectr Freq Control 2002;49:1530-42. [Crossref] [PubMed]
- Oelze ML, O'Brien Jr WD, Zachary JF. Quantitative ultrasound assessment of breast cancer using a multiparameter approach. In: IEEE Ultrasonics Symposium, New York, NY, USA, 28-31 October, 2007:981-4.
- Trop I, Destrempes F, El Khoury M, Robidoux A, Gaboury L, Allard L, Chayer B, Cloutier G. The added value of statistical modeling of backscatter properties in the management of breast lesions at US. Radiology 2015;275:666-74. [Crossref] [PubMed]
- Byra M, Nowicki A, Wroblewska-Piotrzkowska H, Dobruch-Sobczak K. Classification of breast lesions using segmented quantitative ultrasound maps of homodyned K distribution parameters. Med Phys 2016;43:5561-9. [Crossref] [PubMed]
- Dobruch-Sobczak K, Piotrzkowska-Wróblewska H, Klimoda Z, Karwat P, Litniewski J, Roszkowska-Purska K, Markiewicz-Grodzicka E. Quantitative ultrasound parameters assessment of advanced breast cancer in evaluation the response to neoadjuvant chemotherapy. Eur J Cancer 2018;92:S149-50. [Crossref]
- Mamou J, Coron A, Oelze ML, Saegusa-Beecroft E, Hata M, Lee P, Machi J, Yanagihara E, Laugier P, Feleppa EJ. Three-dimensional high-frequency backscatter and envelope quantification of cancerous human lymph nodes. Ultrasound Med Biol 2011;37:345-57. [Crossref] [PubMed]
- Destrempes F, Franceschini E, Yu FT, Cloutier G. Unifying concepts of statistical and spectral quantitative ultrasound techniques IEEE Trans Med Imaging 2016;35:488-500. [Crossref] [PubMed]
- Roy-Cardinal MH, Destrempes F, Soulez G, Cloutier G. Assessment of carotid artery plaque components with machine learning classification using homodyned-K parametric maps and elastograms. IEEE Trans Ultrason Ferroelectr Freq Control 2019;66:493-504. [Crossref] [PubMed]
- Omura M, Yoshida K, Akita S, Yamaguchi T. Verification of echo amplitude envelope analysis method in skin tissues for quantitative follow-up of healing ulcers. Jpn J App Phys 2018;57:07LF15.
- Bureau NJ, Destrempes F, Acid S, Lungu E, Moser T, Michaud J, Cloutier G. Diagnostic accuracy of echo envelope statistical modeling compared to B-mode and power Doppler ultrasound imaging in patients with clinically diagnosed lateral epicondylosis of the elbow. J Ultrasound Med 2019. [Epub ahead of print]. [Crossref] [PubMed]
- Tang A, Destrempes F, Kazemirad S, Garcia-Duitama J, Nguyen BN, Cloutier G. Quantitative ultrasound and machine learning for assessment of steatohepatitis in a rat model. Eur Radiol 2019;29:2175-84. [Crossref] [PubMed]
- Ghoshal G, Lavarello RJ, Kemmerer JP, Miller RJ, Oelze ML. Ex vivo study of quantitative ultrasound parameters in fatty rabbit livers. Ultrasound Med Biol 2012;38:2238-48. [Crossref] [PubMed]
- Hruska DP, Oelze ML. Improved parameter estimates based on the homodyned K distribution. IEEE Trans Ultrason Ferroelectr Freq Control 2009;56:2471-81. [Crossref] [PubMed]
- Destrempes F, Poree J, Cloutier G. Estimation method of the homodyned K-distribution based on the mean intensity and two log-moments. SIAM J Imaging Sci 2013;6:1499-530. [Crossref] [PubMed]
- Jakeman E, Tough RJA. Generalized K distribution: a statistical model for weak scattering. J Opt Soc Am A 1987;4:1764-72. [Crossref]
- Dutt V, Greenleaf JF. Ultrasound echo envelope analysis using a homodyned K distribution signal model. Ultrason Imaging 1994;16:265-87. [Crossref] [PubMed]
- Prager RW, Gee AH, Treece GM, Berman LH. Analysis of speckle in ultrasound images using fractional order statistics and the homodyned k-distribution. Ultrasonics 2002;40:133-7. [Crossref] [PubMed]
- Martin-Fernandez M, Cardenes R, Alberola-Lopez C. Parameter estimation of the homodyned K distribution based on signal to noise ratio. In: IEEE Ultrasonics Symposium, New York, NY, USA, 28-31 October, 2007:981-4.
- Xia MF, Yan HM, He WY, Li XM, Li CL, Yao XZ, Li RK, Zeng MS, Gao X. Standardized ultrasound hepatic/renal ratio and hepatic attenuation rate to quantify liver fat content: an improvement method. Obesity (Silver Spring) 2012;20:444-52. [Crossref] [PubMed]
- Provencher SW. Estimation of metabolite concentrations from localized in vivo proton NMR spectra. Magn Reson Med 1993;30:672-9. [Crossref] [PubMed]
- Huang Y, Wang Z, Liao B, Liang JY, Zhou LY, Wang F, Li W, Liu JY, Xie XY, Lu MD, Liu GJ, Wang W. Assessment of liver fibrosis in chronic hepatitis B using acoustic structure quantification: quantitative morphological ultrasound. Eur Radiol 2016;26:2344-51. [Crossref] [PubMed]
- Brunt EM, Janney CG, Di Bisceglie AM, Neuschwander-Tetri BA, Bacon BR. Nonalcoholic steatohepatitis: a proposal for grading and staging the histological lesions. Am J Gastroenterol 1999;94:2467-74. [Crossref] [PubMed]
- Tsui PH, Zhou Z, Lin YH, Hung CM, Chung SJ, Wan YL. Effect of ultrasound frequency on the Nakagami statistics of human liver tissues. PLoS ONE 2017;12:e0181789. [Crossref] [PubMed]
- Liao YY, Yang KC, Lee MJ, Huang KC, Chen JD, Yeh CK. Multifeature analysis of an ultrasound quantitative diagnostic index for classifying nonalcoholic fatty liver disease. Sci Rep 2016;6:35083. [Crossref] [PubMed]
- Wan YL, Tai DI, Ma HY, Chiang BH, Chen CK, Tsui PH. Effects of fatty infiltration in human livers on the backscattered statistics of ultrasound imaging. Proc Inst Mech Eng H 2015;229:419-28. [Crossref] [PubMed]
- Son JY, Lee JY, Yi NJ, Lee KW, Suh KS, Kim KG, Lee JM, Han JK, Choi BI. Hepatic steatosis: assessment with acoustic structure quantification of US imaging. Radiology 2016;278:257-64. [Crossref] [PubMed]

