

Photoacoustic imaging for the evaluation of early tumor response to antivascular treatment
Introduction
Tumor vessels provide nutrients to tumors and transport metabolites that contribute to growth, invasion, and metastasis. Tumor vessels are different from normal vessels in both their structure and function and tend to be dilated, tortuous, distorted, and disorganized (1). At present, the purpose of antiangiogenic drugs in clinical treatment is to inhibit tumor neovascularization and destroy existing vessels to produce a state of fewer vessels and decreased nutrition in tumors, with the goal of starving the tumor cells to death. However, excessive inhibition of angiogenesis increases the hypoxic state of the tumor microenvironment. In addition, damage to the microvascular system affects the delivery of oxygen and chemotherapeutic drugs to the tumor, thereby reducing the effects of radiotherapy and chemotherapy.
In view of these clinical problems, Jain proposed the theory of “vessel normalization”, which suggests that certain antiangiogenic agents can transiently “normalize” the abnormal structure and function of tumor vessels to increase the efficiency of oxygen and drug delivery (2). Appropriate antiangiogenic drugs can normalize immature, ineffective vessels (“disordered vessels”). In this process, the vascular structure becomes regular, the basement membrane becomes intact, the perivascular supporting cells increase, the interstitial pressure decreases, and the oxygen content and the amount of drug that can reach the interior of the tumor increase (3). Many angiogenic molecules and genes are involved in the development and normalization of abnormal tumor vessels. However, tumor antiangiogenic therapy can increase hypoxia in the tumor (4). Thus, a noninvasive imaging method is needed to evaluate tumor responses after antiangiogenic therapy and to monitor the balance of vascular normalization and hypoxia. At present, there are no effective imaging methods to predict and evaluate these factors. Thus, this problem in clinical antiangiogenic therapy warrants further study.
Monitoring the effectiveness of antiangiogenic treatments has become increasingly important for converting new therapies from benchtop to bedside and for assessing therapeutic effects in individual patients (5). Currently, the imaging techniques used in the clinic mainly include computed tomography (CT), magnetic resonance imaging (MRI) and positron emission tomography (PET). Conventional imaging methods rely mainly on measuring the size of the tumor in order to evaluate the response to treatment. Functional imaging modalities are applied to detect or measure changes in tumor metabolism, blood flow and vascular permeability. CT perfusion imaging and functional MRI have been investigated as possible methods for imaging tumor angiogenesis (6). Although CT perfusion imaging plays a role in angiogenesis imaging, exposure of the patients to radiation makes this method unsuitable for continuous dynamic assessment. PET can be used to visualize tumor angiogenesis, but measurements made with this modality are expensive and require the use of radioisotopes (7). Functional MRI, especially dynamic contrast-enhanced MRI, has been used to evaluate the effects of antiangiogenic treatment by reflecting vessel permeability and can be useful for monitoring temporal vascular changes in tumors after antiangiogenic therapy (8). However, this modality requires the use of contrast agents and increases the risk of gadolinium deposition in the brain (9), making the method unsuitable for repeat examinations.
Photoacoustic imaging (PAI) is an emerging hybrid technique that combines the high contrast of optical imaging with the high spatial resolution of ultrasound. When tissue is exposed to short laser pulses, regional thermoelastic expansion and ultrasound signals are produced. These signals pass through the tissue and can be collected by ultrasound detectors at the surface of the tissue (10). This technique is a relatively low-cost imaging modality that can provide real-time, noninvasive imaging without the use of exogenous contrast medium. Endogenous photoacoustic signals generated by hemoglobin can provide structural and functional information about the hemodynamics of blood vessels in vivo and allow the effective evaluation of tumor vascular permeability (11,12). Among the three PAI imaging modes of acoustic resolution—photoacoustic microscopy (AR-PAM), optical resolution-PAM (OR-PAM) and photoacoustic computed tomography (PACT)—PACT has the lowest longitudinal spatial resolution (13,14), and OR-PAM has the shallowest imaging depth (15-17). Because tumors in mice are moderately thick and have small blood vessels, AR-PAM is suitable for monitoring tumor blood vessels in mice due to its moderate spatial resolution and imaging depth. This novel functional imaging modality may prove valuable in evaluating tumor vasculature. Thus, we conducted this study to evaluate whether PAI can potentially be used to assess vascular regression, normalization and tumor hypoxia after anti-vascular treatment.
Methods
Tumor models
All the experimental protocols and animal handling were conducted in strict accordance with the guidelines of our institutional animal ethics committee. Thirty female BALB/c mice (5–6 weeks old and weighing 18–20 g) were purchased from Dashuo Experimental Animal Co., Ltd. (Chengdu, China). Xenograft tumors were induced in mice using 4T1 breast cancer cells. Mouse 4T1 mammary carcinoma cells were cultured with RPMI-1640. The culture medium was supplemented with 10% fetal bovine serum and 1% antibiotics-antimycotics. Approximately 5.3×10⁶ cells in 200 µL of phosphate-buffered saline (PBS) were inoculated subcutaneously on the back of the hip. Seven days after implantation, tumor-bearing mice (with tumors ~5–8 mm in diameter) were randomly divided into low-dose (10 mg/kg), high-dose (20 mg/kg) and vehicle groups. Each mouse in the experimental groups was administered intraperitoneal bevacizumab only once. Mice in the control group were administered the same dose of saline intraperitoneally. Tumor volume (V) was calculated as V=0.5×a×b2, where a is the longer and b is the shorter of two perpendicular diameters measured with calipers.
PAI
The raw PAI data in this study were obtained by an in vivo laboratory-built acoustic resolution–photoacoustic microscopy (AR-PAM) image acquisition system. A detailed description of the system can be found in a previous study (18). The system described in the literature was modified slightly for this study; pulsed lasers of 760 and 840 nm were used, and the pulsed laser source was replaced with a wavelength-tunable optical parametric oscillator (OPO) laser (Surelite OPO, Continuum USA) pumped by a neodymium-doped yttrium aluminum garnet (Nd:YAG) laser (Surlite I-20, Continuum, USA). In the AR-PAM experiments, the scanning step size was set to 0.1 mm, and a total of 22,400 datum points measuring 140×160 were collected for each mouse model. All mice were anesthetized with 1% pentobarbital sodium (70 mg/kg) by intraperitoneal injection. Tumor xenografts were located in the center of the scan field, and ultrasound gel was inserted between the skin and the imaging window at the bottom of the water cuvette. The body temperature and respiration rates of the mice remained unchanged during the scans. Dual-wavelength data acquisition was completed in 40 minutes. The control and treatment groups were imaged at day 0 (baseline) and on 5 consecutive days from day 1 to 5 after bevacizumab administration.
Image processing
The photoacoustic 3D scan data of each mouse were saved on a hard drive. After the experiment was complete, the original data were processed by using MATLAB software (MathWorks Inc., USA). The A-line ultrasound signal of each scanning position was subjected to Hilbert transformation, and the absolute value was used. Finally, the maximum value of the processed A-line signal was mapped to each acquisition location to obtain a maximum amplitude projection (MAP) image (13).
The MAP image pixel values of the 760 and 840 nm wavelengths were corrected by the pulse laser energy fluctuations collected with a photodiode detector. The following formulas were applied to obtain an image of total hemoglobin (HbT) content distribution, i.e., a blood volume distribution image:
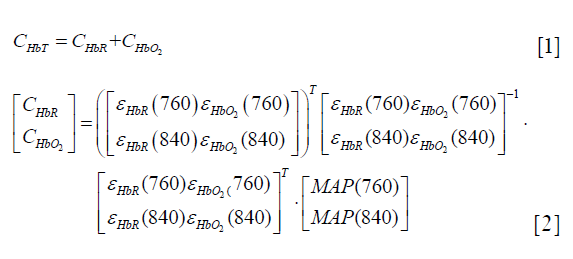
In formula (2),  and
and  are the molar extinction coefficients of deoxygenated hemoglobin (HbR) at wavelengths of 760 and 840 nm, respectively, and
  and
and  are those of oxygenated hemoglobin (HbO2) at wavelengths of 760 nm and 840 nm, respectively (19).
In each PAI parameter image, an area of 20×20 pixels on the same side of the tumor was selected as the region of interest (ROI), and the mean pixel value of the ROI was calculated. The ROI used for the calculation was obtained by selecting an area of the same size and shape and at the same location of the tumor as that observed during daily imaging. The PAI signal intensity of the mouse before bevacizumab injection (day 0) was used as a baseline to calculate the relative changes on each day after injection of the drug. The formula is as follows: rPAIi = PAIi/PAI0 × 100% (i=1–5, corresponding to day 1 to 5 after the injection of the drug).
Histological examination
Hematoxylin and eosin (HE) staining was used to observe necrosis. CD31 was used as a marker of endothelial cells, and α-smooth muscle actin (α-SMA) was used as a marker of perivascular cells. Mice from each group were euthanized before and on days 1, 3, and 5 after bevacizumab treatment. Tumors were fixed in 4% neutral formalin and then sliced into 4-µm thick sections after dehydration and paraffin embedding. Pimonidazole {1-[(2-hydroxy-3-piperidinyl)-propyl]-2-nitroimidazole} was used as a marker of tumor hypoxia (20). Pimonidazole (Hypoxyprobe™-1) was dissolved in 0.9% sodium chloride and administered intraperitoneally at a dose of 60 mg/kg. After 60 minutes of circulation, tumor-bearing mice were sacrificed, and tumors were harvested. To visualize the hypoxic tumor areas, slices were immunostained with the Hypoxyprobe-1-FITC-conjugated antibody (#MAb1; Hypoxyprobe Inc.).
Immunohistochemical image analysis
The slides were viewed with an Olympus BX51 microscope (Olympus Inc., Tokyo, Japan). For quantitative analysis, the number of stained cells per high-power field (HPF, 40×) was scored in 3 different fields per mouse. The mean intensity values in each group were calculated with Image-Pro Plus 6.0 software (Media Cybernetics, Rockville, USA). The vessel maturation index (VMI) was calculated as the ratio of α-SMA-stained vessels (pericyte coverage) compared to CD31-stained vessels (21).
Statistical analysis
Continuous measurement data are presented as the mean ± standard error of the mean (SEM). All statistical comparisons were performed using one-way ANOVA to test for differences among the groups. Correlations between each PAI parameters and histological findings were also investigated by Pearson correlation coefficients analysis. The data were analyzed with SPSS 23.0 software (IBM Corp., USA), and P<0.05 was considered statistically significant.
Results
Tumor volume
Mice that died or had no applicable established xenograft tumors were excluded. The remaining mice were divided into a low-dose bevacizumab group (n=6), a high-dose bevacizumab group (n=6) and a control group (n=7), when the tumor volume reached 80–120 mm3. No significant differences in tumor volume were observed on day 0 among the three groups (P>0.05) (93.86±4.52 mm3 for the low-dose group, 111.89±1.58 mm3 for the high-dose group and 102.91±6.18 mm3 for the control group). The percentage change in the tumor volume on day 5 relative to day 0 was increased by 2.83% in the low-dose group, 2.04% in the high-dose group (the lowest percentage change among the groups, P<0.05), and 3.12% in the control group.
PAI
Using the AR-PAM system, complete imaging data for 5 consecutive scans were obtained for 3 mice per group. As a noninvasive imaging technique, PAI can clearly identify the vessels surrounding tumors without the use of exogenous contrast agents. Representative images collected in each group for 5 consecutive days and the selected areas used for quantitative analysis are shown in Figure 1.

Overall, the signal intensities of MAP 760, HbT and HbR in the treatment groups decreased after bevacizumab injection from day 1 to 5, especially in the high-dose group (Figure 2). The HbT levels in the treatment groups gradually decreased from day 1 to 2 (relative to the values in the control group, P>0.05) and decreased significantly relative to the control group levels from day 3 to 5 (P<0.05). The high-dose group had lower HbT levels than the low-dose group from day 1 to 5, but the differences were not statistically significant (P>0.05). The HbR levels in the treatment group decreased from day 1 to 5 after treatment. The high-dose group had significantly decreased HbR levels relative to the control group from day 1 to 5 (P<0.05). The low-dose group also showed a gradual and significant decrease in HbR levels on day 3 (P<0.05). MAP 760 values decreased significantly in the treatment groups relative to the control group from day 1 to 5 (P<0.05), except on day 2 in the low-dose group (P>0.05). MAP 840 values in the treatment groups gradually decreased over time, and on days 4 and 5, the values were decreased significantly in the treatment groups relative to the control group (P<0.05). In the low- and high-dose groups, the parameters of HbO2 and oxygen saturation (sO2) were not significantly different from those in the control group from day 1 to 5 (P>0.05).

Histology
Histological analysis further validated the PAI findings after antiangiogenic therapy. No necrotic areas in tissues from the treatment or control groups were observed after HE staining. Evaluation of pimonidazole staining showed that tumor hypoxia was not significantly different among the groups on day 0. Tumor hypoxia was significantly increased in the treatment groups on day 1 relative to day 0 (P<0.05), especially in the high-dose group. Hypoxia was decreased on days 3 and 5 in the low-dose group (10.92±0.92 and 8.17±1.9, P=0.317), whereas it continuously increased over time in the high-dose group. Significantly more hypoxia was observed in the high-dose group than in the low-dose group (17.60±1.20 and 20.33±0.47, compared with low-dose group P<0.05). On day 5, no significant differences in hypoxia were found between the low-dose and control groups (P=0.266). Positive staining for pimonidazole manifested as scattered brown areas of various sizes inside the tumor tissue (Figure 3).

To assess the maturation state, immunofluorescence staining for CD31 and α -SMA was performed (Figure 4). At baseline (day 0), no significant differences were observed among the low-dose, high-dose and the control groups in terms of CD31 (P=0.993) or α-SMA staining (P=0.982). CD31 staining was decreased in the low-dose group relative to the control group on day 1 (decreased by 34.05%, P=0.067) and day 3 (decreased by 45.27%, P=0.180), and the decrease in CD31 staining in the low-dose group persisted on day 5 (decreased by 71.41%, P=0.000). CD31 staining decreased to a greater extent in the high-dose group than in the low-dose group, and relative to the control group, the high-dose group exhibited greatly decreased CD31 staining on day 1 (decreased by 61.64%, P=0.007), day 3 (decreased by 85.64%, P=0.028) and day 5 (decreased by 86.50%, P=0.000), with the greatest decrease observed on day 5. Less α-SMA staining was observed in the bevacizumab treatment groups than in the control group at all observed time points (P<0.05). Although the differences in α-SMA staining between the low-dose and high-dose groups were not significant (P>0.05 at all time points), the increase in α-SMA staining was higher in the low-dose group than in the high-dose-group from day 3 to 5. In the high-dose group, VMI continually decreased from day 1 to 5 (relative to the control group P<0.05). In contrast, in the low-dose group, VMI was decreased on day 1 but increased on day 3 and 5 relative to the control values, and on day 5, VMI was higher in the low-dose group than in the high-dose group (P<0.05). In the high-dose group, hypoxia showed significant correlations with VMI (r=−0.84, P=0.001) and CD31 (r=−0.71, P=0.01). However, in the low-dose group, hypoxia did not correlate with these parameters. The immunofluorescence data demonstrated that the bevacizumab-treated groups, especially the high-dose group, had reduced tumor vascular density and that the low-dose group had increased pericyte coverage and improved vascular maturation. These results validate the effectiveness of the noninvasive PAI technique. The overall downward trends of HbT and HbR in the treatment groups indicated that bevacizumab treatment caused vascular degeneration in the tumor. Furthermore, the decreasing trends in HbT and HbR were more pronounced in the high-dose group than in the low-dose group, indicating that the effect of bevacizumab on vascular degeneration is dose-dependent. The larger the dose was, the greater the therapeutic effect. In addition, in the low-dose group, HbT showed a slight increase between days 2 and 3, indicating that low-dose bevacizumab produced a transient vascular normalization effect on the tumor, whereas high-dose bevacizumab did not.

In the high-dose group, hypoxia showed negative correlations with HbT (r=−0.71, P=0.010), HbR (r=−0.82, P=0.001), MAP 760 (r=−0.80, P=0.002), and MAP 840 (r=−0.62, P=0.030). In the low-dose group, hypoxia did not correlate with these parameters. In the high-dose group, CD31 showed positive correlations with HbT (r=0.58, P=0.050), HbR (r=0.73, P=0.008), and MAP 760 (r=0.68, P=0.014). In the low-dose group, CD31 showed positive correlations with HbT (r=0.73, P=0.007), HbR (r=0.60, P=0.038), MAP 760 (r=0.73, P=0.007), and MAP 840 (r=0.68, P=0.015). In the high-dose group, VMI showed positive correlations with MAP 760 (r=0.66, P=0.019) and HbR (r=0.70, P=0.012). In the low-dose group, VMI did not correlate with any of the PAI parameters.
Discussion
Angiogenesis is one of the principal features of cancer, and antiangiogenic therapy plays an increasingly important role in cancer therapy. Monitoring the efficacy of antiangiogenic therapy is increasingly important for translating new therapies to the clinic and for assessing the efficacy of these therapies in individual patients (5). Histopathological biopsy is invasive, and sampling variability precludes this approach from being used for long-term monitoring and evaluating treatment responses (22). Therefore, exploring noninvasive quantitative imaging techniques is necessary to provide functional imaging markers of treatment responses. PAI is an emerging imaging approach for detecting tumor vessels that has a higher resolution than is offered by other vascular imaging techniques, such as MRI, CT or PET (23). To the best of our knowledge, this is the first work to use PAI for early and continuous observation of antiangiogenic responses with different doses in tumor-bearing mice.
Vascular endothelial growth factor (VEGF) is a well-known angiogenic factor and is essential for the development of vasculature; it stimulates the formation of new vessels and increases vessel permeability (24). Bevacizumab is an anti-VEGF humanized monoclonal antibody that is widely used as an antiangiogenic drug in the clinic. Anti-VEGF treatment is dose-dependent, and high-dose or long-term treatment can lead to excessive vascular pruning and impaired vascular efficiency (25). In this study, the monitoring of oxygenation in tumors after antiangiogenic treatment with PAI revealed that the HbT and HbR contents of the tumors decreased continuously for 5 days after treatment, especially in the high-dose group. The changing values of these parameters in PAI indicated vascular regression. Immunofluorescence confirmed these findings, showing a rapid decrease in CD31 in treated tumors that was apparent as early as day 1 posttreatment and that lasted for several days. As the dose of antiangiogenic treatment increased, the decrease in CD31 staining became more pronounced. In addition, the PAI parameters HbT and HbR of PAI were positively correlated with CD31. This result suggests that PAI can potentially detect bevacizumab-induced vasculature regression in vivo and facilitate the observation of changes in tumor blood vessels during treatment. The extent and duration of tumor vessel regression are related to the therapeutic dose.
Vascular normalization has become increasingly important in antiangiogenic therapy. Appropriate doses of antiangiogenic treatment can transiently normalize tumor blood vessels, increasing blood flow and reducing interstitial fluid pressure, thereby improving drug delivery (26). The effectiveness of antiangiogenic therapy may vary with the duration of treatment, and low-dose antiangiogenic agents can improve blood perfusion and oxygenation (27). Bohndiek et al. found that photoacoustic tomography could be used to evaluate vessel normalization in response to antiangiogenic therapy, and the results were correlated with serum biomarkers and histopathology (28). In the current study, VMI, as an indicator of vascular normalization, was decreased on day 1 after low-dose antiangiogenic therapy but then gradually increased thereafter, whereas VMI did not increase in the high-dose group. The gradual increase in VMI from day 3 to day 5 in the low-dose group indicated that the tumor vessels gradually became mature and that the vasculature began to normalize. PAI detected changes in VMI, and associations between VMI and various PAI parameters were observed in the high-dose group but not in the low-dose group. Although we did not confirm that PAI can be used to directly evaluate vascular normalization, we confirmed that this modality can be used to evaluate vascular maturity, as performed in the high-dose group. One possible reason for this phenomenon is that we did not observe the tumors with PAI for a sufficient length of time. PAI contrast agents could be used to enhance blood vessel contrast, which might achieve better results; this possibility requires further investigation.
Tumor hypoxia is a crucial aspect of the tumor microenvironment (29). Approximately 50–60% of solid tumors are estimated to contain hypoxic zones, which are often associated with therapeutic resistance, an invasive phenotype, and high metastatic potential (30). The main reason for tumor hypoxia is that oxygen cannot diffuse into areas with low vascularization (diffusion-limited areas) or that oxygen flow is temporarily impeded due to obstruction of blood flow (perfusion restriction) (31). Tumor heterogeneity can lead to different hypoxic regions within the tumor. In our study, hypoxyprobe revealed hypoxic regions scattered within the tumors. As the oxygen supply is governed by blood perfusion, in this study, the hypoxic state inside the tumor was found to be increased after antiangiogenic treatment, and the changes in the high-dose group were more pronounced than those in the low-dose group. The increased hypoxic state following treatment was due to the obstruction of tumor blood vessels and vascular regression, as confirmed by immunofluorescence for CD31. The blood vessels in the high-dose group were more severely damaged and regressive than those in the low-dose group. This vessel damage led to severe hypoxia within the tumor, and the hypoxic state continued until the fifth day of observation, as observed via continuous PAI. The photoacoustic signal gradually decreased from day 1 to 5 after treatment.
In these experiments, although we observed no significant changes in HbO2 and sO2 in response to treatment, HbR and HbT were found to reflect the changes in vessels after antiangiogenic therapy. In theory, the vessels will regress to varying degrees after anti-angiogenesis therapy, a phenomenon that was observed in our study. The PAI parameters were reflective of changes in the tumor vasculature, including vessel regression in the high-dose group and vascular maturation in the low-dose group. Furthermore, we found that PAI can be used to assess tumor hypoxia after treatment. In this study, the imaging time for each mouse in the experiment was approximately 40 minutes, which is lengthy for both tumor studies and clinical applications. In future research, the following measures should be taken to reduce the imaging time: use of a laser with a higher repetition rate; an increase in the scanning step size and/or reduction in the imaging area. This study had some limitations. First, the sample size was relatively small, with only 3 mice per subgroup in the treatment and control groups completing 5 consecutive days of AR-PAM. Second, in the AR-PAM process, although we consistently fixed the tumors in the same position for imaging, due to the slow growth of the tumors, the imaging position may have shifted among the time points. Third, this study relied solely on morphological CD31 and α-SMA to determine the maturity of blood vessels and did not include other biomarkers, such as serologic markers, to determine the normalization of blood vessels.
Conclusions
Our findings suggest that PAI markers can be used to monitor early responses to anti-vascular therapies and to assess changes in tumor hypoxia in vivo. Suitable doses of antiangiogenic agents in solid tumors can be adjusted with PAI to achieve vascular normalization and regression.
Acknowledgements
Funding: This study was supported by the National Natural Science Foundation of China (81703155, 81460264 and 81760316), the Yunnan Applied Basic Research Projects-KMU Joint Special Project [2017FE468 (-071)] and Yunnan Health Training Project of High Level Talents (H-2017005).
Footnote
Conflicts of Interest: The authors have no conflicts of interest to declare.
Ethical Statement: All the experimental protocols and animal handling were conducted in strict accordance with the guidelines of our institutional animal ethics committee.
References
- Lewis MR. Looking through the vascular normalization window: timing antiangiogenic treatment and chemotherapy with (99m)Tc-annexin A5. J Nucl Med 2011;52:1670-2. [Crossref] [PubMed]
- Jain RK. Normalization of tumor vasculature: an emerging concept in antiangiogenic therapy. Science 2005;307:58-62. [Crossref] [PubMed]
- Jain RK. Normalizing tumor microenvironment to treat cancer: bench to bedside to biomarkers. J Clin Oncol 2013;31:2205-18. [Crossref] [PubMed]
- De Bock K, Mazzone M, Carmeliet P. Antiangiogenic therapy, hypoxia, and metastasis: risky liaisons, or not? Nat Rev Clin Oncol 2011;8:393-404. [Crossref] [PubMed]
- Ehling J, Lammers T, Kiessling F. Non-invasive imaging for studying anti-angiogenic therapy effects. Thromb Haemost 2013;109:375-90. [Crossref] [PubMed]
- Zhang J, Wang R, Lou H, Zou Y, Zhang M. Functional computed tomographic quantification of angiogenesis in rabbit VX2 soft-tissue tumor before and after interventional therapy. J Comput Assist Tomogr 2008;32:697-705. [Crossref] [PubMed]
- Iagaru A, Gambhir SS. Imaging tumor angiogenesis: the road to clinical utility. AJR Am J Roentgenol 2013;201:W183-91. [Crossref] [PubMed]
- Yang J, Liao C, Liu Y, Yang G, Ke T, Ding Y, Li Q. MR imaging biomarkers evaluating vascular normalization window after anti-vessel treatment. Oncotarget 2017;9:11964-76. [PubMed]
- McDonald RJ, McDonald JS, Kallmes DF, Jentoft ME, Murray DL, Thielen KR, Williamson EE, Eckel LJ. Intracranial Gadolinium Deposition after Contrast-enhanced MR Imaging. Radiology 2015;275:772-82. [Crossref] [PubMed]
- Bar-Zion A, Yin M, Adam D, Foster FS. Functional Flow Patterns and Static Blood Pooling in Tumors Revealed by Combined Contrast-Enhanced Ultrasound and Photoacoustic Imaging. Cancer Res 2016;76:4320-31. [Crossref] [PubMed]
- Xiao W, Ruan S, Yu W, Wang R, Hu C, Liu R, Gao H. Normalizing Tumor Vessels To Increase the Enzyme-Induced Retention and Targeting of Gold Nanoparticle for Breast Cancer Imaging and Treatment. Mol Pharm 2017;14:3489-98. [Crossref] [PubMed]
- Rich LJ, Seshadri M. Photoacoustic imaging of vascular hemodynamics: validation with blood oxygenation level-dependent MR imaging. Radiology 2015;275:110-8. [Crossref] [PubMed]
- Jiang H. Photoacoustic Tomography. Boca Raton, Florida: CRC Press, 2015;131-134.
- Wang LV, Hu S. Photoacoustic tomography: in vivo imaging from organelles to organs. Science 2012;335:1458-62. [Crossref] [PubMed]
- Chen Q, Guo H, Jin T, Qi W, Xie H, Xi L. Ultracompact high-resolution photoacoustic microscopy. Opt Lett 2018;43:1615-8. [Crossref] [PubMed]
- Jin T, Guo H, Jiang H, Ke B, Xi L. Portable optical resolution photoacoustic microscopy (pORPAM) for human oral imaging. Opt Lett 2017;42:4434-7. [Crossref] [PubMed]
- Qin W, Jin T, Guo H, Xi L. Large-field-of-view optical resolution photoacoustic microscopy. Opt Express 2018;26:4271-8. [Crossref] [PubMed]
- Yang J, Wu D, Tang Y, Jiang H. Photoacoustic microscopy of electronic acupuncture (EA) effect in small animals. J Biophotonics 2017;10:217-23. [Crossref] [PubMed]
- Optical absorption of hemoglobin [database on the Internet]1999. Available online: http://omlc.org/spectra/hemoglobin/. Accessed: June 30, 2018.
- Rofstad EK, Maseide K. Radiobiological and immunohistochemical assessment of hypoxia in human melanoma xenografts: acute and chronic hypoxia in individual tumours. Int J Radiat Biol 1999;75:1377-93. [Crossref] [PubMed]
- Sorace AG, Quarles C, Whisenant J, Hanker A, McIntyre J, Sanchez V, Yankeelov T. Trastuzumab improves tumor perfusion and vascular delivery of cytotoxic therapy in a murine model of HER2+ breast cancer: preliminary results. Breast Cancer Res Treat 2016;155:273-84. [Crossref] [PubMed]
- Zhang W, Chen HJ, Wang ZJ, Huang W, Zhang LJ. Dynamic contrast enhanced MR imaging for evaluation of angiogenesis of hepatocellular nodules in liver cirrhosis in N-nitrosodiethylamine induced rat model. Eur Radiol 2017;27:2086-94. [Crossref] [PubMed]
- Mallidi S, Luke GP, Emelianov S. Photoacoustic imaging in cancer detection, diagnosis, and treatment guidance. Trends Biotechnol 2011;29:213-21. [Crossref] [PubMed]
- Kim SH, Lee HS, Kang BJ, Song BJ, Kim HB, Lee H, Jin MS, Lee A. Dynamic Contrast-Enhanced MRI Perfusion Parameters as Imaging Biomarkers of Angiogenesis. PLoS One 2016;11:e0168632. [Crossref] [PubMed]
- Stylianopoulos T, Jain RK. Combining two strategies to improve perfusion and drug delivery in solid tumors. Proc Natl Acad Sci U S A 2013;110:18632-7. [Crossref] [PubMed]
- Cesca M, Morosi L, Berndt A, Fuso Nerini I, Frapolli R, Richter P, Decio A, Dirsch O, Micotti E, Giordano S, D'Incalci M, Davoli E, Zucchetti M, Giavazzi R. Bevacizumab-Induced Inhibition of Angiogenesis Promotes a More Homogeneous Intratumoral Distribution of Paclitaxel, Improving the Antitumor Response. Mol Cancer Ther 2016;15:125-35. [Crossref] [PubMed]
- Gaustad JV, Simonsen TG, Smistad R, Wegner CS, Andersen LM, Rofstad EK. Early effects of low dose bevacizumab treatment assessed by magnetic resonance imaging. BMC Cancer 2015;15:900. [Crossref] [PubMed]
- Bohndiek SE, Sasportas L, Machtaler S, Jokerst J, Hori S, Gambhir S. Photoacoustic Tomography Detects Early Vessel Regression and Normalization During Ovarian Tumor Response to the Antiangiogenic Therapy Trebananib. J Nucl Med 2015;56:1942-7. [Crossref] [PubMed]
- Lupo G, Caporarello N, Olivieri M, Cristaldi M, Motta C, Bramanti V, Avola R, Salmeri M, Nicoletti F, Anfuso CD. Anti-angiogenic Therapy in Cancer: Downsides and New Pivots for Precision Medicine. Front Pharmacol 2017;7:519. [Crossref] [PubMed]
- Chaudary N, Hill RP. Hypoxia and metastasis. Clin Cancer Res 2007;13:1947-9. [Crossref] [PubMed]
- Knox HJ, Hedhli J, Kim TW, Khalili K, Dobrucki LW, Chan J. A bioreducible N-oxide-based probe for photoacoustic imaging of hypoxia. Nat Commun 2017;8:1794. [Crossref] [PubMed]

