Abstract
We carried out an electrochemical study of the cobalt electrodeposition onto glassy carbon electrode from an aqueous solution containing 10-2 M of CoSO4 + 1 M (NH4)2SO4 at natural pH 4.5. The potentiostatic study indicated a progressive 3D nucleation and growth during the deposition process. The average diffusion coefficient calculated for this system was 2.65 X 10⁻⁶ cm² s-1 while the ΔG for the formation of stable nucleus was 6.50 X 10⁻²⁰ J/nuclei. The scanning electron microscopy images indicated the formation of small and homogeneous nucleus onto GCE of approximately 300 nm.
cobalt electrodeposition; GCE; sulfate
ARTIGO
Kinetic study of the cobalt electrodeposition onto glassy carbon electrode from ammonium sulfate solutions
Clara Hilda Rios-ReyesI; Madaí Granados-NeriII; Luis Humberto Mendoza-HuizarII,* * e-mail: hhuizar@uaeh.edu.mx
IDepartamento de Materiales, Universidad Autónoma Metropolitana-Azcapotzalco, CP 02200 México D.F., México
IICentro de Investigaciones Químicas, Universidad Autónoma del Estado de Hidalgo, CP 42184, Hidalgo, México
ABSTRACT
We carried out an electrochemical study of the cobalt electrodeposition onto glassy carbon electrode from an aqueous solution containing 10-2 M of CoSO4 + 1 M (NH4)2SO4 at natural pH 4.5. The potentiostatic study indicated a progressive 3D nucleation and growth during the deposition process. The average diffusion coefficient calculated for this system was 2.65 X 10⁻⁶ cm2 s-1 while the ΔG for the formation of stable nucleus was 6.50 X 10⁻²⁰ J/nuclei. The scanning electron microscopy images indicated the formation of small and homogeneous nucleus onto GCE of approximately 300 nm.
Keyword: cobalt electrodeposition; GCE; sulfate.
INTRODUCTION
Cobalt electrodeposits have attracted a great interest in view of their potential applications in scientific and technological fields related with the digital information storage. Most of the studies have been performed onto glassy carbon electrodes,1-12 and some others onto stainless steel,13,14 gold,15-17 nickel,18 copper19 and platinum20 electrodes. Chloride solutions have been the preferred systems for studying the electrodeposition process of cobalt, 3,5-9,14,15,17,19 rather than sulfate systems1,4,11,12,16-18,20,21 or citrate solutions.13
Although, the complexing property of ammonia can be used to modulate the properties of the deposited cobalt via solution speciation, the electrodeposition of cobalt from ammoniacal solutions has not received a greater attention.1 In spite of the advantages showed by ammoniacal baths, it is important to consider that the (NH4)+ ions in solution are biased adsorbed on the negatively charged electrode and on the deposited Co surface, competing with the H+ ions and modifying the Co nucleation environment.21 Moreover, the (NH4)+ ions may preferentially adsorb on certain orientations, diminishing the growth rate of Co nucleus.1 The (NH4)+ ions in the electrolyte solution are also well known to form complex species with the metal ions, reducing their oxidation rate.1 On the other hand, although the anion effect is well known, only few studies have been reported considering the influence of the SO4-2 anion1,4,11,12,16-18,20,21 during the Co electrodeposition. It has been reported that the sulfate anion induces a competitive adsorption effect; in addition, the sulfate ion causes a major change in the shape of a voltammetric curve, producing new peaks which appear to be caused by an adatom-induced anion coadsorption.22 Albeit, a detailed electrochemical and AFM study of Co nucleation mechanisms on glassy carbon from ammonium sulfate solutions was carried out by Grujicic et al.;1 an analysis of the electrocrystallization kinetic parameters at natural pH 4.5 was not performed by them. Thus, in this work, we carried out an electrochemical study, to determine these parameters, in order to understand the Co electrodeposition process from this system.
EXPERIMENTAL
Co electrodepositions onto GCE were carried out from aqueous solutions containing 10-2 M of CoSO4 + 1M (NH4)2SO4 at pH 4.5 (natural pH). All solutions were prepared by using analytic grade reagents with ultra pure water (Millipore-Q system) and were deoxygenated by bubbling N2 for 15 min before each experiment. The working electrode was a GCE tip provided by BAS™ with 0.071 cm2. The exposed surface area was polished to a mirror finish with different grades of alumina down to 0.05 mm and ultrasonically cleaned before the experiments. A graphite bar with an exposed area greater than the working electrode was used as counter electrode. A saturated silver electrode (Ag/AgCl) was used as the reference electrode, and all measured potentials are referred to this scale. The electrochemical experiments were carried out in a BAS potentiostat connected to a personal computer running the BAS 100 W software to allow the control of experiments and data acquisition. In order to verify the electrochemical behavior of the electrode in the electrodeposition bath, cyclic voltammetry was performed in the 0.600 to -1.300 V potential range. The kinetic mechanism of cobalt deposit onto GCE was studied under potentiostatic conditions by means of the analysis of the experimental potentiostatic current density transients obtained with the double potential step technique. The perturbation of the potential electrode always started at 0.600 V. The first potential step was imposed at different potentials detailed in this work. The second step always ended at 0.600 V. The microstructures of electrodeposits were examined by using a scanning electron microscope (SEM; JEOL6300).
RESULTS AND DISCUSSION
Pourbaix diagrams
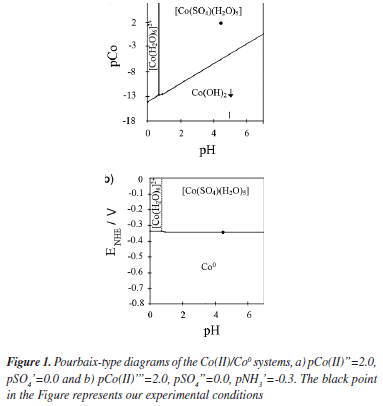
The chemical composition of the plating bath plays a very important role during the electrodeposition process. Specific chemical species in the deposition bath can induce changes in the thermodynamic and the kinetic parameters during the electrodeposition process, since it can even modify the electronic structure of the substrate. Therefore, in order to establish the chemical species in the deposition bath and the equilibrium potentials under our experimental conditions, we have carried out a thermodynamic study by employing the Multicomponent Pourbaix Diagrams.23 The equilibrium constants of the different chemical processes associated to these species were obtained from literature.24 The speciation of Co in ammonia solution was examined by constructing the distribution-pH diagrams. The results are shown in Figure 1a. One may observe that under our experimental conditions the predominant specie is a cobalt sulfate pentaquo complex [Co(SO4)(H2O)5]. Additionally the ratio [Co(SO4)(H2O)5]/[Co(H2O)6]2+ was approximately 99.2% suggesting that the electrodeposition process is carried out predominantly from [Co(SO4)(H2O)5]. From the Figure, it is possible to note that the equilibrium potential for the [Co(SO4)(H2O)5]/Coº couple is -0.353 V vs NHE. Thus, it is possible to suggest that in our experimental conditions the reduction process of Co follow the next two steps:
Here, it is very important to mention that Grujicic et al.,1 have analyzed a similar bath 10-2 M of CoSO4 + 1M (NH4)2SO4 but at pH 6.0. At present work we analyze a solution with the same composition but at natural pH 4.5. Although this small difference in our solution, apparently does not bring any innovation, it is very important to comment that in our experimental conditions the hydrogen concentration is 30 times bigger than the considered previously in the literature.1 Another important change is observed in the Pourbaix's diagrams. Grujicic et al.1 indicate that in their experimental conditions the complex [Co(H2O)6]2+ is the predominant specie. In our experimental conditions, the Pourbaix's diagrams suggest that in the pH range 0-7.5, two Co complex species may be obtained. From our results, [Co(H2O)6]2+ predominates in the pH range 0-0.7 and [Co(SO4)(H2O)5] predominates in the pH range 0.7-7.5. Thus, in our experimental conditions the electrodeposition process should occur through [Co(SO4)(H2O)5] instead of [Co(H2O)6]2+. The existence of additional free electrons through the SO4-2 group in [Co(SO4)(H2O)5] might favor the adsorption process of this Co complex species onto the GCE electrode.
Cyclic voltammetry
Figure 2 shows the voltammetric response, at the scan rate of 5 mVs-1, obtained from GCE/10-2 M of CoSO4 + 1 M (NH4)2SO4 system. It is possible to note that, at direct scan, there is the formation of a peak A at -1.165 V. During the inverse of the potential scan, it is possible to observe two crossovers, EC and CEP. The crossover EC is typical of the formation of a new phase involving a nucleation process and it is associated with an electrocatalytic point.25 In some cases, the second crossoverpotential CEP may be associated to the thermodynamical potential of Mn+/M, only when CEP is independent of the switch potential E λ (and only when E λ is less negative of the corresponding peak potential).23 However, this was not the case for the CEP analyzed in this work. In the anodic zone, it was possible to observe two principal peaks B and C at around -0.497 and -0.351 V, respectively. Peak B may be associated to the dissolution of hydrogen rich cobalt phase.7 It is also shown that the Co electrodeposition process starts at approximately -1.050 V (EP).
Chronoamperometric study
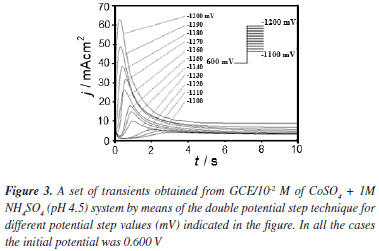
Formation of new phases generally occurs through nucleation and growth mechanisms and the corresponding current transients can provide valuable information about the kinetics of electrodeposition. Figure 3 shows a set of current density transients recorded at different potentials by a double pulse potential technique. These transients were obtained by applying an initial potential of 0.600 V on the surface of the GCE electrode. At this potential value, the Co deposition had not still begun. After the application of this initial potential, a step of negative potential was varied on the surface of the electrode from -1.10 to -1.20 V, Figure 3. This potential range was obtained from the cyclic voltammetric study in where the electrodeposition process starts at -1.050 V approximately. However, the initial potential was selected as -1.100 V because transients with a current maximum were clearly detected at this potential value allowing a better analysis of the kinetic parameters involved. A major influence of the hydrogen reduction process is expected when the potential applied is more negative. However a correct separation of the different contributions employing nucleation models may allow quantifying the influence of the different processes involved. All transients obtained during the reduction process, exhibited a falling current at shorter times. After this falling current, in each case, the transients showed a typical current maximum (jm), related to the coalescence of diffusion fields with spherical symmetry. Once the current maximum has been reached, a decay of the current was obtained, which approaches to the corresponding planar diffusion. Apparently, the general shape of these transients is very similar to those reported for a three dimensional nucleation process with diffusion control (3D-dc) of growing hemispherical nucleus.26,27 A classification of the nucleation as instantaneous or progressive from transients showed in Figure 3, is possible by following the criteria established by Sharifker et al.26 in where the experimental transients in a nondimensional form by plotting j2/jm2 vs t/tm are compared with those theoretically generated from Equations 3 and 4 for instantaneous and progressive nucleation, respectively.
Figure 4 shows the comparison of the theoretical dimensionless transients, generated by Equations 3 and 4 with experimental dimensionless current transients reported in Figure 3. It is interesting to observe that at (t /tm < 1) all transients showed a similar behavior to a progressive nucleation. At (t /tm >1) there is a deviation from the predicted by Equations 3 and 4. This behavior may be indicative of the presence of other contributions to the overall current during the Co deposition process additional to the 3D nucleation contribution.28
Analysis of the transients from CoSO4 + (NH4)2SO4 system
From the voltammetric study it was evidenced that the proton reduction process is present due to the existence of a hydrogen rich Co phase. Palomar-Pardavé et al.29 have proposed that when the proton reduction occurs simultaneously with the diffusion-limited 3D growth of Co centers, the overall current density is given by:
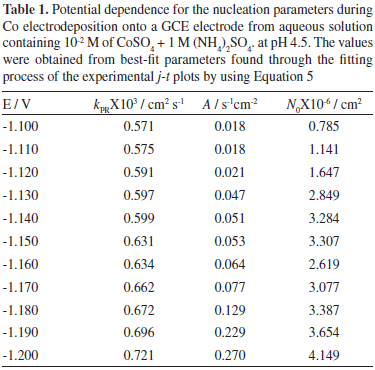
where zPRF is the molar charge transferred during the proton reduction process, kPR the rate constant of the proton reduction reaction,  , and all others parameters have their conventional meanings. Figure 5 shows a typical comparison of the reduction experimental current transients, with the theoretically generated by non-linear fitting of experimental data to Equation 5. It can be observed, that the model expressed by this equation adequately accounted for the behavior of experimental transient. The physical parameters obtained from the adjustments of Equation 5 were obtained (Table 1). The average diffusion coefficient calculated from the fittings was 2.65X10⁻⁶ cm2s-1. On the other hand, it is seen (Table 1) that an increment of the kPR, A and N0 is obtained when the overpotential applied is increased. It is interesting to observe that an increase in kPR values indicates that the reduction proton process is favored, suggesting a competition for the active sites on the surface by H+ ions with the Co cations.
Analysis of the kinetic parameters
From the nucleation rate values reported (Table 1), it is possible to calculate the Gibbs free energy of nucleation employing the next equation:30-32
where ΔG is the Gibbs free energy of nucleation, J/nuclei; KB is the Boltzmann constant (1.38066 X 10⁻²³ J mol-1) and k3 is a product of the frequency of attachment of single atoms to the critical nucleus and the non-equilibrium Zeldovich factor and depends exponentially on the overpotential,33 and k4 is a constant. In order to calculate the value of Gibbs free energy of nucleation from experimental transients, a ln A vs. η-2 plot can be constructed according to Equation 10, and then from the slope k4 of the observed linear relationship, ΔG could be calculated at each particular overpotential by using the next equation:
where T is the absolute temperature, K. The plot ln A vs η-2 plot, showed a linear relationship giving a slope of -20.8; the ΔG calculated for this system was 6.50 X 10⁻²⁰ J/nuclei. This energy corresponds to the ΔG value requirements for the formation of stable nucleus.31,32 The ΔG value obtained is slightly bigger than the value obtained for the electrocrystallization of Co on GCE and HOPG from sodium sulfate solutions.12
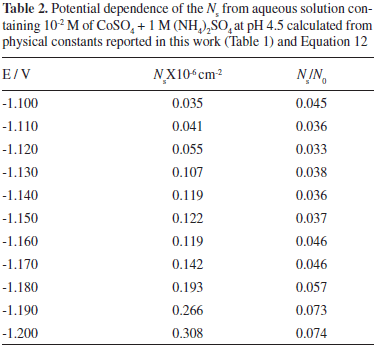
Through the physical constants reported (Table 1), it was also possible to calculate the saturation number of nuclei (Ns). This estimation was made employing Equation 12:34
where
The results obtained for Ns, are reported (Table 2). Observe that the Ns values increased with the applied potential. It is important to mention that, due to the exclusion zones of the deposit, caused by the hemispherical diffusional gradients of 3D nucleus, Ns will be always lower than N0 values at the same applied potential, and both grow in accordance with a more negative potential. The Ns/N0 ratio which can be defined as the efficiency of use of the surface available nucleation sites is reported (Table 2). Observe that the Ns/N0 ratio is potential dependent and its value is relatively low. This result may be due to the occupation of active sites by (NH4)+ ions adsorbed on the surface.35
In the framework of the atomistic theory of electrolytic nucleation, it is possible to estimate the critical size of the Co nucleus (nc) from the potential dependence of A through the following Equation:36
where αCo is the transfer coefficient for Co reduction. The plot ln A vs η showed a linear tendency with a d(ln A)/d(E)= 27.5. Thus, the critical cluster´s size (nc) calculated employing eq(14) was nc=0 suggesting that each active site is a critical nucleus on the GCE surface. Similar results have been obtained for the Co electrodeposition from sodium sulfate solutions onto GCE and HOPG electrodes.12
Morphological analysis
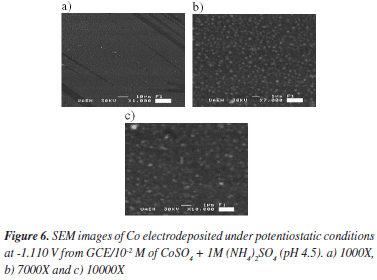
The morphology of the electrodeposits was studied by scanning electron microscopy (SEM). SEM micrographs of an electrodeposit formed potentiostatically at -1.100 V, at different magnifications, are shown in Figure 6a-c. From these images, a homogeneous Co distribution is observed onto the GCE. Also observe that the Co clusters are small and with similar size of approximately 300 nm. In a recent work carried out by our group, the apparition of small clusters with similar size has been explained considering the influence of the (NH4)+ adsorption process on carbon surface.35 In that work, it has showed that the (NH4)+ cations are adsorbed on the electrode surface; they stop the diffusion of Co adatoms towards the growing cluster, which in turn, will induce the growth of smaller clusters between them.
CONCLUSIONS
We have studied Co electrodeposition onto glassy carbon electrode (GCE) from 10-2 M CoSO4, 1 M (NH4)2SO4 aqueous solution by using the cyclic voltammetric and potentiostatic techniques. From the thermodynamic study, it was possible to suggest that under our experimental conditions, the predominant chemical species was the [Co(SO4)(H2O)5] complex and the equilibrium potential was -0.353 V vs NHE. Nucleation parameters such as nucleation rate, density of active nucleation sites and saturation nucleus were determined from potentiostatic studies. The morphological analysis indicated the formation of small Co clusters with similar size, approximately 300 nm, on the carbon surface.
AKNOWLEDGMENTS
M. Granados-Neri is grateful for a graduate student fellowship from CONACyT. We gratefully acknowledge financial support from CONACyT project APOY-COMPL-2008 No. 91261 and to the Universidad Autónoma del Estado de Hidalgo. Authors acknowledge C. A. Galan-Vidal for valuable help to construct the Pourbaix's diagrams and J. Hernández-Ávila for the SEM technical assistance. We are also grateful to the reviewers of the manuscript for valuable suggestions.
Recebido em 20/1/09; aceito em 27/5/09; publicado na web em 6/11/09
- 1. Grujicic, D.; Pesic B.; Electrochim. Acta 2004, 49, 4719.
- 2. Gomez E.; Valles E.; J. Appl. Electrochem. 2002, 32, 693.
- 3. Floate, S.; Hyde, M.; Compton, R.G.; J. Electroanal. Chem. 2002, 523, 49.
- 4. Soto, A. B.; Arce, E. M.; Palomar-Pardave, M.; González, I.; Electrochim. Acta 1996, 41, 2647.
- 5. Myung, N.; Ryu, K. H.; Sumodjo, P. T. A.; Nobe, K.; Electrochemical Society Proceedings 1998, PV97, 270.
- 6. Palomar-Pardave, M.; González, I.; Soto, A. B.; Arce, E. M.; J. Electroanal. Chem. 1998, 443, 125.
- 7. Mendoza-Huizar, L. H.; Rios-Reyes, C. H.; Rivera, M.; Galán-Vidal, C. A.; Advances in Technology of Materials and Materials Processing 2006, 8, 152.
- 8. Correia, A. N.; de Oliveira, R. C. B.; Lima-Neto, P.; J. Braz. Chem. Soc. 2006, 17, 1, 90.
- 9. Gu, M.; Yang, F. Z.; Huang, L.; Yao, S. B.; Zhou, S. M.; Chin. Chem. Lett 2004, 15, 981.
- 10. Mishra, K.G.; Singh, P.; Muir, D.; J. Appl. Electrochem. 2002, 32, 1391.
- 11. Fletcher, S.; Halliday, C. S.; Gates, D.; Westcott, L. T.; Nelson, G.; J. Electroanal Chem 1983, 159, 267.
- 12. Rios-Reyes, C. H.; Mendoza-Huizar, L. H.; Rivera, M.; J. Solid State Electrochem 2009, in press. DOI 10.1007/s10008-009-0816-3
- 13. Abd El Rehim, S. S.; Abd El Wahaab, S. M.; Ibrahim, M. A. M.; Dankeria, M. A.; J. Chem. Technol. Biotechnol. 1998, 73, 369.
- 14. Tutunaru, B.; Patru, A.; Preda, M.; Rev. Chim. (Bucharest, Rom.), 2006, 57, 598.
- 15. Mendoza-Huizar, L. H.; Robles, J.; Palomar-Pardavé, M.; J. Electroanal. Chem. 2002, 521, 95.
- 16. Mendoza-Huizar, L. H.; Robles, J.; Palomar-Pardavé, M.; J. Electroanal. Chem. 2003, 545, 39.
- 17. Kabulska, F.; J. Appl. Electrochem. 2006, 36, 131.
- 18. Cui, C. Q.; Jiang, S. P.; Tseung, A. C. C.; J. Electrochem. Soc. 1990, 137, 3418.
- 19. Bhuiyan, M. S.; Taylor, B. J.; Paranthaman, M.; Thompson, J. R.; Sinclair, J. W.; J. Mater. Sci. 2008, 43, 1644.
- 20. Bento, F. R.; Mascaro, L. H.; J. Braz. Chem. Soc. 2002, 13, 502.
- 21. Bao, Z. L.; Kavanaugh, K. L.; J. Cryst. Growth 2006, 287, 514.
- 22. Wheeler, R.; Wang, J. X.; Adzic, R. R.; J. Electroanal. Chem. 1995, 387, 115.
- 23. Rojas-Hernández, A.; Ramírez, T. M.; Ibáñez, J. G.; González, I.; J. Electrochem. Soc. 1991, 138, 365.
-
24Academic Software, The IUPAC Stability Constants Database, 1992-2000.
- 25. Greef, R.; Peat, R.; Peter, L. M.; Pletcher, D.; Robinson, J.; Instrumental Methods in Electrochemistry, Ellis Horwood; Chichester, 1985, ch. 9.
- 26. Scharifker, B.; Hills, G.; Electrochim. Acta 1983, 28, 879.
- 27. Scharifker, B. R.; Mostany, J.; J. Electroanal. Chem. 1984, 177, 13.
- 28. Mendoza-Huizar, L. H.; Robles, J.; Palomar-Pardavé, M.; J. Electroanal. Chem. 2003, 545, 39.
- 29. Palomar-Pardavé, M.; Scharifker, B. R.; Arce, E. M.; Romero-Romo, M.; Electrochim. Acta 2005, 50, 4736.
- 30. Southampton Electrochemistry Group; Instrumental Methods in Electrochemistry, Wiley: New York, 1985, p. 923.
- 31. Mostany, J.; Mozota, J.; Scharifker, B. R.; J. Electroanal. Chem. 1984, 177, 25.
- 32. Serruya, A.; Mostany, J.; Scharifker, B. R.; J. Electroanal. Chem. 1999, 464, 39.
- 33. Milchev, A.; Electrocrystallization: Fundamentals of nucleation and growth, Kluwer Academic Publishers, 2002, Chapter 2.2.3.
- 34. Scharifker, B. R.; Acta Científica Venezolana 1984, 35, 211.
- 35. Rivera, M.; Rios-Reyes, C. H.; Mendoza-Huizar, L. H.; Appl. Surf. Sci. 2008, 255, 1754.
- 36. Milchev, A.; Contemporary Physics 1991, 32, 321.
Publication Dates
-
Publication in this collection
06 Jan 2010 -
Date of issue
2009
History
-
Accepted
27 May 2009 -
Received
20 Jan 2009


