Abstract
Usually known as jenipapo, Genipa americana L. is a Rubiaceae Brazilian native species. It is an important species in the restoration of Brazilian riparian forests and is one of the most promising fruit trees for sustainable harvesting programs. In this study we provide the first data on the genetic diversity and structure of a Jenipapo Germplasm Bank using inter simple sequence repeat (ISSR) markers. We evaluated 160 accessions from wild populations, and the data generated from 12 ISSR primers were used to determine genetic variability via a model-based Bayesian procedure (Structure) and molecular variance analysis. In addition, Shannon index, genetic diversity and Jaccard coefficients were estimated. A total of 12 primers were used, which generated 123 polymorphic fragments. Four groups were formed from the analysis of the fragments, and the CR1-2 genotype was isolated, being more divergent than the other genotypes.
tropical fruits; molecular markers; germplasm; conservation
GENETICS AND PLANT BREEDING
Diversity and genetic structure of jenipapo ( Genipa americana L.) Brazilian accessions
Ana Veruska Cruz da SilvaI, * * Corresponding author < ana.veruska@embrapa.br> ; Karla Cristina Santos FreireII; Ana da Silva LédoI; Allívia Rouse Carregosa RabbaniIII
IEmbrapa Coastal Tablelands, Av. Beira mar, 3250 - 49025-040 - Aracaju, SE - Brazil
IIFederal University of Sergipe, Av. Marechal Rondon, s/n - 49100-000 - São Cristovão, SE - Brazil
IIIBahia Federal Institute of Education, Science and Technology, BR 367 km 57,5 - 45810-000 - Porto Seguro, BA - Brazil
ABSTRACT
Usually known as jenipapo, Genipa americana L. is a Rubiaceae Brazilian native species. It is an important species in the restoration of Brazilian riparian forests and is one of the most promising fruit trees for sustainable harvesting programs. In this study we provide the first data on the genetic diversity and structure of a Jenipapo Germplasm Bank using inter simple sequence repeat (ISSR) markers. We evaluated 160 accessions from wild populations, and the data generated from 12 ISSR primers were used to determine genetic variability via a model-based Bayesian procedure (Structure) and molecular variance analysis. In addition, Shannon index, genetic diversity and Jaccard coefficients were estimated. A total of 12 primers were used, which generated 123 polymorphic fragments. Four groups were formed from the analysis of the fragments, and the CR1-2 genotype was isolated, being more divergent than the other genotypes.
Keywords: tropical fruits, molecular markers, germplasm, conservation
Introduction
The Rubiaceae family has 550 genera and approximately 9,000 species. It is one of the largest families of angiosperms (Souza and Lorenzi, 2005). The Genipa is in the Ixoroideae subfamily and the Gardenieae tribe and is recognized as a taxon that has just two species: G. americana L. and G. infundibuliformis Zappi & Semir. The first species is native and is cultivated throughout the Neotropics, from Mexico to Patagonia, and the second species is found only in central-southern Brazil (Delprete et al., 2005).
The cultivation of this species is primarily extractive. Commercial exploitation, however, has been encouraged and is especially recommended in the recovery of degraded areas. It is a neotropical wood plant that shows adaptive capabilities when confronted by adverse conditions, such as soil flooding (Barbosa et al., 2007). Genipa americana L. (jenipapo) has economic importance because its fruits are consumed in natura or used in industrial foods for the production of sweets, jams, jellies and liqueurs. The green fruits provide a juice with a bluish color, which is often used as a dye. Furthermore, the fruits are used in traditional medicine to treat anemia, icterus, asthma, and liver and spleen problems (Conceição et al., 2011).
Considering the high potential of the jenipapo and the need for preservation of its genotypes, the Jenipapo Germplasm Bank (JGB) was created in 2009 at the Brazilian Enterprise for Agricultural Research - Embrapa Coastal Tablelands, in the city of Nossa Senhora das Dores, in the state of Sergipe, Brazil (10°27'50,0" S and 37°11'39,5" W), consisting of 160 genotypes.
To measure genetic diversity, molecular tool ISSR markers (Inter simple Sequence Repeats), based on PCR techniques and with high reproducibility, are widely used in population genetics and in germplasm characterization (Wakte et al., 2012). Few studies on the genetic diversity have been performed with jenipapo, such as Sebbenn et al. (2003) using isoenzymes and Rabbani et al. (2012) using RAPD.
Information about the genetic diversity in a germplasm bank can be used in breeding programs, and allows for the identification of duplicates and germplasm exchange between researchers, thus providing basic information for the establishment of management practices for the preservation of this species. This study evaluates the genetic structure of Genipa americana L. from JGB using ISSR markers.
Materials and Methods
DNA of JGB accessions was isolated from young leaves as described by Doyle (1991). We used 160 genotypes: 150 belonging to the species Genipa americana L. and 10 to the species Genipa infundibuliformis Zappi & Semir. The collection was created using fruits collected randomly from natural populations in the states of Bahia, Ceará and Sergipe (Table 1).
For ISSR, 12 primers from Operon were used (Pinheiro et al., 2012) to screen for polymorphisms (Table 2). Polymerase chain reaction (PCR) amplifications were performed using a PTC-100 thermocycler, with reactions consisting of 5-min initial denaturation at 95 ºC, followed by 45 cycles of denaturation at 94 ºC for 1 min, primer annealing at 52 ºC for 1 min and extension at 72 ºC for 45 s, and one final extension step at 72 ºC for 10 min.
Fragments were visualized on 2 % agarose gel [1 x TBE - 89 mM Tris, 89 mM boric acid, 2.5 mM ethylenediaminetetraacetic acid (EDTA), pH 8.3] in a horizontal electrophoresis system run at a constant voltage of 100 V for 90 min. The gel was stained with ethidium bromide solution (5 mg mL - 1) for 15 min. ISSR amplification products were visualized under ultraviolet light using a Gel Doc L-Pix imaging system.
Only data from intensely stained, unambiguous and clear fragments were used for statistical analysis. ISSR markers were scored as present (1) or absent (0). The minimum number of fragments required to conduct the genetic diversity study was based on Oliveira et al. (2010), and were analyzed by the bootstrap method (Manly, 1997) with 10,000 replicates using the DBOOT software package. The number of polymorphic fragments was considered to be optimal when the coefficient variation was lower than 5 %.
A data matrix of ISSR scores was generated, and similarity coefficients were calculated using Jaccard's arithmetic complement index. A dendrogram was constructed using the Unweighted Pair Group with Arithmetic Mean (UPGMA) cluster algorithm. To determine dendrogram robustness, the data were bootstrapped with 10,000 replicates using FreeTree software (Pavlicek et al., 1999). Principal coordinates analysis method (PCoA) was performed using the software package XLSTAT (Addinsolft, 2009) based on the calculated Jaccard's similarity coefficients.
Inferences regarding genetic structure within jenipapo genotypes were made using Structure version 2.2. (Pritchard et al., 2000; Falush et al., 2007). To estimate K, the number of reconstructed panmictic populations (RPPs) of individuals was calculated, using values ranging from 1 to 10 and assuming that the sampled genotypes were from anonymous plants of unknown origin (use popinfo and popflag set to 0). The program Structure estimates the most likely number of clusters (K) by calculating the log probability of data for each value of K (Santos et al., 2011). We assessed the best K value supported by the data according to Evanno et al. (2005).
The polymorphic information content (PIC) was calculated according to Ghislain et al. (1999), and the marker index (MI) was determined as described by Zhao et al. (2007). The Shannon diversity index - I (Brown and Weir, 1983), genetic diversity - H (Lynch and Milligan, 1994; Maguire et al., 2002), and analysis of molecular variance - AMOVA (Michalakis and Excoffier, 1996) was estimated using Genalex v.6.3.
Results and Discussion
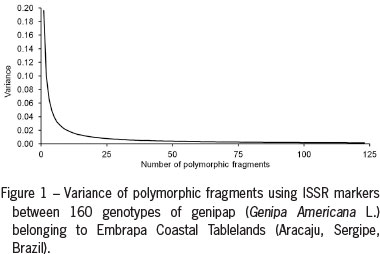
A total of 123 fragments, all polymorphic, were generated using the 12 primers (Table 2). The primer with the highest number of fragments (12) was HB11. The primer 814 had the lowest number of fragments (8). The PIC value was 0.21 (0.12 to 0.29), and the global value MI was 2.12 (1.21 to 2.94). A directly proportional relationship exists between the number of fragments analyzed and the variance (Figure 1). These results indicate a clear variance decrease when the number of fragments increased, according to Silva et al. (2013). From the analysis using software DBOOT, it was observed that the variation coefficient was stabilized once 75 fragments had been generated, that were 100 % polymorphic. A directly proportional relationship exists between the number of fragments and the variance, with the value below 0.01, which suggests that the results obtained by the fragments used in this study (123) can be used for the diversity analysis.
The ISSR markers are used in many parts of the world to measure genetic fidelity and genetic diversity in Rubiaceae (Mishra et al., 2011; Oliveira et al., 2010). The high level of polymorphism observed in this study agrees with the results of previous genotyping studies using RAPD (Rabbani et al., 2012).
From the AMOVA (Table 3), it is possible to observe the genetic variability distribution pattern (PhiPT 0.43, *** p < 0.001), which ranges between and within the population accessions. The genetic diversity is higher within accessions (57 %) than among them (43 %). These values reflect a strong genetic population structure, i.e., the gene flow rate among accessions is low.
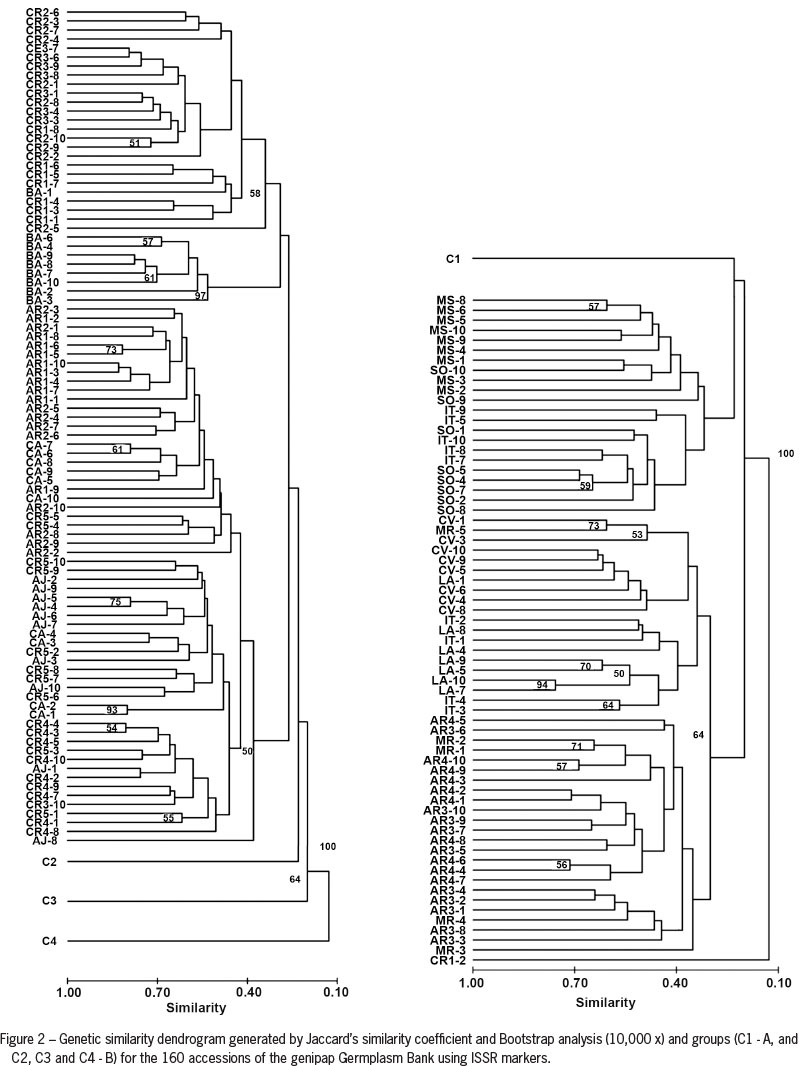
The genetic distance estimated by Jaccard's similarity coefficient among 160 accessions was used to construct the UPGMA dendrogram (Figure 2). In Group 1 (C1), there is a grouping of accessions, with most genotypes from the states of Sergipe and Bahia. In the second subgroup (C2), consisting of accessions MS, MR, IT and SO, from the states of Ceará and Sergipe, it can be observed that MR-3 (0.08) and LA-8 (0.16) are the most distant. It is noteworthy that a distinction can be found between many accessions within subgroups in the dendrogram, suggesting the existence of differentiation between accessions of the same origin. The C3 group is formed by accessions from regions AR3, CV and LA, and the LA-10 and LA-7 pair is the most similar (0.94). The C4 group is composed of the CR1-2 genotype. This distance may indicate a strong differentiation process, which is the consequence of genetic erosion, whereby accessions are subject to fragmentation areas representing their sites of origin. This process can occur as a result of interbreeding between convergent and divergent individuals.
Bayesian analysis (Structure) was performed to analyze the genetic structure of the Jenipapo Germplasm Bank. Clustering was awarded to individuals for RPP based on the genotype. The Structure software estimates the most probable number of clusters (K) by calculating the log likelihood of data for each value of K and by ΔK statistics of Evanno et al. (2005). The best K to represent RPP genotypes was K = 3 (RPP1 the RPP3) (Figure 3). The first Reconstructed Populations (RPP1) includes 66 genotypes, with probability of membership (qI) > 80 %, represented by accessions AR3, AR4, IT, LA, MR and MS from the state of Sergipe, and CV from the state of Ceará. The second RPP (RPP2) consists of 35 genotypes and (qI) > 80 %, including accession BA (Bahia), in addition to CR1, CR2, CR3 and AR2 (AR2 and AR2-2-9) with (qI) < 80 %. The third RPP (RPP3) contains 59 genotypes, with probability of membership (qI) > 80 % in accessions AJ, AR1, AR2, CA, CR4 and CR5, including the CR3-10 genotype with (qI) < 80 %. The same technique has been used in other germplasm banks to identify variability and for the identification of sub-populations (Santos et al., 2011; Pereira-Lorenzo et al., 2008).
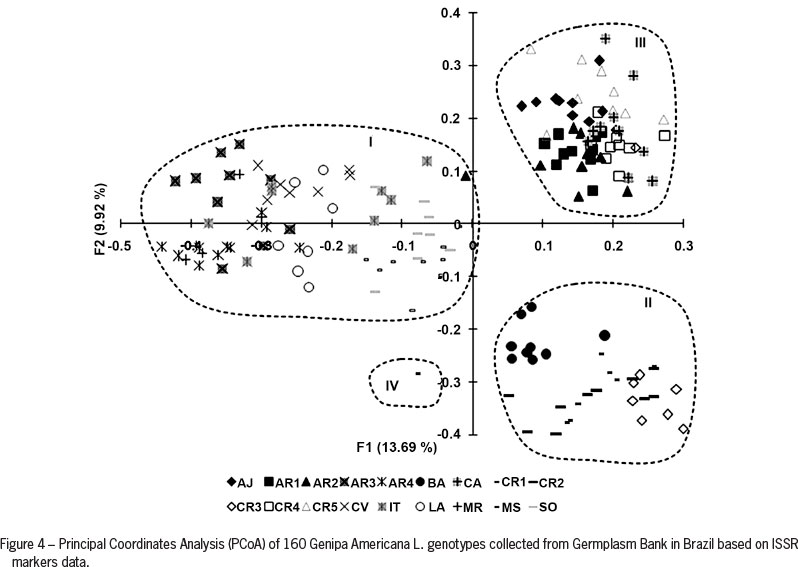
Genetic distances were also examined between individuals within the total population studied using a multivariate ordination (PCoA; Figure 4), where the first two principal coordinates explained 24 % of the total variability. The groups of accessions are clearly observed according to their variability as defined by the Structure software (Pritchard et al., 2000). The CR1-2 genotype is isolated as proposed by the UPGMA method, suggesting that this group is the most divergent. Comparing information between the UPGMA cluster and PCoA, it was observed that the groups formed by genotypes from Bahia, Ceará and Sergipe appear to be genetically related. The CR1-2 genotype shows the highest genetic difference.
A large number of subjects are grouped in RPP1, similar to the larger number of genotypes in the CI group produced by the UPGMA cluster. Information on genetic diversity can help in implementing breeding programs, thus avoiding duplication or mixtures of genotypes in studies of germplasm conservation programs. The molecular characterization of the germplasm genetic structure and diversity can provide useful data to assist the breeder in identifying and selecting clones or relatives for establishing a breeding program.
In all analyses, accessions from the state of Bahia (BA) are genetically close to those from the state of Sergipe, in particular from the region of Lagarto (CR1, CR2 and CR3). It is possible to observe their isolation in the groups, which is confirmed by the structure analysis (RPP3), UPGMA and PCoA. The region showing the highest value is IT (0.26), followed by LA (0.24). Genetic diversity (H) is 0.14, with IT (0.17) also showing the highest value, followed by BA (0.16). The polymorphic loci show a total of 42 % among accessions (Table 4).
Low H value (0.14) suggests low diversity in germplasm. Under natural conditions, the H value is always expected to be different from zero, because individuals are likely to incorporate new alleles by crossing, even in small or fragmented populations, in addition to losses due to genetic drift. In this study, the Shannon Index (0.21) is considered to be moderate, most likely because the sample size is up to ten individuals. The values found are similar to those obtained by Silva et al. (2012), with an average value of 0.33 (I) and 0.22 (H), in accessions from the 'moringa' germplasm bank (Moringa oleifera L.) and by Silva et al. (2013) in neem germplasm (Azadirchta sp.), with 0.22 (I) and 0.14 (H). The results suggest the JGB needs new introductions to incorporate new alleles to increase the genetic diversity.
Conclusions
The genetic variation of Genipa Americana L. was efficiently determined using ISSR markers, identifying four distinct groups that can be used in the reclassification of accessions in future breeding and conservation programs. The CR1-2 genotype is genetically isolated from the other accessions.
References
Barbosa, R.M.T.; Almeida, A.A.F.; Mielke, M.S.; Loguercio, L.L.; Mangabeira, P.A.; Gomes, F.P. 2007. A physiological analysis of Genipa americana L.: a potential phytoremediator tree for chromium polluted watersheds. Environmental and Experimental Botany 61: 264-271.
Brown, A.H.D.; Weir, B.S. 1983. Measuring genetic variability in plant populations, in isozymes in plant genetics and breeding. p. 219-239. In: Tanksley. S.D.; Orton, T., eds. Elsevier Science, Amsterdam, The Netherlands.
Conceição, A.O.; Rossi, M.H.; Oliveira, F.F.; Takser, L.; Lafond, J. 2011. Genipa americana (Rubiaceae) fruit extract affects mitogen-activated protein kinase cell pathways in human trophoblast-derived BeWo cells: implications for placental development. Journal of Medicinal Food 14: 483-494.
Delprete, P.G.; Smith, L.B.; Klein, R.M. 2005. Rubiáceas. p. 345-842. In: Reitz, A.R., ed. Flora Catarinense. Parte II. Rubi. TBG, Itajaí Doyle, J. 1991. DNA protocols for plants: CTAB total DNA isolation. p.283-293. In: Hewitt, G.M.; Johnston, A., eds. Molecular techniques in taxonomy. Springer, Berlin, Germany.
Evanno, G.; Regnaut, S.; Goudet, J. 2005. Detecting the number of clusters of individuals using the software struture: a simulation study. Molecular Ecology 14: 2611-2620.
Falush, D.; Stephens, M.; Pritchard, J.D. 2007. Inference of population structure using multilocus genotype data: dominant markers and null alleles. Molecular Ecology Notes 7: 574-578.
Ghislain, M.; Zhang, D.; Fajardo, D.; Huamann, Z.; Hijmans, R.H. 1999. Marker assisted sampling of the cultivated Andean patato Solanumphureja collections using RAPD markers. Genetic Research Crop Evolution 6: 547-555.
Lynch, M.; Milligan, B.G. 1994. Analysis of population genetic structure with RAPD markers. Molecular Ecology 3: 91-99.
Maguire, T.L.; Peakall, R.; Saenger, P. 2002. Comparative analysis of genetic diversity in the mangrove species Avicennia marina (Forsk.) Vierh. (Avicenniaceae) detected by AFLPs and SSRs. Theoretical and Applied Genetics 104: 388-398.
Manly, B.F.J. 1997. Randomization, Bootstrap and Monte Carlo Methods in Biology. 2ed. Chapman & Hall, London, UK.
Michalakis, Y.; Excoffier, L. 1996. A generic estimation of population subdivision using distances between alleles with special reference for microsatellite loci. Genetics 142: 1061-1064.
Mishra, M.K.; Nishani, S.; Jayarama. 2011. Molecular identification and genetic relationships among coffee species (Coffea L.) inferred from ISSR and SRAP marker analyses. Archives of Biological Sciences 63: 667-679.
Oliveira, L.O.; Venturini, B.A.; Rossi, A.A.B.; Hastenreiter, S.S. 2010. Clonal diversity and conservation genetics of the medicinal plant Carapichea ipecacuanha (Rubiaceae). Genetic and Molecular Biology 33: 86-93.
Pavlicek, A.; Hrda, S.; Flegr, J. 1999. Free tree - Freeware program for construction of phylogenetic trees on the basis of distance data and bootstrap/jackknife analysis of the tree robustness. Application in the RAPD analysis of the genus Frenkelia. Folia Biologica 45: 97-99.
Pereira-Lorenzo, S.; Ramos-Cabrer, A.M.; Gonzalez-Diaz, A.J.; Diaz-Hernandez, M. 2008. Genetic assessment of local apple cultivars from La Palma, Spain, using simple sequence repeats (SSRs). Scientia Horticulturae 117: 160-166.
Pinheiro, L.R.; Rabbani, A.R.C.; Silva, A.V.C.; Ledo, A.S.; Pereira, K.L.G.; Diniz, L.E.C. 2012. Genetic diversity and population structure in the Brazilian Cattleya labiata (Orchidaceae) using RAPD and ISSR markers. Plant Systematics and Evolution 298: 1-14.
Pritchard, J.K.; Stephens, M.; Donnelly, P. 2000. Inference of populacion structure using multilocus genotypes data. Genetics 155: 945-959.
Rabbani, A.R.C.; Silva-Mann, R.; Ferreira, R.A. 2012. Genetic variability of Genipa americana L belonging to the lower course of São Francisco river. Revista Árvore, 36: 401-409 (in Portuguese, with abstract in English).
Santos, A.R.F.; Ramos-Cabrer, A.M.; Díaz-Hernández, M.B.; Pereira-Lorenzo, S. 2011. Genetic variability and diversification process in local pear cultivars from northwestern Spain using microsatellites. Tree Genetics & Genomes 7: 1041-1056.
Sebbenn, A.M.; Kageyama, P.Y.; Vencovsky, R. 2003. In situ genetic conservation and number of tree for seed collect in Genipa Americana L. population. Scientia Forestalis 63: 13-22.
Silva, A.V.C.; Rabbani, A.R.C.; Almeida, C.S.; Clivati, D. 2013. Genetic structure and diversity of the neem germplasm bank from Brazil northeast. African Journal of Biotechnology 12: 2822-2829.
Silva, A.V.C.; Santos, A.R.F.; Ledo, A.S.; Feitosa, R.B.; Almeida, C.S.; Silva, G.M. 2012. Moringa genetic diversity from germplasm bank using RAPD markers. Tropical and Subtropical. Agroecosystems 15: 31-39.
Souza, V.C.; Lorenzi, H. 2005. Systematic Botany: Illustred to Identify the Families of Angiosperm Flora Guide Based on APG II. Plantarum, Nova Odessa, SP Brazil.
Wakte, K.V.; Saini, A.; Jawali, N.; Thengane, R.J.; Nadaf, A.B. 2012. Genetic diversity assessment in Pandanus amaryllifolius Roxb. populations of India. Genetic Resource Crop and Evolution 59: 1583-1595.
Zhao, K.; Zhou, M.; Chen, L.; Zhang, D.; Robert, G.W. 2007. Genetic Diversity and Discrimination of Chimonanthus praecox (L.) Link Germplasm Using ISSR and RAPD Markers. Hort Science 42: 1144-1148.
Received January 29, 2014
Accepted April 25, 2014
- Barbosa, R.M.T.; Almeida, A.A.F.; Mielke, M.S.; Loguercio, L.L.; Mangabeira, P.A.; Gomes, F.P. 2007. A physiological analysis of Genipa americana L.: a potential phytoremediator tree for chromium polluted watersheds. Environmental and Experimental Botany 61: 264-271.
- Brown, A.H.D.; Weir, B.S. 1983. Measuring genetic variability in plant populations, in isozymes in plant genetics and breeding. p. 219-239. In: Tanksley. S.D.; Orton, T., eds. Elsevier Science, Amsterdam, The Netherlands.
- Conceição, A.O.; Rossi, M.H.; Oliveira, F.F.; Takser, L.; Lafond, J. 2011. Genipa americana (Rubiaceae) fruit extract affects mitogen-activated protein kinase cell pathways in human trophoblast-derived BeWo cells: implications for placental development. Journal of Medicinal Food 14: 483-494.
- Delprete, P.G.; Smith, L.B.; Klein, R.M. 2005. Rubiáceas. p. 345-842. In: Reitz, A.R., ed. Flora Catarinense. Parte II. Rubi. TBG, Itajaí
- Doyle, J. 1991. DNA protocols for plants: CTAB total DNA isolation. p.283-293. In: Hewitt, G.M.; Johnston, A., eds. Molecular techniques in taxonomy. Springer, Berlin, Germany.
- Evanno, G.; Regnaut, S.; Goudet, J. 2005. Detecting the number of clusters of individuals using the software struture: a simulation study. Molecular Ecology 14: 2611-2620.
- Falush, D.; Stephens, M.; Pritchard, J.D. 2007. Inference of population structure using multilocus genotype data: dominant markers and null alleles. Molecular Ecology Notes 7: 574-578.
- Ghislain, M.; Zhang, D.; Fajardo, D.; Huamann, Z.; Hijmans, R.H. 1999. Marker assisted sampling of the cultivated Andean patato Solanumphureja collections using RAPD markers. Genetic Research Crop Evolution 6: 547-555.
- Lynch, M.; Milligan, B.G. 1994. Analysis of population genetic structure with RAPD markers. Molecular Ecology 3: 91-99.
- Maguire, T.L.; Peakall, R.; Saenger, P. 2002. Comparative analysis of genetic diversity in the mangrove species Avicennia marina (Forsk.) Vierh. (Avicenniaceae) detected by AFLPs and SSRs. Theoretical and Applied Genetics 104: 388-398.
- Manly, B.F.J. 1997. Randomization, Bootstrap and Monte Carlo Methods in Biology. 2ed. Chapman & Hall, London, UK.
- Michalakis, Y.; Excoffier, L. 1996. A generic estimation of population subdivision using distances between alleles with special reference for microsatellite loci. Genetics 142: 1061-1064.
- Mishra, M.K.; Nishani, S.; Jayarama. 2011. Molecular identification and genetic relationships among coffee species (Coffea L.) inferred from ISSR and SRAP marker analyses. Archives of Biological Sciences 63: 667-679.
- Oliveira, L.O.; Venturini, B.A.; Rossi, A.A.B.; Hastenreiter, S.S. 2010. Clonal diversity and conservation genetics of the medicinal plant Carapichea ipecacuanha (Rubiaceae). Genetic and Molecular Biology 33: 86-93.
- Pavlicek, A.; Hrda, S.; Flegr, J. 1999. Free tree - Freeware program for construction of phylogenetic trees on the basis of distance data and bootstrap/jackknife analysis of the tree robustness. Application in the RAPD analysis of the genus Frenkelia Folia Biologica 45: 97-99.
- Pereira-Lorenzo, S.; Ramos-Cabrer, A.M.; Gonzalez-Diaz, A.J.; Diaz-Hernandez, M. 2008. Genetic assessment of local apple cultivars from La Palma, Spain, using simple sequence repeats (SSRs). Scientia Horticulturae 117: 160-166.
- Pinheiro, L.R.; Rabbani, A.R.C.; Silva, A.V.C.; Ledo, A.S.; Pereira, K.L.G.; Diniz, L.E.C. 2012. Genetic diversity and population structure in the Brazilian Cattleya labiata (Orchidaceae) using RAPD and ISSR markers. Plant Systematics and Evolution 298: 1-14.
- Pritchard, J.K.; Stephens, M.; Donnelly, P. 2000. Inference of populacion structure using multilocus genotypes data. Genetics 155: 945-959.
- Rabbani, A.R.C.; Silva-Mann, R.; Ferreira, R.A. 2012. Genetic variability of Genipa americana L belonging to the lower course of São Francisco river. Revista Árvore, 36: 401-409 (in Portuguese, with abstract in English).
- Santos, A.R.F.; Ramos-Cabrer, A.M.; Díaz-Hernández, M.B.; Pereira-Lorenzo, S. 2011. Genetic variability and diversification process in local pear cultivars from northwestern Spain using microsatellites. Tree Genetics & Genomes 7: 1041-1056.
- Sebbenn, A.M.; Kageyama, P.Y.; Vencovsky, R. 2003. In situ genetic conservation and number of tree for seed collect in Genipa Americana L. population. Scientia Forestalis 63: 13-22.
- Silva, A.V.C.; Rabbani, A.R.C.; Almeida, C.S.; Clivati, D. 2013. Genetic structure and diversity of the neem germplasm bank from Brazil northeast. African Journal of Biotechnology 12: 2822-2829.
- Silva, A.V.C.; Santos, A.R.F.; Ledo, A.S.; Feitosa, R.B.; Almeida, C.S.; Silva, G.M. 2012. Moringa genetic diversity from germplasm bank using RAPD markers. Tropical and Subtropical. Agroecosystems 15: 31-39.
- Souza, V.C.; Lorenzi, H. 2005. Systematic Botany: Illustred to Identify the Families of Angiosperm Flora Guide Based on APG II. Plantarum, Nova Odessa, SP Brazil.
- Wakte, K.V.; Saini, A.; Jawali, N.; Thengane, R.J.; Nadaf, A.B. 2012. Genetic diversity assessment in Pandanus amaryllifolius Roxb. populations of India. Genetic Resource Crop and Evolution 59: 1583-1595.
- Zhao, K.; Zhou, M.; Chen, L.; Zhang, D.; Robert, G.W. 2007. Genetic Diversity and Discrimination of Chimonanthus praecox (L.) Link Germplasm Using ISSR and RAPD Markers. Hort Science 42: 1144-1148.
Publication Dates
-
Publication in this collection
01 Oct 2014 -
Date of issue
Oct 2014
History
-
Received
29 Jan 2014 -
Accepted
25 Apr 2014