Running Head: Body Mass Index as Disease Modulator in COPD
Funding Support: Institutional support
Date of Acceptance: July 24, 2014
Abbreviations: body mass index, BMI; World Health Organization, WHO; forced expiratory volume in 1 second, FEV1; forced vital capacity, FVC; FEV1 to FVC ratio, FEV1%; Body mass index, airway Obstruction, Dyspnea, Exercise capacity scale, BODE index; American Thoracic Society, ATS; European Respiratory Society, ERS; kilogram, kg; National Institutes of Health, NIH; diffusing capacity of the lung for carbon monoxide, DLCO; inspiratory capacity to total lung capacity ratio, IC/TLC; modified Medical Research Council dyspnea scale, mMRC; analysis of variance, ANOVA; confidence interval, CI; National Health and Nutrition Examination Study, NHANES
Divo MJ, Cabrera C, Casanova C, et al. Comorbidity distribution, clinical expression and survival in COPD patients with different body mass index. Chronic Obstr Pulm Dis. 2014; 1(2): 229-238. doi: http://doi.org/10.15326/jcopdf.1.2.2014.0117
Introduction
Chronic obstructive pulmonary disease (COPD) is a heterogeneous disease of the lungs with systemic manifestations that affect the phenotypic expression of the disease, its course and outcomes.1-4 One of such factors is the body mass index(BMI), a crude yet simple clinical parameter useful to estimate body adiposity.5 Use of the BMI is recommended by the National Heart Lung and Blood Institute (NHLBI)6 and it has been shown to contribute to the expression of COPD phenotypes7,8 through its influence on pulmonary mechanics,9 systemic inflammation and its biomarkers,10 and ultimately on mortality.1,11 However, the association between BMI to specific comorbidities and longitudinal outcomes in patients with COPD has been less well characterized.
We hypothesized that specific comorbidities would cluster across the BMI spectrum and this in turn would influence mortality. In addition, we hypothesized that the BMI would have an effect on the phenotypic manifestation of the disease. To test this hypothesis we explored the prevalence of COPD-related comorbidities in different BMI categories and their possible association with increased risk of death. We also determined the distribution of degree of obstruction, hyperinflation, exercise capacity, dyspnea perception and quality of life by BMI strata in patients with COPD attending pulmonary clinics and enrolled in the BODE (Body mass index, airway Obstruction, Dyspnea, Exercise capacity) cohort.
Methods
Study Participants
The BODE registry is an ongoing prospective multi-center cohort study of COPD patients attending outpatient pulmonary clinics at one of the 5 BODE study centers (Tampa, Boston, Pamplona, Tenerife, and Zaragoza). The ethics committee at each of the participating centers approved the study and all patients signed informed consent.
The inclusion and exclusion criteria have been previously described.1 In summary, COPD was defined on the basis of a smoking history and lung function testing following the American Thoracic Society (ATS)/European Respiratory Society(ERS) standards.12 Patients were excluded if they had an illness other than COPD that was likely to result in death within 6 months or inability to take the lung function and 6-minute walk tests. Between November 1997 and March 2009, 1664 patients were enrolled in the study and followed until either the time of death or until March 2011.
Anthropometrics
Height was measured in bare or stocking feet and recorded in meters at 2 decimal levels. Weight was measured by calibrated scale in kilograms with participants wearing their normal clothes but without their shoes. To correct for this, a 1 kilogram (kg) of the measured weight was subtracted. BMI is calculated by dividing the subject’s weight in kgs by the square of height in meters.
Participants were assigned into one of the categories according to their recruitment BMI as: 1) BMI <21 kg/m2 (underweight) 2) 21<BMI<25 kg/m2 (normal weight) 3) 25≥ BMI <30 kg/m2 (overweight), 4) 30 ≥BMI <35 kg/m2 (obesity type I) and 5) BMI≥35 kg/m2 (obesity type II and III). This stratification is based on the NHLBI classification of overweight and obesity,6 modified for the cutoff for the underweight group based on the evidence that in patients with COPD a BMI of ≤ 21 kg/m2 are at increased risk of death.1,13 The Obesity Type II and III groups were merged in order to have a meaningful number of participants for the purpose of analysis.
Clinical Variables
Pulmonary function tests (post-bronchodilator FEV1 % predicted, FEV1/FVC, diffusing capacity of the lung for carbon monoxide [DLCO] and the inspiratory to total lung capacity ratio [IC/TLC]), and the 6-minute walk test (6MWD) were measured following the ATS/ERS standards.14-16 Participants completed the St. George’s Respiratory questionnaire (SGRQ) and the modified Medical Research Council dyspnea (mMRC) scale questionnaire .
Comorbidities were systematically recorded through direct questioning for the following conditions: 1) Those diseases included in the Charlson Comorbidity Index17 (19 comorbidities); 2) All comorbidities listed in the participant’s medical record; or 3) Those expressed during enrollment interviews and subsequent visits.
Survival and Cause of Death
The follow-up time was determined from the date of enrollment to the date of death or last study visit up to March 2011 (right censored). Death or loss to follow-up was verified by calling each participant or their family if they failed to return for appointments, and if we were unable to reach them, by checking the social security death index (United States).
Cause-specific mortality was ascertained by each site investigator to the highest detail possible and then categorized in a systematic and blinded fashion (masked to site, comorbidities and BMI) by 4 of the investigators (BC, CC, JZ and MD) as either death related to 1) respiratory causes including COPD, 2) cardiovascular diseases, 3) cancer, 4) other causes, or 5) unknown.18
Statistical Analysis
Continuous variables are reported as mean ± SD or median and 25-75 interquartile range. Comorbidity prevalence and cause-specific death are expressed as proportions. Comparisons between BMI groups were performed using the analysis of variance (ANOVA) test for categorical variables and for continuous variables with normal distribution the Tukey’s test or the Dunn’s test for non-normal distribution was used. We determined which particular comorbidity(ies) were independently associated with increased risk for death for each BMI category using the Cox proportional hazard model correcting for age, gender, degree of obstruction and cigarette smoking. We collapsed the BMI category ≥30 to 35 (n= 332) and the category ≥35 kg/m2 (n=156) into 1 category to increase the power of the model. A total of 24 candidate comorbidities were incorporated in the model selected from univariate analysis.
Survival is reported using a Kaplan–Meier survival plot and its significance tested using the log-rank test. The Cox proportional hazard model was used to evaluate the overall and cause-specific mortality risk for each BMI category, corrected for age and FEV1 % predicted. To estimate the effect in each BMI category, we calculated the risk ratios using patients with BMI 21<BMI<25 kg/m2 (normal weight1-4,6) as the reference group.
A p value of less than 0.05 was considered statistically significant. All analyses were performed using SAS JMP Pro ® software, version 11.0 (SAS Institute).
Results
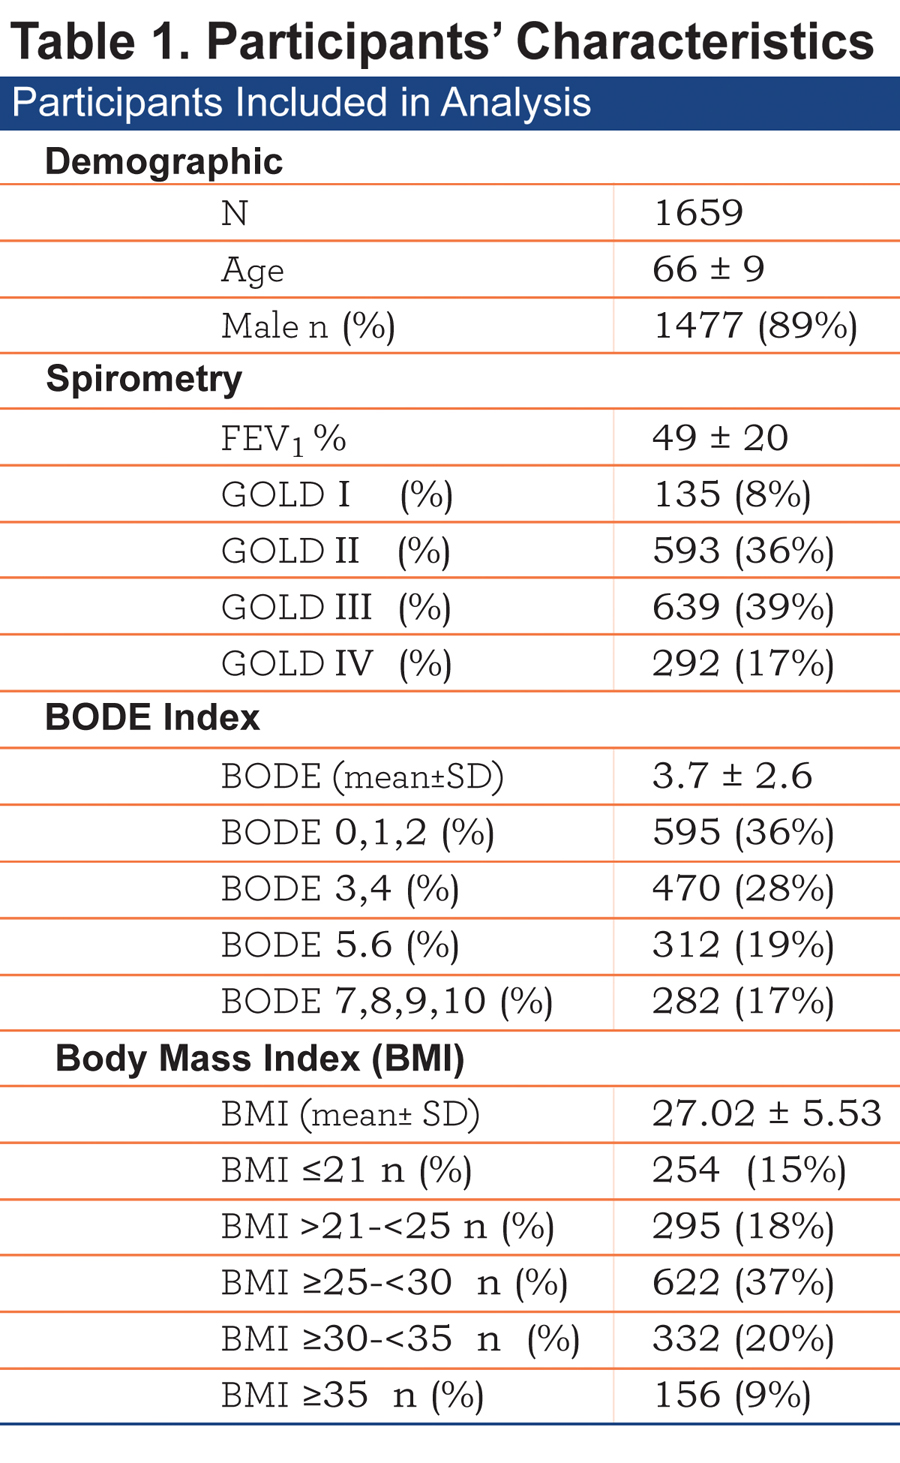
The baseline characteristics of the 1659 patients included are shown in Table 1.
Comorbidities by BMI Strata
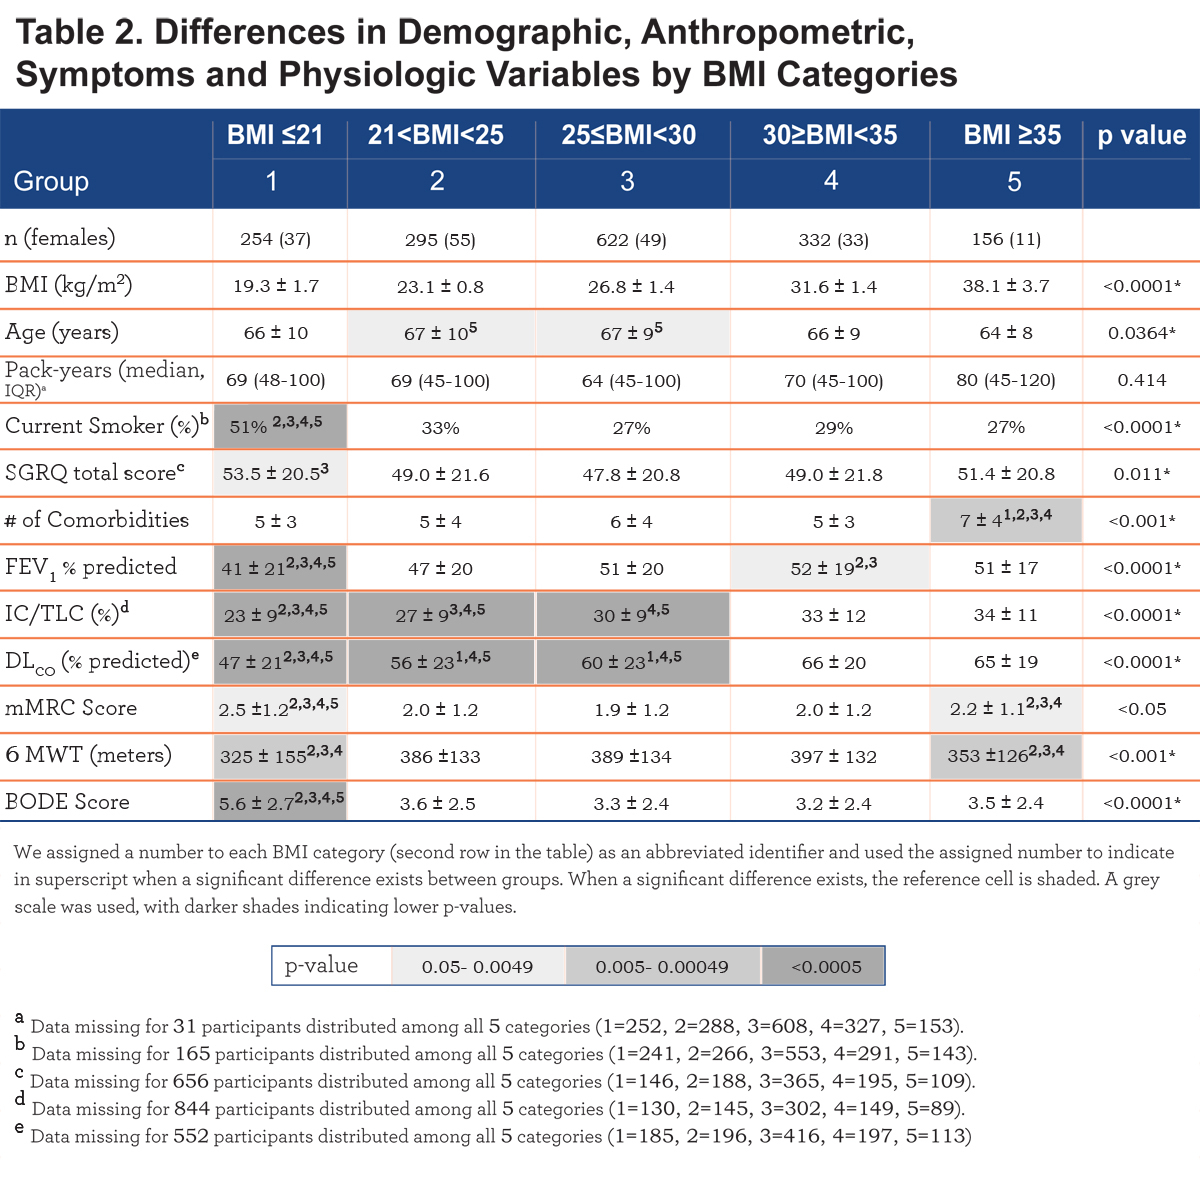
The number of comorbidities increases with each BMI category, with the highest number in the very obese (7± 4 comorbidities/patient, p<. 001) (Table 2). Comorbidities with more than 5% prevalence per group are displayed in e-Table 1 within the online supplement.
We observed significant differences at the extremes of the BMI spectrum: patients with BMI ≤ 21 kg/m2 had a significantly higher prevalence of abdominal aortic aneurism, substance abuse, osteoporosis, peripheral artery disease and for males, prostate cancer. On the other extreme, obese and very obese participants (BMI ≥30 kg/m2) had a higher prevalence of systemic hypertension, hyperlipidemia, sleep apnea, diabetes mellitus, chronic renal failure, congestive heart failure, gout, venous insufficiency, degenerative joint disease, pulmonary hypertension and for males, erectile dysfunction (e-Table 1 and Figure 1). Other comorbidities associated with increased risk for mortality in COPD 5,19 namely atrial fibrillation, pulmonary fibrosis, cancers and gastric/duodenal ulcer had similar prevalence in the different BMI groups (e-Table 1).
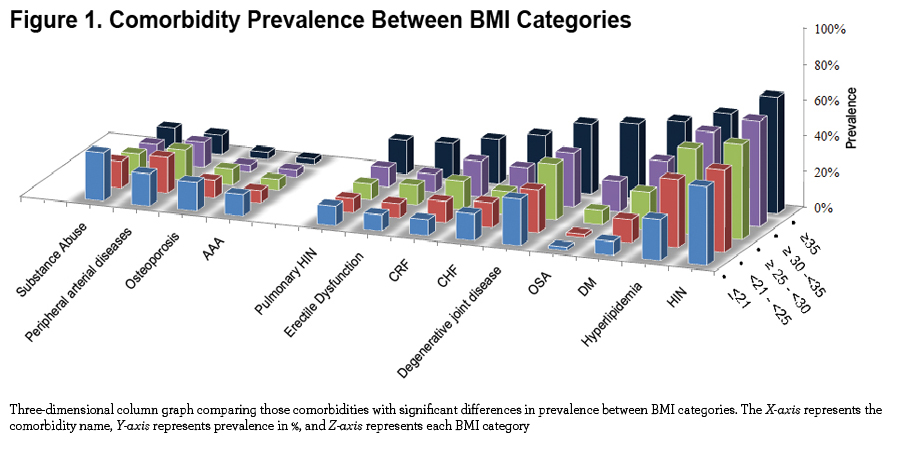
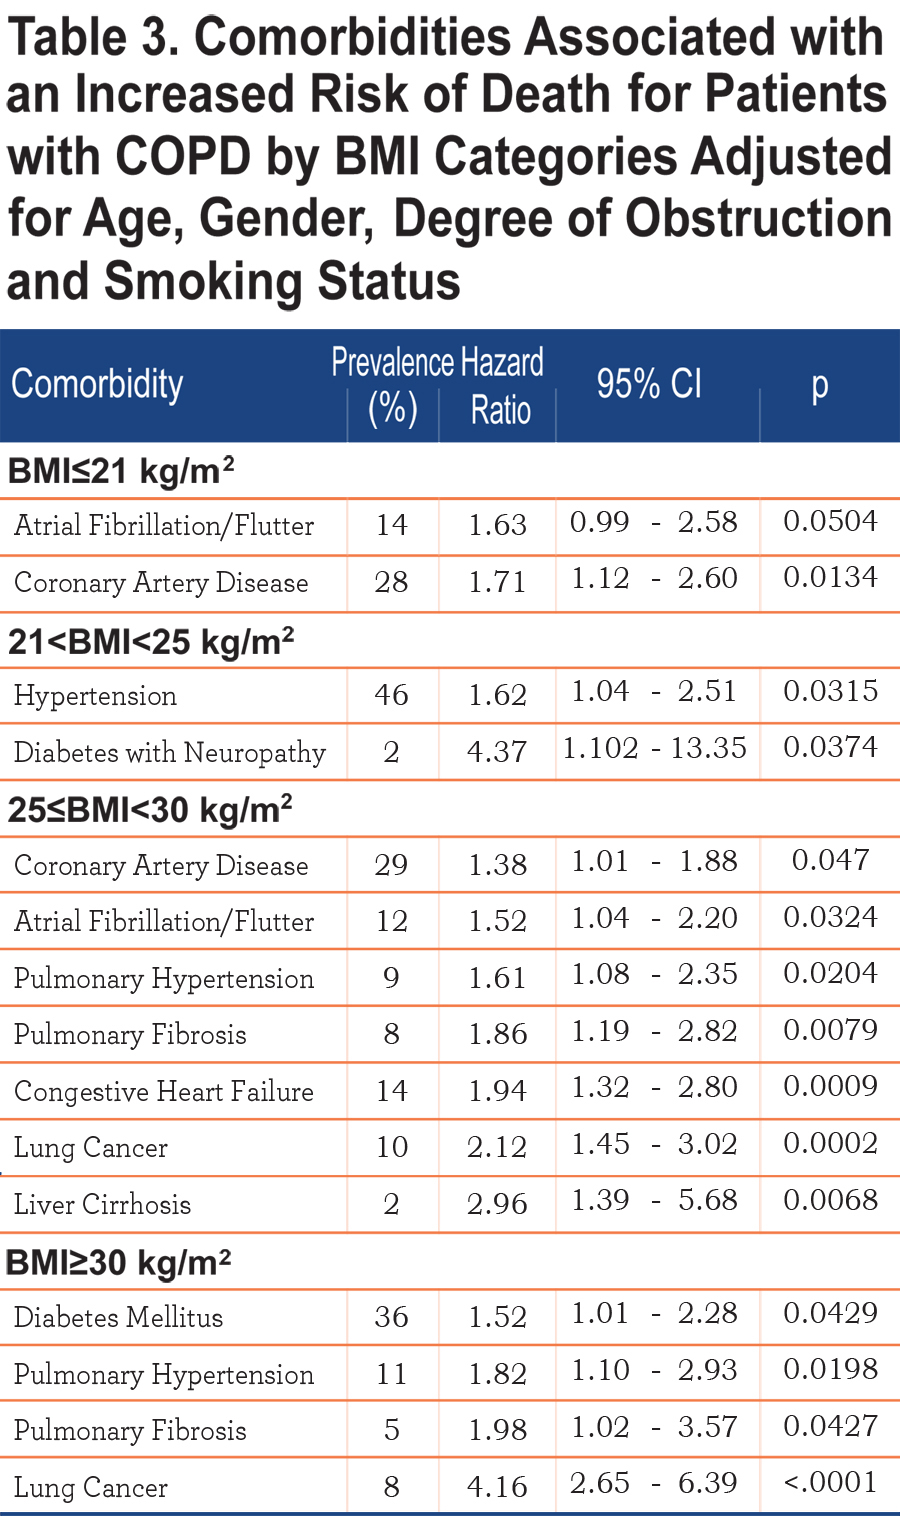
Table 3 shows those comorbidities that impact on survival in each BMI category independent of age and severity of obstruction. While only coronary artery disease and atrial fibrillation influences the ≤21 kg/m2 BMI group, lung cancer, diabetes mellitus with neuropathy, liver cirrhosis, congestive heart failure, pulmonary hypertension and pulmonary fibrosis are associated with increased risk of death in those with a BMI ≥ 25 kg/m2.
Clinical Variables by BMI Categories
Comparison of demographic, symptom and physiological variables by BMI categories are shown in Table 2 and e-Figure 1 (in the online supplement). The very obese (BMI≥35 kg/m2) were younger compared to the other categories, and all groups had similar cumulative cigarette exposure (pack/years), yet the underweight group had the highest percentage of current smokers.
Comparing from the lowest to the highest BMIs, an ascending linear relationship is seen in FEV1 % predicted and the number of comorbidities, while the BODE score has an inverse (worse) linear relationship. A “U” shaped pattern is seen for mMRC and the SGRQ scores, and an inverse “U” shape for the 6MWD (e-Figure 1 within the online supplement).
BMI, Survival, and Cause of Death.
The median follow-up was 51 months [IQR 27-77] and during this period we observed 671 deaths (40.5 %). The crude all cause mortality rate was 60%, 43% 37% 36% and 28% from the lowest to highest BMI groups respectively (p<. 0001). Specific causes of death (respiratory, cancer, cardiovascular, other and unknown causes) were proportional between groups except for respiratory cause of death which was significantly higher in the BMI ≤21 (67% of all deaths in this group) and BMI ≥35 (52% of all deaths in this group) compared to 46% and 32% in the other groups (p=0.0016) (e-Figure 3 within the online supplement).
The Kaplan-Meier curves are presented in e-Figure 2, the median [95% confidence interval (CI)] survival times in months from the lowest to highest BMI categories are 52 [46-59], 86 [69-100], 106 [97-∞], 120 [85-∞] and 114 [103-∞] respectively, and the differences are significant by the log-rank test (p<. 0001).
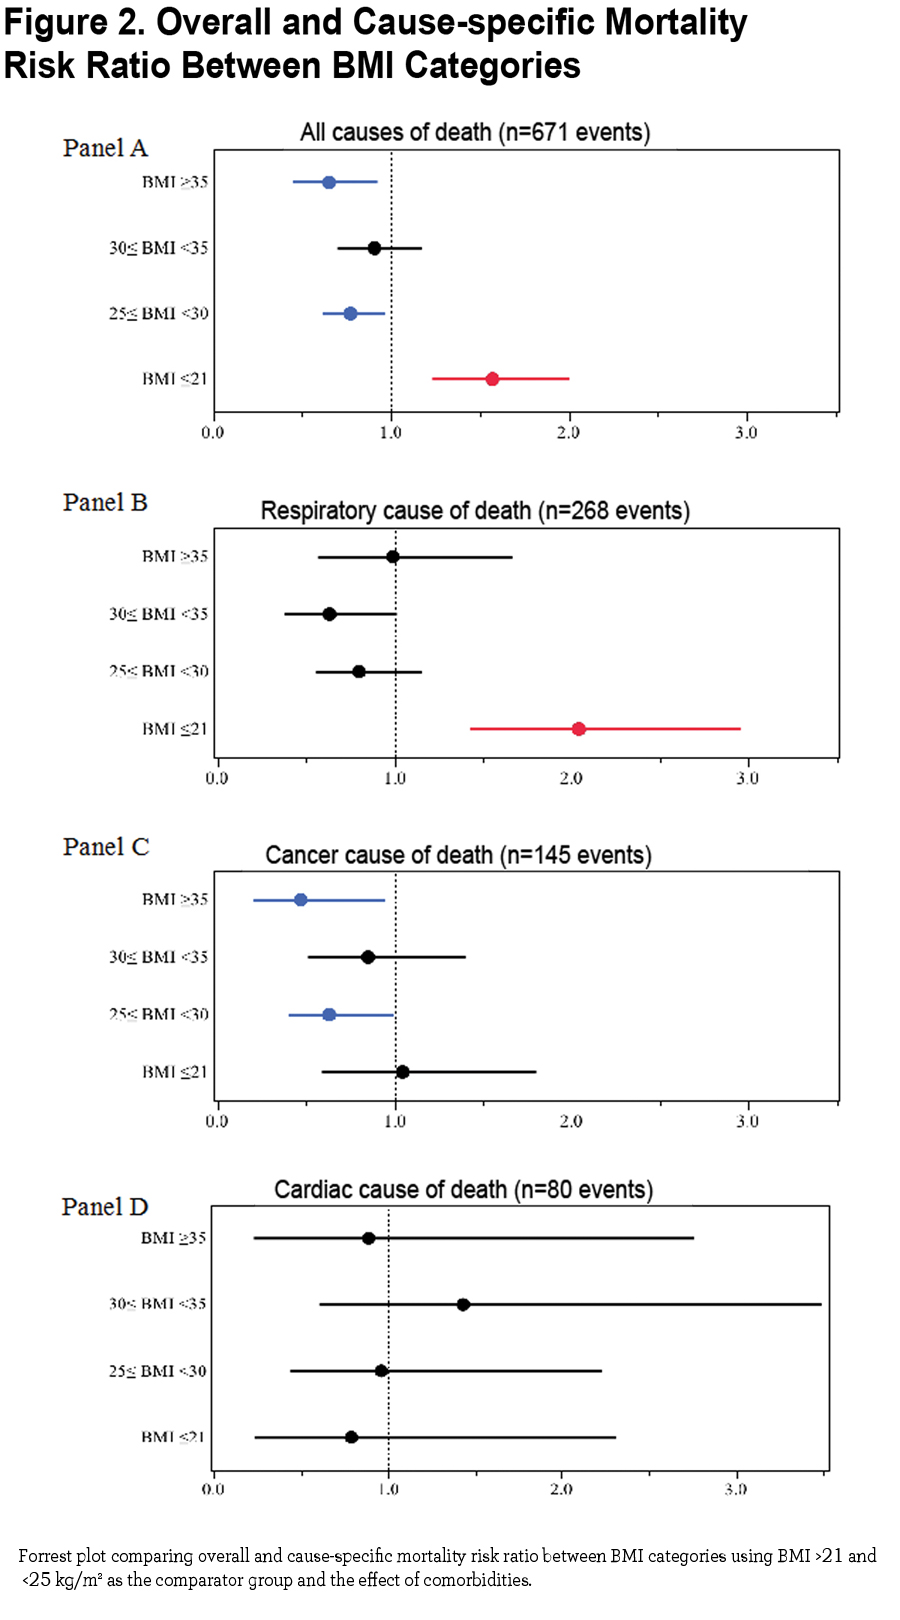
The mortality risk expressed as risk ratio adjusted for age and degree of obstruction (FEV1 % of predicted) using the group of BMI between 21 and 25 kg/m2 as the comparator are 1.57 (CI 1.24- 1.99, p =0.0002) for BMI ≤ 21 kg/m2, 0.77 (CI 0.62- 0.96, p 0.02) for BMI ≥25 and <30 kg/m2, 0.91 (CI 0.70 − 1.17, p=0.45) for BMI ≥30 and <35 kg/m2 and 0.65 (CI 0.46 − 0.91, p 0.01) for BMI ≥35 kg/m2 (Figure 2 Panel A). Risk ratios for cause-specific mortality are shown in Figure 2 Panel B (respiratory causes of death), Panel C (cancer cause of death) and Panel D (cardiac cause of death) demonstrating that respiratory cause of death is the main driver of increased risk for the lowest BMI group.
Discussion
This multi-center observational study of COPD patients attending outpatient clinics with a median follow up of 51 months had several findings. First, comorbidities clustered differently across BMI categories and specific comorbidities that impact independently on mortality are also different in the BMI groups. Second, the degree of obstruction, diffusing capacity and hyperinflation are worse at the lowest BMI group and follow an ascending linear pattern as BMI increases while quality of life, dyspnea perception and walked distance in 6 minutes are worse in both extremes of the BMI spectrum compared to patients in normal range of BMI, likely representing different mechanisms in their genesis. Third, we extend on previous reports by including a large number of patients with BMIs above 35kg/m2 (very obese COPD) showing that these patients had the lowest risk for short term (all-cause) death compared to underweight and normal weight patients.
Taken together these results provide evidence of an association between BMI, the clinical expression of comorbidity clusters and outcomes in patients with COPD.
BMI, Comorbidity and Clinical Expression of COPD
The finding that comorbidities cluster differently in COPD patients when categorized by BMI is informative as epidemiologic and association studies usually describe the impact of individual or limited number of comorbidities in smaller COPD cohorts.12,20-26 The lowest BMI group had more airflow obstruction, hyperinflation, osteoporosis, abdominal aortic aneurism, peripheral vascular disease and history of substance abuse, a cluster of findings that suggest a possible linkage through lung tissue, adipose tissue and mesenchymal stem cell (dys)function.27,28 The latter are capable of differentiating into a number of phenotypes, which include cells capable of fabricating bone, muscle, marrow, adipocytes, and connective tissue.27 On the other hand the very obese individuals had less airflow obstruction, little osteoporosis and exhibited a cluster of known comorbidities and risk factors for cardiovascular diseases with increased systemic inflammation. 1,13,29-31 Perhaps the adipose tissue plays a modulating role in disease expression in the 2 groups as the disease begins and progresses, a hypothesis that we believe deserves attention. 14-16,28
The relationship between specific comorbidities, BMI and the risk of death is depicted in Table 3. Whereas very few comorbidities were statistically associated with increased risk of death in the underweight, many more were associated with increased risk for death in patients in the higher BMI categories, suggesting that comorbidities play an important role in determining the final, but not necessarily the speed, of the outcome.
The very obese and the cachectic groups had worse health status and lower functional capacity than patients with more normal BMI. A simple unifying explanation is difficult to find, so it is tempting to speculate that the reasons for the observation may be due to different pathophysiologic mechanisms. Whereas in the cachectic patient air trapping and hyperinflation may contribute significantly to impaired function of the respiratory muscles, the very obese patient may be hindered by the effects of the weight on ventilatory and bodily functions. 1,9,32 In addition, patients in the cachectic group were more likely to be current smokers, which may help explain some of the differences.
Respiratory Cachexia or Obesity Paradox?
It is well established that low BMI increases the risk for mortality in patients with COPD, 6,33however, data for the very obese group of COPD patients (BMI above 35 kg/m2) is scarce as most large studies group the obese in a single category (BMI ≥30 kg/m2), probably because there are few very obese patients in those series. 7,8,11,34-36 Our study includes 156 individuals with morbid obesity and expands on previous observations that this group of patients has the lowest overall mortality (obesity paradox), despite a higher number of comorbidities. Interestingly, those who died were mainly from respiratory causes, an observation already described by Jordan et al in the National Health and Nutrition Examination Survey (NHANES III) 9,37and for which the reason remains unexplained, but should be explored as morbid obesity becomes a frequently observed phenotype in the COPD population.
We observed a cluster of characteristics in the undernourished subgroup associated with poor short-term prognosis and higher rates of respiratory death, including worse obstruction, hyperinflation, and dyspnea perception, lower walking distance and therefore a higher BODE index. This could provide a possible reason for the paradox, as BMI stratification clusters in both extremes of the spectrum of the short-term vs. longer-term risk factors. Our observation supports the hypothesis of time differential where obese and very obese COPD individuals may experience a slower process with potential clinical intervention (long term killer, short term protection) than the rapid effect of cachexia-malnutrition, a short term killer for which there is little success with known interventions. 10,38-40
In contrast, the higher number and the nature of comorbidities seen in obese vs. the low BMI individuals argues against the presence of a bias due to reverse causation.1,11,41,42 Our data indicates that the cachectic group had higher overall and respiratory cause of death, with less prevalence of comorbidities known to cause cachexia-malnutrition such as chronic renal failure or congestive heart failure. Similarly, our findings contend against survival selection bias because at baseline we excluded individuals with advanced cardiovascular diseases, active cancer or with any illness other than COPD likely to result in death in less than a year. Similarly, the difference was not due to age differential as we adjusted the Cox models for age and still obtained similar results.
Study Limitations
There are several limitations in our study. First, our conclusions are only applicable to predominantly male individuals with COPD recruited from pulmonary specialty clinics while seeking medical assistance. However, the similarity in their demographic and physiological characteristics to COPD patients attending primary care clinics17,43 and the large number of patients included and followed over a long period of time suggests that our findings could be extended to the clinician experience. Second, because we used BMI at study entry for our analysis, it could be argued that our findings reflect reverse causation,18,34,41 nevertheless we excluded patients with severe comorbidities and those at high risk of death, avoiding the inclusion of individuals with rapid weight loss, thus decreasing the reverse causation bias. Third, BMI is a marker of general adiposity and we failed to provide either the fat free mass or waist circumference measurements, both known to provide more information than BMI alone. 5,11However, BMI is clinically easy to measure, is recommended by the NHLBI and is associated with poor outcome in COPD. Fourth, an unintended source of bias could be introduced if clinicians screened for specific diseases in patients with different BMIs, such as cardiovascular diseases in obese individuals. Nevertheless, our results are aligned with the results of other studies using different disease ascertainment and analysis methods, supporting little influence from this potential bias.7,8,26 Finally it can be argued that the Cox model was underpowered for the BMI category ≤ 21 kg/m2 (n=254) resulting in a small number of comorbidities affecting mortality, nonetheless we used 24 comorbidities in our model (1 predictor: 10 participants). In addition, this group had the largest number of events (death) supporting the validity of our results.
In conclusion, different BMI categories are associated with distinct clinical expression and the number and type of comorbid diseases seen in patients with COPD. COPD patients categorized by BMI groups differ in survival and cause of death, suggesting that adipose tissue may be modulating the response to the irritants causative of COPD. In addition, our results expand on the so called obesity paradox phenomena, by showing that patients with COPD manifest different physiological, functional and perceptive expressions according to their BMI. Taken together, these results support the use of BMI as a stratifying variable to grade COPD.
Acknowledgments:
All listed authors attest that they: 1) made substantial contributions to the conception and design, acquisition of data, or analysis and interpretation of data; 2) drafted the article or revised it critically for important intellectual content; and 3) provided final approval of the version to be submitted for revision.
Declaration of Interest:
There is no direct or perceived conflict of interest in either the support, analysis and content of the manuscript by any of the authors. The authors of the manuscript are solely responsible for the data collection, analysis and crafting of the manuscript. There is no direct or indirect relationship with tobacco industry.