Running Head: COPDGene® 2019: Redefining COPD Diagnosis
Funding Support: The COPDGene® study is funded by National Heart, Lung, and Blood Institute grants U01 HL089897 and U01 HL089856. The COPDGene® study (NCT00608764) is also supported by the COPD Foundation through contributions made to an Industry Advisory Committee comprised of AstraZeneca, Boehringer-Ingelheim, Genentech, GlaxoSmithKline, Novartis, Pfizer, Siemens, and Sunovion.
Date of acceptance: October 11, 2019
Abbreviations: chronic obstructive pulmonary disease, COPD; computed tomography, CT; COPD Genetic Epidemiology study, COPDGene®; Global initiative for chronic Obstructive Lung Disease, GOLD; confidence interval, CI; forced expiratory volume in 1 second, FEV1; forced vital capacity, FVC; preserved ratio-impaired spirometry, PRISm; modified Medical Research Council, mMRC; low attenuation area, LAA; Hounsfield units, HU; square root of airway wall area for a standardized airway of 10 mm internal, Pi10; medical outcomes study short form 36, MOS SF 36; mental component score, MCS; physical component score, PCS; longitudinal follow-up, LFU; standard deviation, SD; odds ratio, OR; hazard ratio, HR; St George’s Respiratory Questionnaire, SGRQ
Citation: Lowe KE, Regan EA, Anzueto A, et al. COPDGene 2019: redefining the diagnosis of chronic obstructive pulmonary disease. Chronic Obstr Pulm Dis. 2019; 6(5): 384-399. doi: http://doi.org/10.15326/jcopdf.6.5.2019.0149
Online Supplemental Material: Read Online Supplemental Material (485KB)
Introduction
Chronic obstructive pulmonary disease (COPD) is a heterogeneous, chronic inflammatory process of the airways often involving destruction of adjacent alveoli and vasculature. Symptoms range from chronic productive cough to debilitating dyspnea. Disease trajectory can vary from years of stability to devastating acute exacerbations and respiratory failure. COPD remains a major burden on patients, their caregivers and the health care system.1 It is the 4th leading cause of death in the United States2 and is the 8th leading cause of disability as measured by disability-adjusted life years.3 An understanding of this disorder dates back centuries,4 including appreciation of the emphysematous5 and chronic bronchitic components.6 The diagnostic approach to this disorder was revolutionized with the invention of the spirometer7 and timed measurement of forced exhalation of expired air.8-10 The foundations of our current diagnostic approaches date to decades-old landmark meetings which established clinical criteria for bronchitis and emphysema11,12; the term COPD was first coined at the 9th Aspen Lung Conference.13
Based on this historical background, patients are currently diagnosed by spirometry, a history of exposure (smoking or other environmental factors) and respiratory symptoms at the time of presentation. The Global initiative for chronic Obstructive Lung Disease (GOLD) has advocated for a post-bronchodilator forced expiratory volume in 1 second (FEV1) to forced vital capacity (FVC) ratio less than 0.70 as the key diagnostic criterion14; this feature has remained controversial.15-22 Disease severity has been characterized using physiologic and, more recently, clinical parameters.23,24 Despite these approaches, it has become evident that disease trajectory can vary from years of stability to devastating acute exacerbations and respiratory failure.25,26 In addition, several groups have demonstrated that many smokers without traditional spirometric obstruction experience symptoms and structural changes (emphysema and airway wall thickening) similar to those seen in spirometrically diagnosed COPD.15,16 Disease progression data has shown that smokers who progress to spirometry-defined COPD typically progress through 1 of 3 pathways: (1) an airway-disease predominant pathway that progresses through the preserved ratio- impaired spirometry ([PRISm], low FEV1 with normal FEV1/FVC) phase27,28 into GOLD stages 2—4; (2) an emphysematous-predominant pathway that primarily progresses through GOLD stage 1 into GOLD stages 2—4; and (3) a combination airway-emphysema pathway that progresses directly from GOLD 0 stage to GOLD stages 2—4.29 The totality of this data has raised significant concerns regarding the optimal approach to taxonomic classification of COPD.30
We propose redefining the diagnostic criteria for COPD recognizing the spectrum of disease, including exposure, symptoms, spirometric findings, and image-based assessment of structural abnormalities. We present an analysis of baseline phenotyping and 5-year longitudinal progression of a large cohort of current and former heavy smokers enrolled in the COPD Genetic Epidemiology study (COPDGene®).31 Our analysis is based on the hypothesis that spirometric criteria alone are insufficient to characterize smoking-related disease burden. We propose a new diagnostic classification to: (1) identify individuals who are at higher risk of disease progression and mortality; (2) inform patients early in the course of the disease; (3) identify patients who may benefit from therapy; and (4) test new therapies to slow or halt disease progression in patients before disability or irreversible lung structural changes develop.
Methods
The COPDGene® study recruited non-Hispanic whites and African Americans, aged 45-80, who were current or former smokers with a reported smoking history of at least 10 pack years.31 Participants were recruited across the spectrum of pulmonary function and included those previously classified as having normal post-bronchodilator spirometry based on an FEV1 ≥ 80% predicted and an FEV1/FVC ratio ≥ 0.70, GOLD stages 1-4 as well as PRISm spirometry (FEV1 < 80% predicted and FEV1/FVC ratio ≥ 0.70). Individuals with known interstitial lung disease or initial computed tomography (CT) scans that suggested either interstitial lung disease or diffuse bronchiectasis were excluded from the current analyses (see online supplement Table S1). The COPDGene® study was approved by the institutional review board at each COPDGene® center, and all participants provided written informed consent. In addition, all protocols were approved by the institutional review boards at National Jewish Health and the University of Colorado-Denver. The COPDGene® study has 3 phases of participant assessment (i.e., baseline, 5-year and current ongoing 10-year visits) and began in 2007.
Phase 1 COPDGene® enrollment occurred between 2007-2012, and participants were invited to return for a follow-up evaluation after 5 years that was termed Phase 2. At both visits, pre- and post-bronchodilator spirometry was performed using the same spirometers and methodology. Change in FEV1 was calculated as evidence of disease progression beyond the expected normal age-related loss (i.e., > 350 ml loss over 5 years).
Patients with an FEV1 ≥ 80% predicted and an FEV1/FVC ratio ≥ 0.70 are often referred to as “normal spirometry” based on population standards. In a 5-year follow-up of these participants in the COPDGene® cohort, significant evidence of the development of airflow obstruction in individuals (i.e., significant loss of FEV1 where the FEV1 does not drop below the population lower limit of normal) has been identified, and we therefore use the term GOLD 0 rather than “normal spirometry” to define this group.15 The term PRISm (GOLD Unclassified) rather than restrictive spirometry has been used to define the group having an FEV1 < 80% predicted and an FEV1/FVC ratio ≥ 0.70.27,28
Participants were characterized using chest CT scans, spirometry (before and after bronchodilator inhalation), and patient-reported respiratory symptoms. The COPDGene® Phase 1 visit included 10,263 smokers. Those with bronchiectasis (n=30), interstitial lung disease (n=35), or who had undergone a lung transplant or lung volume reduction surgery (n=20) during follow-up were excluded from these analyses. An additional 1394 participants were excluded because they lacked data on 1 or more of the disease assessments (predominately excluded for lacking quantifiable CT data), and therefore, could not be fully classified. The final sample for analysis included 8784 participants.
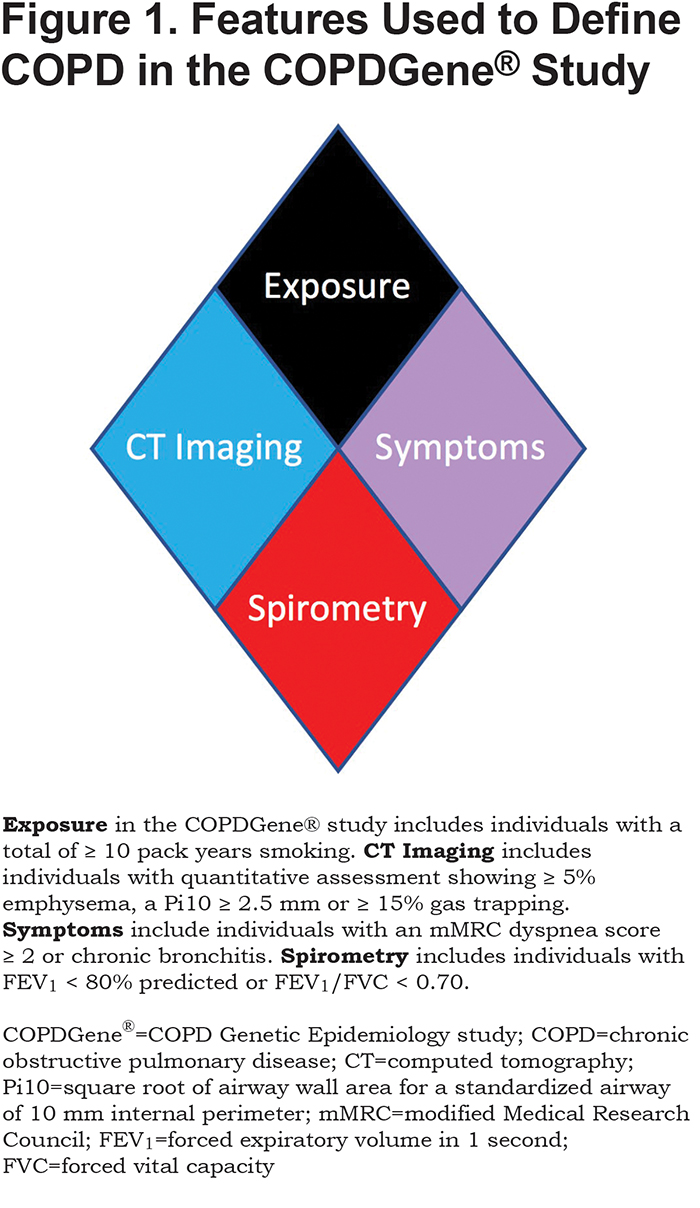
We tested novel criteria to identify COPD and evaluated these criteria for impact on disease progression and mortality. We considered 4 characteristics of disease linked to COPD: exposure, structural lung changes as quantitatively assessed by chest CT, respiratory symptoms, and spirometric evidence of impairment (Figure 1). Exposure: In COPDGene® the minimum exposure was a 10 pack-year smoking history. Symptoms: Self-report of dyspnea ≥ 2 on the modified Medical Research Council (mMRC) dyspnea score32 and/or chronic bronchitis (self-reported chronic cough and phlegm). CT Structural Abnormality: Defined as ≥ 5% emphysema (low attenuation area [LAA] ≤ ‑950 Hounsfield units [HU]) on inspiratory CT, and/or ≥ 15% gas-trapping (LAA ≤ ‑856 HU) on expiratory CT, and/or Pi10 (Square root of airway wall area for a standardized airway of 10 mm internal perimeter) ≥ 2.5 mm. Spirometry: Patients with abnormal spirometric values (FEV1 < 80% predicted and/or FEV1/FVC < 0.70) were classified as having spirometric evidence of disease.21
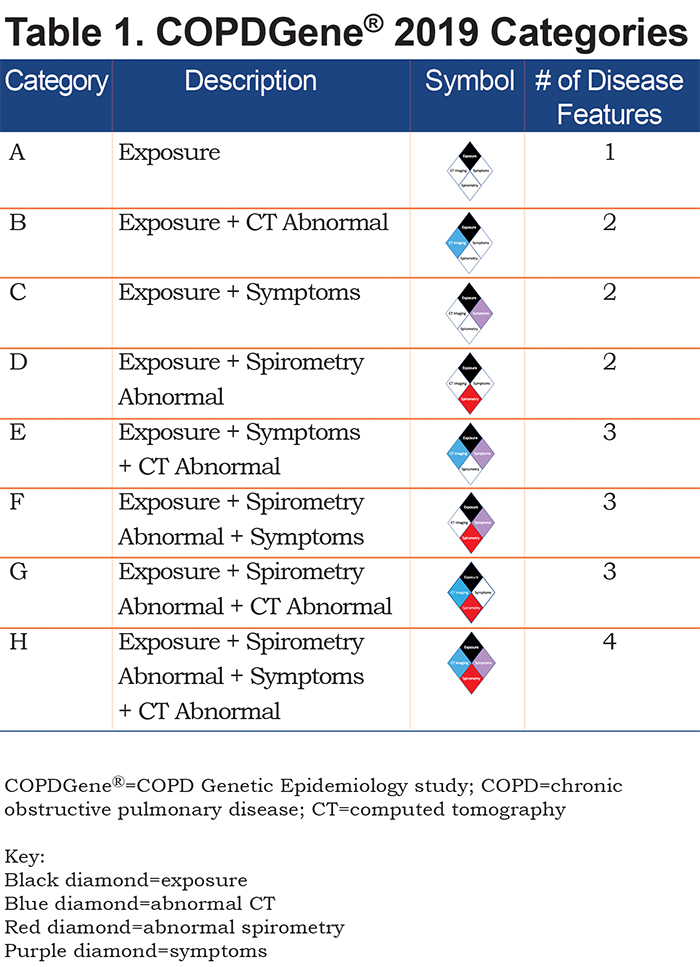
Using the 4 disease characteristics, participants were classified into 8 mutually exclusive categories. The 8 disease categories include all combinations of the 4 disease characteristics, with exposure considered positive in all due to the design of the COPDGene® study (Table 1). Thus, this proposed classification system would apply to current and former smokers. COPDGene® required a history of at least 10 pack years of cigarette smoking, and the mean smoking history ranged from 35 to 54 pack years (Table 2).
Assessment of Change in FEV1
Progression of loss of FEV1 was assessed in 4925 participants who returned for a Phase 2 visit that was scheduled approximately 5 years following the Phase 1 visit. The number of participants returning for a Phase 2 visit is shown for each Category (A—H) in online supplement Tables S2A—S2H, which also compares the demographics, clinical, physiologic and radiographic findings at Phase 1, of the participants who returned for a Phase 2 visit, with those who did not return for a Phase 2 visit and those who died without a Phase 2 visit.
Mortality Assessment
COPDGene® established a structure for monitoring longitudinal outcomes and events, including death, that was termed longitudinal follow-up (LFU).33 This was a multilayered process for participant contact and data collection that occurred every 6 months and included email contacts with website data entry, or automated phone calls with integrated data entry.33 If automated contacts were unsuccessful, direct coordinator calls to the participant were employed, and as necessary, to their secondary contacts. This LFU program was initiated during Phase 1 in 2009; contacts were made at 6-month intervals and are ongoing.
The outcomes and events tracked through the LFU program included: vital status (with follow-up determination of death, if no contact), any exacerbation and severe exacerbation (requiring emergency department visit or hospitalization), pneumonia, hospitalizations and various other comorbid disease events. Date of death was ascertained from a combination of next of kin reports, medical records, death certificates, and published obituaries. Supplemental searching of the Social Security Death Index was carried out to augment documented deaths on these subsets of the cohort but was limited by access to social security numbers (last Social Security Death Index search was November 2016). A last contact date (from LFU or participant tracking) was recorded for those participants not known to be deceased and used to calculate the time interval from study entry. The cause of death was adjudicated as described by Young et al.34
The current mortality dataset (established October 2018) included 10,263 participants. There were 1795 deaths recorded, with a mean follow-up time of 83 ± 31 (standard deviation [SD]) months, range 0–129 months. Mortality assessment for Categories A—H involved 8784 participants for which there were 1516 deaths (mean follow-up time was 86 ± 29 (SD) months, range 0–129 months).
Statistical Analysis
We initially evaluated baseline demographics, spirometry, respiratory symptoms, and CT metrics of the cohort by COPD diagnosis category. We evaluated spirometric progression using logistic regression and all-cause mortality using Cox proportional hazards modeling. Models were run using 4 disease characteristics within the 8 categories as defined in Figure 2. The Reference Category remained the same in all models: asymptomatic smokers without evidence of CT abnormality and normal spirometry (Category A, Figure 1). The logistic regression model calculating the odds of abnormal spirometric progression (FEV1 loss > 350 ml over 5 years) was adjusted for participant age at study entry, sex, race, current smoking, pack years, and baseline FEV1 post-bronchodilator. Cox regression models were used to estimate hazard ratios for all-cause mortality. Cox models were implicitly adjusted for age by using age as the underlying timescale. The Cox regression models for all-cause mortality were additionally adjusted for sex, race, pack years and current smoking. Confidence intervals (CI) of 95% are provided. A limitation of the statistical analysis is that adjustments were not made for missing data. The primary cause for missing participants was the absence of CT imaging for expiratory CT scans. This type of missing data is deemed not to be related to disease or outcome and is not likely to bias the statistical analysis. Participants lost due to death are most important in analysis of participants meeting GOLD 3 or 4 criteria.
Participants were invited to return for Phase 2 visits 5 years after initial enrollment. These visits occurred between 2012—2017. Of the 8784 participants included in the current analysis, 4925 completed a Phase 2 visit. These are the participants who were used to compute the odds ratio (OR) for change in FEV1 (Figure 2). The missing participants from this analysis included 3859 participants, of which 1178 died prior to the Phase 2 visit and 2681 were either lost to follow-up or declined to return. Online supplement Tables S2A–S2H give the characteristics of those participants in each disease category who returned for Phase 2 visits and for those who did not return.
Results
Baseline Characterization
We classified participants into 8 different categories of smokers who spanned the spectrum of spirometric disease severity from normal to advanced abnormality. All categories had a heavy smoking exposure (Table 2).
The following 8 categories were defined (note all groups are positive for exposure; i.e., cigarette smoking):
A. Exposure only: Reference Category
B. CT abnormal (emphysema, airway wall thickness or gas trapping)
C. Symptoms (dyspnea or chronic bronchitis)
D. Spirometry abnormal (low FEV1 or FEV1/FVC ratio)
E. Symptoms plus CT abnormal
F. Symptoms plus spirometry abnormal
G. Spirometry abnormal plus CT abnormal
H. Symptoms plus spirometry abnormal plus CT abnormal
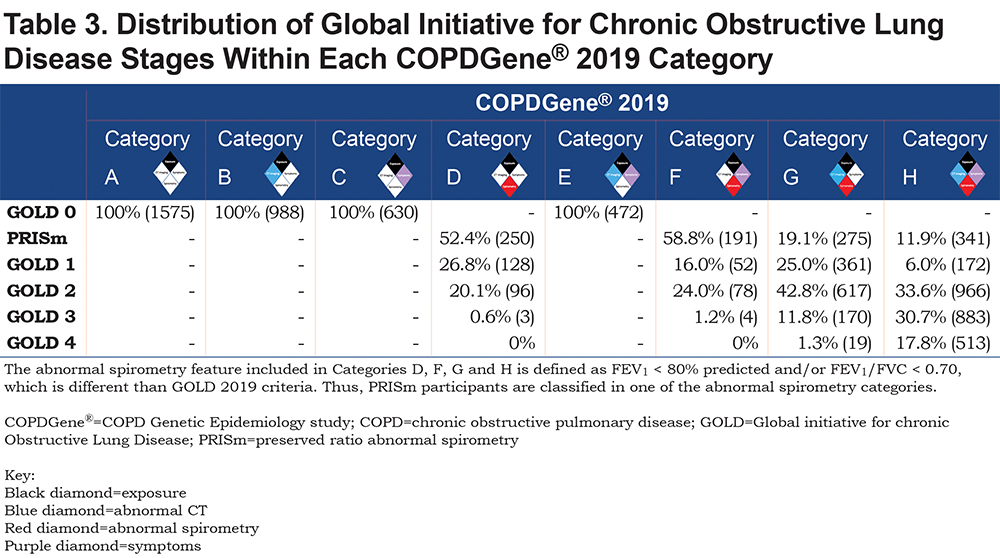
The distribution of GOLD stages across the proposed COPDGene® 2019 categories is shown in Table 3, and baseline demographics can be found in Table 2.
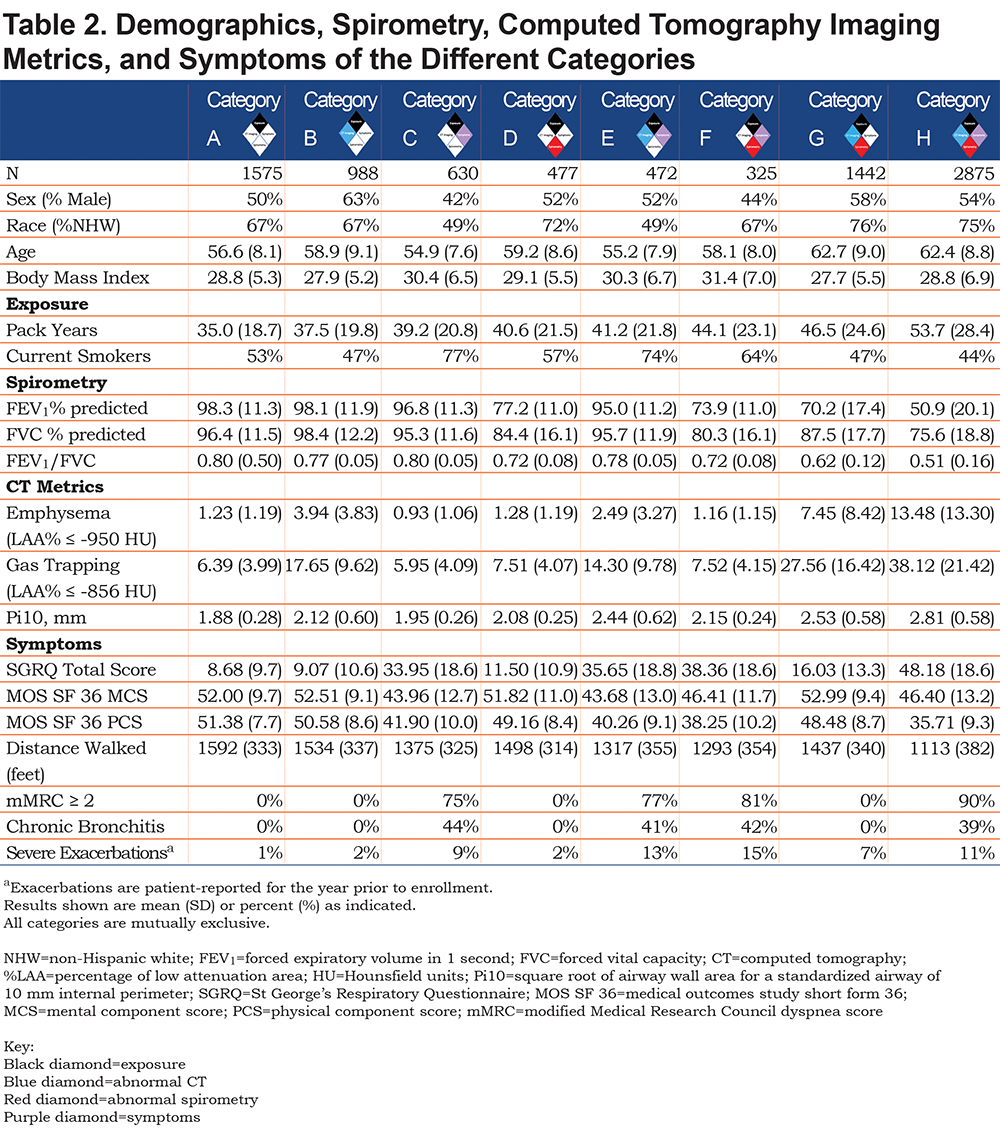
Category A (Reference Category, n=1575) exhibited the least spirometric abnormality with average FEV1% predicted of 98% and average FEV1/FVC of 0.80. They exhibited little to no evidence of disease on chest CT, and they have the lowest St George’s Respiratory Questionnaire (SGRQ) total score (8.7, SD 9.7) of the 8 categories.
Category B (CT abnormal, n=988) also had similar spirometry (average FEV1% predicted 98%, average FEV1/FVC 0.77) and similar SGRQ to the Reference Category (9.1, SD 10.6). Average gas-trapping (at ‑856 HU on expiratory images) in this category was 17.65%, average emphysema was 3.94%, and average Pi10 was 2.12 mm.
Category C (Symptoms, n=630) had a worse quality of life with a higher SGRQ total score (34.0, SD 18.6) but similar spirometry to the Reference Category (average FEV1% predicted 96.8%, average FEV1/FVC 0.80).
Category D (Spirometry abnormal, n=477) was largely composed of participants classified as PRISm or GOLD 1–2 (average FEV1% predicted 77.2%, average FEV1/FVC 0.72). Category D had a slightly higher SGRQ total score (11.5, SD 10.9). CT metrics were similar to the Reference Category, with a slight increase in airway wall thickness (Pi10).
Category E (Symptoms plus CT abnormal, n=472) had slightly lower spirometric values (average FEV1% predicted 95%, average FEV1/FVC 0.78). Similar to Category C, Category E had an elevated SGRQ score (35.7, SD 18.8). Gas-trapping was slightly lower (mean 14.3%) and the Pi10 was slightly higher (2.44 mm, SD 0.62) than Category B.
Category F (Symptoms plus spirometry abnormal, n=325) was largely clustered in the less severe spirometric range, with 58.8% PRISm, 16.0% GOLD 1, and 24% GOLD 2. Approximately 1% would have been classified as GOLD 3, and these 4 participants were very close to the GOLD 2 range. Mean FEV1% predicted was 73.9%, mean FEV1/FVC was 0.72, and the mean SGRQ Total score was 38.4 (SD 18.6).
Category G (Spirometry abnormal plus CT abnormal, n=1442) resulted in a distribution of participants broadly across the spirometric spectrum (mean FEV1% predicted 70.2%, mean FEV1/FVC 0.62) and included participants in all GOLD classifications. However, this category was less symptomatic with a lower SGRQ total score (16.0, SD 13.3) than Category F. Structural damage on CT imaging was extensive, with mean 27.6% gas-trapping, 7.5% emphysema, and Pi10 of 2.53 mm (SD 0.58).
Category H (Symptoms plus spirometry abnormal plus CT abnormal, n=2875) was clearly the most severely affected, with abnormal spirometry (mean FEV1% predicted 50.9%, mean FEV1/FVC 0.51), extensive CT abnormalities, and symptoms. Participants in this category had mean gas-trapping of 38.1%, 13.5% emphysema, and Pi10 of 2.81 mm (SD 0.58). They had the highest SGRQ total score (48.2, SD 18.6).
Disease Progression
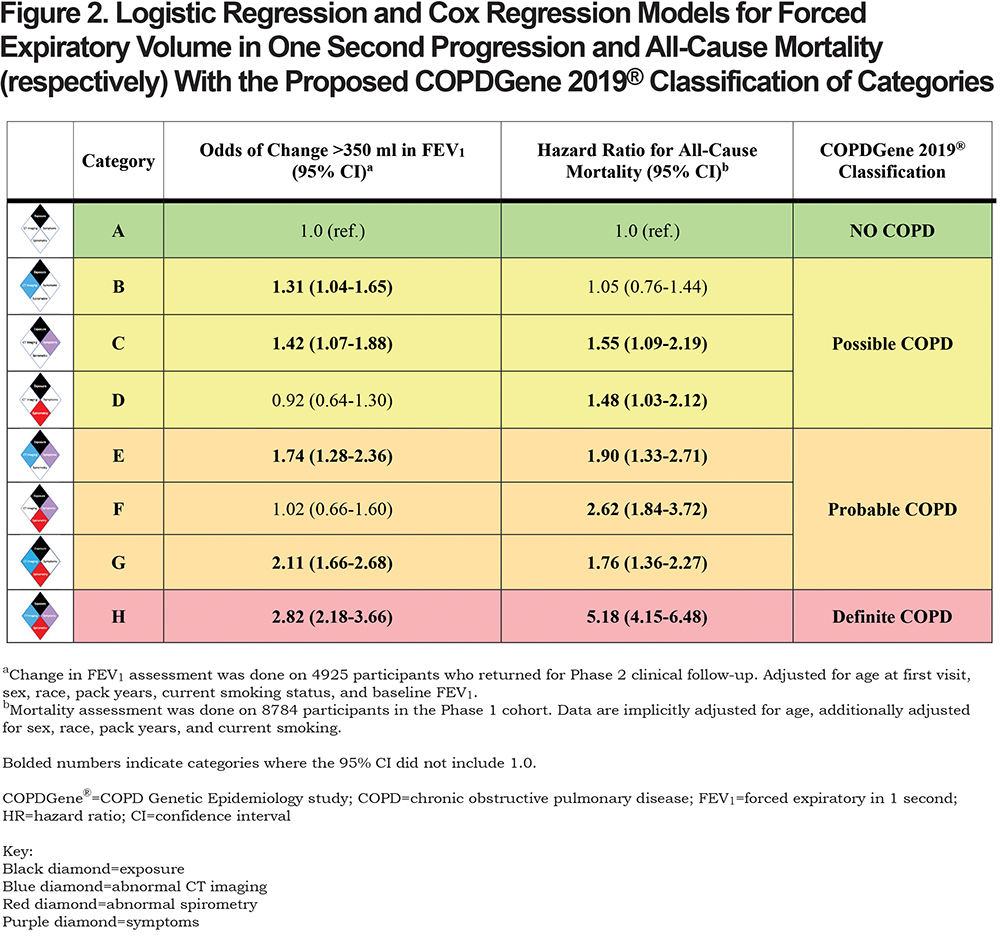
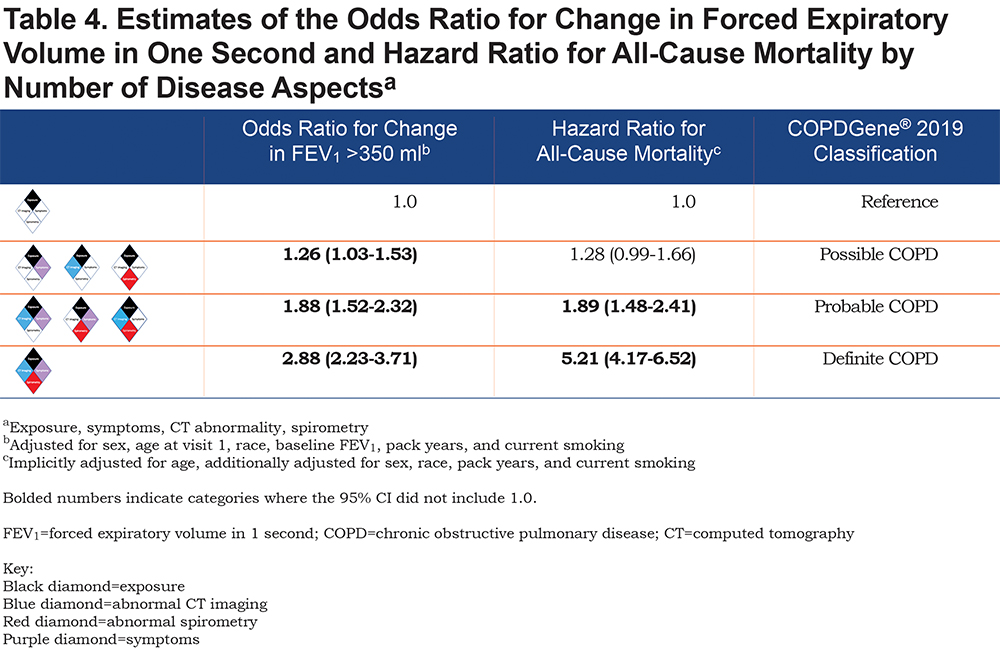
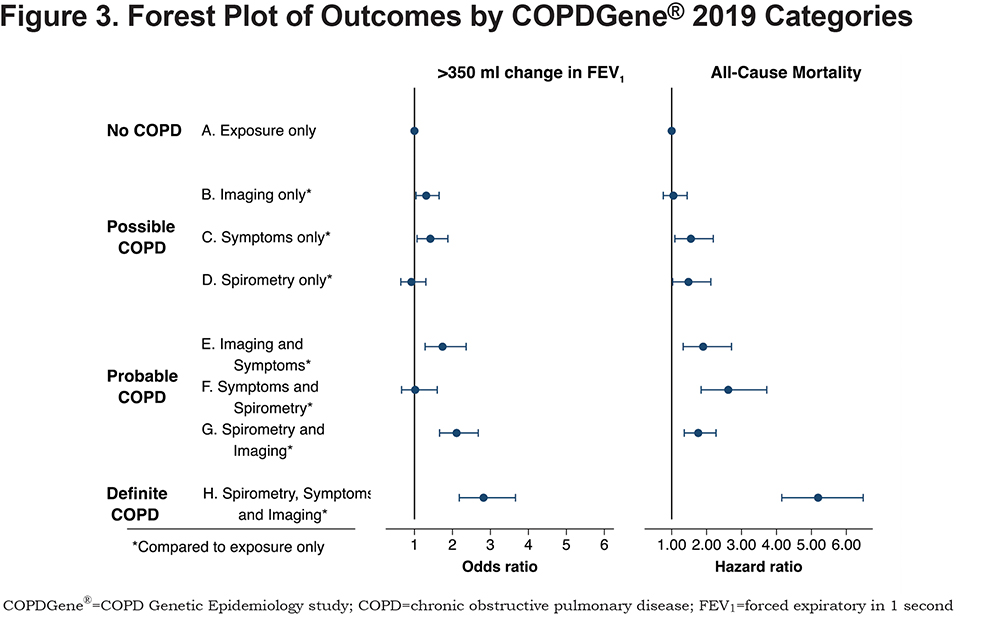
A summary of the OR for progression and hazard ratio (HR) for mortality is shown in Figure 2. Table 4 shows the OR for progression and HR for mortality when the participants were grouped by their classification into categories of Possible COPD (2 disease characteristics), Probable COPD (3 disease characteristics) or Definite COPD (4 disease characteristics). Forest plots with the 8 categories and their corresponding OR for disease progression, and separately with their HR for all-cause mortality are shown in Figure 3.
Category B (CT abnormal): The OR of FEV1 progression in the category with only CT abnormalities was 1.31 (95% CI: 1.04–1.65) compared to the reference. There was no evidence of increased all-cause mortality (HR 1.05, 95% CI: 0.76–1.44). Similar to the Reference Category, Category B did not report many severe exacerbations (2% of participants had a hospitalization in the past year).
Category C (Symptoms): A total of 9% of Category C reported a severe COPD exacerbation within the past year, compared to 1% in the Reference Category, and had an increased OR of > 350 ml reduction in FEV1 over 5 years (OR 1.42, 95% CI: 1.07–1.88). Category C also had an increased HR for all-cause mortality (HR 1.55, 95% CI: 1.09–2.19) when compared to the Reference Category.
Category D (Spirometry abnormal): Compared to the Reference Category, there was no evidence of increased odds of disease progression based on FEV1 change (OR 0.92, 95% CI: 0.64–1.30). However, there was evidence of an increased HR for all-cause mortality (HR 1.48, 95% CI: 1.03–2.12).
Category E (Symptoms plus CT abnormal): There was evidence for an increased OR of FEV1 decline (OR 1.74, 95% CI: 1.28–2.36) and evidence for increased mortality (HR 1.90, 95% CI: 1.33–2.71) compared to the exposure-only category. This category had a high rate of severe exacerbations, with 13% of participants reporting a severe exacerbation in the past year.
Category F (Symptoms plus spirometry abnormal): There was no evidence of an increased OR of FEV1 decline in this category (OR 1.02, 95% CI: 0.66–1.60), but there was an increased HR for mortality (HR 2.62, 95% CI: 1.84–3.72).
Category G (Spirometry abnormal plus CT abnormal): The OR of FEV1 progression in this category was 2.11 (95% CI: 1.66–2.68) and the HR for all-cause mortality was 1.76 (95% CI: 1.36–2.27) when compared to the exposure only category.
Category H (Symptoms plus spirometry abnormal plus CT abnormal): OR of spirometric progression was highest in this category (OR 2.82, 95% CI: 2.18–3.66) and mortality was 5 times higher than in the Reference Category (HR 5.18, 95% CI: 4.15–6.48). Approximately 11% of this category reported a severe exacerbation within the past year.
Intensity of smoking (pack years) was not used to define disease categories; however, pack years is strongly associated with disease severity, going from 35.0 pack years in Category A to 53.7 pack years in Category H (Table 3). Current smoking status strongly correlates with symptoms. Categories C and E, selected by symptoms without spirometric abnormality, have high rates of current smoking (77% and 74%, respectively) and high incidence of exacerbations in the year prior to enrollment, while spirometrically abnormal categories without symptoms (D and G) have lower levels of current smoking (57% and 47%, respectively) and report fewer exacerbations. Categories based on symptoms (C, E, F, H) also demonstrate lower 6-minute walk distance test results.
More disease manifestations were associated with greater risk of disease progression and higher mortality overall. CT imaging abnormalities and clinical symptoms alone were each associated with an increased risk of enhanced loss of FEV1 (OR 1.31, 95% CI: 1.04–1.65 and OR 1.42, 95% CI: 1.07–1.88, respectively) (Figure 3). Symptoms alone were also associated with an increased HR for all-cause mortality of 1.55 (CI: 1.08–2.19). Interestingly, abnormal spirometry alone was not predictive of spirometric progression (OR 0.92, 95% CI: 0.64–1.30), although it was associated with a significant HR for mortality of 1.48 (CI: 1.03–2.12).
Of the 3665 GOLD 0 participants in this analysis, 2090 (57%) showed some combination of structural damage on CT or respiratory symptoms. Of the PRISm participants , the inclusion of FEV1 < 80% predicted as a spirometric criteria moved them into categories D, F, G, and H. Category E, representing patients without abnormal spirometry but exhibiting both structural abnormalities on CT scan and respiratory symptoms, had striking associations to disease progression (OR 1.74, 95% CI: 1.28–2.36) and mortality (HR 1.9, 95% CI: 1.33–2.71) (Figure 2). Category F with abnormal spirometry and respiratory symptoms by comparison, was the smallest category, did not show significant progression but experienced increased mortality (HR 2.62, 95% CI: 1.84–3.72) (Figure 2). More than half (59%) of these participants were PRISm (Table 3).
Clinical features of each category (Table 2) reflect the selection process with categories based on imaging abnormalities (B, E, G, H) having greater emphysema, gas trapping, and airway disease. Those selected in part for spirometry abnormalities (D, F, G, H) have lower values for FEV1 and FEV1/FVC and those selected for symptoms have worse SGRQ scores and higher proportions of participants reporting significant dyspnea or chronic bronchitis.
The number of positive categories appears to strongly impact the outcomes of spirometric progression and mortality (Table 4). One positive manifestation beyond exposure (Possible COPD) has an overall OR 1.26 (95% CI: 1.03–1.53) for progression, and overall HR 1.28 (95% CI: 0.99–1.66) for mortality. Two disease manifestations beyond exposure (Probable COPD) have an overall OR 1.88 (95% CI: 1.52–2.32) for progression and HR for mortality of 1.89 (95% CI: 1.48–2.41), while 3 disease manifestations beyond exposure (Definite COPD) has an OR for progression of 2.88 (95% CI: 2.23–3.71) and an HR for mortality of 5.21 (95% CI: 4.17–6.52).
Discussion
COPD continues to present an increasing burden on patients and the health care system.1 Although therapeutic options exist to improve pulmonary function and symptoms, there are limited options to stop or slow disease progression. This, in part, reflects the tremendous heterogeneity in disease manifestation and longitudinal disease course. Although the pathological nature of the disease has been appreciated for centuries, current diagnostic criteria rely on spirometric measures. Over the past several years, it has become evident that patients without spirometric abnormalities experience respiratory symptoms and acute exacerbation-like events.15,16 CT imaging in these individuals often demonstrates significant structural abnormalities. We tested the hypothesis that spirometric criteria alone are insufficient to characterize smoking-related disease burden.
In a cohort of over 10,000 individuals who have an extensive history of cigarette smoking, careful baseline phenotyping and a 5-year longitudinal assessment were done. Using this data, we demonstrate: (1) significant differences in physiological, symptomatic and CT structural imaging abnormalities despite similar cigarette smoke exposure; (2) the ability to characterize patients into mutually exclusive categories that define the multidimensional nature of disease manifestation; and (3) the incremental influence of these manifestations on traditional measures of disease progression, including lung function decline and all-cause mortality.
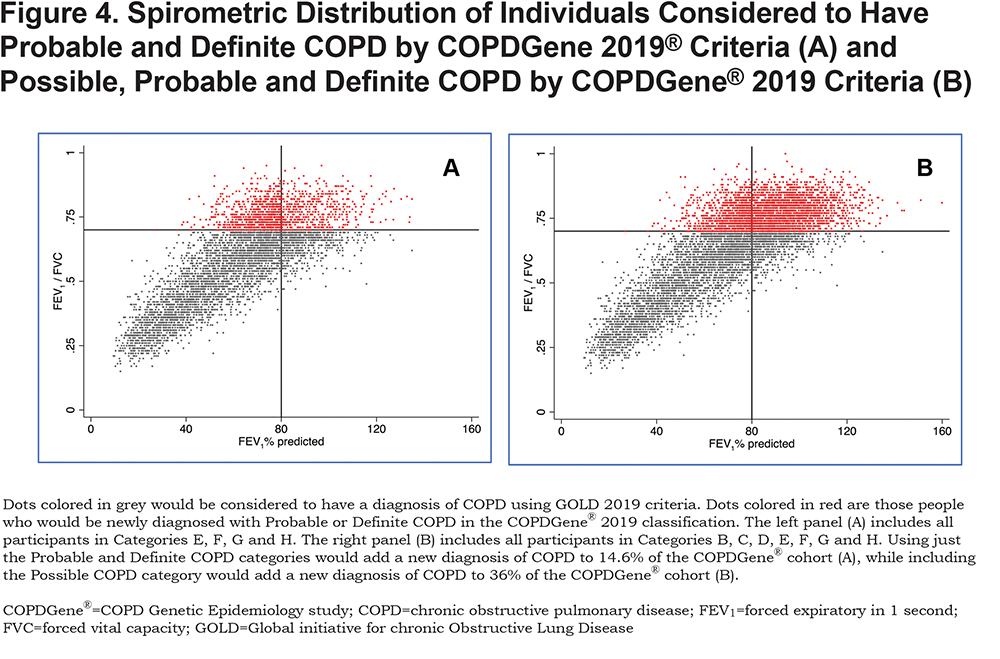
COPD is a heterogeneous disease in which each patient appears to display a unique set of disease manifestations. Our comprehensive analyses suggest that spirometry alone fails to capture and contextualize the extent of disease manifestation. For example, the classically used diagnostic criteria fail to diagnose those with early but symptomatic disease and do not consider individuals whose pattern of disease progression is that of a concurrent loss of both FEV1 and FVC, resulting in maintenance of an FEV1/FVC ratio ≥ 0.70. We define these patients as having PRISm physiology, an important pathway of early disease progression.27,28,35,36 The COPDGene® 2019 criteria will diagnose COPD in a large number of individuals (heavy current and former smokers) who have an FEV1/FVC ratio ≥ 0.7 and who would be located within the GOLD stage 0 and PRISm categories. The data in Figure 4 shows that adding COPDGene® 2019 categories Probable and Definite COPD would include an additional 1279 participants in the diagnosis of COPD, which is 14.6% of this population. Including Possible COPD under the COPDGene® 2019 diagnostic criteria would add another 21.4% of the population or 1868 additional individuals to be diagnosed as COPD patients.
Our proposed categories would redefine the diagnosis by better capturing the spectrum of disease seen in COPD patients, including recognizing early onset of disease, identifying patterns of disease progression, and better predicting morbidity and mortality. The Reference Category has relatively normal spirometry, little to no evidence of disease on chest CT scans, and the least impaired quality of life of the 8 categories. Category H, which exhibits abnormalities in all 4 disease characteristics, is the most burdened with severe airflow obstruction, extensive structural abnormalities on CT, respiratory symptoms, poor quality of life, reduced 6-minute walk distance results, and exacerbations. Importantly, these findings, in concert with the worst outcome for FEV1 progression (OR 2.82, 95% CI: 2.18–3.66) and highest mortality (HR 5.18, 95% CI: 4.15–6.18), describe the impact of extensive, late-stage and likely irreversible COPD. However, the other categories (B through G) exhibit incremental impact of disease manifestations on outcomes, function and events. The observation that these manifestations are associated with late-stage disease and also impact the outcomes of disease progression and mortality suggests strongly that they should be integrated into the diagnostic spectrum for COPD.
Patients with another established disease diagnosis that would explain their symptoms, CT findings or spirometric findings should be considered for exclusion from a diagnosis of COPD. For example, cardiovascular and musculoskeletal diseases are common causes for dyspnea or exercise limitation. Interstitial lung disease and obesity are common causes of PRISm physiology.
Increasing the population to be considered for inclusion within a COPD diagnosis makes sense biologically, as disease processes begin before physiologic compromise is sufficient to satisfy a disease definition based only on significant airway obstruction. Doing so can highlight individuals who should be targeted for disease modifying therapy, particularly early in the disease course. Increasing the population within the scope of COPD, however, will also increase the importance of personalized medicine. In this context, it is likely that individuals within GOLD 0 and PRISm who are at risk for disease progression are mechanistically heterogeneous. Further studies to better delineate this heterogeneity will be essential for development and implementation of novel therapies.
Limitations to the COPDGene® 2019 criteria include that it currently applies only to individuals with a substantial smoking history. Substantial smoking was an entry criterion for COPDGene®. The COPDGene® 2019 criteria do not consider comorbid conditions or the effects of current treatment. The analysis needs to be extended to include data from other cohorts assessing occupational exposures, environmental pollutant exposures and environmental biomass exposures. The COPDGene® cohort includes data from African American and non-Hispanic white participants and future studies will be needed to study other ethnicities. Both inspiratory and expiratory chest CT scans were obtained. Thus, measurements of -950 HU and -856 HU were obtained at 2 different lung volumes. The thresholds used to define emphysema, gas trapping and airway wall thickening were developed based on COPDGene® CT imaging protocols and the specific software used for analyses; other CT protocols and analytical software may require different thresholds for these disease-related characteristics.
We propose that utilizing increases in the number of positive disease aspects (representing the number of disease manifestations in an individual) is a useful method for classification allowing additional diagnoses of Possible COPD and Probable COPD to that of Definite COPD. We demonstrate that incremental disease manifestations are associated with worse outcomes as reflected by lung function decline and mortality. Current COPD diagnostic criteria fail to capture individuals with smoking-related disease who are at increased risk of progressive lung function loss and mortality. Defining individuals who are symptomatic but who do not yet show CT evidence of structural lung disease as Possible COPD will improve access to secondary prevention strategies such as aggressive efforts to stop smoking and interventions with pulmonary rehabilitation. An expanded definition will also enable clinical development of potential disease-modifying therapies.
Acknowledgements
The authors wish to thank the thousands of patients who participated in the COPDGene® study over the last 10 years, including the “impatient patient,” the late John W. Walsh, who helped conceive the original COPDGene® study concept. John’s support, fueled by his own tireless passion and enthusiasm to one day “find a cure for COPD,” was invaluable to the COPDGene® study’s early success.
Author Contributions: JDC, EKS, EAR, JEH, GLK, KAY, KEL and BJM had full access to all the data in the study and take responsibility for the integrity of the data and the accuracy of the data analysis. COPDGene® investigators were instrumental in the design and implementation of the COPDGene® study and collected and analyzed data cited in this article. All authors have reviewed, approved and endorsed all content and conclusions of this article.
Declaration of Interest
The COPDGene® study is funded by National Heart, Lung, and Blood Institute grants U01 HL089897 and U01 HL089856. The COPDGene® study (NCT00608764) is also supported by the COPD Foundation through contributions made to an Industry Advisory Committee comprised of AstraZeneca, Boehringer-Ingelheim, Genentech, GlaxoSmithKline, Novartis, Pfizer, Siemens, and Sunovion.
While some individual authors of this manuscript were employed by one of the listed funders at the time the work of this study was conducted, these employment relationships did not constitute undue influence by funders. These funders have had no official role in the collection, management, analysis and interpretation of the data or design and conduct of the study. All authors have completed a Conflict of Interest form, disclosing any real or apparent financial relationships including receiving royalties, honoraria or fees for consulting, lectures, speakers’ bureaus, continuing education, medical advisory boards or expert testimony; receipt of grants; travel reimbursement; direct employment compensation. These disclosure forms have been filed with the Chronic Obstructive Pulmonary Diseases: Journal of the COPD Foundation Editorial Office and are available for review, upon request, at COPDC@njhealth.org.