

Abstract
In the optic tectum (OT) of the barn owl, visual and auditory maps of space are found in close alignment with each other. Experiments in which such alignment has been disrupted have shown a considerable degree of plasticity in the auditory map. The external nucleus of the inferior colliculus (ICx), an auditory center that projects massively to the tectum, is the main site of plasticity; however, it is unclear by what mechanisms the alignment between the auditory map in the ICx and the visual map in the tectum is established and maintained. In this paper, we propose that such map alignment occurs through a process of value-dependent learning. According to this paradigm, value systems, identifiable with neuromodulatory systems having diffuse projections, respond to innate or acquired salient cues and modulate changes in synaptic efficacy in many brain regions. To test the self-consistency of this proposal, we have developed a computer model of the principal neural structures involved in the process of auditory localization in the barn owl. This is complemented by simulations of aspects of the barn owl phenotype and of the experimental environment. In the model, a value system is activated whenever the owl carries out a foveation toward an auditory stimulus. A term representing the diffuse release of a neuromodulator interacts with local pre- and postsynaptic events to determine synaptic changes in the ICx. Through large-scale simulations, we have replicated a number of experimental observations on the development of spatial alignment between the auditory and visual maps during normal visual experience, after the retinal image is shifted through prismatic goggles, and after the reestablishment of normal visual input. The results suggest that value-dependent learning is sufficient to account for the registration of auditory and visual maps of space in the OT of the barn owl, and they lead to a number of experimental predictions.
- superior colliculus
- optic tectum
- value-dependent learning
- computer model
- barn owl
- auditory localization
- orienting behavior
Neural maps of extra-personal space based on different modalities are kept in register in brains of many vertebrate species (Drager and Hubel, 1975; Knudsen and Konishi, 1978; Harris et al., 1980; Palmer and King, 1982; Wong, 1984; King and Hutchings, 1987;Graziano and Gross, 1993; King and Carlile, 1993; Stein and Meredith, 1993). A well studied example is the alignment between visual and auditory maps of space in the optic tectum (OT) of the barn owl (Knudsen, 1982, 1984a). In the barn owl, the azimuth of a sound source is localized on the basis of interaural time differences (ITDs) (Moiseff and Konishi, 1981, 1983; Takahashi et al., 1984; Konishi et al., 1988; Olsen et al., 1989). An auditory map of space is first found in the external nucleus of the inferior colliculus (ICx) and relayed to the OT, where it is aligned to a visual map of space. As a result, tectal neurons are activated by ITDs generated by sources at spatial locations that correspond to their visual receptive fields (RFs). This alignment is necessary to guide the barn owl’s orienting behavior to auditory stimuli so that the source of those stimuli falls onto the fovea.
It has been shown that the auditory map of space is adjusted dynamically to the visual map of space in an experience-dependent manner (Knudsen, 1983b; Knudsen et al., 1991; Knudsen and Mogdans, 1992; Mogdans and Knudsen, 1992; Brainard, 1994; Knudsen et al., 1994). Realignment occurs during development to accommodate for the changes in ITD values that follow alterations in the morphology of the head and the ears. A dramatic demonstration of the plasticity of map alignment comes from experiments in which barn owls were raised with their visual field chronically shifted by the insertion of prisms on their eyes (Knudsen and Knudsen, 1989b; Knudsen and Brainard, 1991). If the prisms are applied early in life, the owl is able to adapt so that it foveates correctly on the source of auditory stimuli (Knudsen and Knudsen, 1989a, b). As a physiological correlate of this adaptation, neurons in the OT change their auditory sensitivity to respond to ITDs that correspond to the new visual locations (Knudsen and Brainard, 1991). If removal of the prisms occurs within 200 d of age, a barn owl is able to recover accurate sound localization (Knudsen, 1988; Knudsen and Knudsen, 1989a).
The main site of plasticity, as revealed by anatomical and physiological experiments, seems to be the ICx (Brainard and Knudsen, 1993); however, the mechanisms by which the auditory map in the ICx is plastically aligned to the visual map in the OT are not clear (Brainard, 1994; Knudsen, 1994; Knudsen and Brainard, 1995). Several learning strategies have been considered that might explain how the alignment between auditory and visual maps of space in the OT of the barn owl is established and maintained (Knudsen, 1994). One possibility, which would call for synaptic rules based on local correlations between pre- and postsynaptic activity, is that an instructive visual signal either may provide a neural template or represent the direction and magnitude of the audiovisual mismatch. The ICx, however, is considered to be a purely auditory structure, and electrophysiological recordings have failed to reveal any response to mapped visual inputs (Brainard and Knudsen, 1993). It is thus difficult to envision how synaptic modifications in the ICx, if based exclusively on Hebbian synaptic mechanisms, could account for the plastic alignment occurring after shifts in the visual input.
Another possibility is that synaptic changes mediating neural plasticity in the auditory pathway are modulated by the saliency of sensorimotor events such as successful foveation. The present paper explores this hypothesis and proposes that, consistent with what is presently known about the neuroanatomical organization of the auditory pathway, the saliency of sensorimotor events is signaled by the activation of neuromodulatory systems with diffuse projections. The process by which synaptic changes are modulated by the saliency of events signaled by such modulatory systems has been called “value-dependent learning” and has been analyzed in computer models dealing with various aspects of brain function (Edelman, 1989; Tononi et al., 1992; Friston et al., 1994; see also Montague et al., 1996). The neural structures that are assumed to mediate value-dependent learning are the monoaminergic and cholinergic systems (Foote and Morrison, 1987; Aston-Jones et al., 1991; Marrocco et al., 1994;Hasselmo, 1995; Robbins and Everitt, 1995; Mirenowicz and Schultz, 1996). These systems are endowed with specific anatomical and physiological properties, and there is evidence that they play a role in long-term plasticity (Kasamatsu and Pettigrew, 1976; Bear and Singer, 1986; Dykes, 1990; Juliano et al., 1991; Weinberger, 1995). Moreover, it is well known that these systems project to various stages of the auditory pathway (Thompson et al., 1994).
To test the self-consistency of the hypothesis that value-dependent learning can explain adaptive changes in the auditory maps of space in the OT, we have developed a computer model of the neural pathways dedicated to azimuth localization in the barn owl. Through a series of simulations, we show that value-dependent learning can account for the development of alignment of the auditory and visual maps of space, for the adaptive changes in the auditory map that follow a shift in the visual map caused by the insertion of prisms, and for the reacquisition of normal alignment after removal of the prisms. By dealing specifically with map alignment in the owl, the present simulations allow a detailed comparison with the experimental literature and lead to specific predictions. More generally, the results of these simulations suggest that value-dependent learning can be a flexible and parsimonious mechanism for developing and maintaining spatial registration among neural maps in the brain.
MATERIALS AND METHODS
As shown in Figure 1, the simulations consist of two computer processes that implement a model of the nervous system and the phenotype in the experimental environment, respectively. These processes interact continuously with each other by exchanging sensory data and motor commands to close the loop between sensory perception and motor action. With this scheme, it is possible to replicate most of the experiments described in the literature and to analyze the system in terms of both physiological data and behavioral performance. Typical values and ranges of the system parameters used in the simulations are shown in the . All of the software for the simulations was written in the C language, and the tests were executed on high-memory, fast Unix workstations.

Overall scheme for simulation of the phenotype and the nervous system. Two separate computer processes implement the environment and phenotype and the nervous system. Sensory signals are sent from the process that simulates the phenotype to the process implementing the nervous system, whereas motor control signals go in the opposite direction (see Materials and Methods).
The environment. In most experiments described in the literature, the barn owl sits on a perch while visual and auditory stimuli are presented at a fixed distance in different locations. Figure 1 shows the experimental environment. The simulated barn owl is positioned at the center of a fixed, world-centered reference systemx, y with the origin centered on the perch, and audiovisual stimuli are applied at a constant distance but at a variable azimuth angle αs ∈ (−π/2, π/2). Visual stimuli are luminous points that are projected on the retina, and auditory stimuli are represented by a sound with a constant power spectrum (white noise) in the frequency range of the simulations. The position of the head of the barn owl is determined by the angle φh (Fig. 1), so that the position of the stimulus with respect to a head-centered reference frame x′, y′ is given by:
 Equation 1which defines the saccade to be performed to foveate properly on the stimulus. Head movements are allowed in the range (φh ∈ (−π/2, π/2)). During training, single stimuli are applied sequentially in random positions of the environment, and they are removed after the execution of the first saccade. Because only the azimuth of the sound source is considered, both the environment and neural maps of space are unidimensional.
The phenotype. Because the barn owl cannot move its eyes independently of its head, for the purpose of the present study the owl has been modeled as a single unidimensional eye fixed between two lateral ears spaced by a distance hs. The eye is composed of NR receptors uniformly distributed on a planar surface, which sense a visual fieldvf. The fovea is represented by receptors in an area of radius rF, which has a special set of projections (see below). If the position of the stimulus with respect to the head is such that it falls in the visual field, the activationRn of each receptor of the retinarn is evaluated as a Gaussian function of the distance from the point of projection n̂ of the stimulus on the retina:

 Equation 2where fd is the eye focal distance and ςR is a constant regulating the spreading of activation among adjacent receptors of the retina. If the stimulus falls outside the visual field (∥φs∥ >vf/2), retinal receptors do not receive any activation. Only the projection along the optic axis is considered. When a shift φ̃ of the visual data is introduced, as in simulating the application of deviating prisms, the projection of the stimulus on the retina n̂ is shifted correspondingly, so that:
 Equation 3To model the auditory signal, the conduction of the sound in the air and through the ears is calculated by directly estimating the interaural time difference corresponding to the position of the stimulus, according to the model proposed by Woodworth and Schlosberg (1962) (see also Kuhn, 1977):
 Equation 4where hs is the distance between the two ears and co is the ambient speed of sound in the medium. The factor k takes into account the propagation of sound in the ear by scaling Woodworth’s model to match the values of the ITDs measured with microphones implanted into the owl’s ears (Moiseff and Konishi, 1981). Finally, the position φh assumed by the head is evaluated as a function of the activation of the motoneuronsM1, M2, so that:
 Equation 5where φm is the maximum saccade amplitude allowed. Because M1 andM2 vary in (0, 1), any direction in the range (−φm, φm) is possible.
The dependence of the ITD on frequency was not included in this model, given the scarcity of data available in the literature (Abbagnaro et al., 1975; Kuhn, 1977; Olsen et al., 1989).
The nervous system. The overall architecture of the neural model is illustrated in Figure 2. In the owl, the pathway for auditory azimuth localization starts with the magnocellular cochlear nuclei and reaches the tectum, where it meets the visual pathway composed of direct retinotectal projections. In the tectum, the sensory representation of space is aligned with a motor map that controls the activation of motoneurons.

Neural stages included in the simulations: the auditory and visual pathways converge at the level of the tectum and project to the motor system. A diffuse projection system (value system), which is activated for salient events and modulates synaptic plasticity, is included (for details, see Materials and Methods).
The modeled areas are indicated by italic characters using the same names that refer to the corresponding biological structures. In the model, neural units are indicated with the lower-case Roman lettersuk, where the subscript k indicates the position of the unit in the map to which it belongs. The activation of a simulated neuron uk is indicated as a function of time by upper-case Uk(t). Connections are indicated by Greek lower-case letters αik, where the subscripts identify the originating unit ui and the target unituk.
In the barn owl, cells in the first monaural stages in the pathway for auditory azimuth localization, the magnocellular cochlear nuclei, are sensitive to specific frequency bands and fire in correspondence with a well defined value of phase of the incoming signal (Sullivan and Konishi, 1984; Konishi, 1993). The nucleus laminaris receives afferents from both the right and left magnocellelar nuclei and is the first station in the ITD pathway where the signals from the two ears converge (Carr and Konishi, 1990;Konishi, 1993). Cells in this nucleus are frequency-selective and respond to both monaural and binaural stimuli, although they respond maximally to binaural stimuli with specific values of ITD (Jeffres, 1948; Konishi et al., 1988; Carr and Konishi, 1988, 1990; Carr and Boudreau, 1993; Konishi, 1993). Because the main focus of this work is the study of the emergence and plasticity of multimodal spatial representations at the level of the tectum, we simply simulated the output of the first stages of the auditory pathway. In practice, for a given stimulus position φs, the corresponding ITD, evaluated as in Equation 4, is used to drive the units of the simulated central nucleus of the inferior colliculus.
ICc. The nucleus laminaris projects unilaterally to thecentral nucleus of the inferior colliculus (ICc) (Knudsen, 1984b). Neurons of this area have narrow sensitivity to both frequency and interaural phase. They are arranged tonotopically in adjacent frequency laminae along one direction and according to ITD sensitivities along the other. ITD and frequency axes in the ICc are essentially perpendicular to each other (Wagner et al., 1987). ICc neurons show a characteristic periodicity in their response to different ITDs. For broad spectrum stimuli, the period of the ITD response function is similar to that of the neuron’s best frequency, in line with the ambiguity in evaluating the phase difference between two sinusoidal signals by a factor proportional to a multiple of the period of either monaural signal. Given the layout of unit sensitivities in the ICc, each array of neurons perpendicular to the frequency axis (which we will refer to as a “characteristic array”) has an array-specific ITD T̄, representing the value of ITD that activates all the neurons of the array at the same relative response level.
In our model, the responses of ICc units have been designed to fit the physiological data available in the literature as closely as possible. Figure 3(a) shows the firing rates of seven ICc neurons recorded with electrode penetrations when sounds with different values of ITD are applied at the ears of the barn owl. The activation of these neurons is periodic with respect to ITD and can be predicted in terms of the mean interaural phase φ̄ and frequency f̄ characteristic of the neuron. In the simulation, the activation of an ICc unit u that belongs to the frequency lamina f̄ and to the characteristic array T̄, is evaluated as a function of the input ITD value dT as:
 Equation 6
 where ℱ(x) is a piece-wise linear approximation of a sigmoidal function (with an offset of 0, slope of 1, and saturation at x = 1) whose unique role is to limit the activation of the units in a range between 0 and 1, nu is a noise term, and δUU(t − 1) is a term representing a trace of the unit previous activity. The variablet does not indicate absolute time, but it refers to the iteration of the simulation. The sensitivity of a unit u to different values of ITD and frequency of the input sound, evaluated as in Equation 6, is shown in Fig. 3(c). Unit activation is characterized by a narrow frequency range and shows a periodicity with respect to ITD. Fig. 3(b) illustrates the firing rates for different values of ITD, for units in the model with characteristics similar to those of Fig. 3(a). Notice the correspondence of the responses of units in the simulations with the actual activation of biological neurons.

Activation of ICc neurons and the corresponding units in the model. (a), Recordings of an electrode penetration in the ICc of the barn owl (from Konishi et al., 1988, reprinted with permission). The firing rates of seven neurons are shown: the numbers at the left indicate the mean interaural phase φ̄ and the frequency f̄characteristics of each unit, as well as the position of the electrode in the penetration. (b), The activation of units in the model characterized by the same parameters as the cells in (a). (c), Receptive field of a ICcunit with respect to the frequency and ITD of the sound. The unit’s parameters are φ̄ = 0.46 and f̄ = 5767. (d), Maps of activation of the ICc for different ITD. The maps simulate 500 frequency laminae in the range 3–9 kHz, each composed of 500 units. The range of ITD sensitivity of the map is (−150 μsec, 150 μsec). Pattern of activation fordt = −100 μsec (top), dt= 0 μsec (middle), and dt = 100 μsec (bottom).
After the anatomical organization of the ICc, as revealed by electrophysiological recordings, ICc units are arranged in the model so that their sensitivities to frequency and ITD are aligned along perpendicular directions. As a result, the modeled ICccan be seen as a bidimensional array composed ofNUf × NUφ units, where each unit uij is identified by the two characteristic parameters T̄ =T̄ij, f̄ =f̄ij in Equation 6:
 Equation 7
 where dTR is the maximum value of ITD at which the map is sensitive, and (fa, fb) is the frequency range. Typical maps of activation in the ICc are shown in Fig. 3 (d). As illustrated by the figure, the pattern of activation is organized in a central vertical array centered on the column having that particular array-specific ITD, and the phase ambiguity produces periodic peaks of activation that change with the frequency. Note that the characteristic array with maximum activation shifts together with the input value of ITD.
ICx. The external nucleus of the inferior colliculus (ICx) is the first site in the ascending pathway to the tectum where information is integrated across frequency channels to create an auditory representation of space. ICx neurons have restricted auditory receptive fields: they respond maximally to stimuli located at a specific position of space, and their layout gives rise to a systematic map of the auditory space (Knudsen et al., 1977; Knudsen and Konishi, 1978). These neurons do not show phase ambiguity if stimulated with noise (Takahashi and Konishi, 1986). Retrograde tracing studies (Knudsen, 1983b, 1984b) have shown that space-specific ICx neurons receive afferents from many isofrequency laminae in the ICc. More specifically, ICx neurons tend to receive inputs from the characteristic arrays that are selective for the same ITD (Wagner et al., 1987). It has been shown that in the ICx the lateral inhibition exerted by GABAergic cells has a crucial role in shaping the receptive fields of ICx units (Fujita and Konishi, 1991; Park and Pollak, 1993;Adolph, 1993), as happens in other parts of the brain (Dykes et al., 1984; Alloway et al., 1989; Jones, 1993).
As illustrated in Figure 4, the ICx in the model contains two types of units: NA excitatory neurons ak, and NBinhibitory interneurons bk. Excitatory neurons receive inputs from the ICc and project to theOT. As shown in the figure, units in the ICx also receive afferents from adjacent excitatory units and from inhibitory units with local projections in more distant regions of the map. Connections in the ICx can be classified as excitatory ηkle from ak toal and ηkli fromak to bl, or inhibitory ξkl from bk toal. These two sets together give rise to competition in which the units with higher values of activation inhibit the others. The activation of the ICx units is evaluated as:
 Equation 8
 where αk is a parameter controlling the sensitivity to the input, δA and δB are decay factors, andna and nb are noise contributions. In the simulations, the decay factors of ICxand ICc units were chosen sufficiently large so that the activated units possessed some residual activation after the execution of the saccade, at which time foveation may occur.

Connections between the ICc and theICx and among the units of the ICx. The terminal segment indicates an inhibitory connection, the arrow an excitatory one. Excitatory units ak in theICx receive excitatory afferents from units in theICc and from adjacent units in the ICx. They also receive inhibitory afferents from inhibitory units in theICx located in other regions of the map. They project to neighboring inhibitory units bl as well as to the OT (not shown in the figure).
OT. In the barn owl, the space map of the ICx is projected topographically to the OT, where it is combined with spatially organized inputs from other sensory modalities. Tectal cells have well defined spatial receptive fields and are excited by stimuli located in their receptive field and inhibited by stimuli outside of it. The location of the receptive field shifts systematically with the position of a cell in the tectum, giving rise to multimodal maps of space. In the barn owl, the majority of the cells in the OT respond to both auditory and visual stimuli (Knudsen, 1984b). Depending on the neuron and on the conditions under which the stimuli are combined, responses to bimodal stimuli may be enhanced or reduced relative to the sum of the responses elicited by the unimodal inputs presented alone (Stein and Meredith, 1993). Sharp tuning to a particular azimuth and elevation of a sound source is the result of the sensitivity of the unit to specific values of ITD and interaural level difference (ILD). Auditory RFs are systematically organized, creating a map of auditory space. This map is well aligned with the map of visual space in the tectum (Knudsen and Brainard, 1995).
The OT was modeled with an array of NO bimodal units ok, which are activated by both visual and auditory stimuli. OT neurons receive visual input directly from the retina by means of the connections νki so that the activation of unitok at time t is given by:
 Equation 9Retinal afferents (νki) are topographically organized, so that adjacent receptorsri of the retina are connected with adjacent areas of the OT. In this way, the map of retinotopic activation is transmitted to the OT. TheOT also receives topographically organized connections γkp from ICx unitsap.
Although the visual receptive field of a unit okin the tectum is automatically determined by the fixed connections of the visual pathway, the auditory RFs can change location depending on plastic changes in the connections from the ICcto the ICx (Brainard and Knudsen, 1993). The orienting behavior in young barn owls, however, indicates that developmental events are sufficient to establish a neural connectivity that supports a rudimentary auditory localization (Knudsen, 1984b). To reflect these developmental constraints, the model assumes that a coarse topographical organization exists in the initial connectivity. Each unit in the ICx thus tends to receive projections from units in all ICc frequency laminae, but within a delimited range of ITD. The center of the projection cone in the ICc shifts proportionally to the location of its target unit in theICx. A spatial exponential decay is used, so that the probability of connection between ICc unituij and ak in theICx depends on the distance between unituij and the center of the projection cone to unit ak, and the scatter of the projections ςd. The strength ωijkof the synapse between units uij andak is initially set to a random value, and it changes with sensorimotor experience.
Motor output. To determine the direction of gaze for a given pattern of activation in the OT, a simplified motor system was simulated. The OT units project respectively to two motor neurons m1, m2, through the connections μ1k, μ2k. These connections have fixed strengths, determined as:
 Equation 10
 In this way, when the focus of activation is on the left side of the OT, m2 is unaffected; the activation of m1 increases the more the peak of activation moves toward the extreme right of the OT. The situation is mirror-symmetric for the right half of thetectum and m2. In this way, each unitok in the OT acquires a motor receptive field determined by μik.
The activation of the motoneurons is evaluated as a linear weighted average of the activation in the OT, that is, fori = 1, 2:
 Equation 11Finally, through Equation 5, a linear relationship is established between the position assumed by the system and the map of activation in the OT.
Plasticity. A striking aspect of orienting behavior in barn owls is its wide range of adaptability. Even though the basic features for auditory localization (ITD and ILD) are shared by all barn owls, the actual values of these parameters depend on the morphology of the body, in particular the size of the head or the shape of the facial ruff of feathers. In the first months of life, these animals undergo large physical changes as these structures change in size and shape. Consequently, the auditory parameters also change significantly, and the nervous system must adapt to such modifications.
Several observations and experiments have begun to shed light on the mechanisms underlying such capabilities and have highlighted the importance of visual signals. It has been shown that prolonged exposure in early life to a translated visual field causes the animal to calibrate a motor action, so that instead of aiming directly toward the sound source, it will gaze laterally by an extent equal to the shift introduced (Knudsen and Knudsen, 1989b; Knudsen and Brainard, 1991). The changes in the orienting behavior of the animal have a physiological correlate in the change in the sensitivities of the units in the OT: the auditory RFs of OT units shift by an amount that accurately matches the visual displacement.
The origin of the visually induced shift of the auditory RFs has been carefully investigated (Brainard and Knudsen, 1993). It has been observed that in the ICx of prism-reared owls, the representation of ITD also was shifted from normal by an amount and in a direction that could completely account for the shift measured in the OT. Consideration of the latency of the response of ICx neurons suggests that this shift is intrinsic to the ascending afferents and is not the result of backward connections from the tectum. In addition, the representation of ITD has been found to be normal in the ICc. These results indicate that an alteration of the visual modality triggers the reorganization of auditory spatial tuning of OT neurons by means of plasticity at the level of the ICx, which is the site where the auditory map of space is first synthesized.
In our model, the strengths of connections in the projections from theICc to the ICx are allowed to change on the basis of experience. We assumed that synaptic modifications at the site of plasticity are mediated by the activation of a simulated value system triggered by the occurrence of salient events. The value system functionally replicates the proposed role of neuromodulatory subcortical centers such as monoaminergic and cholinergic nuclei. Because of the complexity of these systems and their interactions, the present model did not attempt to replicate in detail any of their individual properties but simply represents their overall effect of modulating synaptic plasticity. For simplification, we implemented a single value unit v, which receives afferents from both the fovea Fv and the motoneurons. In this way, unit vtends to fire when a stimulus is in the center of the visual field or when a movement is executed. The activation of this unit is evaluated as:
 Equation 12where ρk = ρ are the strength of the connections with the afferents from the fovea, and χk = χ those from the motor units. Because of the long time constant of units in the motor system, the value system receives input throughout the duration of the saccade until the beginning of the foveation response. The time constant δV of the value unit is instead considerably smaller, such that its firing rate increases nonlinearly only if the response to motor events and foveation overlap in time.
The value system modulates synaptic strengths at the site of plasticity between the ICc and the ICx by means of the diffuse projections λk to the ICx. At each time step of the simulations, the strength of a connection ωijk between the unitsuij and ak is modified according to:
 Equation 13where ΦL(x) is a function characterized by two thresholds θLTD and θLTP (Artola and Singer, 1993), as shown in Figure 5. When Ep is lower than the first threshold θLTD, the function has a value of zero; between the two thresholds it has a negative value, inducing depression of synaptic strengths; and above θLTP it assumes positive values, thereby potentiating the connections. For simplicity, a linear approximation of this function with parameters k1,k2, k3 was used. The argument Ep is evaluated as the contribution of the following factors: the activation of the pre- and postsynaptic elements uij and ak, respectively, and the activation of the value system v:
 Equation 14where ℋ can be either the classical Hebbian term given by the product of pre- and postsynaptic activation or the sum of these two components. The two terms in Equation 14 have different functional implications: the first one reflects a local factor that may be different for different synapses; the second term is aglobal factor shared by all the plastic synapses. The relative contribution of these two terms is set by the values of the parameters ε1 and ε2.

The rule adopted for the modification of synaptic strengths in the simulations is a piecewise linear approximation of the curve proposed by Artola and Singer (1993). Two thresholds delimit the areas of depression and potentiation.
Given the form of ΦL(x), it follows that the connections between correlated units in the ICc and the ICx can undergo potentiation, depression, or no modification at all, depending on the activation of the value system. Typically, the values of the thresholds are selected so that potentiation occurs only for units whose activations are correlated when the activation of the value system is high. This happens after a successful saccade, which brings the stimulus onto the fovea. By contrast, when the value system is not strongly activated, such as when the simulated barn owl moves but does not localize the target, highly correlated units usually tend to be depressed.
RESULTS
Performance of the system before sensorimotor experience
In this section, we analyze in detail the performance of an untrained system composed of 100 × 320 units in theICc and 100 units in both the ICx andOT. A spread of projections from the ICc to theICx of ςd = 20 was used. Figure6, (a) and (b), shows the pattern of synaptic strengths for two units in the ICx. These maps were created by plotting at location i, j of the matrix the synaptic strength ωijk between unituij in the ICc and unitak in the ICx. The different colors are proportional to the actual strength of the synapses.

System performance and RF alignment before sensorimotor experience. (a), (b), Patterns of synaptic strengths of the connections among the ICx units a35, a65 and ICc units. Before sensory experience, the strength of the connections was random, with a spatially decaying probability of synaptic contact. (c), Absolute value of the foveation error for saccades toward auditory stimuli at different azimuth positions in space. The foveation error is defined as the difference between the direction of gaze assumed by the barn owl and the apparent position of the stimulus φh − (αs + φ̃) (see Materials and Methods). When no shift is applied to the visual input, the foveation error is equal to the orientation error, defined as the difference between the direction of gaze assumed by the barn owl and the real position of the stimulus (φh − αs). The data are statistical evaluations of 10 repetitions for each spatial location. (d), Alignment of visual and auditory receptive fields forOT units.
Barn owls are able to orient toward auditory stimuli early in life. In the model, some degree of orientation toward auditory stimuli occurred independently of sensorimotor experience purely because of a bias in the initial pattern of projections from the ICc to theICx, so that each unit in the ICx received afferents from units in a corresponding area of the ICc, with a probability that decreased with the distance of ICcunits from this area. Figure 6(c) shows the foveation error, which is the difference between the direction of gaze assumed by the barn owl and the apparent position of the stimulus, for saccades toward 30 equally spaced auditory stimuli in the azimuth range ±60°. The values plotted in the figure are the mean of the absolute value of the error and its SD obtained on 10 repetitions for each stimulus location. The mean of the magnitude of the foveation error for all of the locations was 16.99 ± 14.72°. These values were relatively large, mainly because of the effect of noise that degraded the model’s performance; however, the errors were unbiased (mean value − 0.32 ± 22.49°), so that on average the system oriented toward the correct location in space.
The relative alignment of the auditory and visual receptive fields for the bimodal units of the OT is illustrated in Figure6(d). For each unit, a dot is plotted in the graph at a position defined by the center of its visual RF along the xaxis and by the center of the auditory RF along the y axis. The format of this graph follows the standard way of plotting the results of physiological recordings of the cells in the OT. The center of both visual and auditory RFs is defined by the stimulus position that gives rise to the maximum value of activation of the unit. When the visual and auditory RFs are perfectly in register, the points lie on the dashed line at 45°, and the distance from this line is a measure of the misalignment between auditory and visual RFs. As shown in Figure 6(d), without sensorimotor experience the RFs in the two modalities were not in strict register, and the mean absolute value of the distance between visual and auditory RFs was 12.45 ± 9.82°; however, the layout of projections from the ICcprovided a coarse topographical organization, which allowed the system to operate with some accuracy even without having been exposed to any auditory or visual experience.
Development with normal sensorimotor experience
Sensory experience shaped the patterns of connections in the model by strengthening the synapses between ICx units and the characteristic array at the center of their projection cone. Typical system performance and RF alignment are shown in Figure7 for a simulation with 320 × 50 units in theICc, 100 units in all of the other maps, and ςd = 20, after the presentation of 15,000 audiovisual stimuli. The fovea consisted of five receptors corresponding to a spatial extension of 5°. Because of the learning rule adopted, only those synapses that were active during successful auditory saccades (those that brought the stimulus on the fovea) were strengthened; all others (weak pre- and/or postsynaptic activation or unsuccessful saccades) underwent depression. As a result, eachICx unit connected strongly with all the ICcunits that were sensitive to the particular ITD corresponding to the same location in space, independent of the frequency [Fig. 7, (a) and (b)]. The resulting patterns of connections have a strong resemblance to connectivity patterns observed with anatomical tracers, such as horseradish peroxidase injections at the corresponding sites in the barn owl (Knudsen, 1983b, 1984b).

System performance and RF alignment after the execution of 15,000 saccades toward audiovisual stimuli. (a), (b), Patterns of synaptic strengths of the connections among the ICx units a35, a65 and ICc units. (c), Mean values of the magnitude of the foveation error for saccades toward auditory stimuli at different azimuth positions in space. (d), Relative alignment of the visual and auditory receptive fields ofOT units. (e), Improvement in the orientation behavior with exposure to sensorimotor experience: the plotted data are the mean values of the magnitude of the foveation error for all the spatial locations. (f), Improvement in the alignment of the auditory and visual RFs of OT units with learning.
Figure 7(d) shows the alignment between auditory and visual RF of OT units. As compared with the situation before learning [compare Fig. 6(d)], the registration among the RFs was much more precise, as illustrated by the clustering of the data around the diagonal at 45° (mean value 0.4 ± 0.34°). This result had a behavioral counterpart in the reduced mean and SD of the magnitude of the foveation error during the execution of saccades toward auditory stimuli in different locations of space, as illustrated in Figure 7(c). The mean absolute value of the error was 2.60 ± 2.28° [compare Fig. 6(c)]. Because the foveation error was not biased, from the point of view of behavior, learning operated mainly in reducing the SD so that after the presentation of 15,000 audiovisual stimuli the mean foveation error had decreased from 0.05 ± 22.98° to 0.73 ± 3.38°. This effect was attributable to the decreased sensitivities ofICx units to noise and resulted from their increased specificities for values of ITD.
Figure 7, (e) and (f), shows how performance and RF alignment changed with learning. Figure7(e) plots the mean of the magnitude of the foveation error and its SD at different stages of learning, and Figure7(f) shows the mean misalignment between auditory and visual RFs for OT units at the same stages of experience. In both cases, the mean values and the SD decreased considerably with experience.
Development with altered visual experience
The plasticity in the alignment of visual and auditory maps is demonstrated clearly in experiments in which a constant shift is applied to the visual input, for example by inserting a pair of deviating prismatic goggles on the eyes of the barn owl (Knudsen, 1983a). If the animal is young, it is usually capable of adapting to the misplaced visual field, and it adjusts the amplitude of saccades toward auditory stimuli. After some time, the barn owl will aim at the left or the right of the stimulus by an amount equal to the shift introduced by the goggles.
In the model, the shift was introduced as in Equation 3 directly on activation of the receptors of the retina. In the series of experiments described here, the visual displacement was present from the very first phases of sensorimotor experience. This replicated the insertion of the prisms on the eyes of the barn owl immediately after its eyes were opened.
Figure 8 illustrates the results of a simulation of a system composed of 320 × 50 units in the ICc and 100 units in all of the other maps, after exposure to 15,000 stimuli, which were visually displaced by 20°. A projection scatter ςd equal to 20 for the connections between theICc and the ICx was used in this example. In Figure 8, (a) and (b), the patterns of synaptic strengths are shown for two units in the ICx, before and after exposure to sensorimotor experience. In this case, the connections with the units in the left side of the projection cone were strengthened, instead of those in the central area as in Figure 7, (a) and (b). This displaced selection of connections compensated for the introduction of the deviating goggles.

System performance and RF alignment after execution of 15,000 saccades toward audiovisual stimuli with the visual field translated by 20°. (a), (b), Patterns of synaptic strengths of the connections among the ICx units a35, a65 and ICc units. (c), Mean values of the magnitude of the foveation error for saccades toward auditory stimuli at different azimuth positions in space. (d), Relative alignment of visual and auditory receptive fields for OT units. (e), Improvement in the orientation behavior with the exposure to sensorimotor experience: the plotted data are the mean values of the magnitude of the foveation error for all the spatial locations. (f), Improvement in the alignment of the auditory and visual RFs of OT units with learning.
As illustrated in Figure 8(c), after the presentation of 15,000 stimuli the system performed well for stimuli located in different positions of the surrounding space. The mean foveation error for saccades toward auditory stimuli was 2.24 ± 1.87°, and the mean orientation error was 19.13 ± 2.79°; that is, the system aimed to the side of the stimulus by an amount equal to the visual displacement. Figure 8(d) shows the alignment of visual and auditory RF in the OT : analogous to the case of normal visual experience [Fig. 7(d)], units in this area had visual and auditory RFs in strict spatial register, as emphasized by the narrow dispersion with respect to the diagonal of the graph (0.31 ± 0.19°). This result indicates that a good alignment develops between the RFs in the two modalities for OT units despite the introduction of a visual displacement.
Figure 8, (e) and (f), shows the behavioral and physiological changes occurring in the system with sensorimotor experience. The mean magnitude of the foveation error for all of the spatial locations is plotted in Figure 8(e) at several stages of learning. Figure 8(f) illustrates improvement of the alignment of the maps in theOT, measured as the mean absolute value of the distance between the auditory and visual RFs of OT units. A reasonable spatial register was present before 5000 iterations.
Recovery from altered visual experience
If the prismatic goggles are removed when the barn owl is still young (typically before 200 d of age), the animal is usually able to recover and execute saccades toward auditory stimuli with considerable accuracy. To replicate these experiments and test the capability of the model to recover from the previous exposure to a distorted visual world, we simulated the removal of the visual displacement in a well adapted system.
Figure 9 shows the results of this experimental procedure after exposure to a normal visual environment for a period of time corresponding to 20,000 stimuli. The patterns of connections of two units in the ICx are shown before [Fig. 9(a), (b)] and after [Fig. 9 (c), (d)] the new sensorimotor experience. The areas of theICc that established strong connections with the two units shifted to the right, toward the center of the projection cone. This altered pattern of connectivity gave rise to a corresponding shift of the auditory RF of the units in the ICx.

Recovery of performance after the removal of a visual shift equal to 20°. (a), (b), Patterns of synaptic connections of the ICx units a35 and a65 right after the removal of the deviating prisms. (c), (d), Patterns of synaptic connections of the same units after the presentation of 20,000 stimuli without visual shift. (e), Absolute value of the foveation error: the open circles show the foveation errors for saccades toward auditory stimuli measured immediately after the removal of the visual shift. The filled circles show the errors for saccades toward auditory stimuli in the same spatial locations, after that learning has occurred. (f), Alignment between auditory and visual receptive fields for OT units after the presentation of 20,000 stimuli without deviating goggles. Both the new correspondences (filled circles) and ones measured right after the removal of the prisms (open circles) are shown.
Figure 9(e) shows the change in the orientation behavior with experience (filled circles) with respect to the situation immediately after the removal of the goggles (open circles). At the beginning, when the model experienced a normal visual field for the first time, a systematic error was present in the saccades toward auditory stimuli (mean foveation error 18.8 ± 2.74°). With sensorimotor experience, this error was corrected so that a mean value equal to 2.24 ± 1.78° was reached. As before, these data are mean values after 10 repetitions of stimuli in 30 equally spaced locations of the azimuthal plane.
The recovery of good orientation accuracy was a consequence of the reacquired alignment of the visual and auditory RFs for the cells in the OT, as illustrated in Figure9(f). In Figure9(f), the alignment of the new visual and auditory RFs is compared with the situation measured immediately after the removal of the goggles. Immediately after removal of the visual shift, a gap equal to the displacement of the shift was introduced among visual and auditory RFs, because the visual location was translated, whereas the auditory location was unaffected by the glasses (mean misalignment 19.98 ± 0.42°). This is illustrated by the position of the open circles in the figure below the central diagonal of the graph. After the execution of 20,000 saccades, visual and auditory RFs were in good alignment, as shown by the arrangement of the filled dots on the main diagonal (mean misalignment 0.37 ± 0.27°).
The temporal dynamics of the changes in patterns of connectivity can be observed in Figure 10. After removal of the visual shift, the patterns of synaptic strengths for a unit in theICx are illustrated at different stages of experience. The unit developed strong connections with a new area of theICc, corresponding to the new ITD, while simultaneously losing the sensitivity to the old ITD value. The presence of a double peak in the distribution of connections strengths (Fig. 10) gave rise to a corresponding double-peaked unit response with respect to ITD values. It is worth emphasizing that this ITD tuning function resembles closely what has been observed experimentally by electrophysiological recordings in the OT of prism-reared barn owls during the critical period (Brainard and Knudsen, 1995, their Fig. 6).

Changes in the pattern of synaptic strengths for a unit in the ICx when a shift equal to 20° is introduced in the visual input. The same connections are shown at different levels of experience.
Plasticity in the visuomotor registration
In the simulations presented in the previous sections, plastic changes occurred exclusively in the ICx, and the visual and motor maps were assumed to be in perfect alignment since the beginning. Some evidence, however, indicates that in the barn owl the registration between the sensory and motor representations is also refined through experience-dependent plastic changes (du Lac and Knudsen, 1991). In particular, plastic changes in the sensorimotor registration may occur when the owl has to adapt to abnormal sensory conditions that require a differential change in the magnitude of saccades for certain zones of the visual field.
In the OT of prism-reared barn owls, because of the physical characteristics of the goggles, a region of only limited spatial extent receives shifted visual input (displaced zone). This displaced zone is surrounded by areas in which neurons are visually deprived (deprived zones) because of the existence of spectacle frames, feathers, or optical properties of the prisms. More marginal areas receive normal visual experience (normal zones). Although cells in the displaced zone shift their auditory RFs to reestablish a spatial register with the visual map, auditory RFs of visually deprived cells translate by smaller amounts than those of cells in the displaced zone, and auditory RFs of cells in the normal zone are similar to those observed during normal development (Knudsen and Brainard, 1991; Brainard and Knudsen, 1993). In this section, we show that by allowing for plastic changes in the sensorimotor registration, the model fully accounts for the behavior of cells that are exposed to different visual conditions during development.
The subdivision between a displaced zone (20° to the left), a deprived zone, and a normal zone in the visual input of a prism-reared barn owl was replicated for the present simulations as illustrated in Figure 11(a). Visuomotor plasticity was simulated by introducing a motor map ℳ between the sensory map in theOT and the motor units. Units ok in the OT project to units mk in ℳ with a probability that decays exponentially with the distance from the projection center, in the same way as for the connections between theICc and the ICx. Synaptic plasticity in both theICx and ℳ was modulated by the activation of the value system, following the scheme described in Materials and Methods. The system was presented with both audiovisual and purely visual stimuli. The probability of occurrence changed with time: the visual stimuli predominating at early phases and the audiovisual ones at later stages of training.

System performance and RF alignment after the execution of 8000 saccades toward audiovisual stimuli. In this simulation, the goggles had a limited spatial extent, so that peripheral visual stimuli could be perceived outside the goggles. A visually obstructed zone where stimuli were not allowed to project on the retina replicated an area with similar optical properties in the owl. (a), As a result of the existence of areas with different optical properties on the surface of the eye, the visual conditions were drastically different for different regions of space. (b), System performance for saccades toward auditory stimuli located in different spatial positions. (c), Frequency distributions of auditory–visual misalignments grouped according to visual conditions: (top) normal zone, (middle) deprived zone, (bottom) displaced zone. (d), Frequency distributions of motor–visual misalignments grouped according to visual conditions: (top) normal zone, (middle) deprived zone, (bottom) displaced zone. The data refer to a simulation of system composed of 320 × 50 units in the ICc and 150 units in all the other maps. The spread of projections was 20, both in the ICx and in ℳ. (a) and (c) should be compared with the figures in Knudsen and Brainard (1991).
As illustrated in Figure 11(b), the system foveated correctly on stimuli located in different spatial positions. The mean absolute error of the foveation error was 3.61 ± 2.93. The alignment between auditory and visual, after the removal of the prisms, for cells in the OT is shown in Figure 11(c). As observed experimentally in barn owls, misalignments varied greatly yet systematically across the OT. In the visual representation of frontal space, auditory–visual misalignments were distributed around the displacement introduced by the prisms [Fig.11(c), bottom]. Cells that were visually deprived [Fig. 11(c), Middle] also exhibited a significant systematic shift between their auditory and visual RF, although the mean displacement was smaller than for the units in the displaced zone. No significant shift was observed for the units exposed to the normal visual conditions of the visual field periphery [top graph in Fig. 11(c)].
Figure 11(d) illustrates the alignment between the visual RF and motor field for units in the OT classified according to the zone in which their visual RF was located. The unit motor field was defined as the mean spatial location assumed by the system when the unit was activated, as in microstimulation experiments (du Lac and Knudsen, 1990). Visual RFs and motor fields were in alignment in the displaced zone [Fig. 11(d), bottom], were systematically shifted in the normal zone (Fig. 11(d),top), and were intermediate in the deprived zone (Fig.11(d), middle). Successful foveation on auditory stimuli located in each region of space was thus achieved via the sequential cascade of audiovisual and sensorimotor registrations occurring at the level of the ICx and ℳ, respectively.
The reason for the differential changes in motor field alignment for units in zones with different visual conditions becomes clear if saccades toward visual stimuli are considered. Stimuli in the displaced zone trigger saccades whose magnitude is independent of the optic displacement introduced by the prisms, because both the starting point and the target are translated by the same amount. As a consequence, in the displaced zone there is no need for the acquisition of a visuomotor registration different from the case of normal development. By contrast, stimuli in the normal zone require the execution of saccades of different magnitude when the prismatic goggles are present, because in this case the stimulus for foveation is not translated before the saccade but only after. This requires a new alignment between the visual and motor maps to be developed.
Dependence on parameters affecting anatomical organization and the learning rule
Simulations using several different values of anatomical and physiological parameters, and different versions of the rule for synaptic modifications, were performed to reveal the main factors affecting the development and final alignment of the spatial maps in the OT. Overall, the results of these simulations illustrate that the performance of the model is stable under a broad range of parameters values and for different initial conditions.
As regards the anatomical structure, the most significant parameters are the number of units in the various maps and the scatter of the plastic projections ςd between theICc and the ICx. As expected, the performance of the system improved when the number of units in the simulations was increased. Figure 12, (a) and (b), shows that the mean foveation error decreased by increasing the number of ICc frequency laminae and the number of ICx units. The data refer to extensively trained systems, which were exposed to normal visual experience.

(Top row) System performance for different numbers of units in the ICx and in theICc. (a), Change in the mean accuracy when the number of ICx units was varied, and (b) when a different number of ICc frequency laminae was used. (Middle rows) System performance with different values of scatter in projections ςd between the ICc and the ICx before [(c) and (d)] and after [(e) and (f)] exposure to sensorimotor experience: (c) and (e) mean value of the magnitude of the foveation error. (d), (f), Misalignment between auditory and visual RFs for the units in the OT. (Bottom row) System performance for different levels of noise in the learning process. Uniform noise with variable amplitude was linearly superimposed on Equation 14. In all cases, the system was composed of 300 × 50 ICc units and 50 units in all of the other maps (ςd = 20). The plotted data were gathered after the presentation of 10,000 audiovisual stimuli. (g), Mean values of the magnitude of foveation and (h) mean misalignment between the positions of auditory and visual RFs for the units in the OT for different levels of noise.
The dependence of system performance on ςd is illustrated in Figure 12(c)–(f). Systems with different values of ςd were trained with normal visual experience until good orienting behavior occurred. The data show that once the system had reached a sufficient level of experience, neither the foveation error nor the misalignment between the visual and auditory maps of space in the OT changed significantly with ςd [Fig. 12, (e) and (f)]. As usual, the values illustrated in the figure are averages of data obtained by testing the system with auditory stimuli in 30 different locations in ±60°, with 10 repetitions for each location. These data were collected with a series of simulations in which ςd was changed in a system composed of 100 × 50 units in the ICc and 60 units in all of the other maps. Given the number of ICx units present in these simulations, with ςd larger than 25, all of the ICx units received a significant amount of projections from all locations in the ICc. It is interesting to compare these results with those obtained from a system not previously exposed to sensorimotor experience. Figure 12, (c) and (d), shows how the accuracy of saccades toward auditory stimuli and the alignment of the RFs of the units in the OTchanged with the scatter of projections for an untrained system. As illustrated in Figure 12(c), when the value of ςd was increased from 10 to 40, the magnitude of the mean foveation error changed from 10.5 ± 14.4° to 45.7 ± 62.8°, dramatically affecting the behavior of the system. The relative alignment of auditory and visual RFs ofOT units changed in parallel with foveation performance and varied between 6.5 ± 12.5° and 40.3 ± 79.7°, as illustrated in Figure 12(d).
The tolerance of the system to noise during learning was studied in a series of simulations in which a noise term was linearly superimposed on Equation 14. This noise term can be the result of a number of factors affecting different aspects of the system. In particular, in the context of the proposed hypothesis of value-dependent learning, noise could be represented by the activation of value systems attributable to events unrelated to the process of auditory localization. Figure 12, (g) and (h), shows both the foveation error and the misalignment between auditory and visual RFs of OT units, after the exposure to 10,000 stimuli in the presence of noise. Because the parameters in Equation 14were adjusted to produce a unitary input dynamic range, a noise amplitude equal to 0.5 indicates that the noise accounted for half of the input signal. Even though an increase can be observed in the mean foveation error and its SD, the system developed good orienting capabilities in the presence of a high level of noise.
The rule controlling the synaptic modifications (Eq. 14) was modified in several ways. The development of synaptic strengths and the performance of the model were comparable whether the interaction between the pre- and postsynaptic components in Equation 14 was additive or multiplicative. Similar patterns of synaptic strengths were produced in the two cases in comparable training times. The results were dramatically different, however, when the value signal was removed (i.e., ε3 was set to zero in Eq. 14), such that the changes in synaptic strength were caused purely by pre- and postsynaptic components, as expressed by the local synaptic term in Equation 14 (Fig. 13). In these simulations, the two thresholds of the learning function ΦL were adjusted to fall in the dynamic range of Ep. As an immediate consequence of the removal of the global term related to the value of behavioral events, the system did not adapt to shifts of the visual inputs (Fig. 13). This is attributable to the fact that both the ICc and the ICx are purely auditory centers, and the activation of units in these areas is unaffected by visual alterations. Nevertheless, the performance of the system improved to some degree in the direction of normal development on the basis of the mere correlation among activations of the ICcand the ICx units, and some organization emerged in the patterns of synaptic strengths. As shown by Figure 13, after 40,000 iterations the mean of the absolute value of the foveation error was 21.89 ± 7.24°, and the mean misalignment of the RFs was 22.38 ± 3.69°. Even in the case of normal development, however, the system did not reach the performance usually achieved in the presence of the value signal (Fig. 7).

Effect of removal of the value signal on system performance and RF alignment after execution of 40,000 saccades toward audiovisual stimuli with the visual field translated by 20°. The multiplicative term ε2 in Equation 14 was set to zero in a system composed of 320 × 100 units in the ICc and of 100 units in all of the other maps, so that the changes in the synaptic strengths occurred only on the basis of the pre- and postsynaptic components. (a), (b), Patterns of synaptic strengths of the connections among ICx units u35, u65 and ICc units after sensorimotor experience. (c), Mean values of the magnitude of the foveation error for saccades toward auditory stimuli at different azimuth positions in space. (d), Relative alignment of visual and auditory receptive fields for OTunits. Note that this local refinement of synaptic connections was always in the direction of normal development and did not account for the plasticity observed with altered visual conditions, such as a shift of the visual field produced by prismatic goggles (compare Fig.8).
The number of iterations required for developing a good alignment between the auditory and visual maps of space in the OT was a function of several parameters. In particular, it varied significantly with the values of the parameters associated with learning (Eq. 14 and the linear approximation of ΦL). In some simulations, a good alignment between auditory and visual RFs in the OT cells could be achieved in just 1000 iterations.
DISCUSSION
How might neural maps of space based on different modalities establish and maintain a precise registration? This problem was addressed in this paper through a model inspired by a well studied experimental example, the alignment between auditory and visual maps of space in the OT of the barn owl. Computer simulations replicating neural structures involved in azimuth localization in the owl showed that this alignment can be achieved through a process of value-dependent learning (Friston et al., 1994). In this process, synaptic changes in and between neural maps depend on the levels of pre- and postsynaptic activity, as well as on the release of neuromodulators by diffuse ascending systems activated by the occurrence of salient behavioral events. The results of these simulations closely replicate the physiological and behavioral data described in the literature. The model accounts for the development of a spatial registration between auditory and visual maps in the OT of the barn owl during normal visual experience, after the retinal image was shifted through prismatic goggles, and after the reestablishment of normal visual input. As illustrated in Results, systematic changes of several parameters indicated that the model is robust across a wide range of biologically plausible values.
Assumptions and predictions of the model
The central assumption of the model is that the registration of neural maps of space in the OT of the barn owl occurs through a process of value-dependent learning. According to this paradigm, value systems, identifiable with neuromodulatory systems with diffuse projections, respond to innate or acquired salient cues and broadcast their response to wide areas of the brain where they release substances that can modulate changes in synaptic efficacy. Specifically, the model assumes that neuromodulators, such as monoamines or acetylcholine, are released diffusely in the ICx by ascending systems that are phasically activated by salient behavioral events. Although little is known about the anatomical and physiological characteristics of monoaminergic and cholinergic systems in the barn owl, the colliculi receive abundant innervation from these systems in most species studied (Edwards et al., 1979; Thompson et al., 1994). It is also well established that the activity of such systems is triggered by salient environmental events (Foote and Morrison, 1987; Aston-Jones et al., 1991; Marrocco et al., 1994; Robbins and Everitt, 1995). In our model, it was assumed that salient events were the occurrence of successful foveations and the execution of motor behavior, although other sources of saliency could lead to similar results. For instance, map registration could be achieved without overt orienting behavior if a shift in the focus of attention toward the target were sufficient to activate value systems.
According to value-dependent learning, synaptic changes depend on the interactions between a pre- and a postsynaptic component reflecting local neural activity and a global neuromodulatory term reflecting the activity of value systems. In these simulations, consistent with several computational learning rules (Bear et al., 1987; Gluck and Granger, 1993), both depression and potentiation occurred at the same synapse. For the model, the precise form of the rule for synaptic modification, such as the additive or multiplicative interaction of pre- and postsynaptic components, was not important. The presence of the modulatory term, however, was an essential factor in allowing the adaptation to altered visual conditions and in improving the convergence of the model’s behavior. This is in line with several experimental results demonstrating major influence of neuromodulators, such as acetylcholine, noradrenaline, serotonin, and dopamine on synaptic plasticity (Kasamatsu et al., 1979; McGaugh, 1989; Artola and Singer, 1993; Bear and Kirkwood, 1993; Gu and Singer, 1993, 1995). The changes in synaptic efficacy occurring in the model could correspond to changes in synaptic strength or changes in the number and distribution of synapses or both.
Assuming that value systems are activated by foveations on the target, a crucial assumption of the model is that a trace of the auditory activity pattern that led to orienting behavior must persist until the neuromodulatory signal can exert its action, presumably for an interval of a few hundred milliseconds. The three events that are needed for inducing potentiation of active synapses in the ICx, i.e., auditory stimulus, head movement, and foveation, do not occur at the same time. First, there is activity in the ICx corresponding to the location of a sound source. This is followed by a motor response, and finally, if the alignment is correct the image of the sound source appears at the fovea. In the model, an activity trace was still present inICx and ICc units when foveation occurred, because of the slow decay of activation. In the barn owl, such a persistent activity trace could be implemented through several biological mechanisms. In particular, in those subdivisions of the IC in which experience-dependent synaptic plasticity seems to occur, it has been shown that NMDA receptors are present and functional (Feldman and Knudsen, 1994). NMDA receptor currents generally have slow rise and decay times (MacDermott and Dale, 1987; Forsythe and Westbrook, 1988); in some instances, the decay can be as much as 20 times slower than for non-NMDA receptor currents (Hestrin et al., 1990). The activation of NMDA receptors seems to be necessary for several forms of activity-dependent plasticity (Cline et al., 1987; Bear et al., 1990;Schmidt, 1990; Hahm et al., 1991), although it is unlikely that they provide the sole trigger necessary for induction of synaptic modification in the ICx (Feldman and Knudsen, 1994). According to the present model, synaptic plasticity requires the activation of value systems, whereas the activation of NMDA receptor currents could implement the required memory trace.
Although direct tests of the hypothesis that the activation of neuromodulatory systems is necessary for the alignment of visual and auditory maps in the barn owl have not been performed, a large body of evidence indicates that the activation of these systems is important for the occurrence of plastic phenomena during development, in the adult, and in several experimental preparations. For instance, monoaminergic neuromodulators influence the induction of LTP both in slices of the hippocampus and of the cortex (see references in Artola and Singer, 1993; Brown et al., 1995). In vivo studies (Metherate and Ashe, 1991; Schultz, 1992; Weinberger et al., 1994) have led to the conclusion that sufficient levels of certain neuromodulators are needed for physiological and behavioral plasticity to occur in the adult animal. Several lines of evidence, summarized in McGaugh (1989), show that pharmacological agents interfering with their action may impair learning and memory. Cholinergic (Bear and Kirkwood, 1993; Gu and Singer, 1993), noradrenergic (Kasamatsu et al., 1979; Shirokawa and Kasamatsu, 1986; Bear and Kirkwood, 1993), and serotoninergic (Gu and Singer, 1995) systems are essential for developmental plasticity, e.g., for ocular dominance formation. The importance of neuromodulation has also been demonstrated for plastic phenomena occurring in the brainstem, such as the adaptation of the vestibulo-ocular reflex (Pompeiano, 1994). In line with these experimental findings, the results of the present simulations lead to the prediction that lesions of one or more of these systems could seriously impair the plasticity of the alignment between visual and auditory maps.
A few other aspects of the model deserve mention. In the simulations, a sufficient amount of spontaneous activity, which was modeled as noise in the activation of the units, was required for orienting behavior to become accurate. Given the initial broad tuning of ICx units to values of ITD, the influence of spontaneous activity on behavior was high during the first phase of sensorimotor experience. With experience, specific ITD values became strongly associated with the appropriate saccadic movements, producing a progressive refinement of connection patterns and sensitivities of ICx units. As a result, the accuracy of saccadic movements increased, and the influence of spontaneous activity decreased. When visual inputs were systematically shifted, however, repeated failures in localizing the target weakened the previously established connections patterns, and the contribution to behavior of spontaneous activity increased again. In this way, new patterns of connections were selected until orienting behavior became accurate. This process represents a self-regulating adjustment of the relative influence of variation (spontaneous activity) and selection (consolidation of synaptic patterns). These observations suggest that there may be a link between levels of spontaneous activity and the occurrence of critical periods in the capability of adapting to prisms in the barn owl (Knudsen and Knudsen, 1989a).
In the model, auditory orienting responses are controlled exclusively by the ICx; however, the results obtained do not assume or require that the ICx is the sole structure controlling these responses, provided that other pathways involved can undergo plastic changes as well. It has been shown recently that the archistriatum is also able to control such responses (Knudsen et al., 1993). Microstimulations of the archistriatal gaze field elicit head movements, and neurons in this area are characterized by spatially localized receptive fields similar to those of neurons in the ICx (Knudsen et al., 1995; Cohen and Knudsen, 1995). Furthermore, projections from the archistriatum to midline brainstem tegmental nuclei, to the ICx, and to the deep layers of the OT have been discovered. Given the widespread forebrain innervation by diffuse ascending systems, important experimental questions include whether plastic changes can also occur in the pathway through the archistriatum and whether they can be controlled in parallel through value-dependent learning to ensure the coordinated registration of multiple maps.
In the model, when the auditory input is shifted with respect to the visuomotor registration, the auditory space map in the ICx shifts accordingly under the influence of value-dependent learning. In other instances, e.g., motor disturbances attributable to asymmetric motor loss or inhomogeneities in saccade amplitude attributable to abnormal visual input, the visuomotor registration itself may be altered. Simulations of owls raised with prismatic goggles covering only the central portion of the visual field suggest that the same mechanisms of value-dependent learning can lead to plastic changes in visuomotor registration downstream of the ICx, a prediction that could be addressed experimentally.
Value-dependent learning and the problem of map registration
Some attempts have been made to model plastic changes in the registration between auditory and visual maps in the barn owl (Gelfand and Pearson, 1988; Rosen et al., 1994). Gelfand and Pearson (1988)suggested that this registration is achieved through Hebbian learning in the OT; however, given the demonstration that the site of plasticity is the ICx, their model does not seem to be directly applicable. In addition, the present simulations indicate that pure Hebbian learning in the ICx is not sufficient to account for the plasticity observed after the visual input is shifted, if neural activity contains no information about the performance of the network or the correspondence of auditory and visual space. According to a study by Rosen et al. (1994), many of the experimental results can be reproduced using a modified version of the back-propagation algorithm (Rumelhart et al., 1986). Although this confirms that map registration is a problem that could in principle be solved in many different ways in different structures [for an example based on Hebbian learning; see Salinas and Abbott (1995)], it is generally admitted that back-propagation algorithms are not biologically plausible (Crick, 1989). By contrast, the proposal that map registration in the tectum of the barn owl occurs through value-dependent learning does not require biologically unrealistic computations. In addition, such a proposal eliminates the need to postulate structures that explicitly evaluate direction and magnitude of the orientation error and unknown anatomical pathways that would broadcast these error signals to the site of plasticity. In this respect, value-dependent learning is similar to the reinforcement learning paradigm, where the system constructs input–output associations under the influence of a global scalar reinforcement signal (Barto et al., 1983).
Because salient events can activate neuromodulatory systems through different modalities, the proposed learning strategy is also highly flexible. For instance, assuming that value systems are also activated by auditory inputs located in front of the animal, value-dependent learning can lead to behavioral adaptation independently of vision. This may play a role when visual information is not available. Studies with blind-reared barn owls have shown that the brain is capable of generating an auditory map of space without the aid of vision, although the map is less topographically precise (Knudsen et al., 1991). In particular, the present learning paradigm may explain the plasticity demonstrated by blind-reared barn owls chronically exposed to auditory distortions (Knudsen and Mogdans, 1992).
Finally, given the diffuse transmission of a global signal, value-dependent learning represents a learning paradigm that has widespread applicability. Diffuse ascending systems innervate most brain areas and are thereby able to influence simultaneously synaptic plasticity in many different maps. It is conceivable that such a mechanism can account for both the development of parallel maps in different regions of the brain (e.g., maps of space in the colliculus as well as in the cortex) and the registration between distant maps, even if these maps are organized according to different neighborhood relationships.
The problem of maintaining multimodal maps of space in register is encountered in many different species and in several brain structures (King et al., 1988; Duhamel et al., 1991; King and Moore, 1991; Fogassi et al., 1992; Graziano and Gross, 1992, 1993, 1995;Benedetti and Ferro, 1995). As more data are gathered, it may become evident that similar principles apply to the registration among many other maps in the brain, including maps that are not directly related to sensory input or motor output. Although the specific mechanisms and structures involved in each case may vary, the present analysis indicates that value-dependent learning can provide a general, flexible, and parsimonious strategy for establishing and maintaining the registration of brain maps in the face of variable phenotypic and behavioral conditions.
Ranges of values of the model parameters used in the simulations
APPENDIX
Footnotes
This work was carried out as part of the theoretical neurobiology program at The Neurosciences Institute, which is supported by the Neurosciences Research Foundation. The Foundation receives support for this program from the van Ameringen Foundation and Sandoz Pharmaceutical Corporation. We thank Dr. Eric I. Knudsen and the Fellows of the Neurosciences Institute for useful discussions.
Correspondence should be addressed to Dr. Michele Rucci, The Neurosciences Institute, 10640 John Jay Hopkins Drive, San Diego, CA 92121.


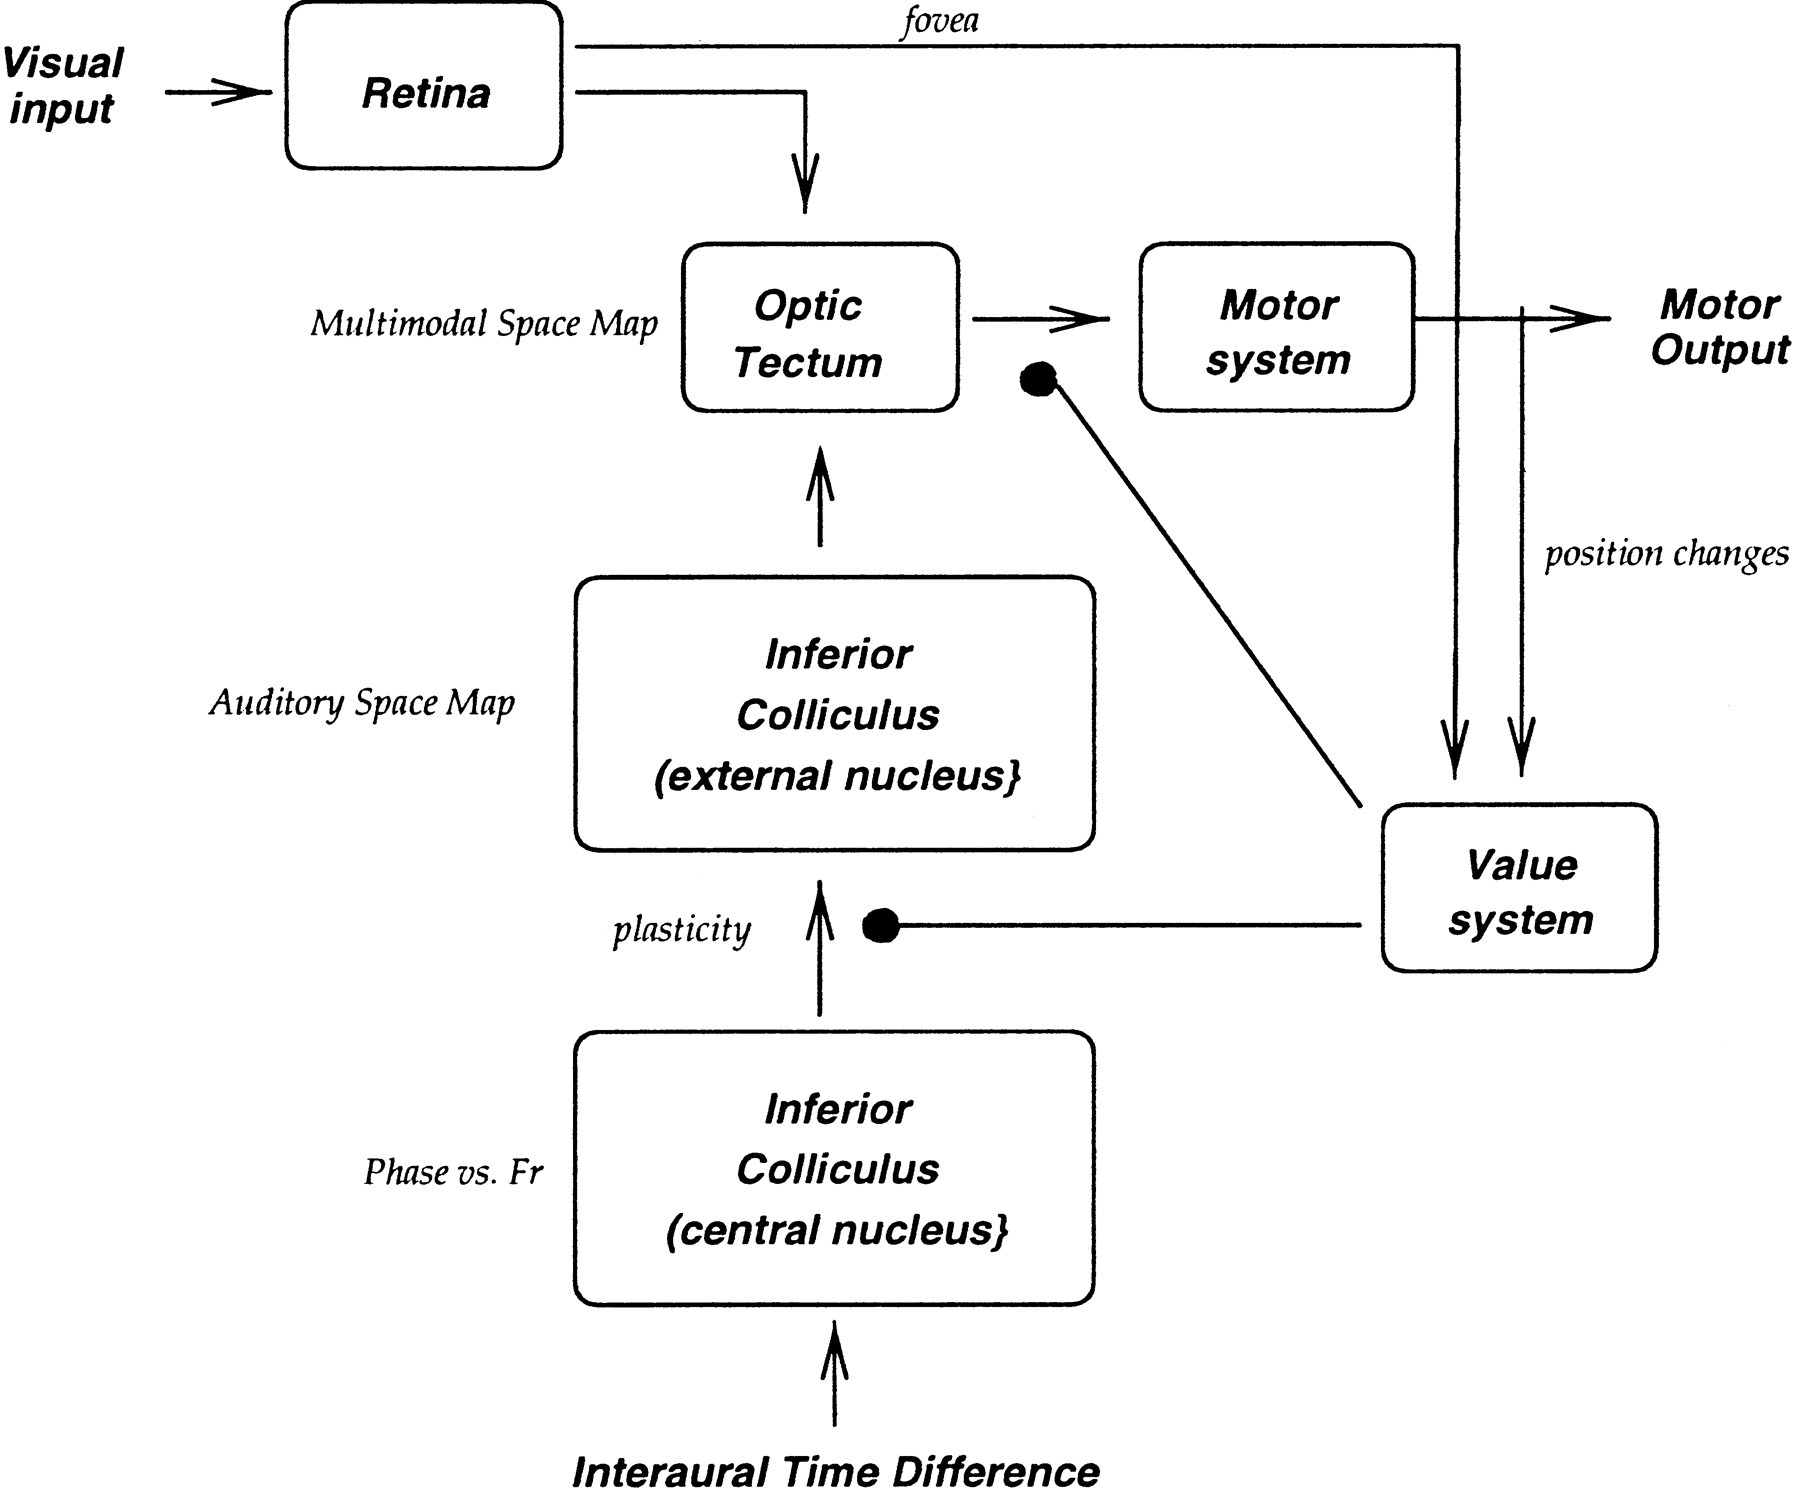